Embed Size (px)
Citation preview

Building a functional annotation of the equine genome
Jessica L Petersen, CJ Finno, RR Bellone, EN Burns, NB Kingsley, S Peng, T Kalbfleisch,
JN MacLeod, C Creppe, DC Miller, CG Danko, DF Antczak
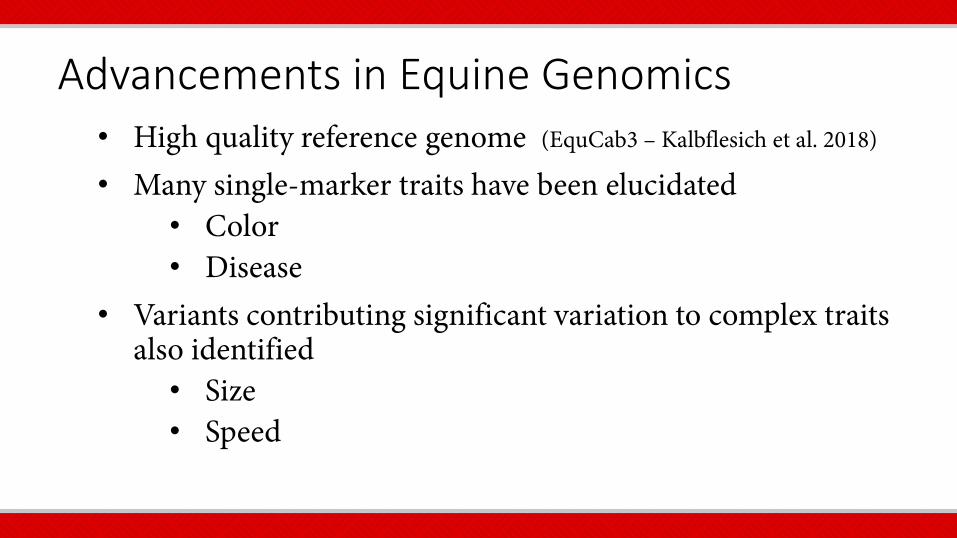
Advancements in Equine Genomics • High quality reference genome (EquCab3 – Kalbflesich et al. 2018)
• Many single-marker traits have been elucidated • Color • Disease
• Variants contributing significant variation to complex traits also identified • Size • Speed

The Story of Speed in the Thoroughbred • An intronic SNP in the gene myostatin associated with
best racing distance (Hill et al. 2010)
• Fast adoption and continued use of the genetic test for this marker by racehorse breeders/trainers
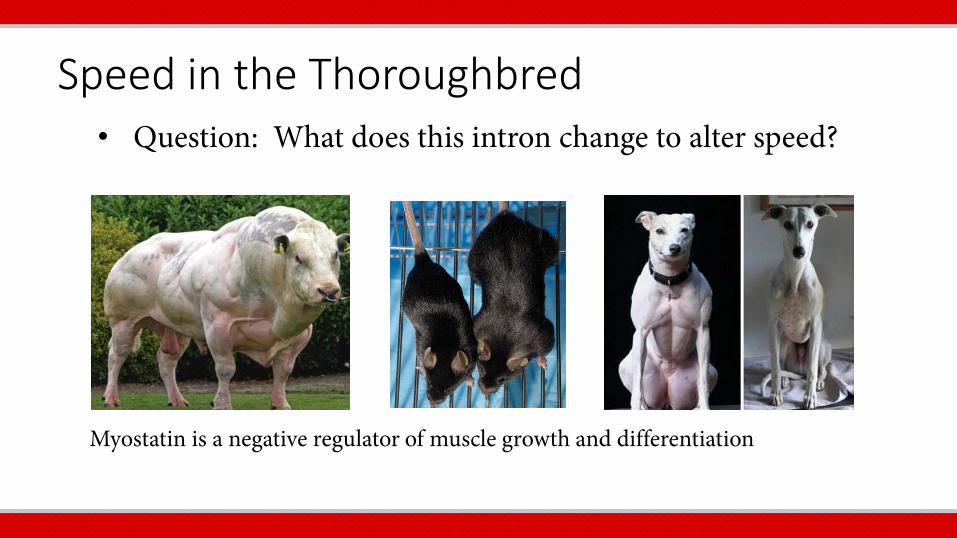
Speed in the Thoroughbred • Question: What does this intron change to alter speed?
Myostatin is a negative regulator of muscle growth and differentiation

Association with Fiber Type • Horses with the “short distance” SNP have more fast-
twitch muscle fibers • That association doesn’t hold true across breeds
Petersen et al. 2014 Anim Genet Thoroughbred Belgian
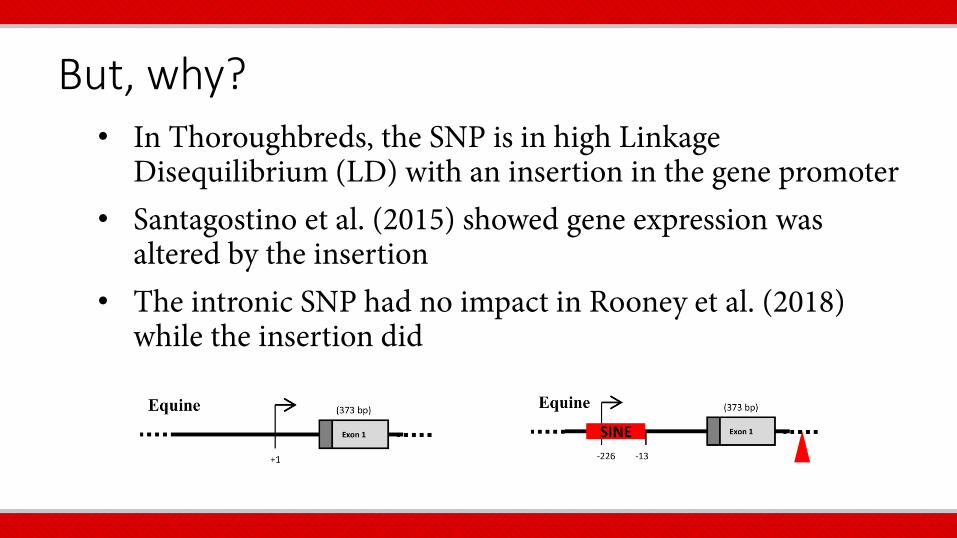
But, why? • In Thoroughbreds, the SNP is in high Linkage
Disequilibrium (LD) with an insertion in the gene promoter • Santagostino et al. (2015) showed gene expression was
altered by the insertion • The intronic SNP had no impact in Rooney et al. (2018)
while the insertion did

Importance of Linkage Disequilibrium
• The “speed gene” test IS predictive in Thoroughbreds • In other breeds, the SNP is not always predictive of the
insertion the test does not hold true • LD in Thoroughbred (r2) = 0.93 • LD in Quarter Horse (r2) = 0.41 • LD in many other breeds (r2) = 0
Petersen et al. 2014
Anim Genet

Genomic Prediction and Linkage Disequilibrium
• Genomic prediction relies on linkage disequilibrium, the ability of a single marker to explain variation in the region
Chromosome SNP Markers
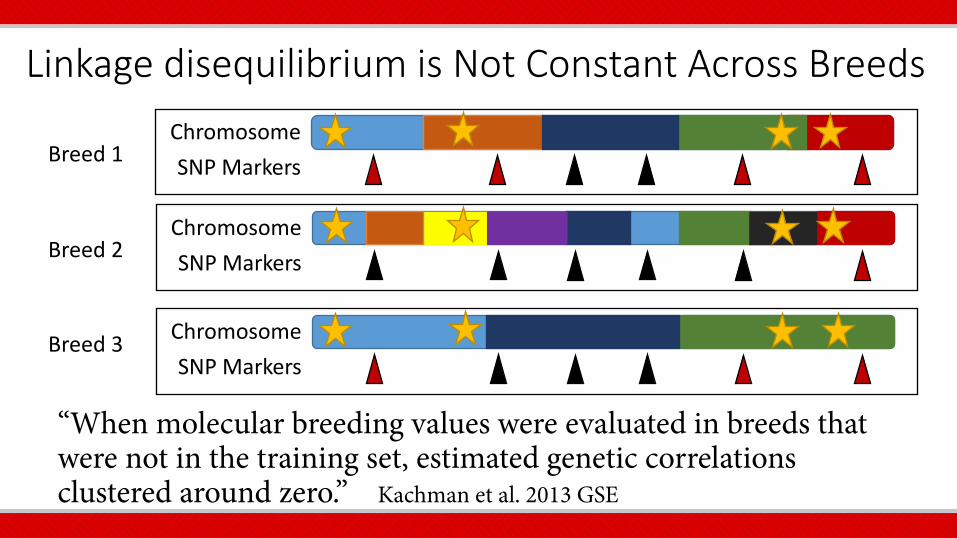
Linkage disequilibrium is Not Constant Across Breeds
“When molecular breeding values were evaluated in breeds that were not in the training set, estimated genetic correlations clustered around zero.” Kachman et al. 2013 GSE
Chromosome SNP Markers Breed 1
Chromosome SNP Markers Breed 2
Chromosome SNP Markers
Breed 3

Understanding Functional Variation is Key
Chromosome SNP Markers

Take Home Message from the Speed Gene Story 1. Important phenotypes can be attributed to changes in
gene regulation 2. Genomic variation alters mechanisms of genome
regulation 3. Relationships among genomic variants (and their
consequence) is not always consistent from one population to the next
*If we can assay the true functional variant(s), we do a better job predicting phenotype*

The Challenge • Most important traits
are complex • Interaction of many
loci and the environment
• Identification of variants associated with these traits has been relatively unproductive
Lassiter et al. 2019 Front Physiol

Complex Disease Traits in the Horse • Atrial fibrillation • Body size • Bone fracture • Brachygnathia • Chronic progressive
lymphedema • Common variable
immunodeficiency • Corneal stromal loss • Cribbing • Cryptorchidism
• Degenerative joint disease
• Guttural pouch tympany • Insect bite
hypersensitivity • Recurrent laryngeal
neuropathy • Metabolic syndrome • Myofibrillar myopathy • Navicular disease • Neuroaxonal dystrophy • Osteochondrosis
• Polysaccharide storage myopathy (II)
• Recurrent airway obstruction
• Recurrent exertional rhabdomyolysis
• Recurrent uveitis • Sarcoid • Shivers • Squamous cell carcinoma • Swayback

What Are We Missing? • Nearly 90% of QTL are in non-coding regions (Hindorff et al. 2009
PNAS) • ~21,000 protein coding genes • 450,000+ regulatory elements (Birney et al. 2007 Nature)
• How the genome is being regulated depends on sex, age, activity, health status, environment and varies from tissue to tissue

Genome Regulation = on/off Switches
OFF

Goal: Build a reference annotation of genome regulation in the horse
• Healthy, adult Thoroughbred mares • Careful, comprehensive phenotype collection

Equine FAANG Project (2016-current) • Biobank of 86 tissues, 2 cell lines, 5 fluids from each mare
(Burns et al. 2018 Anim Genet)
• Whole-genome sequence (30X) • RNA-sequence of 50* tissues
(*42 funded by the “Adopt-A-Tissue” program) • Poly-A • smRNA
• Data available at: https://www.ebi.ac.uk/ena/data/view/PRJEB26787

http://server1.intrepidbio.com/FeatureBrowser/customlist/record?listid=7919259427

Equine Community Effort • Over $60,000 from individual labs for RNA-seq
• Characterize keratinocytes
• RRBS
• Centromere Mapping
• Cell culture
• Karyotyping
• Characterize microbiome

Assays of Genome Regulation – Histone Modification
• Nine prioritized tissues
Laminae Liver Lung Ovary Adipose Cerebral cortex Heart (left ventricle) Spleen Longissimus dorsi (skeletal muscle)

Histone Modifications
Figures: National Institutes of Health via Wikimedia
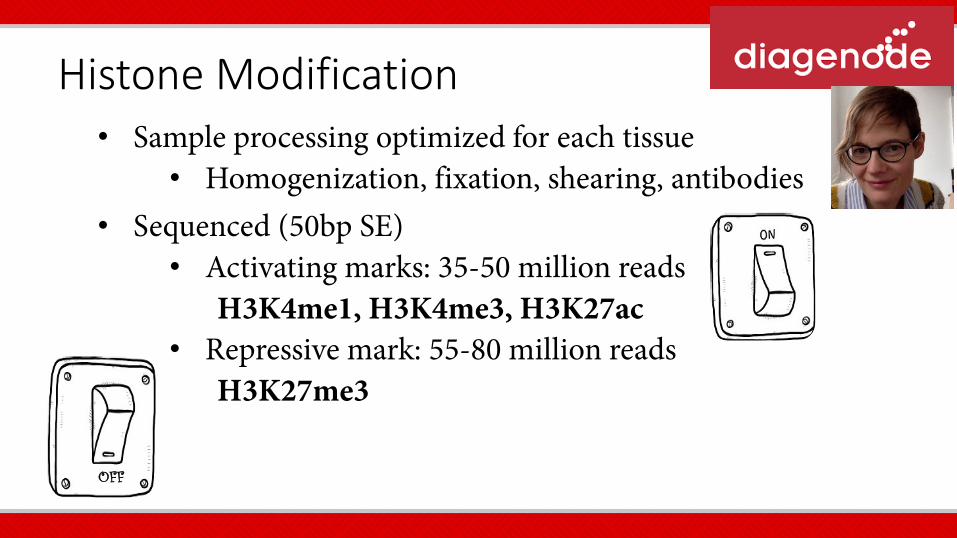
Histone Modification • Sample processing optimized for each tissue
• Homogenization, fixation, shearing, antibodies • Sequenced (50bp SE)
• Activating marks: 35-50 million reads H3K4me1, H3K4me3, H3K27ac
• Repressive mark: 55-80 million reads H3K27me3
OFF

Example of Sequence Analysis
Beta Actin – Commonly expressed gene
RNA-seq
H3K4me1
H3K4me3
H3K27ac
H3K27me3
Gene Model

Example of Outcome
Beta Actin – Commonly expressed gene
RNA-seq
H3K4me1
H3K4me3
H3K27ac
H3K27me3
Gene Model

Example of Outcome
Beta Actin – Commonly expressed gene
RNA-seq
H3K4me1
H3K4me3
H3K27ac
H3K27me3
Gene Model

Example of Outcome
Beta Actin – Commonly expressed gene
RNA-seq
H3K4me1
H3K4me3
H3K27ac
H3K27me3
Gene Model

Example of Outcome
Beta Actin – Commonly expressed gene
RNA-seq
H3K4me1
H3K4me3
H3K27ac
H3K27me3
Gene Model
OFF
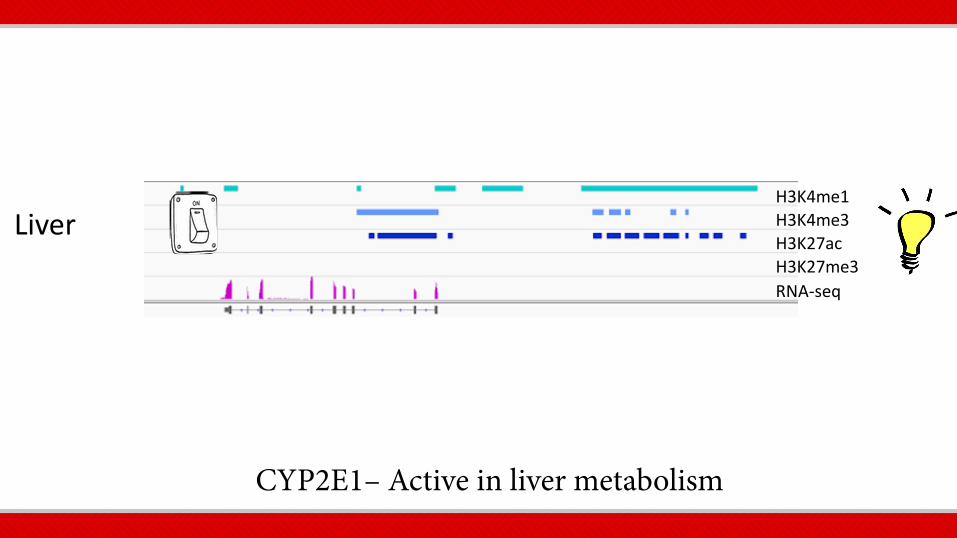
CYP2E1– Active in liver metabolism
Liver
RNA-seq
H3K4me1 H3K4me3 H3K27ac H3K27me3

CYP2E1– Active in liver metabolism
Liver
Adipose
RNA-seq
H3K4me1 H3K4me3 H3K27ac H3K27me3
RNA-seq
H3K4me1 H3K4me3 H3K27ac H3K27me3
OFF

CYP2E1– Active in liver metabolism
Liver
Adipose
Skeletal Muscle
RNA-seq
H3K4me1 H3K4me3 H3K27ac H3K27me3
RNA-seq
H3K4me1 H3K4me3 H3K27ac H3K27me3
RNA-seq
H3K4me1 H3K4me3 H3K27ac H3K27me3
OFF
OFF
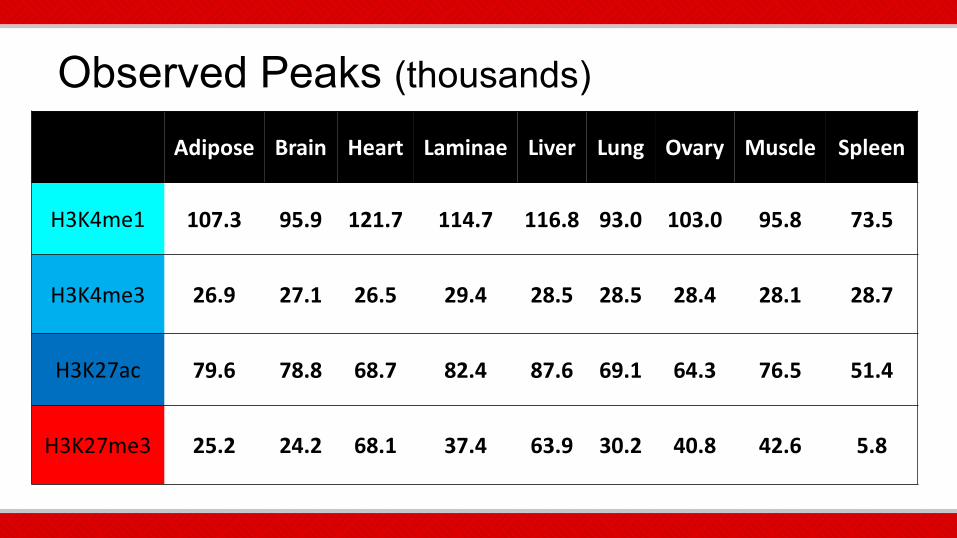
Observed Peaks (thousands)
Adipose Brain Heart Laminae Liver Lung Ovary Muscle Spleen
H3K4me1 107.3 95.9 121.7 114.7 116.8 93.0 103.0 95.8 73.5
H3K4me3 26.9 27.1 26.5 29.4 28.5 28.5 28.4 28.1 28.7
H3K27ac 79.6 78.8 68.7 82.4 87.6 69.1 64.3 76.5 51.4
H3K27me3 25.2 24.2 68.1 37.4 63.9 30.2 40.8 42.6 5.8

Proportion of Genome Covered Mark Percent
(across 9 tissues)
H3K4me1 2.8 – 5.1
H3K4me3 1.4 – 1.7
H3K27ac 1.8 – 3.3
H3K27me3 0.6 – 1.3

Tissue-specific Elements
Tissues Elements
Adipose Brain Heart Lamina Liver Lung Muscle Ovary Total
Active enhancers
9,584 12,151 8,250 16,668 17,203 3,450 10,385 9,454 87,145
Active promoters
1,584 3,043 1,479 2,735 4,488 1,341 2,760 1,854 19,284

Application – Understanding Genome Function • Not all transcripts are defined
• Human genome – 202,762 transcripts annotated • Horse – 56,546 (up from 29,196 in prior genome) • Cattle – 43,947 • Pig – 49,448
• FAANG is helping to characterize regions of genome transcription on a tissue-specific basis AND associate gene transcription with regulatory elements

Assay for Open Chromatin • ATAC-Seq
Image: https://www.activemotif.com/catalog/1233/atac-seq-service

Methods: Fresh vs Frozen Samples ATAC-seq
• Standard protocol – isolate cell nuclei immediately after harvest
• Completed trials isolating nuclei from frozen tissue

ATAC-seq with Fresh vs Frozen Tissue (Liver)
Frozen Fresh # of Peaks 70,375 74,399
Ave width (bp) 651 599 RiP 10,597,576 11,182,311
FRiP 25.14% 31.84%
Fresh
Frozen
Genomic Coverage
Peak similarity (Chikina and Troyanskaya 2012)
0.726
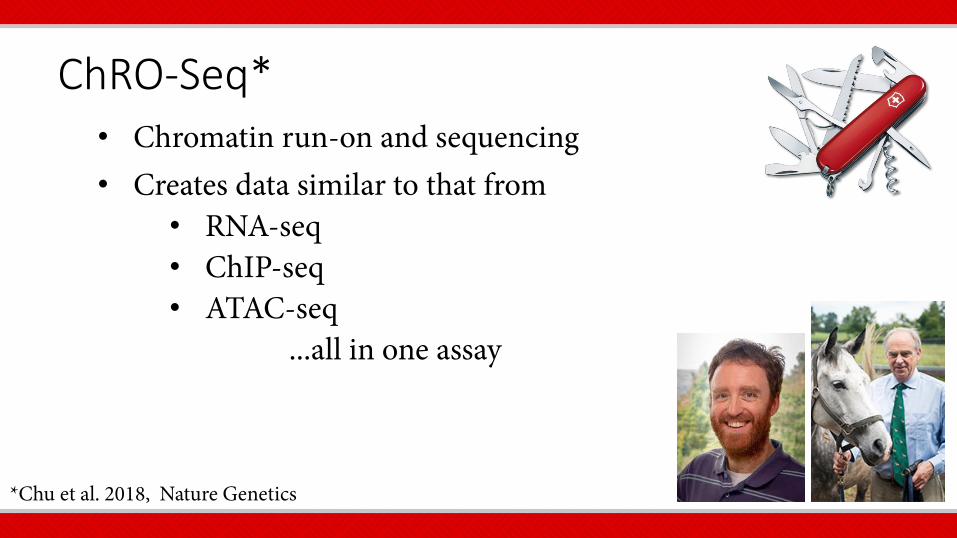
ChRO-Seq* • Chromatin run-on and sequencing • Creates data similar to that from
• RNA-seq • ChIP-seq • ATAC-seq
...all in one assay
*Chu et al. 2018, Nature Genetics
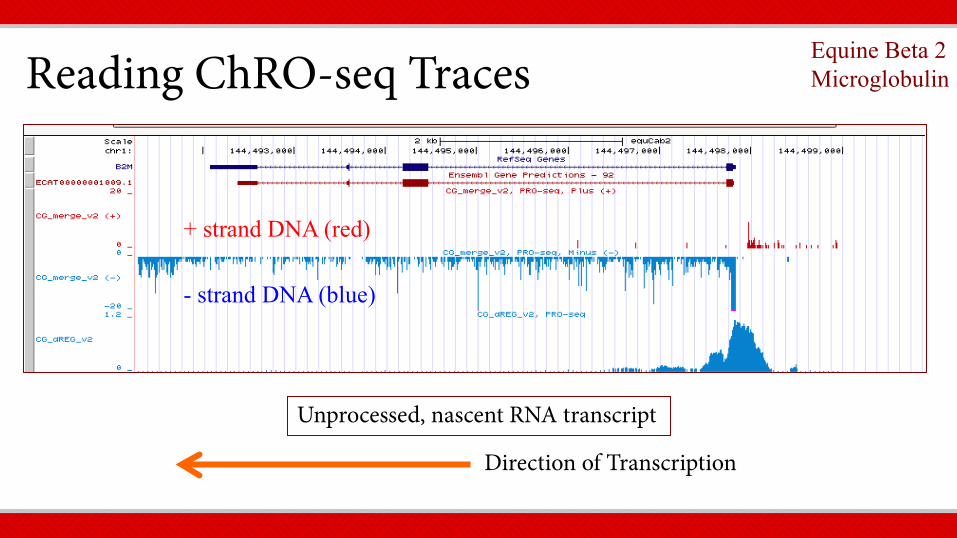
Reading ChRO-seq Traces
Direction of Transcription
+ strand DNA (red)
- strand DNA (blue)
Unprocessed, nascent RNA transcript
Equine Beta 2 Microglobulin

dREG = Detection of Regulatory Elements Machine Learning Imputation, Danko lab
+ strand DNA (red)
- strand DNA (blue)
dREG track
Direction of Transcription
Reading ChRO-seq Traces Equine Beta 2 Microglobulin
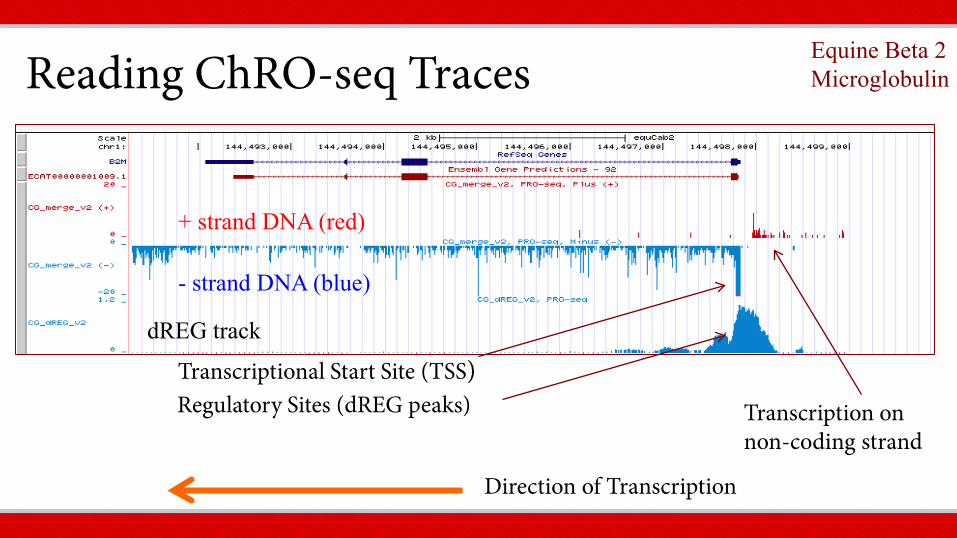
Regulatory Sites (dREG peaks) Transcriptional Start Site (TSS)
Transcription on non-coding strand
+ strand DNA (red)
- strand DNA (blue)
dREG track
Direction of Transcription
Reading ChRO-seq Traces Equine Beta 2 Microglobulin

Putative Enhancers dREG peaks differ between tissues
+ strand DNA (red)
- strand DNA (blue)
dREG track placenta
dREG CD4+ T-cells
dREG Liver
Reading ChRO-seq Traces Equine Beta 2 Microglobulin
ChRO-seq ATAC-seq ChIP-seq
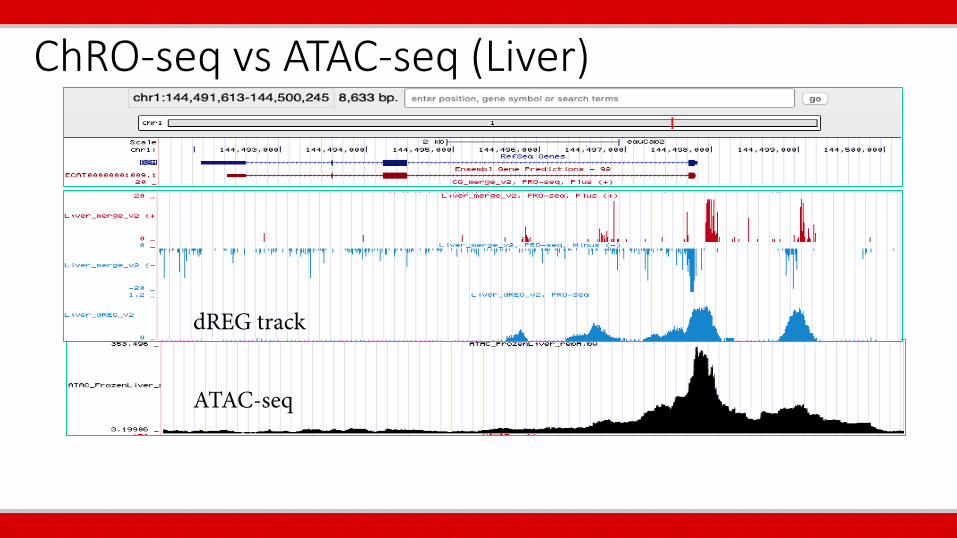
ChRO-seq vs ATAC-seq (Liver)
dREG track
ATAC-seq

What is Next? • Stallions • Developmental stages • Across-breed studies • Across-species analyses • New techniques?

What Does FANNG Mean for Agriculture? • New baseline for comparison of genome function in
disease/treatments • Personalized Management • Improved genomic prediction • Application to ET, ICSI, cloning?

What Does This Mean for Agriculture? • Application to ET, ICSI, cloning?
Fairburn et al. 2002 Curr Biol

Acknowledgements
• Tissue “Adopters” • Zhou and Ross labs, UC Davis


![Long-Read Annotation: Automated Eukaryotic Genome · Breakthrough Technologies Long-Read Annotation: Automated Eukaryotic Genome Annotation Based on Long-Read cDNA Sequencing1[OPEN]](https://img.pdfslide.net/doc/110x75/5fc17da202de2311b330ac06/long-read-annotation-automated-eukaryotic-breakthrough-technologies-long-read-annotation.jpg)