Embed Size (px)
Citation preview
Building a Real-Time Geo-Targeted EventObservation (Geo) Viewer for DisasterManagement and Situation Awareness
Ming-Hsiang Tsou, Chin-Te Jung, Christopher Allen, Jiue-An Yang,Su Yeon Han, Brian H. Spitzberg and Jessica Dozier
Abstract Situation awareness plays an important role in disaster response andemergency management. Displaying real-time location-based social media mes-sages along with videos, pictures, and hashtags during a disaster event could helpfirst responders improve their situation awareness. A geo-targeted event observation(Geo) Viewer was developed for monitoring real-time social media messages intarget areas with four major functions: (1) real-time display of geo-tagged tweetswithin the target area; (2) interactive mapping functions; (3) spatial, text, andtemporal search functions using keywords, spatial boundaries, or dates; and(4) manual labeling and text-tagging of messages. Different from traditional webGIS maps, the user interface design of GeoViewer provides the interactive displayof multimedia content and maps. The front-end user interface to visualize and querytweets is built with open source programming libraries using server-side MongoDB.
M.-H. Tsou (✉) ⋅ C. Allen ⋅ J.-A. Yang ⋅ S.Y. Han ⋅ J. DozierDepartment of Geography, The Center for Human Dynamics in the Mobile Age,San Diego State University, San Diego, CA, USAe-mail: [email protected]
C. Allene-mail: [email protected]
J.-A. Yange-mail: [email protected]
S.Y. Hane-mail: [email protected]
J. Doziere-mail: [email protected]
C.-T. JungEsri (Beijing) R & D Center, Beijing, Chinae-mail: [email protected]
B.H. SpitzbergSchool of Communication, San Diego State University, San Diego, CA, USAe-mail: [email protected]
© Springer International Publishing AG 2017M.P. Peterson (ed.), Advances in Cartography and GIScience, Lecture Notesin Geoinformation and Cartography, DOI 10.1007/978-3-319-57336-6_7
85
GeoViewer is built for assisting emergency responses and disaster managementtasks by tracking disaster event impacts, recovery activities, and residents’ needs inthe target region.
Keywords Social media ⋅ Web maps ⋅ Disaster management ⋅ Situationawareness ⋅ Geovisualization ⋅ Open source
1 Introduction
Situation awareness involves short-term, immediately responsive human behaviorsby acquiring geospatial information in the field to facilitate operational and tacticaldecision-making. Situation awareness can help decision makers identify keyenvironmental elements and their meanings within a volume of time and space(Endsley 1995). Situation awareness plays an important role in disaster response,recovery and emergency management for first responders and emergency responseproviders (Tsou and Sun 2007; Wang et al. 2016). For example, a firefighter canview a map showing nearby wildfire perimeters and decide to create a backfire planin order to control the spread of wildfires (immediate operational plan). A policechief can identify the locations of evacuation shelters after a major earthquake anddispatch police officers to evacuation shelters (short-term tactical plan).
There are a number of good examples of using social media for emergencymanagement, including the 2010 Haiti Earthquake (Veil et al. 2011), 2012 WaldoCanyon Fire (Sutton et al. 2014), 2013 Typhoon Haiyn in the Philippines(Humanity Road and Statistics Without Borders 2014), Hurricane Sandy (Guan andChen 2014), and the 2014 Ebola outbreaks in West Africa (Moore and Verity2014). Disaster-relevant social media has been used to analyze how individuals ordecision-makers enhance their situational awareness (Vieweg et al. 2010; deAlbuquerque et al. 2015; Huang and Xiao 2015).
Previous studies have indicated the need of developing an integrated,user-friendly web application to collect and display relevant location-based socialmedia messages in real-time. Many relief efforts during disastrous events will needto provide aid promptly to target areas. However, there are usually a significantdelay of communication between the affected communities and their formalemergency response agencies (Tapia et al. 2013; OCHA 2014; VSMWG 2014;Sutton et al. 2014). Location-based social media messages can facilitate the promptresponse and decision making for disaster response and recovery because socialmedia is free and highly accessible. The messages provided by people in affectedareas can be collected and interpreted by emergency responders immediately whilealso opening direct lines of communication between responders and affectedcommunities (Goolsby 2010; Sakiki et al. 2013; Tomaszewski 2015).
One important metadata for disaster response stored in social media messages isthe location of users. Twitter posts with geographic locations are referred to as
86 M.-H. Tsou et al.
“geo-tagged tweets”. However, only between 1–3% of tweets include location(Morstatter et al. 2013) as users must activate the geolocation function in theirmobile devices. Utilizing geo-tagged tweets with content analysis can help improvesituational awareness and further disaster management efforts.
One early software example of using geo-tagged social media for disaster reliefis Ushahidi (http://www.ushahidi.com), which was an open source crowdsourcingcrisis map platform that utilizes online volunteers for information validation (Gaoet al. 2011). Created in 2007 in Kenya to provide situational information from theonline volunteers (Okolloh 2009), many disaster relief agencies used Ushahidi tohelp coordinate emergency responses in such places as Haiti, Chile, Russia, Kenya,and India. However, there are several major challenges of using geo-tagged socialmedia for disaster relief, including the accuracy of geo-tagged locations, verifica-tion of reports, summarizing all reports automatically, social behavior prediction,and the scalability and safety (Gao et al. 2011). Sahana is another well-known opensource Disaster Management System for emergency management and disasterpreparedness. It provides limited mapping functions to add information ondisaster-relevant event locations or requests for help. Users can add notes or uploadphotos with specific locations on a web map, so that different agencies can col-laboratively work on the disaster response and relief activities (Careem et al. 2006).
Since both Ushahidi and Sahana platforms cannot provide a real-time socialmedia messages display functions, the main design goal of GeoViewer is to deliverreal-time map display functions for disaster events ground truth observation.A product of the Center for Human Dynamics in the Mobile Age (HDMA) at SanDiego State University, GeoViewer is a web-based real-time social media mappingapplication that links GPS locations, texts, photos, and time stamps in social media(Twitter) messages. GeoViewer helps users visualize historical and real-time socialmedia content, provides easy-to-use geospatial query functions, and displaysmultimedia sources (see Fig. 1).
The first beta version of GeoViewer was developed on July 30, 2014 after theSan Diego Wildfire (http://vision.sdsu.edu/hdma/wildfire/). The official version ofGeoViewer was released by the HDMA Center on December 6, 2014 (http://vision.sdsu.edu/hdma/geoviewer/sanDiego) with the real-time mapping function. The keydesign principle of GeoViewer follows the Knowledge Discovery in Cyberspace
Fig. 1 The design ofGeoViewer is based on theanalytic framework ofKnowledge Discovery inCyberspace (KDC).(Modified from Tsou andLeitner 2013, 56)
Building a Real-Time Geo-Targeted Event Observation (Geo) … 87
(KDC) conceptual framework (Fig. 1). In order to acquire geospatial knowledgeand situation awareness in social media and cyberspace, GeoViewer needs to helpusers discover new patterns, new trends, and new spatial knowledge from aggre-gated social media records (Tsou and Leitner 2013). One unique characteristic ofKDC is a triangular knowledge base consisting of place, time, and messages. Thethree components of KDC are interdependent and human-centered, which meansthey are originally defined or created by human beings (messengers).
2 The Design of GeoViewer System Architecture
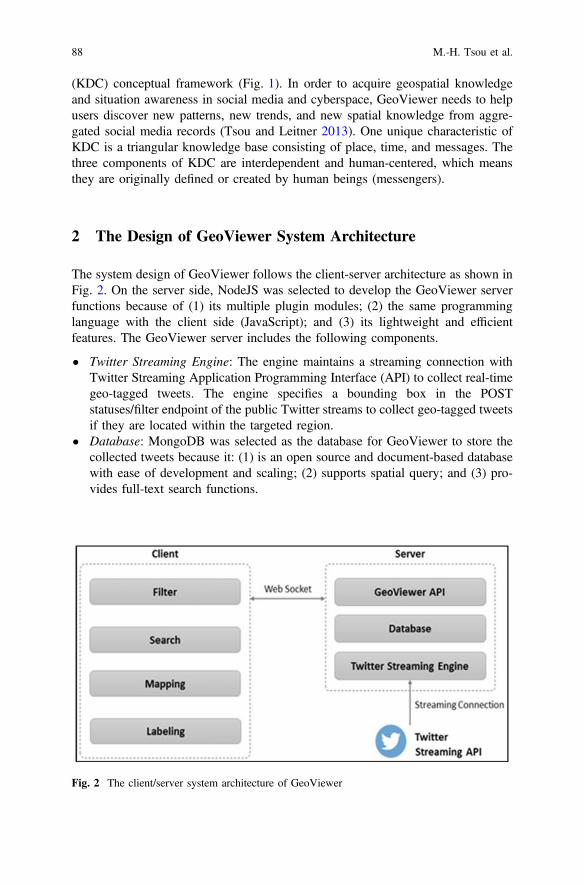
The system design of GeoViewer follows the client-server architecture as shown inFig. 2. On the server side, NodeJS was selected to develop the GeoViewer serverfunctions because of (1) its multiple plugin modules; (2) the same programminglanguage with the client side (JavaScript); and (3) its lightweight and efficientfeatures. The GeoViewer server includes the following components.
• Twitter Streaming Engine: The engine maintains a streaming connection withTwitter Streaming Application Programming Interface (API) to collect real-timegeo-tagged tweets. The engine specifies a bounding box in the POSTstatuses/filter endpoint of the public Twitter streams to collect geo-tagged tweetsif they are located within the targeted region.
• Database: MongoDB was selected as the database for GeoViewer to store thecollected tweets because it: (1) is an open source and document-based databasewith ease of development and scaling; (2) supports spatial query; and (3) pro-vides full-text search functions.
Fig. 2 The client/server system architecture of GeoViewer
88 M.-H. Tsou et al.
• GeoViewer API: The GeoViewer server provides several JavaScript APIs (suchas search historical tweets, spatial search, and sending new tweets) to com-municate messages between the client and server sides. The messages aredelivered by a WebSocket (i.e., a persistent connection between clients andservers to increase interactions). Once GeoViewer is launched in a Webbrowser, a WebSocket is initiated to communicate messages in real-timebetween the client and the server.
On the client side, GeoViewer was created based on HTML5, CSS, JavaScript,and JavaScript modules (Table 1). Besides the key mapping functions (such assearching, mapping, and labelling), the client side provides a filter function, whichfilters out unmatched tweets based on the search criteria (keywords, spatialboundary, or dates). If a real-time tweet does not match the criteria, the tweet willbe invisible until a user resets the search criteria.
GeoViewer is an easy-configurable package. Developers can easily customizeGeoViewer functions to target different areas by customizing the configuration file.GeoViewer is planned to become an open source project, so that more researchersand institutes can develop or utilize GeoViewer for their own research project.
3 User Interface Design and Key Functions
Different from traditional web maps, GeoViewer provides interactive display ofmultimedia content in addition to map display. The web-based user interface(front-end) is built by open source programming libraries, jQuery and Leaflet APIs,to visualize and query tweets from a server-side database (back-end). The userinterface design of GeoViewer follows the concept of user-centered design (UCD)in cartography (Tsou 2011), which emphasizes providing the most important (andsimplified) information for map readers with a user-friendly interface and dataanalytic functions. Four major components of the user interface design are
Table 1 The JavaScript (JS) modules used in the client side of GeoViewer
JSmodules
Purpose
jQuery jQuery makes things like HTML document traversal and manipulation, eventhandling, animation, and Ajax much simpler (https://jquery.com/)
Bootstrap Bootstrap is a popular HTML, CSS, and JS framework for developing responsiveprojects on the web (http://getbootstrap.com/)
Leaflet Open source JavaScript map library (http://leafletjs.com)Moment.js Format date and time functions (http://momentjs.com/)Masonry Show tweets in a grid layout (http://masonry.desandro.com/)introJS Show step by step tutorial functions in GeoViewer (https://usablica.github.io/
intro.js/)
Building a Real-Time Geo-Targeted Event Observation (Geo) … 89
highlighted: (1) real-time display of new geo-tagged tweets within the target area;(2) interactive mapping functions for geovisualization; (3) spatial, text, and tem-poral search functions using keywords, spatial boundary, or dates; and (4) labelingand text-tagging for individual messages and for further sentiment analysis.
3.1 Real-Time Display of Geo-Tagged Tweets
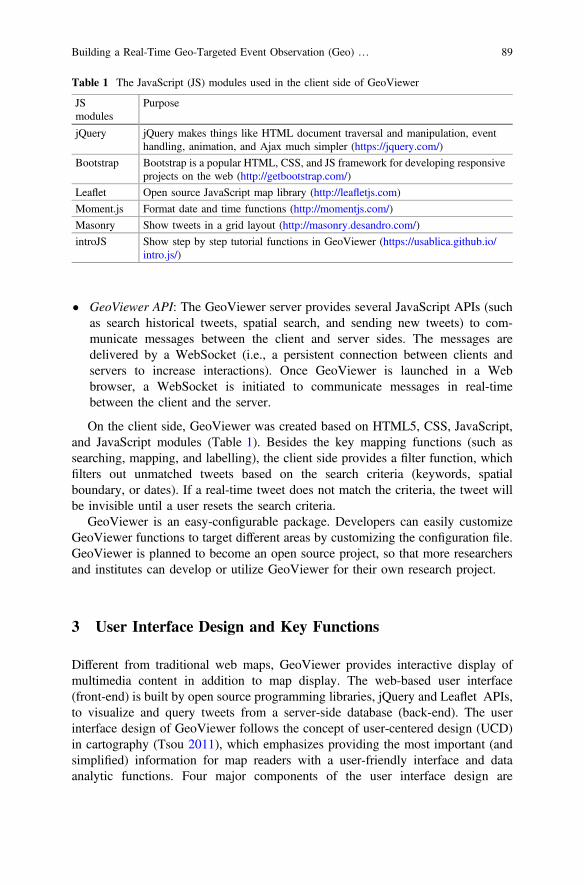
When users launch GeoViewer, the web app automatically collects geo-taggedtweets within the selected region with the public Twitter Streaming API. Althoughthe public Streaming API has a 1–3% limitation of total tweets within a region,GeoViewer can collect 40–50% of all geo-tagged tweets within the defined regionbased on our previous testing results. Some researchers also indicated that over 90%coverage of total geo-tagged tweets can be collected via public Streaming APIs(Morstatter et al. 2013). When a new geo-tagged tweet is collected, GeoViewerautomatically displays the tweet at the top (newest first) or at the end (oldest first) ofthe Tweet window (left-side). Users can select the refresh rate of new tweets bytime or by the number of tweets. Users can also pause the real-time feed if needed(Fig. 3).
The dual-view interface is adjustable to increase or decrease map view window(right-side), which also adjusts the number of columns in the tweet window. Eachtweet in the Tweet window has an orange Map button to identify its exact locationin the Map Window. Disaster responders and resource coordinators can query andanalyze these real-time tweets and identify the location and time of urgent requests.Each affected area can have one GeoViewer instance with a pre-defined area for
Fig. 3 Displaying and arranging real-time tweets in GeoViewer (San Diego region) (http://vision.sdsu.edu/ec2/geoviewer/sanDiego#)
90 M.-H. Tsou et al.
tweet collection. The bounding box is defined in the web server configuration filefor each GeoViewer and can be visualized in the front-end as well by clicking theTwitter Search Boundary in the Map Layer option.
3.2 Interactive Mapping Functions for Geovisualization
GeoViewer utilizes Leaflet, an open source JavaScript mapping library for thedevelopment of interactive mapping function. In addition to the standard zoom-in(+), zoom-out (−), and pan function, four key mapping functions for better geo-visualzation are provided: map marker selection, cluster mapping, hot spot map-ping, and map layers overlay.
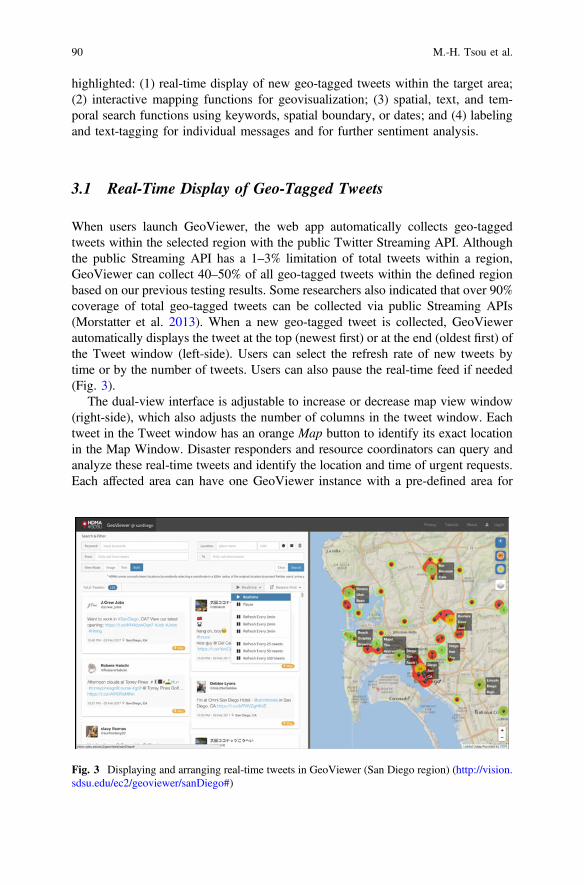
• Map marker selection allows users to pick the color and size of map markers(Fig. 4, left). The markers depict the proximate location of each geo-taggedtweet. In order to protect Twitter users’ locational privacy, GeoViewer appliesgeo-masking to conceal the actual tweet locations by randomly selecting acoordinate within the 100 m radius of the original location.
• Cluster mapping provides a generalized view for the clustered distribution oftweets within a region to simplify the display of point data. In addition, apopular text display function is associated with the cluster mapping to presentthe top three keywords from the message clusters (Fig. 4, right). When userszoom-in or zoom-out, tweet clusters are re-arranged and top keywords aredynamically generated based on the new cluster groups. One motivation for thisfunction is to provide a quick overview of popular issues or topics within theclustered groups. For example, during a new wildfire event, the popular key-words used near fire perimeters can be used to identify the name of wildfire forthe future reference and public announcement. Also, if there are multiple urgentrequests from a collapsed building or a landmark, the cluster labels can helpdecision-makers identify the key issues within the target area.
Fig. 4 The map marker selection function (left) and the cluster mapping function with top threekeywords within each cluster (right)
Building a Real-Time Geo-Targeted Event Observation (Geo) … 91
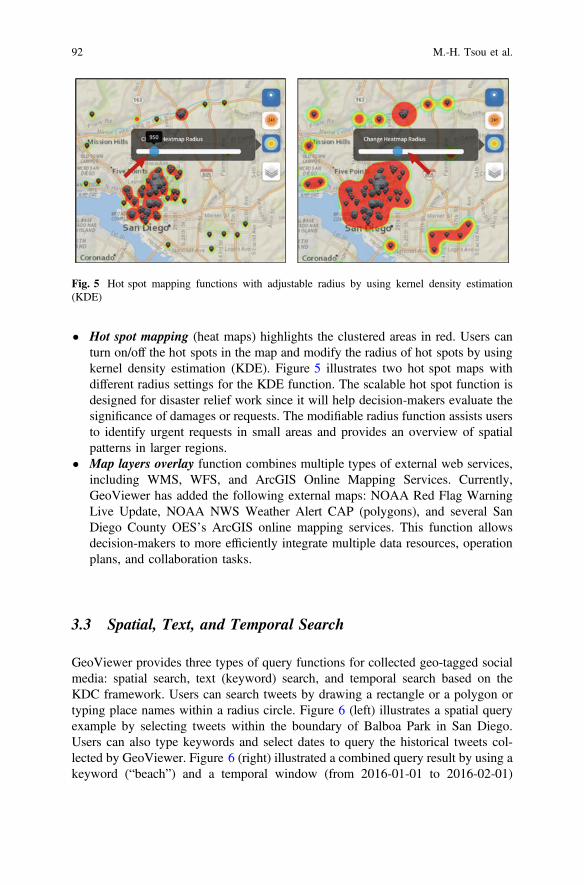
• Hot spot mapping (heat maps) highlights the clustered areas in red. Users canturn on/off the hot spots in the map and modify the radius of hot spots by usingkernel density estimation (KDE). Figure 5 illustrates two hot spot maps withdifferent radius settings for the KDE function. The scalable hot spot function isdesigned for disaster relief work since it will help decision-makers evaluate thesignificance of damages or requests. The modifiable radius function assists usersto identify urgent requests in small areas and provides an overview of spatialpatterns in larger regions.
• Map layers overlay function combines multiple types of external web services,including WMS, WFS, and ArcGIS Online Mapping Services. Currently,GeoViewer has added the following external maps: NOAA Red Flag WarningLive Update, NOAA NWS Weather Alert CAP (polygons), and several SanDiego County OES’s ArcGIS online mapping services. This function allowsdecision-makers to more efficiently integrate multiple data resources, operationplans, and collaboration tasks.
3.3 Spatial, Text, and Temporal Search
GeoViewer provides three types of query functions for collected geo-tagged socialmedia: spatial search, text (keyword) search, and temporal search based on theKDC framework. Users can search tweets by drawing a rectangle or a polygon ortyping place names within a radius circle. Figure 6 (left) illustrates a spatial queryexample by selecting tweets within the boundary of Balboa Park in San Diego.Users can also type keywords and select dates to query the historical tweets col-lected by GeoViewer. Figure 6 (right) illustrated a combined query result by using akeyword (“beach”) and a temporal window (from 2016-01-01 to 2016-02-01)
Fig. 5 Hot spot mapping functions with adjustable radius by using kernel density estimation(KDE)
92 M.-H. Tsou et al.
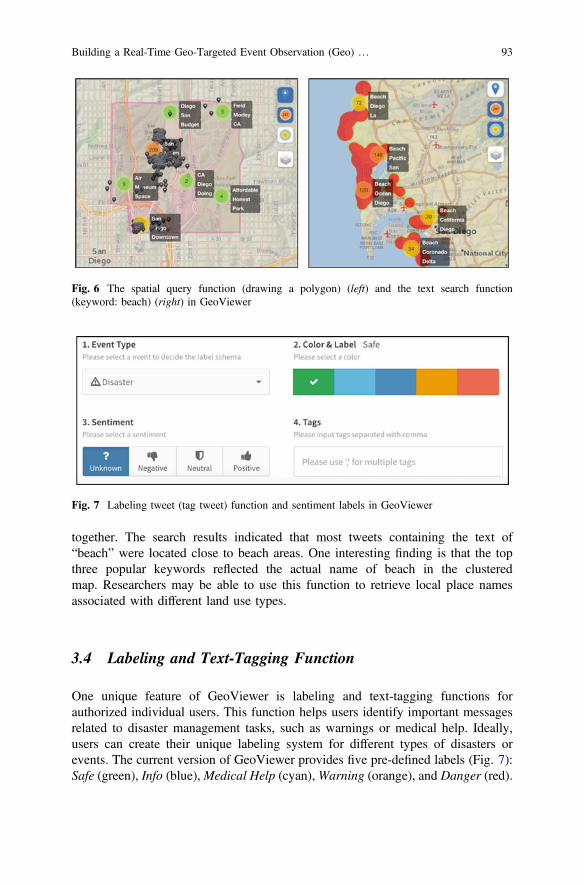
together. The search results indicated that most tweets containing the text of“beach” were located close to beach areas. One interesting finding is that the topthree popular keywords reflected the actual name of beach in the clusteredmap. Researchers may be able to use this function to retrieve local place namesassociated with different land use types.
3.4 Labeling and Text-Tagging Function
One unique feature of GeoViewer is labeling and text-tagging functions forauthorized individual users. This function helps users identify important messagesrelated to disaster management tasks, such as warnings or medical help. Ideally,users can create their unique labeling system for different types of disasters orevents. The current version of GeoViewer provides five pre-defined labels (Fig. 7):Safe (green), Info (blue),Medical Help (cyan),Warning (orange), and Danger (red).
Fig. 6 The spatial query function (drawing a polygon) (left) and the text search function(keyword: beach) (right) in GeoViewer
Fig. 7 Labeling tweet (tag tweet) function and sentiment labels in GeoViewer
Building a Real-Time Geo-Targeted Event Observation (Geo) … 93
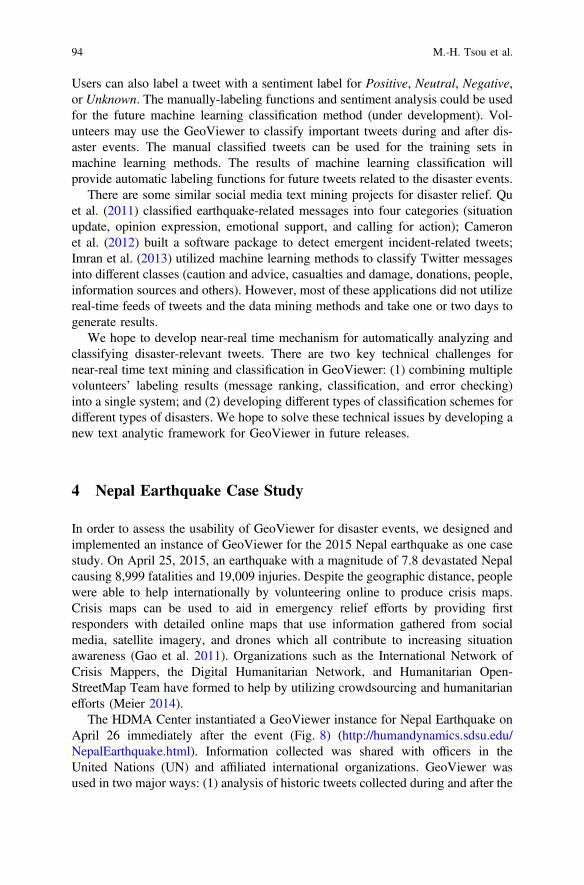
Users can also label a tweet with a sentiment label for Positive, Neutral, Negative,or Unknown. The manually-labeling functions and sentiment analysis could be usedfor the future machine learning classification method (under development). Vol-unteers may use the GeoViewer to classify important tweets during and after dis-aster events. The manual classified tweets can be used for the training sets inmachine learning methods. The results of machine learning classification willprovide automatic labeling functions for future tweets related to the disaster events.
There are some similar social media text mining projects for disaster relief. Quet al. (2011) classified earthquake-related messages into four categories (situationupdate, opinion expression, emotional support, and calling for action); Cameronet al. (2012) built a software package to detect emergent incident-related tweets;Imran et al. (2013) utilized machine learning methods to classify Twitter messagesinto different classes (caution and advice, casualties and damage, donations, people,information sources and others). However, most of these applications did not utilizereal-time feeds of tweets and the data mining methods and take one or two days togenerate results.
We hope to develop near-real time mechanism for automatically analyzing andclassifying disaster-relevant tweets. There are two key technical challenges fornear-real time text mining and classification in GeoViewer: (1) combining multiplevolunteers’ labeling results (message ranking, classification, and error checking)into a single system; and (2) developing different types of classification schemes fordifferent types of disasters. We hope to solve these technical issues by developing anew text analytic framework for GeoViewer in future releases.
4 Nepal Earthquake Case Study
In order to assess the usability of GeoViewer for disaster events, we designed andimplemented an instance of GeoViewer for the 2015 Nepal earthquake as one casestudy. On April 25, 2015, an earthquake with a magnitude of 7.8 devastated Nepalcausing 8,999 fatalities and 19,009 injuries. Despite the geographic distance, peoplewere able to help internationally by volunteering online to produce crisis maps.Crisis maps can be used to aid in emergency relief efforts by providing firstresponders with detailed online maps that use information gathered from socialmedia, satellite imagery, and drones which all contribute to increasing situationawareness (Gao et al. 2011). Organizations such as the International Network ofCrisis Mappers, the Digital Humanitarian Network, and Humanitarian Open-StreetMap Team have formed to help by utilizing crowdsourcing and humanitarianefforts (Meier 2014).
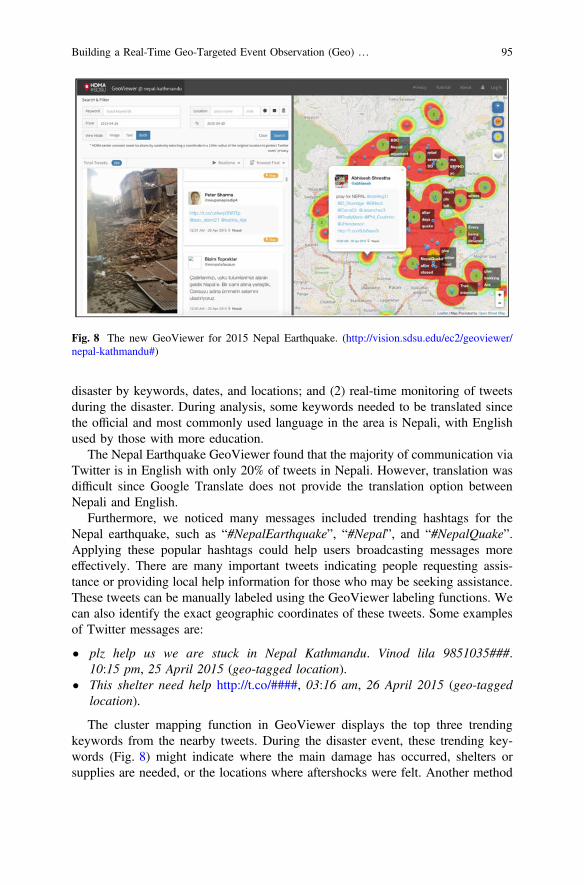
The HDMA Center instantiated a GeoViewer instance for Nepal Earthquake onApril 26 immediately after the event (Fig. 8) (http://humandynamics.sdsu.edu/NepalEarthquake.html). Information collected was shared with officers in theUnited Nations (UN) and affiliated international organizations. GeoViewer wasused in two major ways: (1) analysis of historic tweets collected during and after the
94 M.-H. Tsou et al.
disaster by keywords, dates, and locations; and (2) real-time monitoring of tweetsduring the disaster. During analysis, some keywords needed to be translated sincethe official and most commonly used language in the area is Nepali, with Englishused by those with more education.
The Nepal Earthquake GeoViewer found that the majority of communication viaTwitter is in English with only 20% of tweets in Nepali. However, translation wasdifficult since Google Translate does not provide the translation option betweenNepali and English.
Furthermore, we noticed many messages included trending hashtags for theNepal earthquake, such as “#NepalEarthquake”, “#Nepal”, and “#NepalQuake”.Applying these popular hashtags could help users broadcasting messages moreeffectively. There are many important tweets indicating people requesting assis-tance or providing local help information for those who may be seeking assistance.These tweets can be manually labeled using the GeoViewer labeling functions. Wecan also identify the exact geographic coordinates of these tweets. Some examplesof Twitter messages are:
• plz help us we are stuck in Nepal Kathmandu. Vinod lila 9851035###.10:15 pm, 25 April 2015 (geo-tagged location).
• This shelter need help http://t.co/####, 03:16 am, 26 April 2015 (geo-taggedlocation).
The cluster mapping function in GeoViewer displays the top three trendingkeywords from the nearby tweets. During the disaster event, these trending key-words (Fig. 8) might indicate where the main damage has occurred, shelters orsupplies are needed, or the locations where aftershocks were felt. Another method
Fig. 8 The new GeoViewer for 2015 Nepal Earthquake. (http://vision.sdsu.edu/ec2/geoviewer/nepal-kathmandu#)
Building a Real-Time Geo-Targeted Event Observation (Geo) … 95
to collect disaster related tweets is to use the download function in GeoViewer toextract all Twitter messages within the selected bounding box, which can be des-ignated using the “Location” feature or typing place names. With GeoViewer, wehope these social media messages can be reviewed by volunteers before being sentto, or monitored by, the local governmental response teams who could pinpointexactly where assistance should be dispersed and how to contact those affected.
5 Conclusion
Emergency response and rescue services are critical tasks in disaster management.By combining cluster map display, hot spots, manual labeling, spatiotemporalquerying, and real-time social media monitoring functions, GeoViewer is designedto help firefighters, police officers, and first responders to enhance their situationawareness and make better decisions for disaster relief. GeoViewer provides a moreintegrated geovisualization solution by analyzing disaster-relevant messages withscalable hot spots and cluster mapping/labels functions. These visualizations helpusers to validate major damaged areas. For example, a hot spot with over 10 reportsfrom different users of a collapsed building becomes more credible than from justone message.
After the case study of 2015 Nepal Earthquake, we identified a few researchchallenges and opportunities for the next version of GeoViewer. The first challengeis how to validate information (reports) provided by social media users. Previousresearch applications (such as Ushahidi) only emphasized on crowd-sourcedmanual classification to filter noises and errors. GeoViewer will need to combineboth crowd-sourced manual classification and real-time machine learning methodsto validate and filter disaster-relevant messages in near real-time. How to effectivelyrecruit online volunteers and generate training datasets for machine learning withina short period of time is an additional challenge. There were also significant noisesand errors in geo-tagged tweets from job advertisement, weather reports, trafficupdates, etc. These need to be filtered before conducting the hybrid manual andmachine learning classification.
Another challenge is how to increase the coverage of total geo-tagged tweets byusing Firehose or PowerTrack APIs from Twitter directly, which are not affordablefor most local disaster response agencies or NGOs. The sampling process of thepublic Twitter Streaming APIs are a black box and the underlying algorithm hasbeen changed frequently. We need to understand more about these algorithms toestablish a stable and full coverage stream. On the other hand, to increase thepercentage of geo-tagged tweets, disaster relief agencies, such as Red Cross or localgovernment agencies, should ask people in affected areas to enable GPS on theirdevices when submitting relevant reports via location-based platforms.
The language translation and interpretation is another key challenge for futuredevelopment (Tsou 2015). For example, if we want to use GeoViewer to guidedisaster relief in San Diego, we need to provide both English and Spanish versions
96 M.-H. Tsou et al.
because there is a significant Hispanic population. Some language translation taskscan be facilitated by using Google Translator. But, in the Nepal case study, wefound that there is no appropriate translation software for Nepali. Besides tech-nological challenges, we also need to consider human and ethical issues. Sometime,people at the most damaged areas may not have electricity or wireless communi-cations to report their urgent needs. Removing digital divides and building acces-sible wireless communication networks for everyone may be the most importantchallenge before we can effectively utilize social media for disaster relief andmanagement tasks in the future.
Acknowledgements This material is based upon work supported by the U.S. National ScienceFoundation under Grant No. 1416509 and Grant No. 163464. Any opinions, findings, and con-clusions or recommendations expressed in this material are those of the author and do not nec-essarily reflect the views of the National Science Foundation.
References
de Albuquerque, J. P., Herfort, B., Brenning, A., & Zipf, A. (2015). A geographic approach forcombining social media and authoritative data towards identifying useful information fordisaster management. International Journal of Geographical Information Science, 29,667–689. doi:10.1080/13658816.2014.996567.
Cameron, M. A., Power, R., Robinson, B., & Yin, J. (2012). Emergency situation awareness fromtwitter for crisis management. In Proceedings of the 21st International Conference on WorldWide Web (pp. 695–698). NY, USA: ACM.
Careem, M., De Silva, C., De Silva, R., Raschid, L., & Weerawarana, S. (2006). Sahana: Overviewof a disaster management system. In 2006 International Conference on Information andAutomation (pp. 361–366). IEEE.
Endsley, M. R. (1995). Toward a theory of situation awareness in dynamic systems. HumanFactors Journal of Human Factors and Ergonomics Society, 37(1), 32–64.
Gao, H., Barbier, G., & Goolsby, R. (2011). Harnessing the crowdsourcing power of social mediafor disaster relief. IEEE Intelligent Systems, 26(3), 10–14.
Goolsby, R. (2010). Social media as crisis platform: The future of community maps/crisis maps.ACM Transactions on Intelligent Systems and Technology (TIST), 1, 1, pp. 1–11, ACMDigital Library. DOI: 10.1145/1858948.1858955.
Guan, X., & Chen, C. (2014). Using social media data to understand and assess disasters. NaturalHazards, 74(2), 837–850.
Huang, Q., & Xiao, Y. (2015). Geographic situational awareness: mining tweets for disasterpreparedness, emergency response, impact, and recovery. ISPRS Int J Geo-Inf, 4(3), 1549–1568.
Humanity Road and Statistics Without Borders. (2014). A Guide to Social Media EmergencyManagement Analytics. Understanding the Place of Analytics through Typhoon Haiyan SocialMedia Analysis. http://humanityroad.org/smemanalyticsguide/.
Imran, M., Elbassuoni, S., Castillo, C., Diaz, F., & Meier, P. (2013). Practical extraction ofdisaster-relevant information from social media. In Proceedings of the 22nd InternationalConference on World Wide Web companion (pp 1021–1024). International World Wide WebConferences Steering Committee.
Meier, P. (2014). Digital humanitarians: How big data is changing the face of humanitarianresponse. CRC Press.
Building a Real-Time Geo-Targeted Event Observation (Geo) … 97
Moore, R. & Verity, A. (2014). Hashtag standards for emergencies. United Nations Office for theCoordination of Humanitarian Affairs (OCHA) Policy and Studies Series 012. http://reliefweb.int/report/world/hashtag-standards-emergencies. Retrieved January 10, 2015.
Morstatter, F., Pfeffer, J., Liu, H., & Carley, K. (2013). Is the sample good enough? Comparingdata from Twitter’s Streaming API with Twitter’s Firehose. In Proceedings of ICWSM (p. 9).
OCHA (2014). Hashtag standards for emergencies (pp. 1–18). United Nations Office for theCoordination of Humanitarian Affairs. http://reliefweb.int/sites/reliefweb.int/files/resources/Hashtag%20Standards%20For%20Emergencies.pdf.
Okolloh, O. (2009). Ushahidi, or ‘testimony’: Web 2.0 tools for crowdsourcing crisis information.Participatory Learning and Action, 59(1), 65–70.
Qu, Y., Huang, C., Zhang, P., & Zhang, J. (2011). Microblogging after a major disaster in China:A case study of the 2010 Yushu earthquake. In Proceedings of the ACM 2011 Conference onComputer Supported Cooperative Work, (pp. 25–34). ACM.
Sakaki, T., Okazaki, M., & Matsuo, Y. (2013). Earthquake shakes twitter users: Real-time eventdetection by social sensors. In IW3C2, (pp. 851–860). DOI: 10.1145/1772690.1772777.
Sutton, J., Spiro, E. S., Johnson, B., Fitzhugh, S., Gibson, B., & Butts, C. T. (2014). Warningtweets: serial transmission of messages during the warning phase of a disaster event.Information, Communication and Society, 17(6), 765–787.
Tapia, A., Moore, K., Johnson, N. (2013). Beyond the trustworthy tweet: A deeper understandingof microblogged data use by disaster response and humanitarian relief organizations. InISCRAM (pp. 770–779).
Tomaszewki, B. (2015). Geographic information systems (GIS) for disaster management. LLC,Boca Raton, FL: CRC Press Taylor and Francis Group.
Tsou, M. H. (2011). Revisiting web cartography in the United States: The rise of user-centereddesign. Cartography and Geographic Information Science, 38(3), 249–256.
Tsou, M. H. (2015). Research challenges and opportunities in mapping social media and Big Data.Cartography and Geographic Information Science, 42(sup1), 70–74. doi:10.1080/15230406.2015.1059251.
Tsou, M. H., & Leitner, M. (2013). Editorial: Visualization of social media: seeing a mirage or amessage? In special content issue: Mapping cyberspace and social media. Cartography andGeographic Information Science, 40(2), 55–60.
Tsou, M. H. & Sun, C. H. (2007). Mobile GIServices applications in disaster management, bookchapter in dynamic and mobile GIS: Investigating change in space and time. In J. Drummond,R. Billen, D. Forrest & Joao (Eds.), Innovations in GIS book series (pp. 213–236) London:CRC Press Taylor and Francis.
Veil, S. R., Buehner, T., & Palenchar, M. J. (2011). A work-in-process literature review:Incorporating social media in risk and crisis communication. Journal of Contingencies andCrisis Management, 19, 110–122. doi:10.1111/j.1468-5973.2011.00639.x.
Vieweg, S., Amanda, L. H., Starbird, K., & Palen, L. (2010). Microblogging during two naturalhazards events: What Twitter may contribute to situational awareness. In Proceedings of theSIGCHI conference on human factors in computing systems (pp. 1079–1088). ACM.
Virtual Social Media Working Group (VSMWG). (2014) Using social media for enhancedsituational awareness and decision support. Homeland Security Science and Technology.
Wang, Z., Ye, X., & Tsou, M. H. (2016). Spatial, temporal, and content analysis of Twitter forwildfire hazards. Natural Hazards, 83(1), 523–540. doi:10.1007/s11069-016-2329-6.
98 M.-H. Tsou et al.
![GEO-CIEHLYC - Earth Observations · GEO-CIEHLYC [Date] GEO’s guiding principles of collaboration aim to leverage Earth Observation (EO) resources to support timely and knowledge-based](https://img.pdfslide.net/doc/110x75/5b1e2f7a7f8b9ae90b8b600e/geo-ciehlyc-earth-observations-geo-ciehlyc-date-geos-guiding-principles.jpg)


![GEO-CIEHLYC - Earth Observations [Date] GEO’s guiding principles of collaboration aim to leverage Earth Observation ... Global de Agricultura (GEO-GLAM), la Red Global de](https://img.pdfslide.net/doc/110x75/5b34acf07f8b9a436d8c5277/geo-ciehlyc-earth-date-geos-guiding-principles-of-collaboration-aim-to-leverage.jpg)