Embed Size (px)
Citation preview

Building a simple functional near infrared spectroscopy system using Arduino
A Thesis
Submitted to the Faculty
of
Drexel University
by
Kanghee Lee
in partial fulfillment of the
requirements for the degree
of
Master of Science in Biomedical Engineering
September 2016

© Copyright 2016
Kanghee Lee. All Rights Reserved.

1
DEDICATIONS
To Reverend Matthew Meyer Pieters for shaping the foundation of my faith.
And to Mrs. Panatoya Kevgas for teaching me to love what I do in every step of my life.

2
ACKNOWLEDGEMENTS
My first and foremost acknowledgement extends to my Thesis Advisor, Dr. Kambiz
Pourrezaei, without whose expert guidance, encouragement and understanding this project
would not be near its completion. Professor Pourrezaei has always been patient and
supportive beyond the role of a professor and research advisor.
I am hugely indebted to my lab colleagues Daryl Omire-Mayor, Bahareh Barati, Ahmad
Pourshogi, Ardy Wong, and Rutvi Vyas, for their constant support and contributions to the
research.
I am also grateful to be a part of Drexel University and the School of Biomedical
Engineering, Science, and Health Systems, that provided a platform for me to learn and
grow with the support of an amazing faculty and staff.
Finally, I must express my profound gratitude towards my committee members, Dr.
Meltem Izzetoglu and Dr. Marek Swoboda for their passionate participation and input.

3
TABLE OF CONTENTS
LIST OF FIGURES ............................................................................................................ 4
ABSTRACT ........................................................................................................................ 5
CHAPTER 1: INTRODUCTION ....................................................................................... 6
CHAPTER 2: FUNCTIONAL NEAR INFRARED IMAGING BACKGROUND ......... 11
CHAPTER 3: DEVELOPING THE DEVICE ................................................................. 14
3.1 CURRENT fNIR SYSTEM ........................................................................................ 14
3.1.1 CONTROL CIRCUIT .............................................................................................. 14
3.1.2 ADAPTER ............................................................................................................... 15
3.1.3 FNIR PROBES ........................................................................................................ 16
3.1.4 SOFTWARE PLATFORM ...................................................................................... 18
3.1.5 EXPERIMENTAL SETUP ...................................................................................... 18
3.2 NEW FNIR SYSTEM................................................................................................. 20
3.2.1 ARDUINO DUE ...................................................................................................... 21
3.2.2 ADAPTER ............................................................................................................... 22
3.2.3 SOFTWARE PLATFORM ...................................................................................... 23
CHAPTER 4: FUNCTIONAL REQUIREMENTS .......................................................... 25
4.1 TESTING LED FREQUENCY .................................................................................. 25
4.2 TESTING CHANGE IN BLINKING FREQUENCY ................................................ 26
4.3 NEAR DETECTOR RESPONSIVITY ...................................................................... 28
4.4 ADJUSTABILITY OF THE LED INTENSITY ........................................................ 29
CHAPTER 5: CONCLUSION ......................................................................................... 31
5.1 LIMITATIONS ........................................................................................................... 33
5.2 SUGGESTIONS FOR THE FUTURE ....................................................................... 33
LIST OF REFERENCES .................................................................................................. 36
APPENDIX A: DATASHEET OF AVR ARDUINO MICROCONTROLLER .............. 38
APPENDIX B-1: ARDUINO IDE CODE TO TEST POTENTIOMETER ..................... 39
APPENDIX B-2: ARDUINO IDE CODE TO INCREMENT LED 730 NM .................. 40
APPENDIX B-3: ARDUINO IDE CODE TO INCREMENT LED 850 NM ................. 41
APPENDIX B-4: ARDUINO IDE CODE TEST FREQUENCY LED 730 NM ............. 42
APPENDIX B-5: ARDUINO IDE CODE TEST FREQUENCY LED 850 NM ............. 44
APPENDIX C: CIRCUIT CONNECTIONS FOR CONTROL CIRCUIT TO PROBE .. 46

4
LIST OF FIGURES
Figure 1: Current fNIR System ........................................................................................... 7
Figure 2: Absorption coefficients shown for oxy (HbO2), deoxy (Hb), H2O, and Lipid for
wavelengths in the NIR Window [5] ................................................................................ 12
Figure 3: A schematic of the current fNIR system ........................................................... 14
Figure 4: Adapter is encased in a hard plastic casing to protect the circuit connections
between the control circuit, probe headers, and 20K potentiometers. The full cased
adapter is shown in (a). Figure 3b shows the plain circuit without any components. Figure
3c shows the circuit with components soldered. ............................................................... 16
Figure 5: Three fNIR probes of the same type were made in-house ................................ 17
Figure 6: A single cycle of the fNIR system LED. In a single cycle, the 730nm and
850nm emit for 33 ms. ...................................................................................................... 17
Figure 7: COBI Studio displays a maximum of 16 channels............................................ 18
Figure 8: Experimental setup of the fNIR system involves placing two probes on the
subject’s head (a), configuring software properties (b) and conducting the experiment (c)
[17],[13]. ........................................................................................................................... 19
Figure 9: A schematic of the new fNIR system ................................................................ 21
Figure 10: Three sections of the Arduino Due are used for the fNIR system including the
power connections (1), analog inputs (2) and digital to analog converter(3) [3] ............. 22
Figure 11: The main design of the adapter circuit involves the incorporation of the NPN
transistor. The circuit includes a diode and capacitor to protect the LED, and an NPN
transistor connected to the Arduino to control the LED intensity. ................................... 23
Figure 12: Software platforms used to display and acquire data from Arduino Due ....... 24
Figure 13: Frequency tests for 730nm LED (a) and 850nm LED (b) ............................... 26
Figure 14: The frequency of the LED blink is increased by 2.5% every cycle ................ 27
Figure 15: The potentiometer of the near detector circuit is turned manually to decrease
its gain and achieve good signal range. The far detectors remain in good signal range. .. 29
Figure 16: Response of three detectors from LEDs .......................................................... 30

5
ABSTRACT
Building a simple functional near infrared spectroscopy system using Arduino
Kanghee Lee
Advisor: Dr. Kambiz Pourrezaei
Functional near infrared (fNIR) spectroscopy is an imaging modality that can continuously
and non-invasively measure the hemodynamic response to a stimulus. In our research
laboratory at Pourrezaei Labs, fNIR has been used to assess the hemodynamic response to
different types and levels of pain. The hardware of the fNIR system is often expensive and
requires extensive consultation and expertise to control its behavior. This thesis is
dedicated to replicating some of the simple functional requirements of the fNIR system
using the Arduino platform. The Arduino provides a flexible and independent environment
to load experimental programs on a microcontroller and interface with an electric circuit
without disrupting the entire system. There is also a large community around the Arduino
platform which offers guidance and education for different projects. Arduino provides an
incentive in the domain of research and student-led projects in order to provide a flexible,
low-cost and simple platform for students and researchers alike to build and experiment
with fNIR technology.

6
CHAPTER 1: INTRODUCTION
Our research in Pourrezaei Labs, led by Dr Kambiz Pourrezaei, involves the investigation
of the human brain’s response to noxious stimuli by measuring the cerebral hemodynamic
response. Pain being a prominent problem in healthcare, it poses a challenge for the
physicians to identify the root cause of the disease and treat their patients. There are
different types and degrees of pain, and clinicians are yet to find ways
to identify the underlying reasons for patient perceived pain. As a result, it is difficult for
the clinicians to identify a treatment regimen for each patient. This process becomes
exceedingly more challenging when you face a communication barrier between the patient
and the physician. Examples include children and infants, the elderly, patients with
language barriers, and patients with mental disorders [2]. Without a proper means of
communication, it is problematic to assess the degree with which they are in need of
managing their pain. Another challenge that healthcare professionals face in treating pain
is with patients who struggle with drug addiction or dependence [9]. Because identifying
pain is highly subjective, patients have a degree of freedom in expressing the condition of
their pain. Those who struggle with drug dependence may be prone to misrepresenting
their true sense of pain and ask for more and potent drugs to be prescribed [7], [15].
Our research strives to reduce the subjective nature of identifying pain and to pursue an
objective means by using the hemodynamic response to noxious stimuli as measured by
fNIR.

7
fNIR is a non-invasive neuroimaging modality that measures real-time hemodynamic
response. The technology has the benefit of moderate temporal resolution and
spatial resolution, long term, ease of use, and low fabrication cost [13], ][14].
Our current system involves a control circuit connected to a computer and adapter,
which add figure interfaces to probes placed on the subject's head (Figure 1). The system,
however, is complex and is inflexible. Any repair or modification of the system
often requires extensive troubleshooting and debugging. The key functionalities of the
system (control circuit) cannot sufficiently be reprogrammed. Alterations in the system
such as sampling rate, current and gain of the signal are available in the software, COBI
Studio [8]. Any modifications in the fNIR probe would be difficult to make as the control
circuit is designed for a specific configuration [13].
Figure 1: Current fNIR System

8
Problem statement: The current fNIR system that Pourrezaei Labs operates, presents a
number of issues. With recent advancements and technologies available in the basic
engineering field, this thesis is an attempt to address some of these difficulties.
1. Complex system – The current system is a commercially available product that is
not manufactured by the research lab. It is designed for specific uses and has limited
options for adjustments. Students and researchers also have a difficulty in
understanding how the system works because it is developed commercially. External
consultation is often necessary when a problem arose within the system.
2. Reliability – There is only one system available for use in the research laboratory.
Any malfunction of the system causes the risk to delay any research experiments until
the problem is resolved. Sustainability of research is dependent on the
functioning of the single system.
3. Cost – The cost of the commercial system is several thousands of dollars.
Depending on the optodes, LEDs, and other accessories bought along with the system,
the cost can be more expensive and can vary within the range of thousands of dollars.
4. Documentation – Changes and upgrades to the system are difficult to make. The
software and the hardware of the current system are developed and manufactured
commercially, preventing researchers from making their own adjustments or
upgrades.

9
Solution:
In this work, a system is designed to capture the same functionality of the existing system.
The key features such as LED current, detector gain, and the sampling frequency can easily
be adjusted with low cost and reduced size. The Arduino Due is used as a base to design
and control the system. A novel and simple circuit is developed to interface between the
probes and the Arduino Due. The Arduino has a software platform to allow user written
code to be programmed into a microcontroller. This permits:
1. Reducing complexity – Arduino architecture is a simple platform that is designed
to be used in an embedded system. This simple programmable configuration replaces
the complex control system of the existing system.
2. Improving reliability – Assembly of the new device and the source of its
components are easily accessible. Malfunctions or broken components of the system
are readily manageable and replaceable, reducing the risk of delay and improving
research sustainability.
3. Reducing cost – The cost is reduced by orders of magnitude, allowing the system to
be affordable for students and researchers. As a result, we can have more than one
system. If one system breaks down, there will always be a backup to continue the
research.
4. Documentation – Changes and upgrades to be readily made given the
documentation of the system and the accessibility of assembling the system. Knowing

10
the source of each component and how it is integrated into the system allows users to
make adjustments as desired.

11
CHAPTER 2: FUNCTIONAL NEAR INFRARED IMAGING BACKGROUND
Functional near infrared (fNIR) spectroscopy is a technology that implements optical
methods for continuous and non-invasive monitoring of blood oxygenation. This
technology targets the frontal cortex because many of the body's functions produce specific
physiological responses in that area [18].
The frontal cortex is a distinct portion responsible for the executive function such as
perception of pain [13]. In particular to this study, pain is said to have a direct trigger to
activity in the frontal cortex. Other studies have shown that the frontal cortex is activated
as a result of noxious stimuli [10].
A hemodynamic response can occur as a result of external stimuli and is often
accompanied by changes in physiological parameters such as heart rate and cerebral blood
flow. Hemoglobin is the protein that carries oxygen around the body and is the component
that contributes to the red color of blood when it is oxygenated and the blue color of blood
when it is not. For example, when pain is inflicted and the frontal cortex is activated, the
neurons of that area consume more energy. Energy production in the brain involves aerobic
respiration, which takes oxygen and glucose to produce ATP. Therefore, when more energy
is being consumed by the neurons in the frontal cortex, more energy is being generated
through aerobic respiration, and more oxygen is being delivered and consumed. Therefore,
by monitoring the hemodynamic response to painful stimuli, we can attempt to obtain an
objective measure of the pain response [18].

12
Photons are absorbed or scattered as they go through a turbid medium such as a living
tissue. In the near infrared region (600nm – 900nm), water, which is the main absorbent in
a tissue does not absorb that much. Therefore, wavelengths in the infrared
region penetrate relatively deeper into tissue.
Figure 2: Absorption coefficients shown for oxy (HbO2), deoxy (Hb),
H2O, and Lipid for wavelengths in the NIR Window [5]
Near infrared (NIR) is a term used to define light of wavelengths around
the 600nm - 1000nm window [5]. Within this window, H2O and lipids have
low absorptions coefficients. Except for the skin, the concentration of
other absorbents, such as melanin, is low (Figure 2). The scattered light can then be
detected and analyzed. These characteristics of NIR light have opened the door
for its clinical use. Oximeter is an example of technology that utilizes NIR light.

13
Beer-Lambert’s law defines the relationship between absorbance and the characteristics of
the absorbing sample. A modified Beer-Lambert law is used in fNIR to calculate
hemodynamic properties.
Equation 1: Beer Lambert’s Law
Beer-Lambert's law allows the concentration of a sample (c) according to its absorption
coefficient €, path of light (l), and pre (Io) and post (I) transmitted light (Equation
1). FNIR research has incorporated a modified Beer-Lambert law in order to calculate
the concentrations of oxygenated and deoxygenated hemoglobin according to multiple
wavelengths of light [14].

14
CHAPTER 3: DEVELOPING THE DEVICE
3.1 CURRENT fNIR SYSTEM
The current fNIR system is comprised of four basic parts: control circuit, adapter, probes,
and software platform COBI Studio (Figure 3).
Figure 3: A schematic of the current fNIR system
3.1.1 CONTROL CIRCUIT
The control circuit acts as the primary control of the fNIR system and acts as the interface
between the computer and adapter. The control circuit is designed for a commercially
available fNIR probe for a maximum of 16 channels. The probes used for the purposes of
our research are custom made probes with three channels. A single experiment requires the
use of two probes, or six channels of the control circuit. A custom made adapter was

15
designed for the attachment of a maximum of three custom made three-channel probes, for
a total of nine functional channels. Therefore, only nine of the 16 channels of the control
circuit are employed. The control circuit has an external power outlet connection, which
supplies power for the system. A standard USB is used to connect to the computer.
3.1.2 ADAPTER
The adapter functions as the connection between the probes and control circuit (Figure 4).
The probes are attached to a male 10-pin header on the adapter which locks the probe in
place. A maximum of three probes can be attached to the adapter. A 20K potentiometer for
each probe is connected to the adapter in order to control the responsivity of the near 1 cm
photodetector; the far detectors (3 cm) do not have the same response problem presented
by the near detector and as a result, do not require this additional controlling component
[13].

16
(a) (b)
(c)
Figure 4: Adapter is encased in a hard plastic casing to protect the
circuit connections between the control circuit, probe headers, and
20K potentiometers. The full cased adapter is shown in (a). Figure
3b shows the plain circuit without any components. Figure 3c shows
the circuit with components soldered.
3.1.3 FNIR PROBES
Each probe has three detectors and a single multi-wavelength LED (Figure 5). The probe
is attached to a flat ribbon cable with 10 connections. The probe houses two detectors that
are 2.8 cm apart from the multi-wavelength LED and a single detector that is 1 cm apart
from the LED. At the end of each probe is a female 10-pin header that connects to the

17
adapter. The probes are made in-house using electric wires to solder together the
components, and a silicone-rubber mold to structure the shape.
Figure 5: Three fNIR probes of the same type were made in-house
The fNIR system emits LEDs for 730nm and 850nm wavelengths. Each cycle is 500ms
while each wavelength is turned on for 33 ms (Figure 6). The response for each wavelength
and ambient light is recorded during each cycle [8].
Figure 6: A single cycle of the fNIR system LED. In a single cycle,
the 730nm and 850nm emit for 33 ms.

18
3.1.4 SOFTWARE PLATFORM
COBI Studio is the software platform used to configure the fNIR system and visualize the
data output (Figure 7). The software allows device settings to be configured including the
LED current, detector gain and sampling rate [8]. Data from connected devices are graphed
in real-time and saved in a designated folder.
Figure 7: COBI Studio displays a maximum of 16 channels
3.1.5 EXPERIMENTAL SETUP
During an experiment, two probes are placed on the subject’s head (Figure 8a). The subject
is seated and is required to maintain a still position (Figure 8c). The LED current and
detector gain are adjusted in order to reach a good signal (Figure 8b). The near detector
signal is also configured using the potentiometer to adjust the response, and prevent
saturation.

19
(a) (b)
(c)
Figure 8: Experimental setup of the fNIR system involves placing
two probes on the subject’s head (a), configuring software properties
(b) and conducting the experiment (c) [17],[13].

20
The experiment begins when the system setup is complete and the device begins recording.
Once the experiment is complete, the data is saved and stored in a designated file by
selecting 'View Experiment Data'.
Several types of experiments are conducted in our research laboratory to invoke noxious
stimuli and record its response. The cold pressor test is used to determine the tolerance that
a subject has for pain. Cold pressor tests have been used in several fields of medical
research including pain and cardiovascular studies, for a number of decades. This test
involves immersion of the subject's hand into cold water of temperatures between 0 and 15
degrees Celsius. The purpose of the cold pressor test is to invoke and study the subject's
physiological and psychological response to prolonged noxious stimuli. Another type of
experiment conducted in our research laboratory is the Peltier experiment. The Peltier
experiment is similar to the cold pressor test except for the fact that it uses a Peltier device,
and invokes thermal pain. A probe is placed on the subject's forearm to deliver high or low
temperatures to a small area. Additionally, several other types of experiments are involved
in spite of the cold pressor test and the Peltier test being the two common types of
experiments conducted in our research [13], [17].
3.2 NEW FNIR SYSTEM
The new system replaces three basic parts of the current fNIR system: control circuit,
adapter, and software platform (Figure 9). The probes and probe design, however, are the
same in the new system.

21
Figure 9: A schematic of the new fNIR system
3.2.1 ARDUINO DUE
The Arduino Due is used to substitute the main function of the control circuit and acts as
the main control for the new fNIR system. The Arduino Due houses a programmable
microcontroller and other functions in a platform that is easily accessible through wire pin
connections. A USB connection serves a dual function in programming the microcontroller
and data acquisition through serial communication.

22
Figure 10: Three sections of the Arduino Due are used for the fNIR
system including the power connections (1), analog inputs (2) and
digital to analog converter(3) [3]
The three connections used in the Arduino Due include the power connections (1), analog
inputs (2) and the DAC (3) (Figure 10). The power connections include ground and a 5V
output. The 5V output supplies voltage for the detectors.
3.2.2 ADAPTER
A new circuit design was necessary for the adapter. The new device powers the
LEDs through a jumper wire connected to the adapter. The power is supplied directly from
a DC power source. An NPN transistor was incorporated into the adapter circuit. This NPN
transistor allows the intensity of the LEDs to be adjusted according to the input from the
Arduino Due. The inputs can be adjusted from the software platform discussed in the next
section.
1 2 3 2 1

23
Figure 11: The main design of the adapter circuit involves the
incorporation of the NPN transistor. The circuit includes a diode and
capacitor to protect the LED, and an NPN transistor connected to
the Arduino to control the LED intensity.
The circuit involves the following external connections:
DC power supply (1)
Arduino DAC pins (2)
Ground (3)
The capacitor and diode are put in place in order to protect the circuit from noise and
spikes.
3.2.3 SOFTWARE PLATFORM
The Arduino Integrated Development Environment (IDE) is Arduino’s software platform
in order to write code and programs to communicate with Arduino hardware. Arduino IDE

24
provides support for C and C++ programming languages and integrates them into one
environment.
Arduino IDE was used for both programming software into the Arduino Due and reading
data from the serial monitor. The serial monitor displays data being communicated from
the Arduino (Figure 12a).
(a) (b)
Figure 12: Software platforms used to display and acquire data from
Arduino Due
A MATLAB program was also created to display real-time data from the Arduino on a
graph (Figure 12b). The MATLAB program provides options to start, stop, and save any
experiments being recorded. The program was tested to collect data for heart rate and
oxygen saturation, but is projected for use in fNIR pain experiments in the future. Data
results presented in this project were obtained using the Arduino IDE serial monitor.
25
CHAPTER 4: FUNCTIONAL REQUIREMENTS
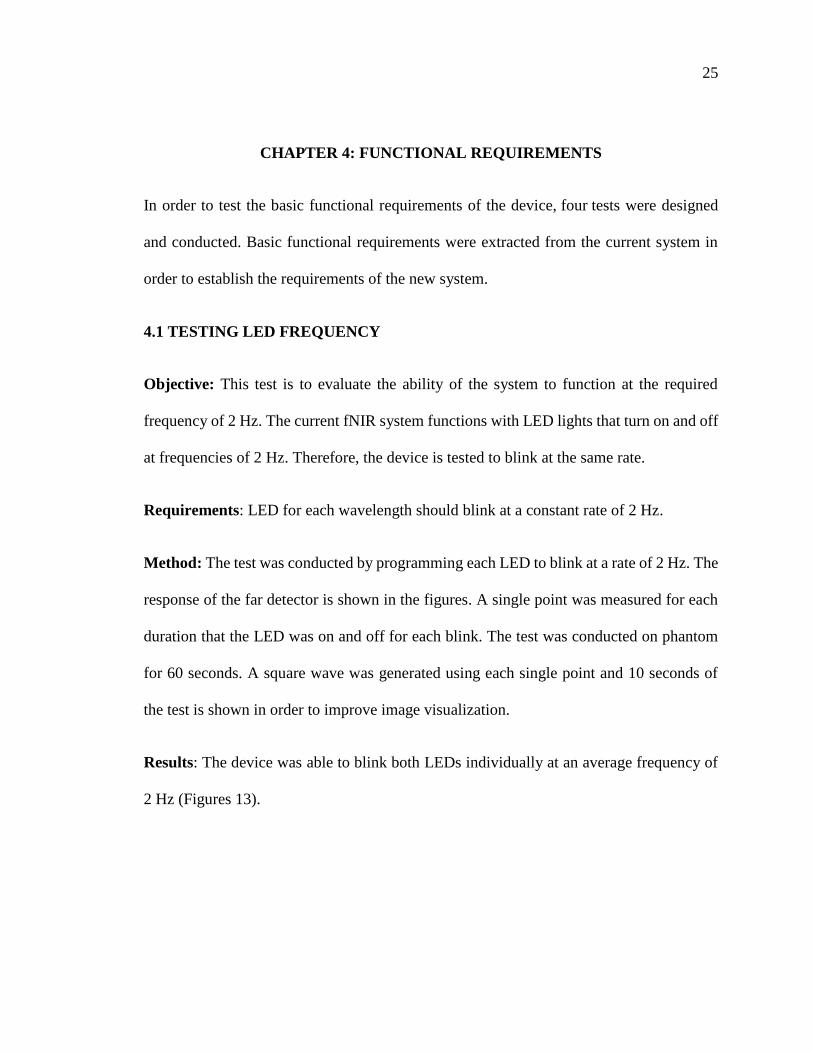
In order to test the basic functional requirements of the device, four tests were designed
and conducted. Basic functional requirements were extracted from the current system in
order to establish the requirements of the new system.
4.1 TESTING LED FREQUENCY
Objective: This test is to evaluate the ability of the system to function at the required
frequency of 2 Hz. The current fNIR system functions with LED lights that turn on and off
at frequencies of 2 Hz. Therefore, the device is tested to blink at the same rate.
Requirements: LED for each wavelength should blink at a constant rate of 2 Hz.
Method: The test was conducted by programming each LED to blink at a rate of 2 Hz. The
response of the far detector is shown in the figures. A single point was measured for each
duration that the LED was on and off for each blink. The test was conducted on phantom
for 60 seconds. A square wave was generated using each single point and 10 seconds of
the test is shown in order to improve image visualization.
Results: The device was able to blink both LEDs individually at an average frequency of
2 Hz (Figures 13).

26
(a)
(b)
Figure 13: Frequency tests for 730nm LED (a) and 850nm LED (b)
4.2 TESTING ALTERED BLINKING FREQUENCY
Objective: This test is to evaluate the ability of the system to operate at a different
frequency by programming from the Arduino IDE software platform.
-200
0
200
400
600
800
1000
1200
1400
1600
1800
0 1 2 3 4 5 6 7 8 9 10
Byt
es
Time (s)
0
500
1000
1500
2000
2500
3000
3500
0 1 2 3 4 5 6 7 8 9 10
Byt
es
Time (s)

27
Requirements: The device can operate at a frequency of 12 Hz from the Arduino IDE
interface.
Method: The test was conducted by programming each LED to blink at a rate of 12 Hz.
The response of the far detector is shown in the figures. The test was conducted on phantom
A square wave was generated using each single point and 1.4 seconds of the test is shown
in order to improve image visualization.
Results: The device was able to blink at a frequency of 12 Hz from the beginning to the
end of the test (Figure 14).
Figure 14: LED blink at 12 Hz
0
500
1000
1500
2000
2500
3000
3500
4000
4500
0 0.2 0.4 0.6 0.8 1 1.2 1.4
Byt
es
Time (seconds)

28
4.3 NEAR DETECTOR RESPONSIVITY
Objective: The near detector saturates before the far detectors because more
light would reach closer proximities. As suggested by the manufacturer datasheet, external
potentiometer was incorporated into the system so that the response of the near detector can
be adjusted. As light intensity is adjusted to accommodate light penetration through the
tissue and finally to the detector, the response of the near detector increases at a greater
rate than the response of the far detector. A saturated response is not usable. Therefore, the
responsivity of the near detector should be adjustable to accommodate this feature as in
Appendix D.
Requirements: The gain of the near detector can be adjusted to prevent saturation.
Method: The test was conducted by maintaining a constant LED intensity and measuring
the response of the three photodetectors. The responses of the far detectors are kept within
good signal range by adjusting LED current during the setup. The response of the near
detector begins with the potentiometer set for a saturated signal. The potentiometer is then
turned manually to gradually decrease the response of the near detector.
Results: The test shows that the responsivity of the near detector is adjustable by changing
the gain through the potentiometer. As the potentiometer is manually turned, the gain of
the near detector is decreased and the signal is no longer saturated by the 15 second mark.
Both far detectors, however, remains in good signal range as they are not affected by the
gain adjustment of the near detector.

29
Figure 15: The potentiometer of the near detector circuit is turned manually to decrease its gain and
achieve good signal range. The far detectors remain in good signal range.
4.4 ADJUSTABILITY OF THE LED INTENSITY
Objective: This test is to show that the intensity of the LED can be adjusted from the
computer. The intensity of the LED must be adjustable in order to accommodate the
responses of different skin and tissue.
Requirements: The device can adjust the intensity of each wavelength of LED from the
Arduino IDE interface.
Method: The device is programmed to increment the analog input to adjust the LED
intensity. As the analog input is adjusted, the response of the LED is measured from all
three detectors.
Results: The test shows a gradual increase from a zero analog input to the maximum analog
input. Once the maximum is reached, the analog input jumps back to zero. The test shows
the cycle of the analog input incrementally by the response of the detectors (Figure 16).
1000
1500
2000
2500
3000
3500
4000
4500
0 5 10 15 20 25 30 35 40
Byt
es
Time (s)
Gain adjustment of near detector
Near detector
Far detector 1
Far detector 2

30
Figure 16(a): Response of three detectors from 850nm LED
Figure 16(b): Response of three detectors from 730nm LED
-500
0
500
1000
1500
2000
2500
3000
3500
4000
4500
0 10 20 30 40 50 60
Byt
es
Time (s)
Far detector 1
Far detector 2
-100
0
100
200
300
400
500
600
700
0 10 20 30 40 50 60
Byt
es
Time (s)
Far detector 1
Far detector 2

31
CHAPTER 5: CONCLUSION
The objective of this project was to create a device that would satisfy the requirements of
the fNIR experiments conducted in our research laboratory. In fulfilling these requirements
with the new device, several other accomplishments were achieved.
The new device helps users and researchers to understand how the system
works in less challenging manner. The new device is developed using Arduino, an
open-source electronic prototyping platform, which is well documented with
guides and tutorials [3]. Step-by-step processes of developing the new system, as
well as each component necessary to build the
device are documented. Comparatively, the current commercially available system
does not readily provide information such as functional requirements, device
components, circuit diagrams, etc. It is difficult to inspect or debug the current
system hardware without a comprehensive understanding of circuits.
Developing the new device is a first step into improving research sustainability.
Our research laboratory currently houses a single system available for use in
experiments. If and when the system malfunctions, experiments are prone to delay
until the system is fixed. The new device is simple to create, well documented, and
has readily available and replaceable components, allowing any malfunctions to be
addressed immediately.

32
The cost of the system was reduced by several orders of magnitude. The total cost
of the components of the new device is relatively inexpensive, less than
$300, compared to the cost of the current commercially available system.
In contrast to the current device, it is not difficult to make changes and upgrades to
the new device. The Arduino Due is easy to program using the Arduino Software
(IDE) and the circuit is easy to create.
The device is programmed and controlled through the Arduino Due and Arduino Software
(IDE), which replaces the control circuit of the current system. A new circuit was also
designed and developed to be used as the interface between the Arduino Due and the
probes. The same probes from the current system are used in the device. The specifications
for each component of the new system were documented. Figures and diagrams are
available to aid users and researchers in understanding how the system was developed and
how each component is linked to the system. Finally, tests were conducted to validate the
basic functional requirements aimed for this project to be accomplished. These
requirements are the basic functions for the device to be used for the experiments in our
laboratory. The results of the tests showed that the device satisfies the basic functional
requirements. The requirements of the probe were not tested, however, because the same
probe from the current system is used in the new device. The probe involves requirements
of the LED and photodetector used as well as the type of material, shape and configuration
of the probe. The tested requirements include the frequency of the LED blink, adjustability
of the LED intensity, and adjustability of the near photodetector to prevent saturation.

33
5.1 LIMITATIONS
The system presents several limitations. First, the circuit built for the adapter needs
improvement to increase the signal from the 730nm LED. The signal of
the 730nm wavelength is significantly lower than the signal of the 850nm. Although the
nature of the 730nm LED is a factor, the design of the circuit is the primary limitation of
the low signal.
Using the Arduino Due restricts the user to its compatibility. The Arduino Due uses the
Atmel SAM3X8E ARM Cortex-M3 CPU shown in Appendix A. There are limited number
of inputs and other electronic components. The Arduino Due also runs at 3.3V and cannot
tolerate voltages higher than 3.3V. If another microcontroller is to be used for the device,
the Arduino Due cannot be used. Other limitations also include the user to have knowledge
of Arduino IDE programming language and basic knowledge of electric circuits to run the
new device.
5.2 SUGGESTIONS FOR THE FUTURE
Although the new device created has met many of the functional requirements, it is still in
its amateur state and requires more work to become a fully stand-alone system used in
research experiments. Since many of our research experiments are conducted outside of the
laboratory in clinics and hospital settings, the device should be portable. Currently, the
device requires a DC power source to provide power. Future works involve creating a

34
connection from the device to an outlet, allowing the device to be used in any setting with
a standard electrical outlet or battery.
The future works also include improving the circuit of the device. The current circuit
involves soldering individual components on a solder board. The adapter circuit should be
replicated and designed on a printed circuit board to make manufacturing easier. The
adapter then can be integrated within the Arduino box. As the circuit was discussed in the
limitations for the 730nm LED, future designs should incorporate LED driver to provide
proper regulation of power to the device.
Data acquisition is accessible through both the Arduino Serial Monitor and MATLAB
program and the MATLAB program is designed to allow data to be visualized in real-time.
However, the program poses a delay after several minutes of data acquisition. After several
minutes, the data is graphed with a delay, preventing the data collected in the moment to
be visualized immediately. Real-time data visualization allows the user to observe the trend
of data during experiments. During the setup of each experiment, the response of the near
detector must be adjusted to prevent saturation. Real-time visualization of the near detector
would be a significant aid to adjusting its response. In a new version of the prototype, this
problem has been addressed.
The prototype was tested only on phantom and requires trials on human subjects to test if
the same requirements tested on the phantom function on human subjects. Although the
phantom imitates human brain tissue, the dynamic nature of a true human subject cannot
be replicated in a phantom. An IRB (institutional review board) protocol will need to be

35
submitted and approved in order for human subject tests to be performed. The requirements
satisfied and corroborated by phantom tests, however, are likely to expedite the process for
human subject tests.

36
LIST OF REFERENCES
[1] A. Bozkurt and B. Onaral, "Safety assessment of near infrared light emitting
diodes for diffuse optical measurements," Biomed Eng Online, vol. 3, p. 9,
Mar 22 2004. [2] American Academy of Pediatrics, “The assessment and management of acute
pain in infants, children, and adolescents,” Pediatrics, vol. 108, no. 3, pp. 793–
797, 2001. [3] Arduino. Available: http://www.arduino.cc Accessed 2015 Aug [4] D’Ausilio, A., 2011. Arduino: a low-cost multipurpose lab equipment.
Behavior Research Methods 44, 305–313. [5] Davies DJ, Su Z, Clancy MT, et al. Near-Infrared Spectroscopy in the
Monitoring of Adult Traumatic Brain Injury: A Review. J Neurotrauma
2015;32:1–9 [6] F. F. Jöbsis-VanderVliet, “Discovery of the near-infrared window into the
body and the early development of near-infrared spectroscopy,” J. Biomed.
Opt. 43, 392–396 1999. [7] Fishbain DA, Rosomoff HL, Rosomoff RS. Drug abuse, dependence, and
addiction in chronic pain patients. Clin J Pain1992;8(2):77–85. [8] fNIR Devices LLC. 2013. fNIR Imager & COBI Studio. Manual. Retrieved
from https://www.biopac.com/wp-content/uploads/fnir-cobi-manual.pdf. [9] Glajchen M. Chronic pain: Treatment barriers and strategies for clinical
practice. J Am Board Fam Pract2001;14(3):211–18. [10] J. Lorenz, S. Minoshima, and K. L. Casey, "Keeping pain out of mind: the
role of the dorsolateral prefrontal cortex in pain modulation," Brain, vol.
126, pp. 1079-1091, May 2003. [11] K. Pourrezaei, Z. Barati, P. Shewokis, M. Izzetoglu, R. Polikar, and G.
Mychaskiw, "Hemodynamic response to repeated noxious cold pressor tests
measured by functional near infrared spectroscopy on forehead," Annals of
Biomedical Engineering, 2012. [12] K. Ridderinkhof, R., Ullsperger, M., Crone, E. A. & Nieuwenhuis, S. The
role of the medial frontal cortex in cognitive control. Science 306, 443–447
(2004) [13] R. Vyas, Hardware improvement in cold pressor test and Peltier system for
measurement of hemodynamic response to pain by fNIR Spectroscopy,
Drexel University, Philadelphia, Pennsylvania (2012). [14] S. C. Bunce, M. Izzetoglu, K. Izzetoglu, B. Onaral, and K. Pourrezaei,
“Functional near-infrared spectroscopy,” IEEE Eng. Med. Biol. Mag. 254,
54–62 2006. [15] Savage S. R., Kirsh K. L., Passik S. D. (2008). Challenges in using opioids
to treat pain in persons with substance use disorders. Addict. Sci. Clin. Prac.
4, 4–25.

37
[16] Teikari P, Najjar RP, Malkki H, Knoblauch K, Dumortier D, et al. (2012)
An inexpensive Arduino-based LED stimulator system for vision research.
Journal of Neuroscience Methods [17] Z. Barati et al., “Hemodynamic response to repeated noxious cold pressor
tests measured by functional near infrared spectroscopy on forehead,” Ann.
Biomed. Eng. 41(2), 223–237 (2013). [18] Z. Barati, Monitoring and Analysis of Hemodynamic Response to Cold
Noxious Stimuli Using Functional Near Infrared Spectroscopy, Drexel
University, Philadelphia, Pennsylvania (2013).

38
APPENDIX A: DATASHEET OF AVR ARDUINO MICROCONTROLLER

39
APPENDIX B-1: ARDUINO IDE CODE TO TEST POTENTIOMETER
const int ledPin1 = DAC0; // 730 (green)
const int ledPin2 = DAC1; // 850 (orange)
const int sensorPin1 = A0; // near
const int sensorPin2 = A1; // far1
const int sensorPin3 = A2; // far2
const int dly = 500;
const int ledValue1 = 255; // far(165)
const int ledValue2 = 100; // far(120)
int sensorValue1 = 0;
int sensorValue2 = 0;
int sensorValue3 = 0;
int t = 0;
const int n_bits = 12;
void setup()
{
Serial.begin(9600);
pinMode(ledPin1, OUTPUT);
pinMode(ledPin2, OUTPUT);
pinMode(sensorPin1, INPUT);
pinMode(sensorPin2, INPUT);
analogWrite(ledPin1, 0);
analogWrite(ledPin2, 0);
}
void loop()
{
analogReadResolution(n_bits); // The resolution is 12 bit
Serial.print(millis());
analogWrite(ledPin1, 0);
analogWrite(ledPin2, ledValue2); // Turn OFF 730nm LED
Serial.print(',');
Serial.print(analogRead(sensorPin1));
Serial.print(',');
Serial.print(analogRead(sensorPin2));
Serial.print(',');
Serial.println(analogRead(sensorPin3));
}

40
APPENDIX B-2: ARDUINO IDE CODE TO INCREMENT LED 730 NM
const int ledPin1 = DAC1; // 730 (green)
const int ledPin2 = DAC0; // 850 (orange)
const int sensorPin1 = A0; // near
const int sensorPin2 = A1; // far1
const int sensorPin3 = A2; // far2
const int dly = 100;
int ledValue1 = 0; // far(165)
int ledValue2 = 0; // far(120)
int sensorValue1 = 0;
int sensorValue2 = 0;
int sensorValue3 = 0;
int t = 0;
const int n_bits = 12;
void setup()
{
Serial.begin(9600);
pinMode(ledPin1, OUTPUT);
pinMode(ledPin2, OUTPUT);
pinMode(sensorPin1, INPUT);
pinMode(sensorPin2, INPUT);
analogWrite(ledPin1, 0);
analogWrite(ledPin2, 0);
}
void loop()
{
analogReadResolution(n_bits); // The resolution is 12 bit
Serial.print(millis());
analogWrite(ledPin1, ledValue1); // Turn ON 730nm LED
Serial.print(',');
Serial.print(analogRead(sensorPin1));
Serial.print(',');
Serial.print(analogRead(sensorPin2));
Serial.print(',');
Serial.println(analogRead(sensorPin3));
ledValue1 = ++ledValue1;
delay(dly);
}

41
APPENDIX B-3: ARDUINO IDE CODE TO INCREMENT LED 850 NM
const int ledPin1 = DAC0; // 730 (green)
const int ledPin2 = DAC1; // 850 (orange)
const int sensorPin1 = A0; // near
const int sensorPin2 = A1; // far1
const int sensorPin3 = A2; // far2
const int dly = 100;
const int ledValue1 = 255; // far(165)
int ledValue2 = 0; // far(120)
int sensorValue1 = 0;
int sensorValue2 = 0;
int sensorValue3 = 0;
int t = 0;
const int n_bits = 12;
void setup()
{
Serial.begin(9600);
pinMode(ledPin1, OUTPUT);
pinMode(ledPin2, OUTPUT);
pinMode(sensorPin1, INPUT);
pinMode(sensorPin2, INPUT);
analogWrite(ledPin1, 0);
analogWrite(ledPin2, 0);
}
void loop()
{
analogReadResolution(n_bits); // The resolution is 12 bit
Serial.print(millis());
analogWrite(ledPin2, ledValue2); // Turn ON 730nm LED
Serial.print(',');
Serial.print(analogRead(sensorPin1));
Serial.print(',');
Serial.print(analogRead(sensorPin2));
Serial.print(',');
Serial.println(analogRead(sensorPin3));
ledValue2 = ++ledValue2;
delay(dly);
}

42
APPENDIX B-4: ARDUINO IDE CODE TEST FREQUENCY LED 730 NM
const int ledPin1 = DAC0; // 730 (green)
const int ledPin2 = DAC1; // 850 (orange)
const int sensorPin1 = A0; // near
const int sensorPin2 = A1; // far1
const int sensorPin3 = A2; // far2
const int dly = 500;
const int ledValue1 = 255; // far(165)
const int ledValue2 = 100; // far(120)
int sensorValue1 = 0;
int sensorValue2 = 0;
int sensorValue3 = 0;
int t = 0;
const int n_bits = 12;
void setup()
{
Serial.begin(9600);
pinMode(ledPin1, OUTPUT);
pinMode(ledPin2, OUTPUT);
pinMode(sensorPin1, INPUT);
pinMode(sensorPin2, INPUT);
analogWrite(ledPin1, 0);
analogWrite(ledPin2, 0);
}
void loop()
{
analogReadResolution(n_bits); // The resolution is 12 bit
Serial.print(t / 1000);
analogWrite(ledPin1, ledValue1); // Turn ON 730nm LED
analogWrite(ledPin2, 0);
delay(dly);
Serial.print(',');
Serial.print(analogRead(sensorPin1));
Serial.print(',');
Serial.print(analogRead(sensorPin2));
Serial.print(',');
Serial.print(analogRead(sensorPin3));
delay(dly);
analogWrite(ledPin1, 0);

43
analogWrite(ledPin2, ledValue2); // Turn OFF 730nm LED
Serial.print(',');
Serial.print(analogRead(sensorPin1));
Serial.print(',');
Serial.print(analogRead(sensorPin2));
Serial.print(',');
Serial.print(analogRead(sensorPin3));
delay(dly);
analogWrite(ledPin1, ledValue1); // Turn ON 730nm LED
analogWrite(ledPin2, ledValue2); // Turn OFF 730nm LED
Serial.print(',');
Serial.print(analogRead(sensorPin1));
Serial.print(',');
Serial.print(analogRead(sensorPin2));
Serial.print(',');
Serial.println(analogRead(sensorPin3));
delay(dly);
t = t + dly*4;
}

44
APPENDIX B-5: ARDUINO IDE CODE TEST FREQUENCY LED 850 NM
const int ledPin1 = 7; // 730 (green)
const int ledPin2 = 8; // 850 (orange)
const int sensorPin1 = A8; // near
const int sensorPin2 = A9; // far1
const int sensorPin3 = A10; // far2
const int dly = 500;
const int ledValue1 = 255; // far(165)
const int ledValue2 = 100; // far(120)
int sensorValue1 = 0;
int sensorValue2 = 0;
int sensorValue3 = 0;
int t = 0;
const int n_bits = 12;
void setup()
{
Serial.begin(9600);
pinMode(ledPin1, OUTPUT);
pinMode(ledPin2, OUTPUT);
pinMode(sensorPin1, INPUT);
pinMode(sensorPin2, INPUT);
}
void loop()
{
analogReadResolution(n_bits); // The resolution is 12 bit
Serial.print(millis()/1000);
digitalWrite(ledPin1, 0); // Turn ON 730nm LED
digitalWrite(ledPin2, 1);
Serial.print(',');
Serial.print(analogRead(sensorPin1));
Serial.print(',');
Serial.print(analogRead(sensorPin2));
Serial.print(',');
Serial.println(analogRead(sensorPin3));
delay(dly);
Serial.print(millis()/1000);
digitalWrite(ledPin2, 0);
Serial.print(',');
Serial.print(analogRead(sensorPin1));

45
Serial.print(',');
Serial.print(analogRead(sensorPin2));
Serial.print(',');
Serial.println(analogRead(sensorPin3));
delay(dly);
}

46
APPENDIX C: CIRCUIT CONNECTIONS FOR CONTROL CIRCUIT TO
PROBE

47
APPENDIX D: CHANGING RESPONSIVITY OF PHOTODETECTOR; OPT101
DATASHEET

48