Embed Size (px)
Citation preview
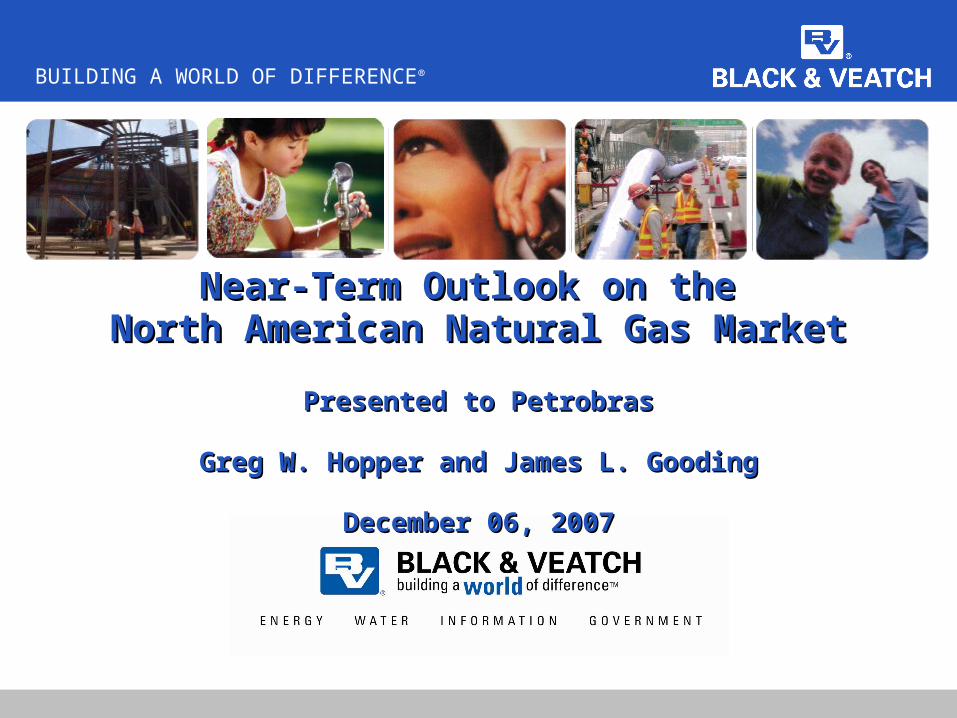
BUILDING A WORLD OF DIFFERENCE®
Near-Term Outlook on the Near-Term Outlook on the North American Natural Gas MarketNorth American Natural Gas Market
Presented to PetrobrasPresented to Petrobras
Greg W. Hopper and James L. GoodingGreg W. Hopper and James L. Gooding
December 06, 2007December 06, 2007
BUILDING A WORLD OF DIFFERENCE®
2 December 06, 2007
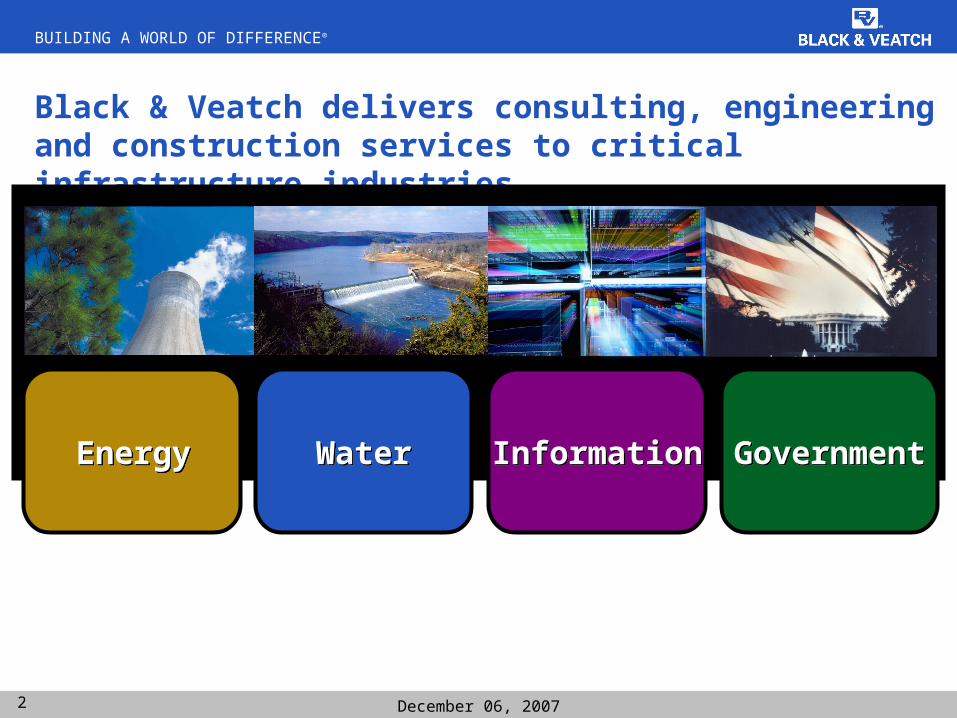
Black & Veatch delivers consulting, engineering and construction services to critical infrastructure industries
EnergyEnergy WaterWater InformationInformation GovernmentGovernment
BUILDING A WORLD OF DIFFERENCE®
3 December 06, 2007
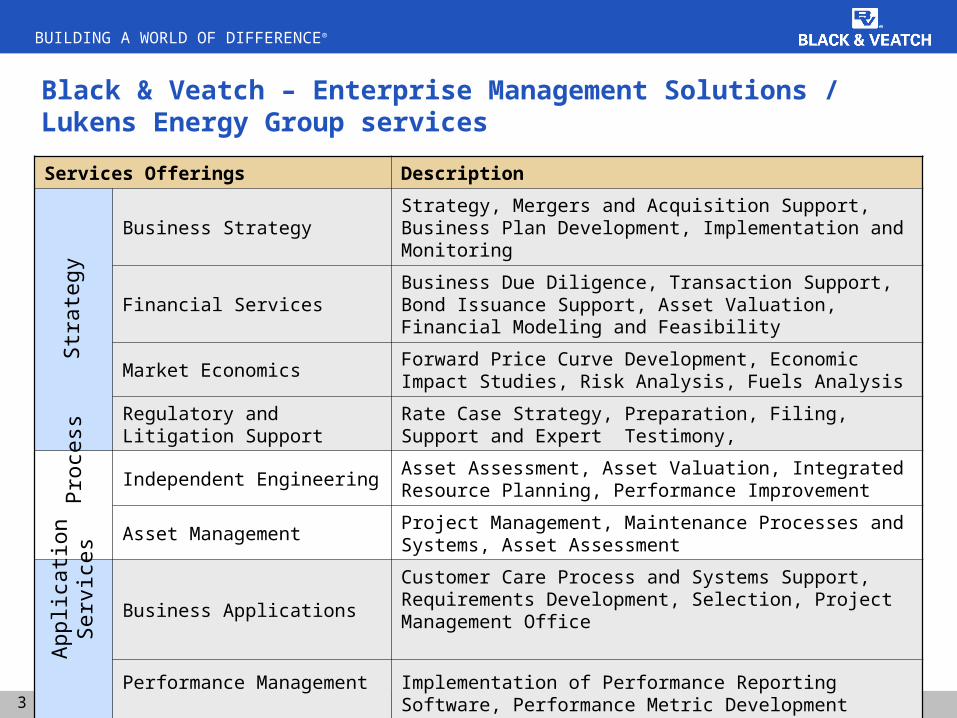
Services Offerings Description
Business StrategyStrategy, Mergers and Acquisition Support, Business Plan Development, Implementation and Monitoring
Financial ServicesBusiness Due Diligence, Transaction Support, Bond Issuance Support, Asset Valuation, Financial Modeling and Feasibility
Market EconomicsForward Price Curve Development, Economic Impact Studies, Risk Analysis, Fuels Analysis
Regulatory and Litigation Support
Rate Case Strategy, Preparation, Filing, Support and Expert Testimony,
Independent EngineeringAsset Assessment, Asset Valuation, Integrated Resource Planning, Performance Improvement
Asset ManagementProject Management, Maintenance Processes and Systems, Asset Assessment
Business ApplicationsCustomer Care Process and Systems Support, Requirements Development, Selection, Project Management Office
Performance Management Implementation of Performance Reporting Software, Performance Metric Development
Str
ateg
yP
roce
ssA
pplic
atio
nS
ervi
ces
Black & Veatch – Enterprise Management Solutions / Lukens Energy Group services
BUILDING A WORLD OF DIFFERENCE®
4 December 06, 2007
Today’s Discussion
North American Demand Projections
Supply Response to Rising Prices
Realigning Midstream Infrastructure
Natural Gas Prices
Natural Gas Storage
Signposts Beyond the Near-term
BUILDING A WORLD OF DIFFERENCE®
5 December 06, 2007
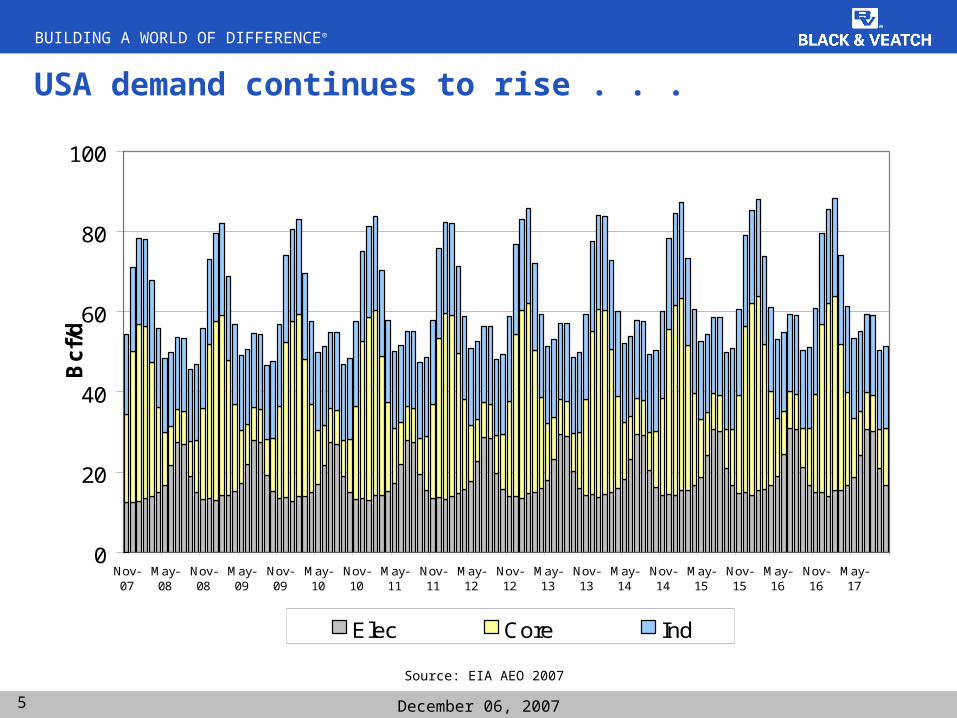
USA demand continues to rise . . .
Source: EIA AEO 2007
0
20
40
60
80
100
Nov-07
May-08
Nov-08
May-09
Nov-09
May-10
Nov-10
May-11
Nov-11
May-12
Nov-12
May-13
Nov-13
May-14
Nov-14
May-15
Nov-15
May-16
Nov-16
May-17
Bcf/
d
Elec Core Ind
BUILDING A WORLD OF DIFFERENCE®
6 December 06, 2007
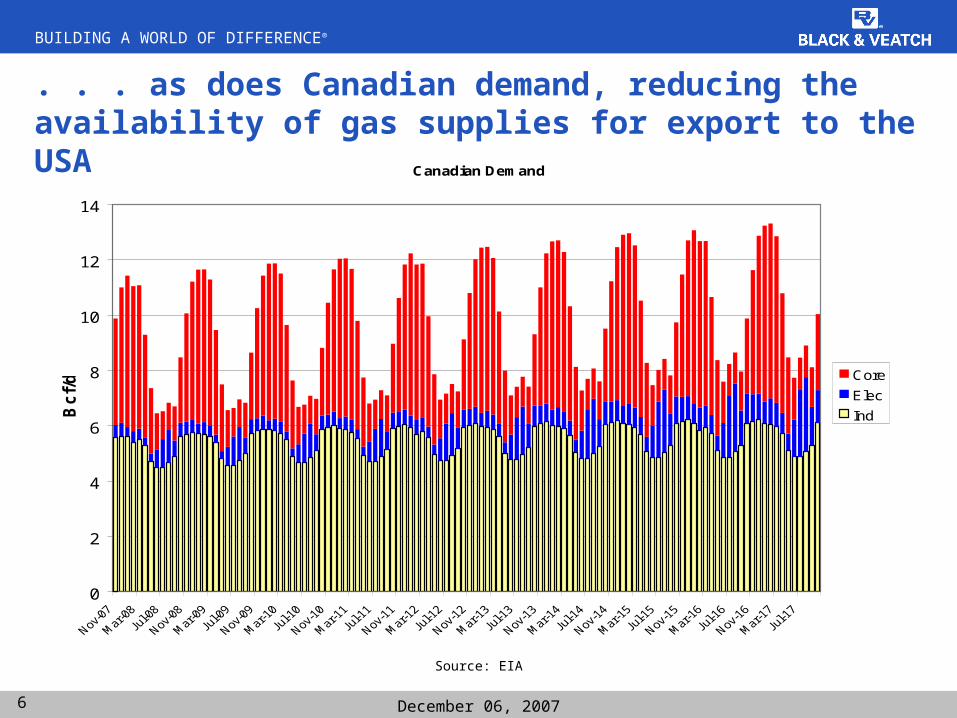
. . . as does Canadian demand, reducing the availability of gas supplies for export to the USA
Canadian Demand
0
2
4
6
8
10
12
14
Bc
f/d Core
Elec
Ind
Source: EIA
BUILDING A WORLD OF DIFFERENCE®
7 December 06, 2007
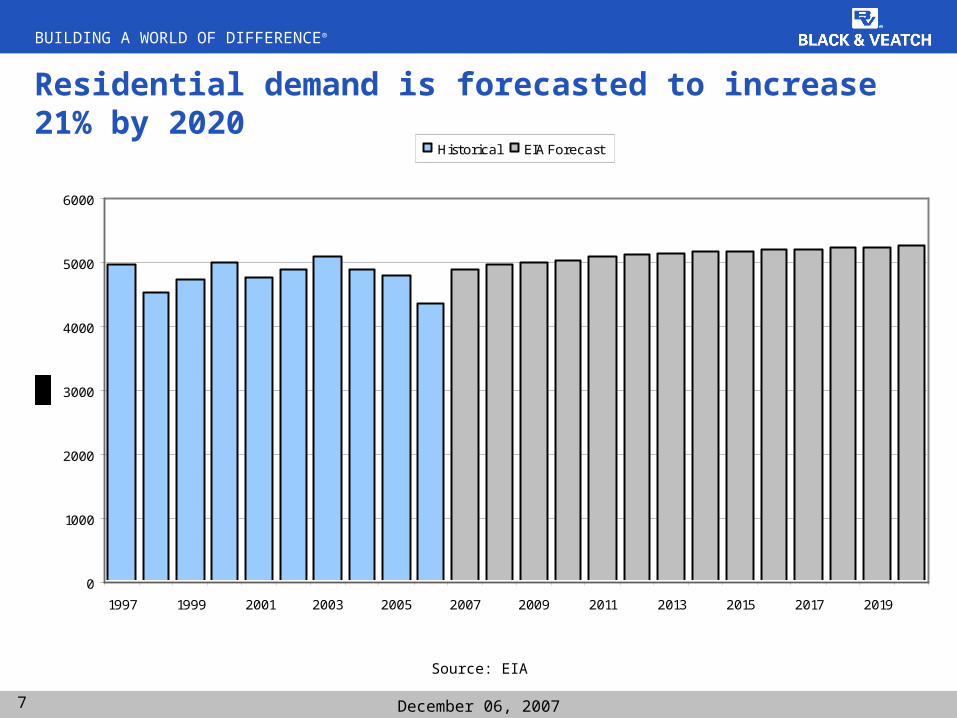
Residential demand is forecasted to increase 21% by 2020
Source: EIA
0
1000
2000
3000
4000
5000
6000
1997 1999 2001 2003 2005 2007 2009 2011 2013 2015 2017 2019
Historical EIA Forecast
BUILDING A WORLD OF DIFFERENCE®
8 December 06, 2007
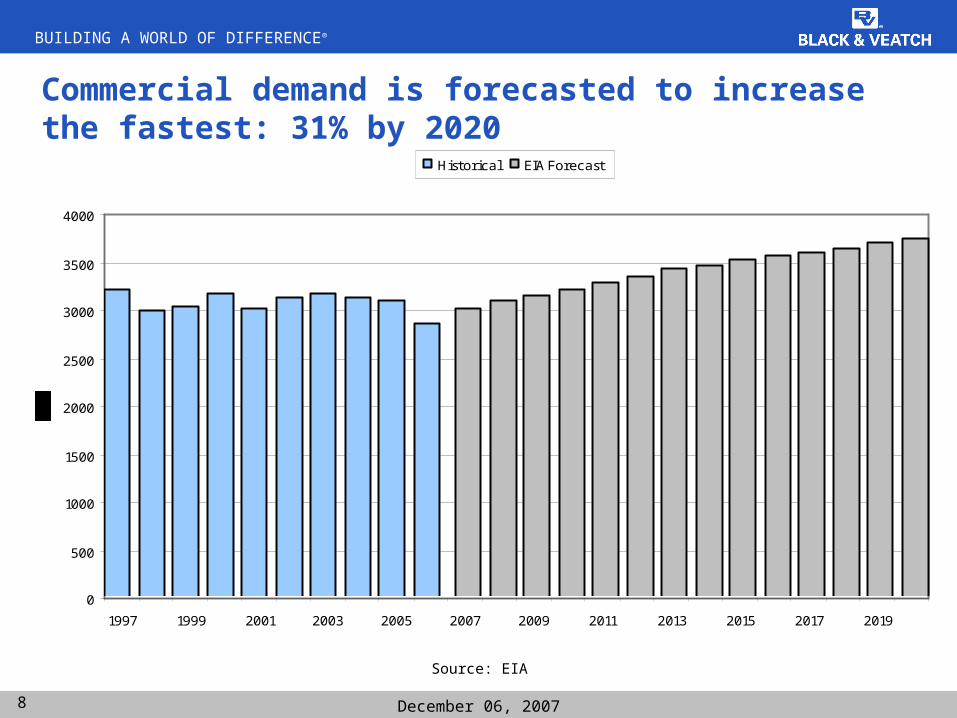
Commercial demand is forecasted to increase the fastest: 31% by 2020
Source: EIA
0
500
1000
1500
2000
2500
3000
3500
4000
1997 1999 2001 2003 2005 2007 2009 2011 2013 2015 2017 2019
Historical EIA Forecast
BUILDING A WORLD OF DIFFERENCE®
9 December 06, 2007
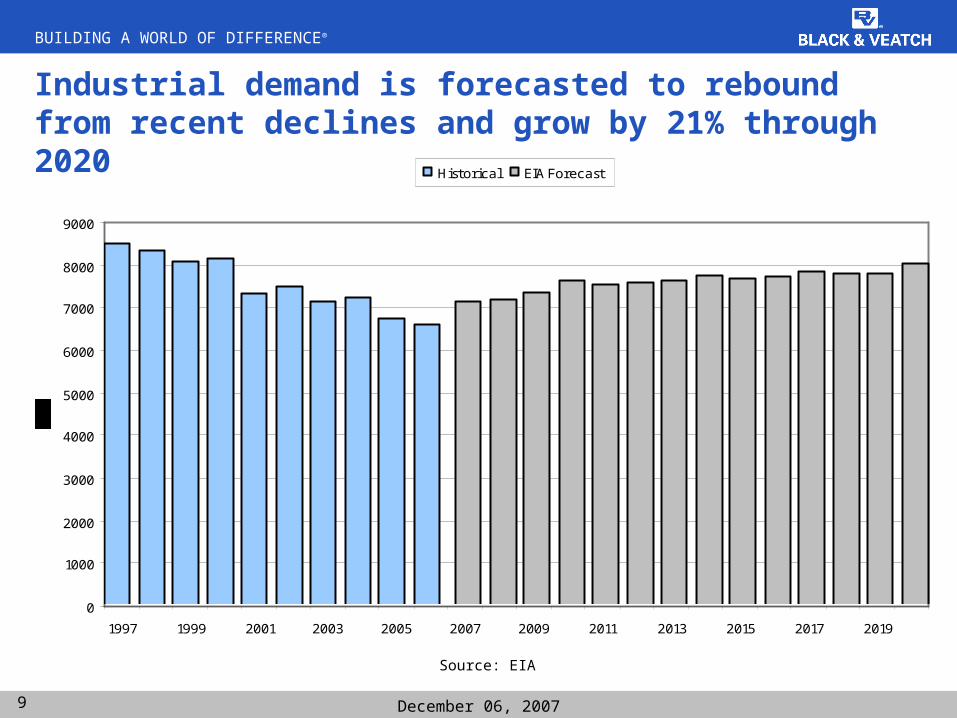
Industrial demand is forecasted to rebound from recent declines and grow by 21% through 2020
Source: EIA
0
1000
2000
3000
4000
5000
6000
7000
8000
9000
1997 1999 2001 2003 2005 2007 2009 2011 2013 2015 2017 2019
Historical EIA Forecast
BUILDING A WORLD OF DIFFERENCE®
10 December 06, 2007
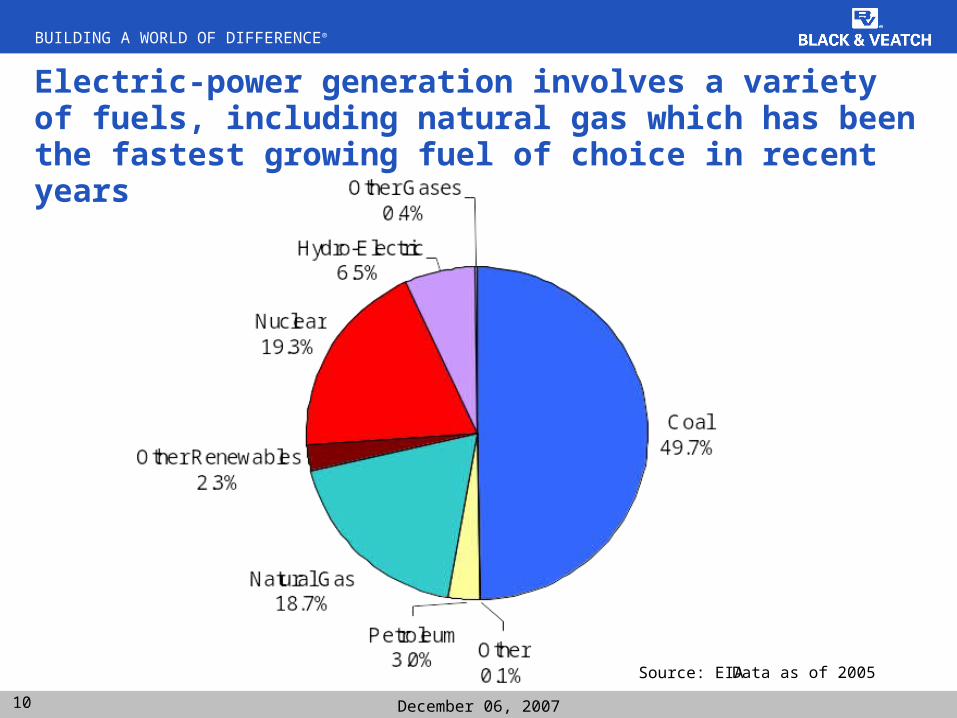
Electric-power generation involves a variety of fuels, including natural gas which has been the fastest growing fuel of choice in recent years
Source: EIA Data as of 2005
BUILDING A WORLD OF DIFFERENCE®
11 December 06, 2007
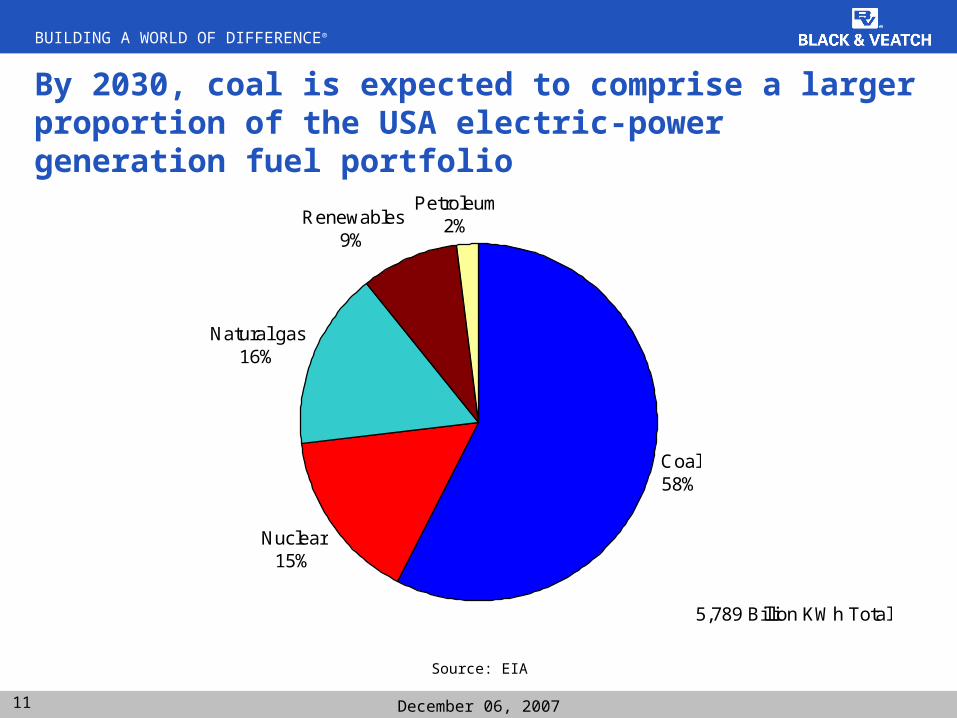
By 2030, coal is expected to comprise a larger proportion of the USA electric-power generation fuel portfolio
Source: EIA
5,789 Billion KWh Total
Coal58%
Nuclear15%
Natural gas16%
Renewables9%
Petroleum2%
BUILDING A WORLD OF DIFFERENCE®
12 December 06, 2007
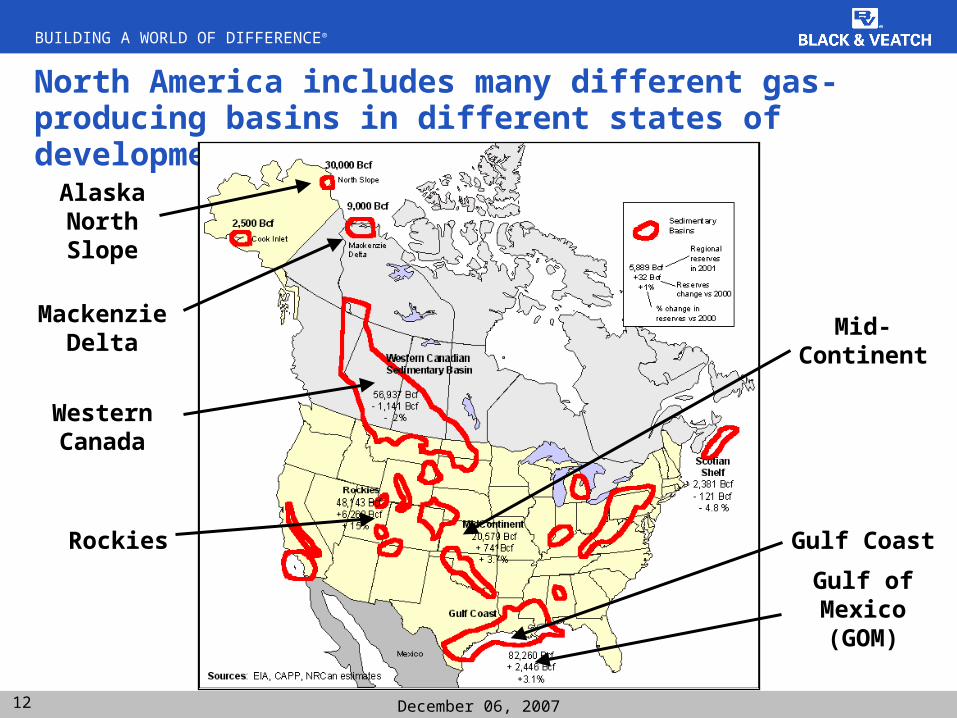
North America includes many different gas-producing basins in different states of development
Mackenzie Delta
Alaska North Slope
Western Canada
Rockies
Mid-Continent
Gulf Coast
Gulf of Mexico (GOM)
BUILDING A WORLD OF DIFFERENCE®
13 December 06, 2007
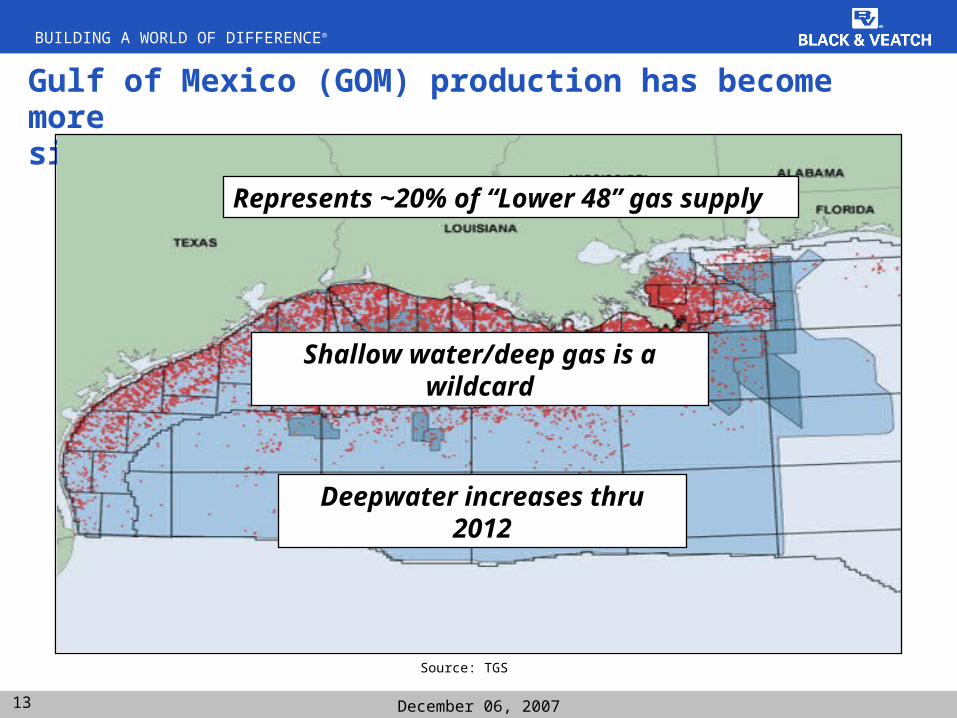
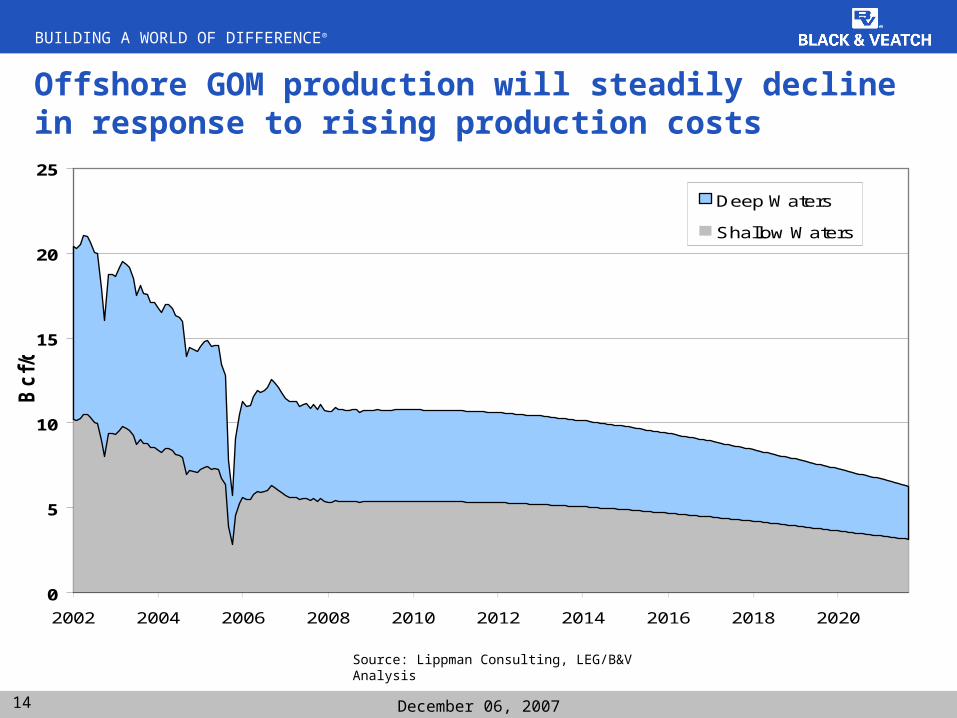
Gulf of Mexico (GOM) production has become more significant and complex
Source: TGS
Represents ~20% of “Lower 48” gas supply
Deepwater increases thru 2012
Shallow water/deep gas is a wildcard
BUILDING A WORLD OF DIFFERENCE®
14 December 06, 2007
Offshore GOM production will steadily decline in response to rising production costs
0
5
10
15
20
25
2002 2004 2006 2008 2010 2012 2014 2016 2018 2020
Bc
f/d
Deep Waters
Shallow Waters
Source: Lippman Consulting, LEG/B&V Analysis
BUILDING A WORLD OF DIFFERENCE®
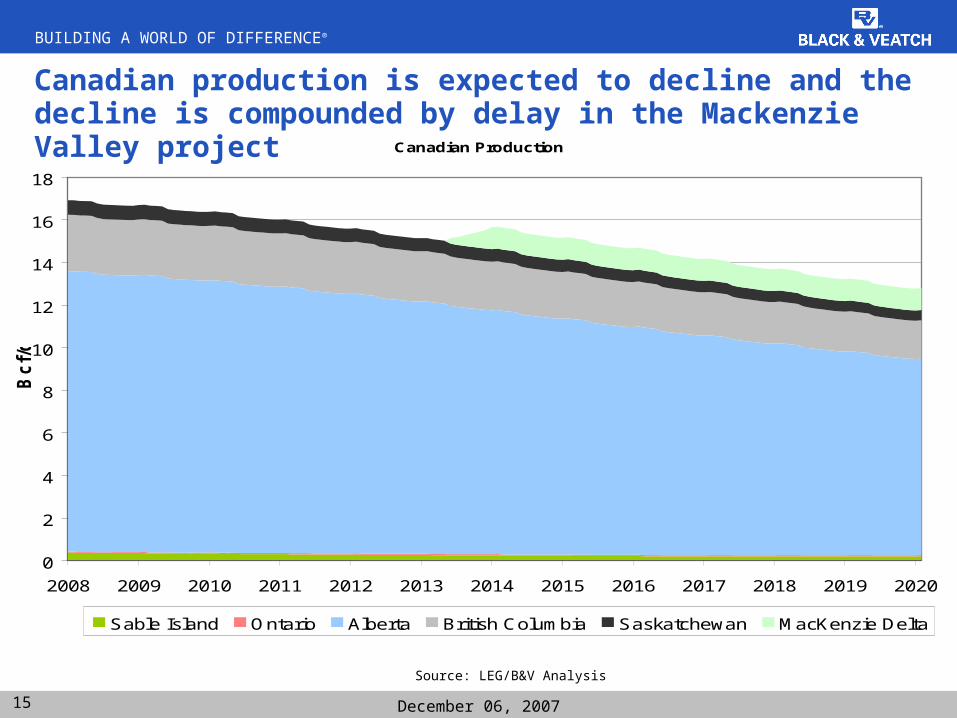
15 December 06, 2007
Canadian production is expected to decline and the decline is compounded by delay in the Mackenzie Valley project
Canadian Production
0
2
4
6
8
10
12
14
16
18
2008 2009 2010 2011 2012 2013 2014 2015 2016 2017 2018 2019 2020
Bc
f/d
Sable Island Ontario Alberta British Columbia Saskatchewan MacKenzie Delta
Source: LEG/B&V Analysis
BUILDING A WORLD OF DIFFERENCE®
16 December 06, 2007
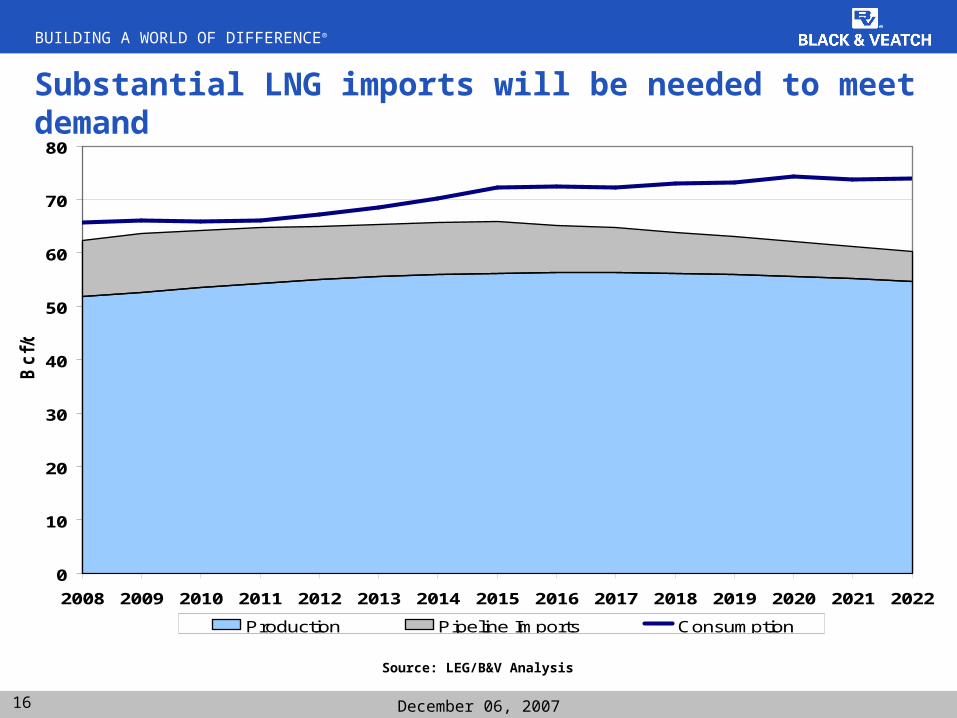
Substantial LNG imports will be needed to meet demand
0
10
20
30
40
50
60
70
80
2008 2009 2010 2011 2012 2013 2014 2015 2016 2017 2018 2019 2020 2021 2022
Bc
f/d
Production Pipeline Imports Consumption
Source: LEG/B&V Analysis
BUILDING A WORLD OF DIFFERENCE®
17 December 06, 2007
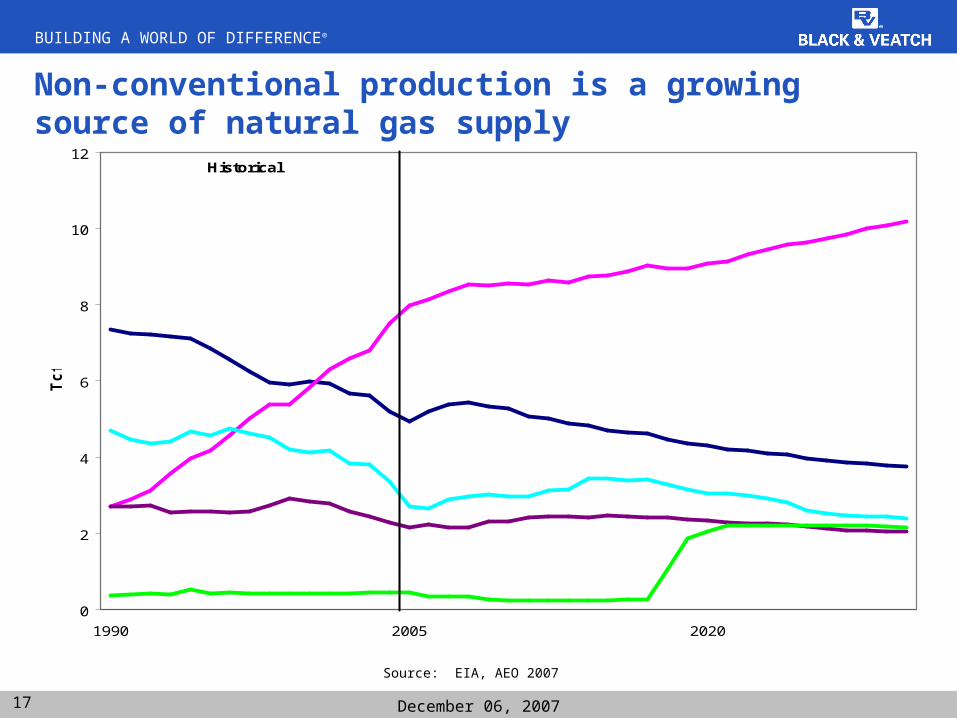
Non-conventional production is a growing source of natural gas supply
0
2
4
6
8
10
12
1990 2005 2020
Tc
f
Historical Projections
Lower 48 NA unconventional
Lower 48 NA conventional onshore
Lower 48 NA offshore
Lower 48 AD
Alaska
Source: EIA, AEO 2007
BUILDING A WORLD OF DIFFERENCE®
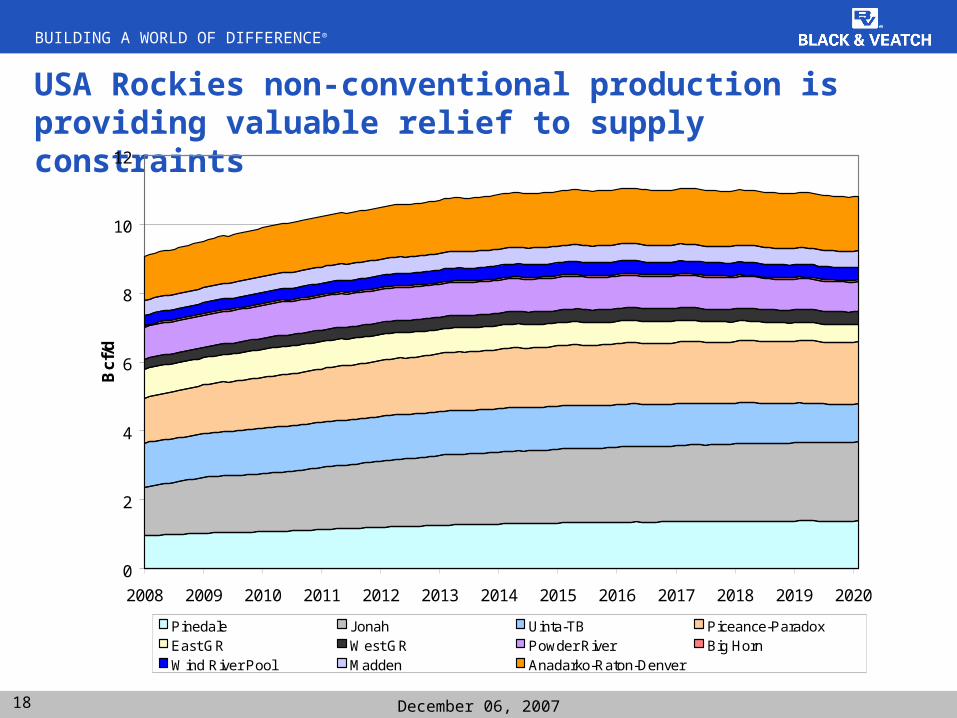
18 December 06, 2007
USA Rockies non-conventional production is providing valuable relief to supply constraints
0
2
4
6
8
10
12
2008 2009 2010 2011 2012 2013 2014 2015 2016 2017 2018 2019 2020
Bcf
/d
Pinedale Jonah Uinta-TB Piceance-ParadoxEast GR West GR Powder River Big HornWind River Pool Madden Anadarko-Raton-Denver
BUILDING A WORLD OF DIFFERENCE®
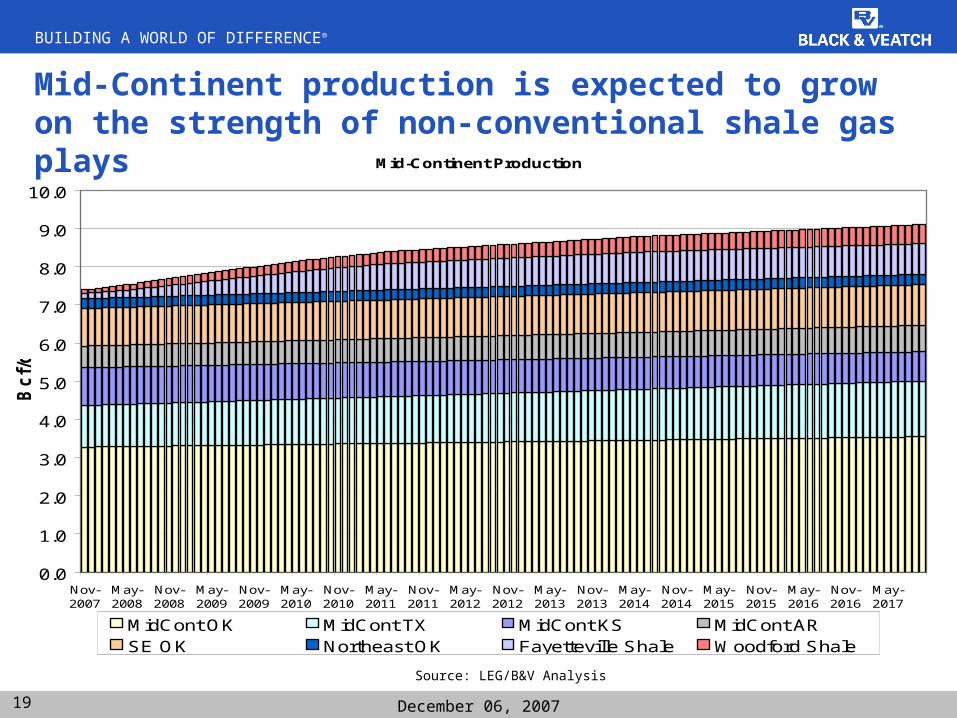
19 December 06, 2007
Mid-Continent production is expected to grow on the strength of non-conventional shale gas plays
Mid-Continent Production
0.0
1.0
2.0
3.0
4.0
5.0
6.0
7.0
8.0
9.0
10.0
Nov-2007
May-2008
Nov-2008
May-2009
Nov-2009
May-2010
Nov-2010
May-2011
Nov-2011
May-2012
Nov-2012
May-2013
Nov-2013
May-2014
Nov-2014
May-2015
Nov-2015
May-2016
Nov-2016
May-2017
Bc
f/d
MidCont OK MidCont TX MidCont KS MidCont ARSE OK Northeast OK Fayetteville Shale Woodford Shale
Source: LEG/B&V Analysis
BUILDING A WORLD OF DIFFERENCE®
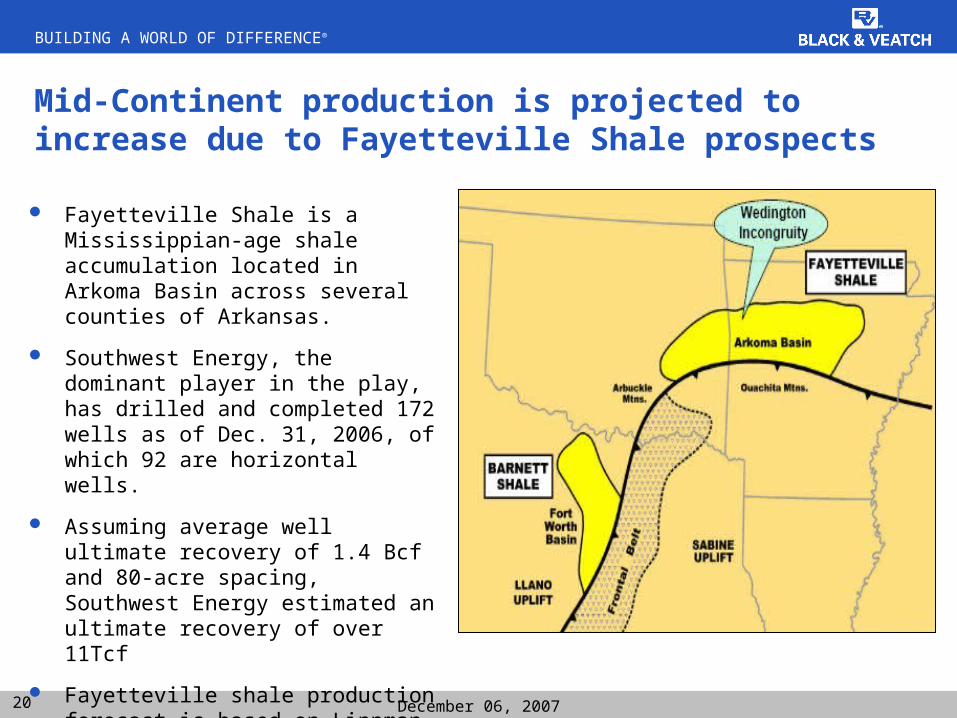
20 December 06, 2007
Mid-Continent production is projected to increase due to Fayetteville Shale prospects
Fayetteville Shale is a Mississippian-age shale accumulation located in Arkoma Basin across several counties of Arkansas.
Southwest Energy, the dominant player in the play, has drilled and completed 172 wells as of Dec. 31, 2006, of which 92 are horizontal wells.
Assuming average well ultimate recovery of 1.4 Bcf and 80-acre spacing, Southwest Energy estimated an ultimate recovery of over 11Tcf
Fayetteville shale production forecast is based on Lippman Consulting projections and an assumed growth rate
BUILDING A WORLD OF DIFFERENCE®
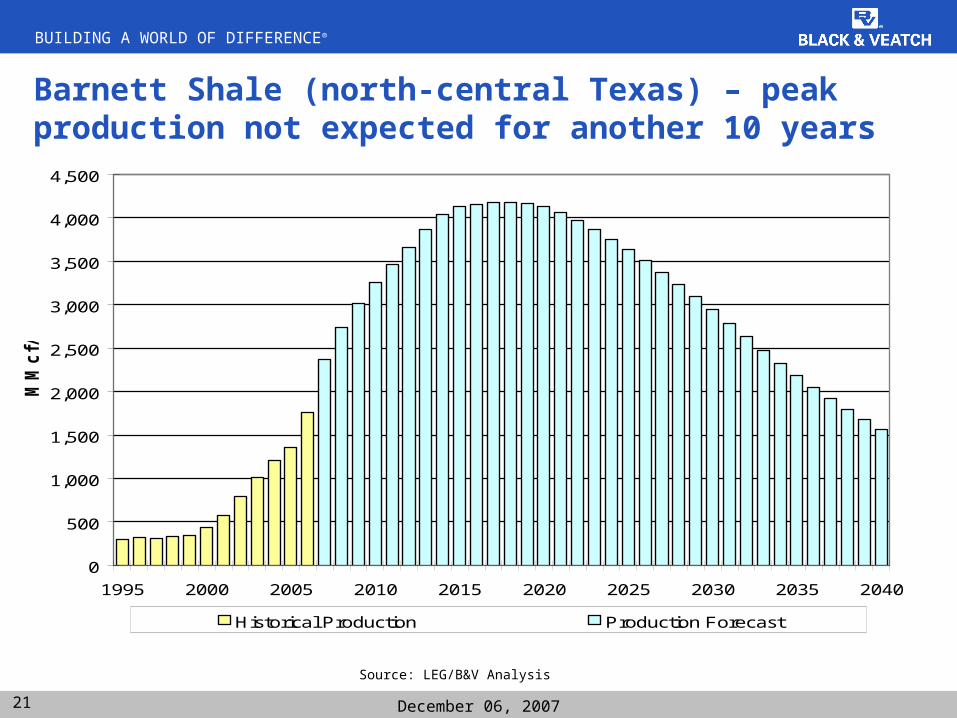
21 December 06, 2007
Barnett Shale (north-central Texas) – peak production not expected for another 10 years
0
500
1,000
1,500
2,000
2,500
3,000
3,500
4,000
4,500
1995 2000 2005 2010 2015 2020 2025 2030 2035 2040
MM
cf/
d
Historical Production Production Forecast
Source: LEG/B&V Analysis
BUILDING A WORLD OF DIFFERENCE®
22 December 06, 2007
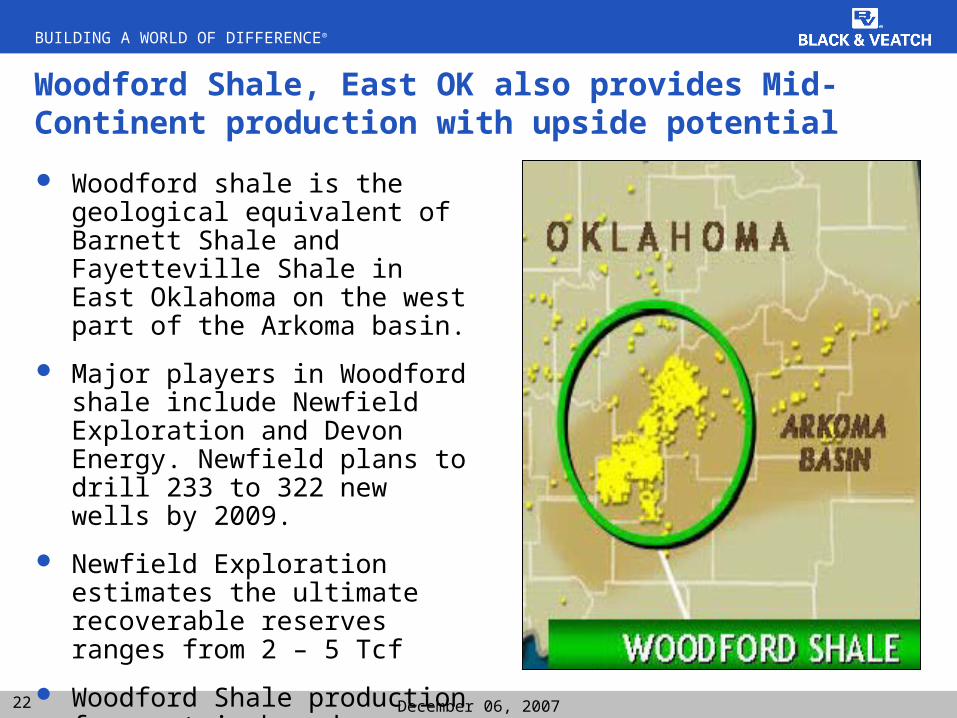
Woodford Shale, East OK also provides Mid-Continent production with upside potential
Woodford shale is the geological equivalent of Barnett Shale and Fayetteville Shale in East Oklahoma on the west part of the Arkoma basin.
Major players in Woodford shale include Newfield Exploration and Devon Energy. Newfield plans to drill 233 to 322 new wells by 2009.
Newfield Exploration estimates the ultimate recoverable reserves ranges from 2 – 5 Tcf
Woodford Shale production forecast is based on Lippman Consulting projections
BUILDING A WORLD OF DIFFERENCE®
23 December 06, 2007
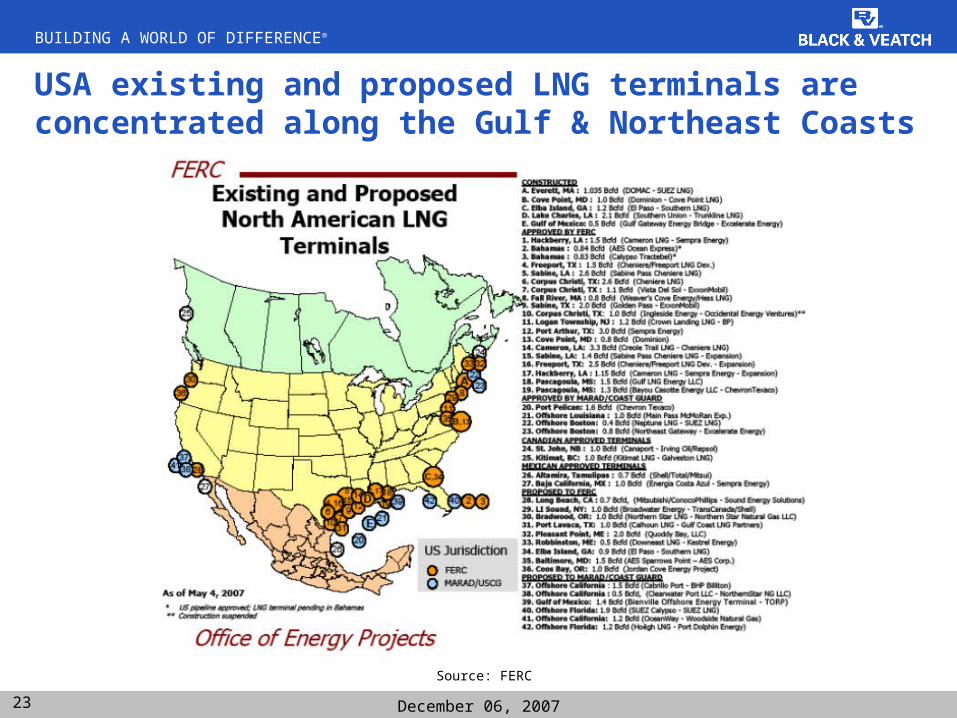
USA existing and proposed LNG terminals are concentrated along the Gulf & Northeast Coasts
Source: FERC
BUILDING A WORLD OF DIFFERENCE®
24 December 06, 2007
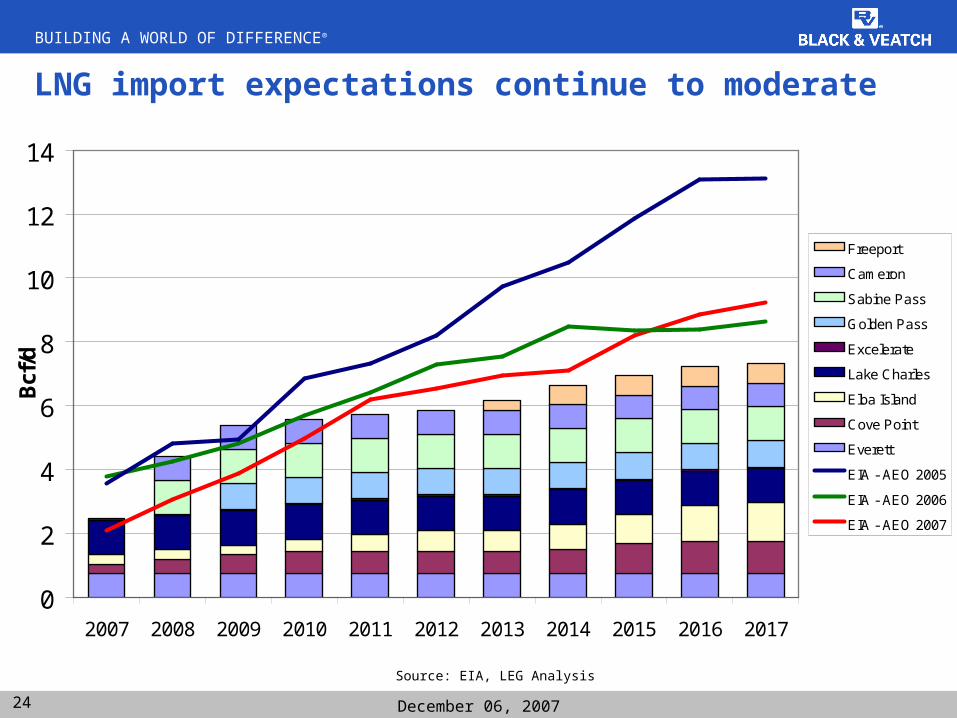
0
2
4
6
8
10
12
14
2007 2008 2009 2010 2011 2012 2013 2014 2015 2016 2017
Bcf
/d
Freeport
Cameron
Sabine Pass
Golden Pass
Excelerate
Lake Charles
Elba Island
Cove Point
Everett
EIA - AEO 2005
EIA - AEO 2006
EIA - AEO 2007
LNG import expectations continue to moderate
Source: EIA, LEG Analysis
BUILDING A WORLD OF DIFFERENCE®
25 December 06, 2007
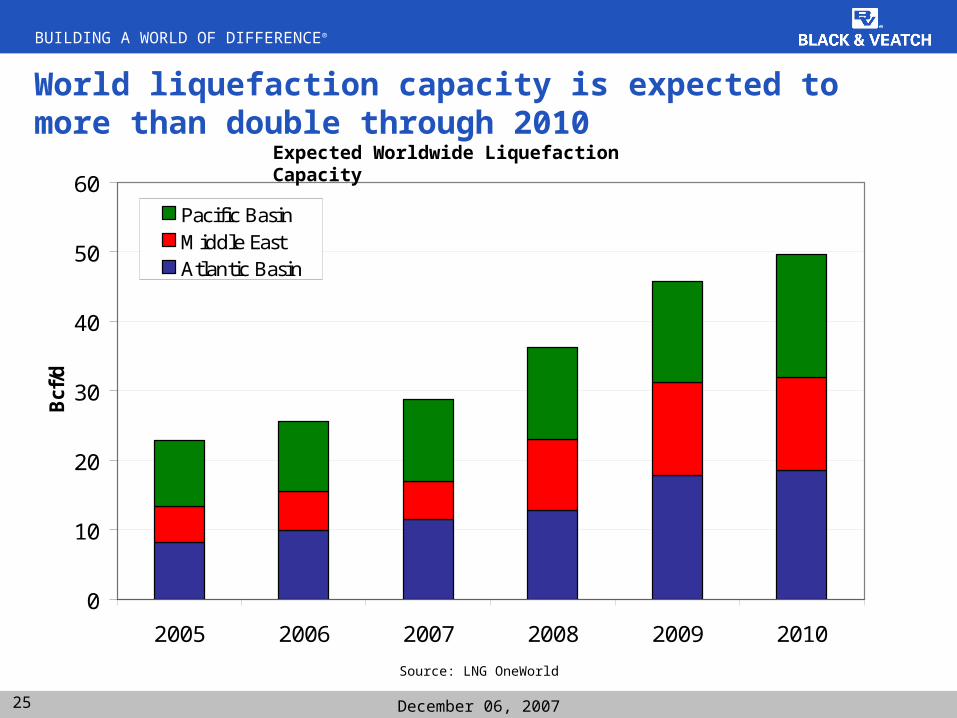
World liquefaction capacity is expected to more than double through 2010
0
10
20
30
40
50
60
2005 2006 2007 2008 2009 2010
Bcf
/d
Pacific BasinMiddle EastAtlantic Basin
Source: LNG OneWorld
Expected Worldwide Liquefaction Capacity
BUILDING A WORLD OF DIFFERENCE®
26 December 06, 2007
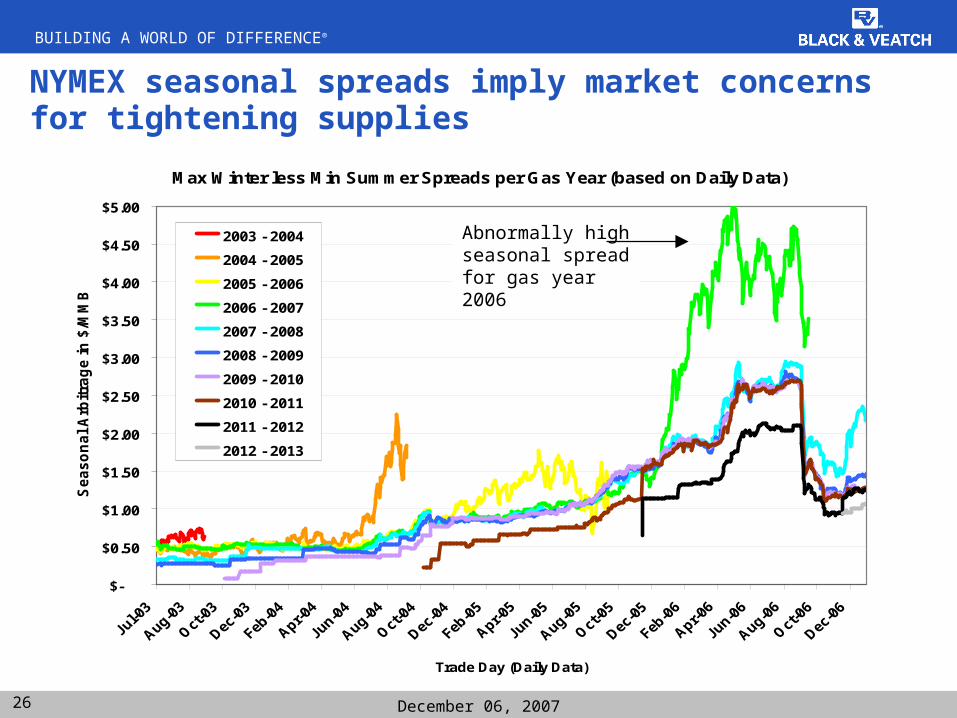
NYMEX seasonal spreads imply market concerns for tightening supplies
Max Winter less Min Summer Spreads per Gas Year (based on Daily Data)
$-
$0.50
$1.00
$1.50
$2.00
$2.50
$3.00
$3.50
$4.00
$4.50
$5.00
Trade Day (Daily Data)
Se
as
on
al
Arb
itra
ge
in
$/M
MB
tu
2003 - 2004
2004 - 2005
2005 - 2006
2006 - 2007
2007 - 2008
2008 - 2009
2009 - 2010
2010 - 2011
2011 - 2012
2012 - 2013
Abnormally high seasonal spreadfor gas year 2006
BUILDING A WORLD OF DIFFERENCE®
27 December 06, 2007
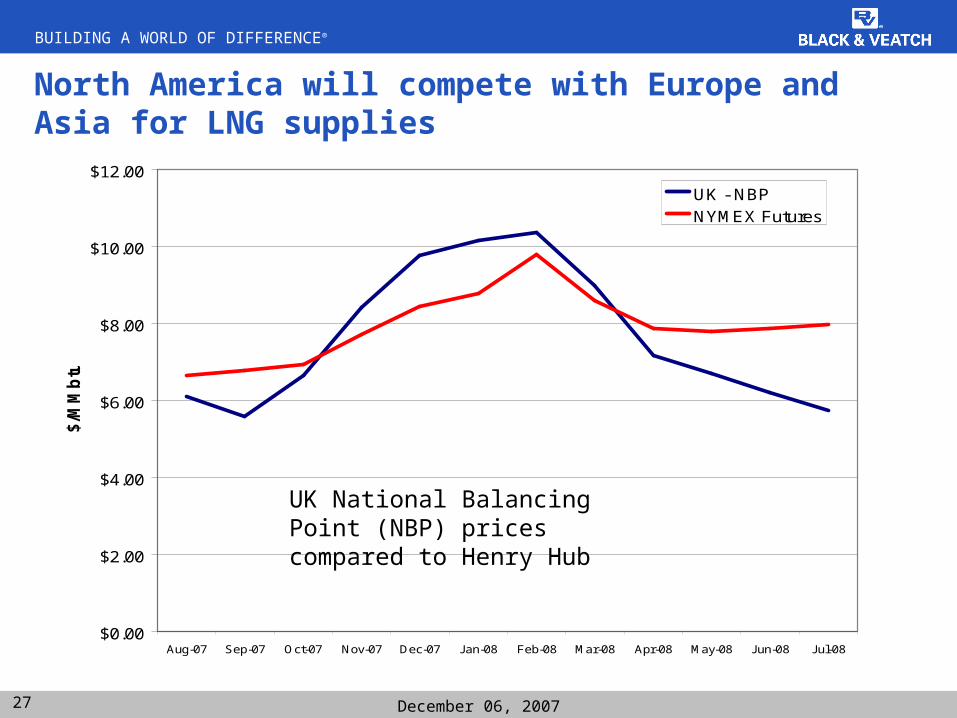
North America will compete with Europe and Asia for LNG supplies
$0.00
$2.00
$4.00
$6.00
$8.00
$10.00
$12.00
Aug-07 Sep-07 Oct-07 Nov-07 Dec-07 Jan-08 Feb-08 Mar-08 Apr-08 May-08 Jun-08 Jul-08
$/M
Mb
tu
UK - NBPNYMEX Futures
UK National Balancing Point (NBP) prices compared to Henry Hub
BUILDING A WORLD OF DIFFERENCE®
28 December 06, 2007
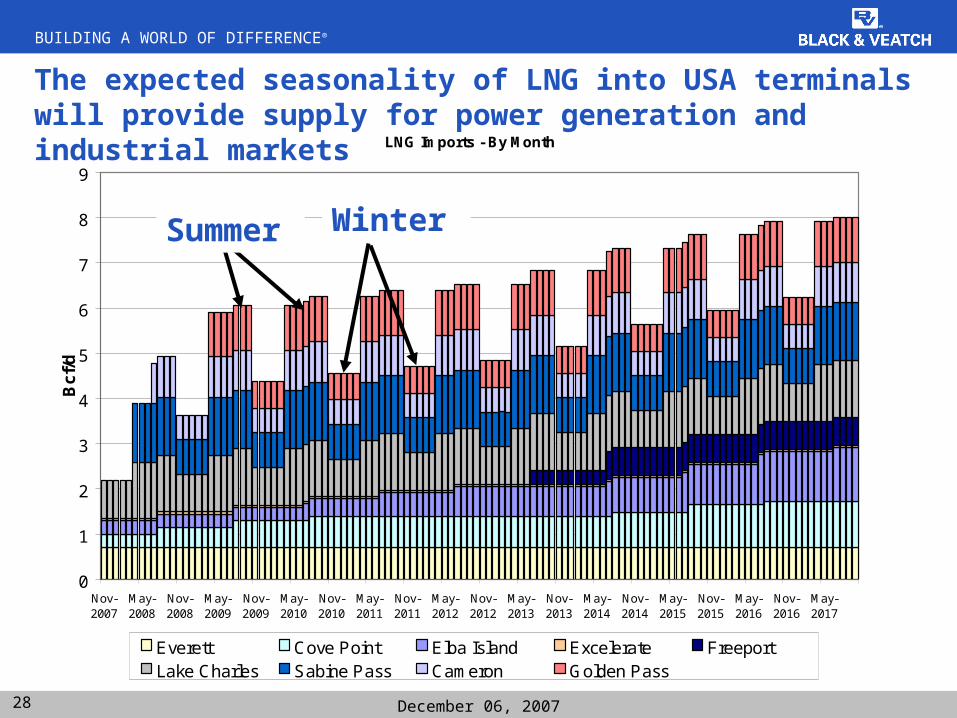
The expected seasonality of LNG into USA terminals will provide supply for power generation and industrial markets
LNG Imports - By Month
0
1
2
3
4
5
6
7
8
9
Nov-2007
May-2008
Nov-2008
May-2009
Nov-2009
May-2010
Nov-2010
May-2011
Nov-2011
May-2012
Nov-2012
May-2013
Nov-2013
May-2014
Nov-2014
May-2015
Nov-2015
May-2016
Nov-2016
May-2017
Bcf
/d
Everett Cove Point Elba Island Excelerate FreeportLake Charles Sabine Pass Cameron Golden Pass
WinterSummer
BUILDING A WORLD OF DIFFERENCE®
29 December 06, 2007
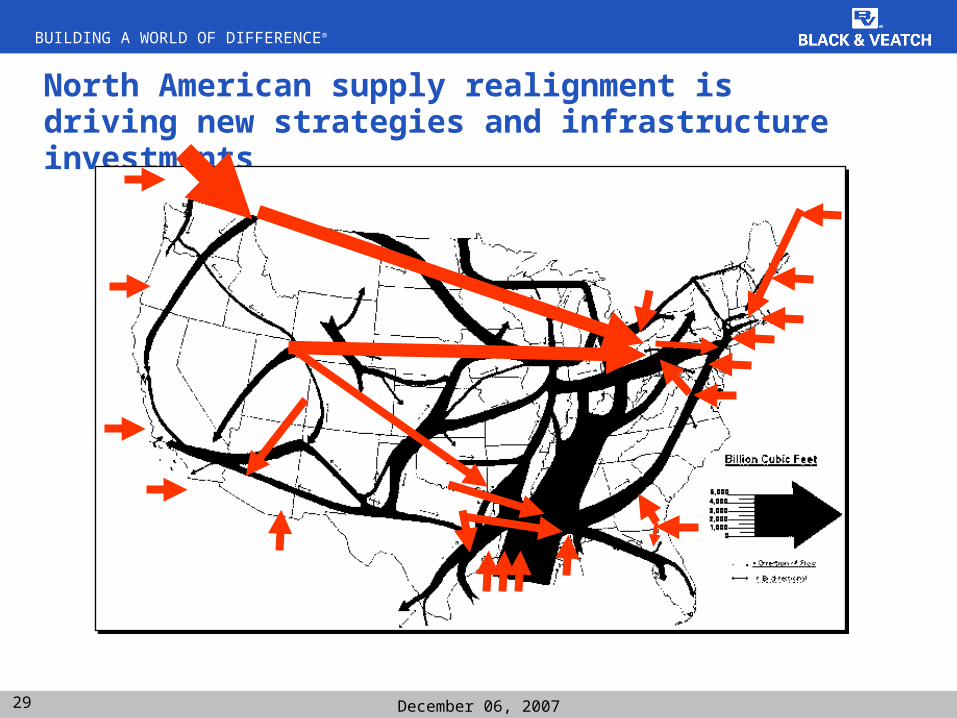
North American supply realignment is driving new strategies and infrastructure investments
BUILDING A WORLD OF DIFFERENCE®
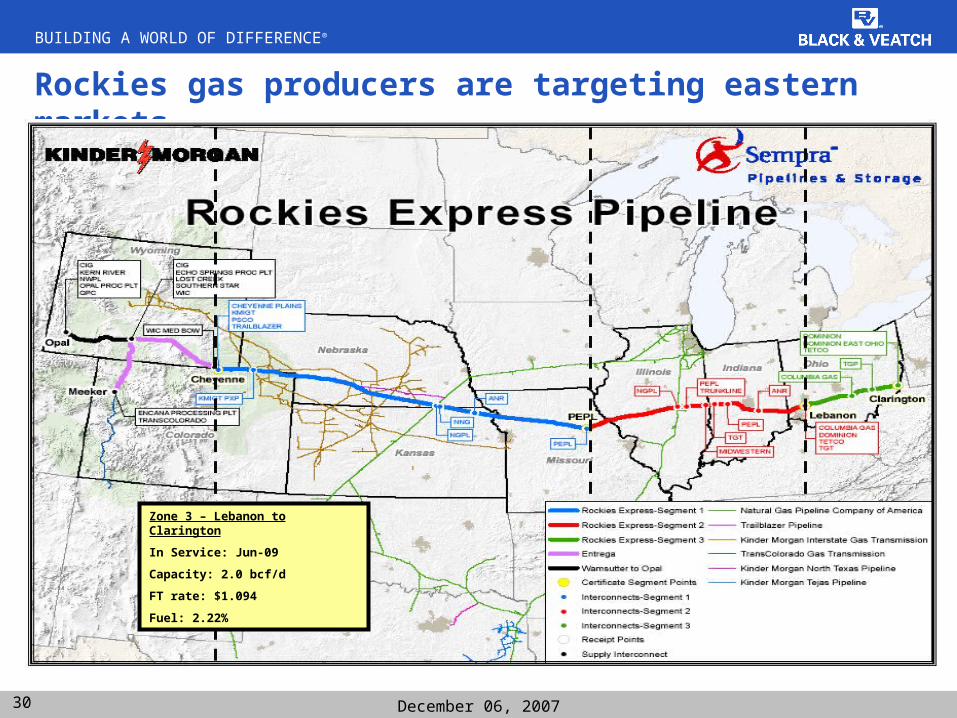
30 December 06, 2007
Rockies gas producers are targeting eastern markets
Zone 3 – Lebanon to Clarington
In Service: Jun-09
Capacity: 2.0 bcf/d
FT rate: $1.094
Fuel: 2.22%
BUILDING A WORLD OF DIFFERENCE®
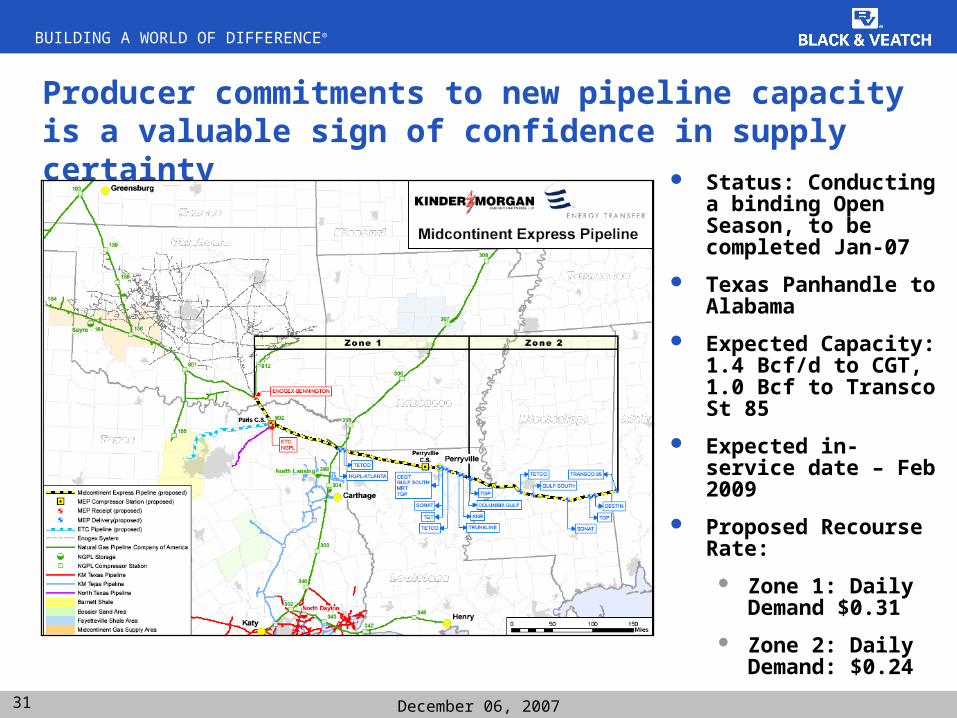
31 December 06, 2007
Producer commitments to new pipeline capacity is a valuable sign of confidence in supply certainty
Status: Conducting a binding Open Season, to be completed Jan-07
Texas Panhandle to Alabama
Expected Capacity: 1.4 Bcf/d to CGT, 1.0 Bcf to Transco St 85
Expected in-service date – Feb 2009
Proposed Recourse Rate:
Zone 1: Daily Demand $0.31
Zone 2: Daily Demand: $0.24
BUILDING A WORLD OF DIFFERENCE®
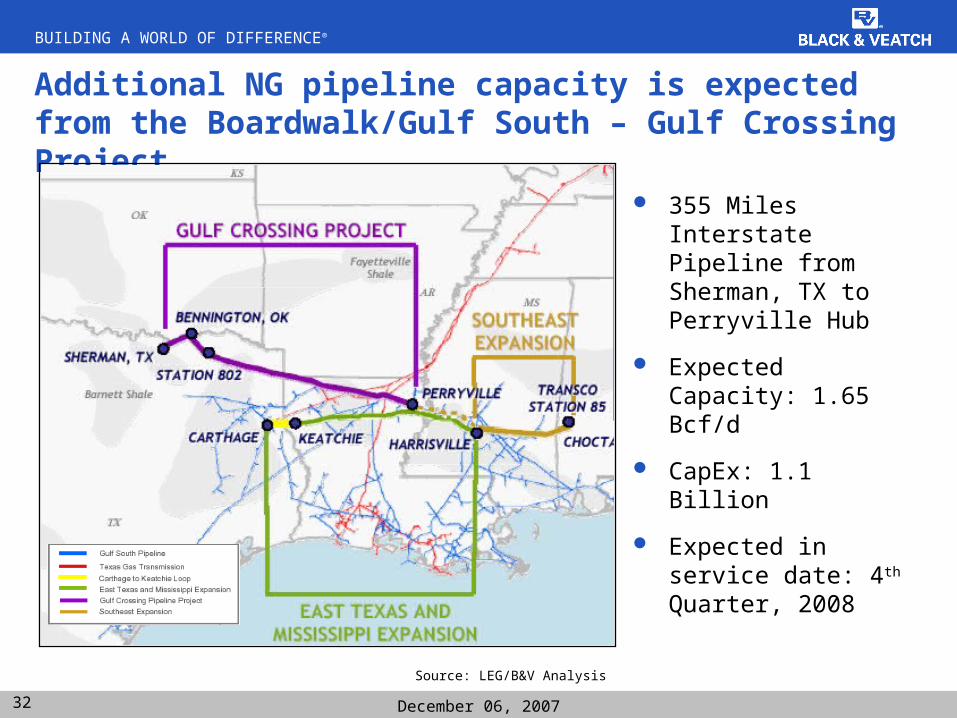
32 December 06, 2007
Additional NG pipeline capacity is expected from the Boardwalk/Gulf South – Gulf Crossing Project
355 Miles Interstate Pipeline from Sherman, TX to Perryville Hub
Expected Capacity: 1.65 Bcf/d
CapEx: 1.1 Billion
Expected in service date: 4th Quarter, 2008
Source: LEG/B&V Analysis
BUILDING A WORLD OF DIFFERENCE®
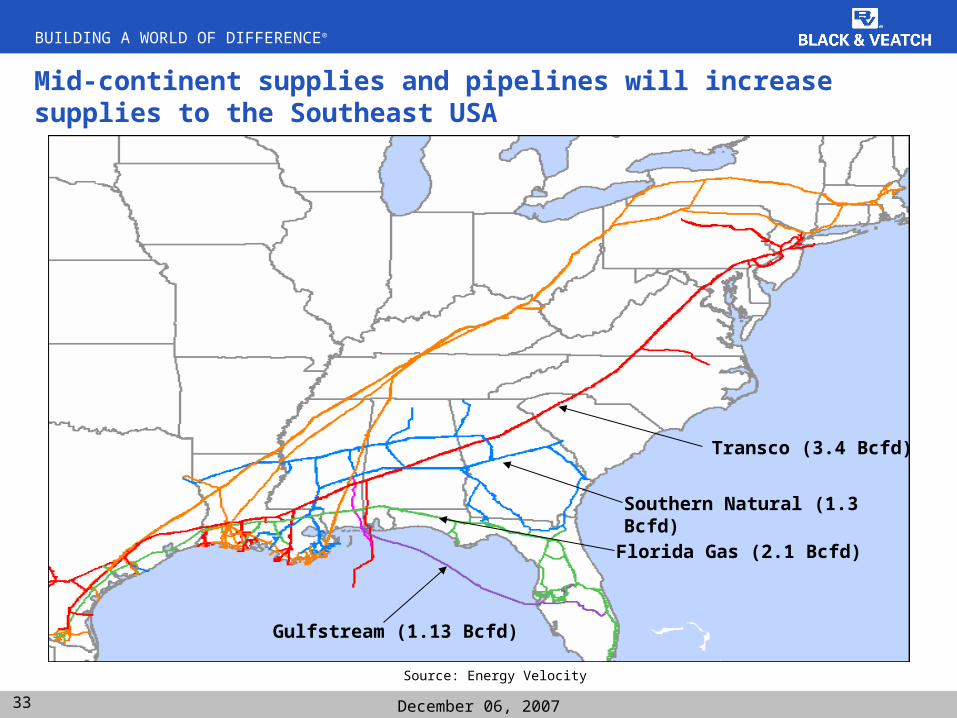
33 December 06, 2007
Transco (3.4 Bcfd)
Florida Gas (2.1 Bcfd)
Southern Natural (1.3 Bcfd)
Gulfstream (1.13 Bcfd)
Mid-continent supplies and pipelines will increase supplies to the Southeast USA
Source: Energy Velocity
BUILDING A WORLD OF DIFFERENCE®
34 December 06, 2007
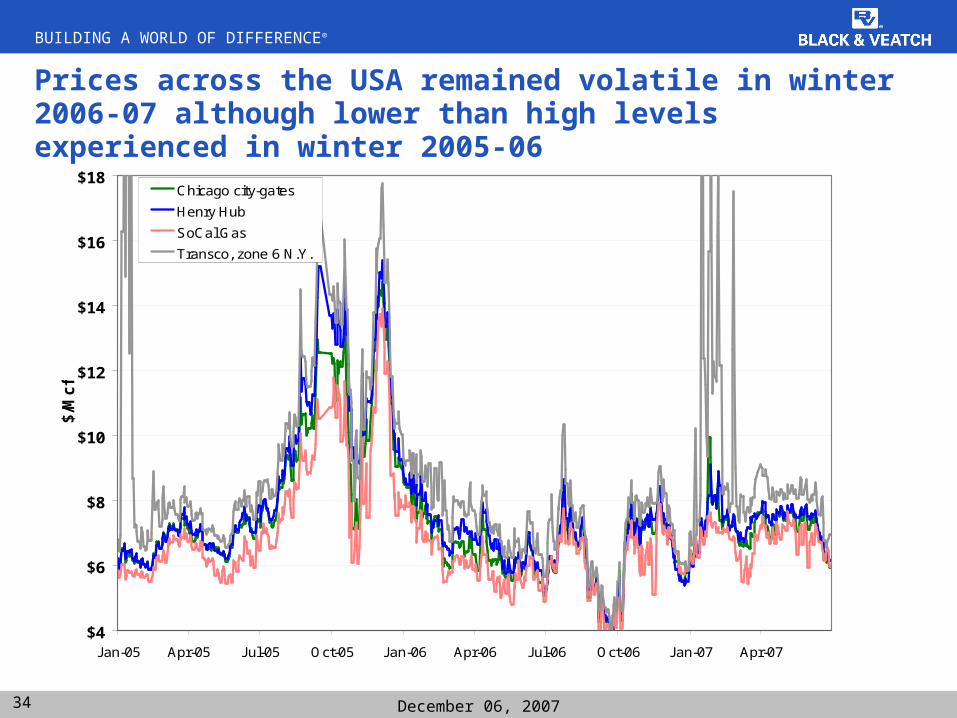
Prices across the USA remained volatile in winter 2006-07 although lower than high levels experienced in winter 2005-06
$4
$6
$8
$10
$12
$14
$16
$18
Jan-05 Apr-05 Jul-05 Oct-05 Jan-06 Apr-06 Jul-06 Oct-06 Jan-07 Apr-07
$/M
cf
Chicago city-gates
Henry Hub
SoCal Gas
Transco, zone 6 N.Y.
BUILDING A WORLD OF DIFFERENCE®
35 December 06, 2007
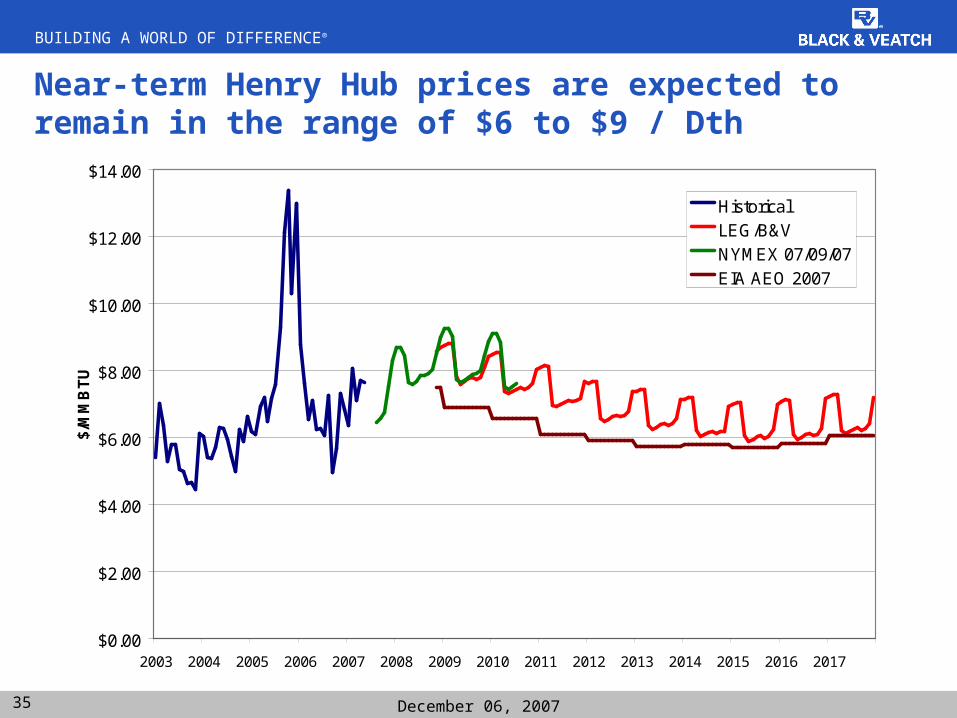
Near-term Henry Hub prices are expected to remain in the range of $6 to $9 / Dth
$0.00
$2.00
$4.00
$6.00
$8.00
$10.00
$12.00
$14.00
2003 2004 2005 2006 2007 2008 2009 2010 2011 2012 2013 2014 2015 2016 2017
$/M
MB
TU
Historical
LEG/B&V
NYMEX 07/09/07
EIA AEO 2007
BUILDING A WORLD OF DIFFERENCE®
36 December 06, 2007
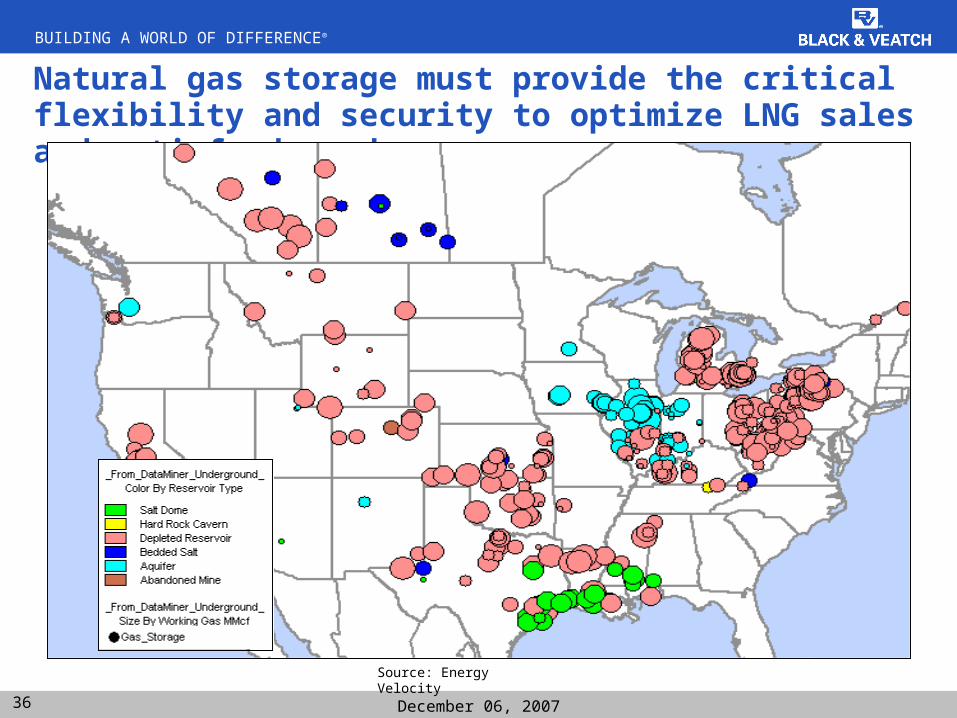
Natural gas storage must provide the critical flexibility and security to optimize LNG sales and satisfy demand
Source: Energy Velocity
BUILDING A WORLD OF DIFFERENCE®
37 December 06, 2007
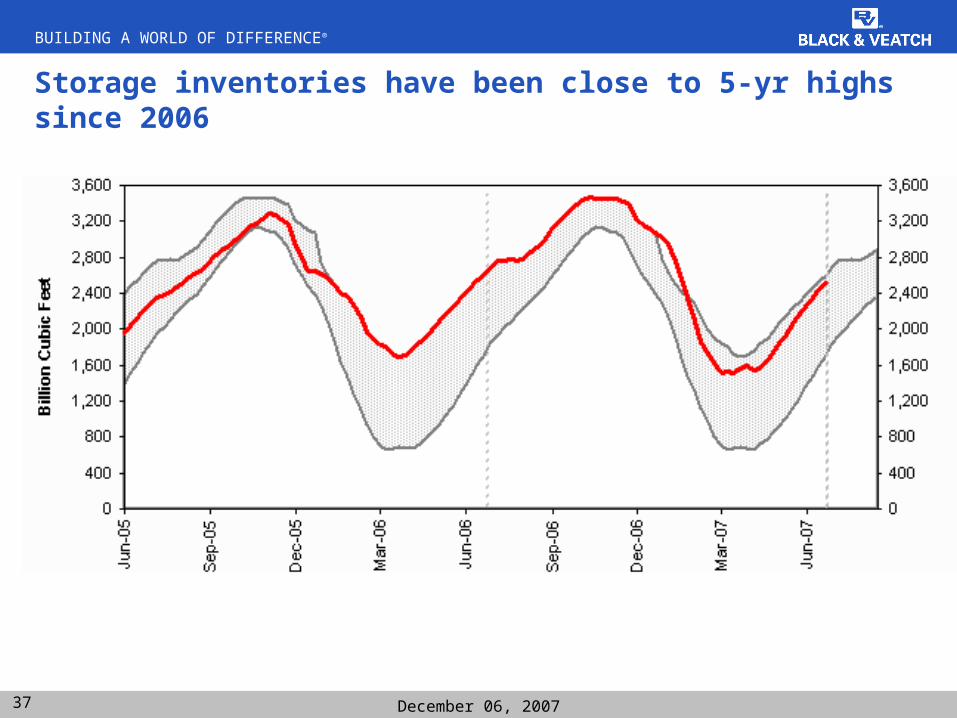
Storage inventories have been close to 5-yr highs since 2006
EIA Weekly Storage Level and 5-yr range
BUILDING A WORLD OF DIFFERENCE®
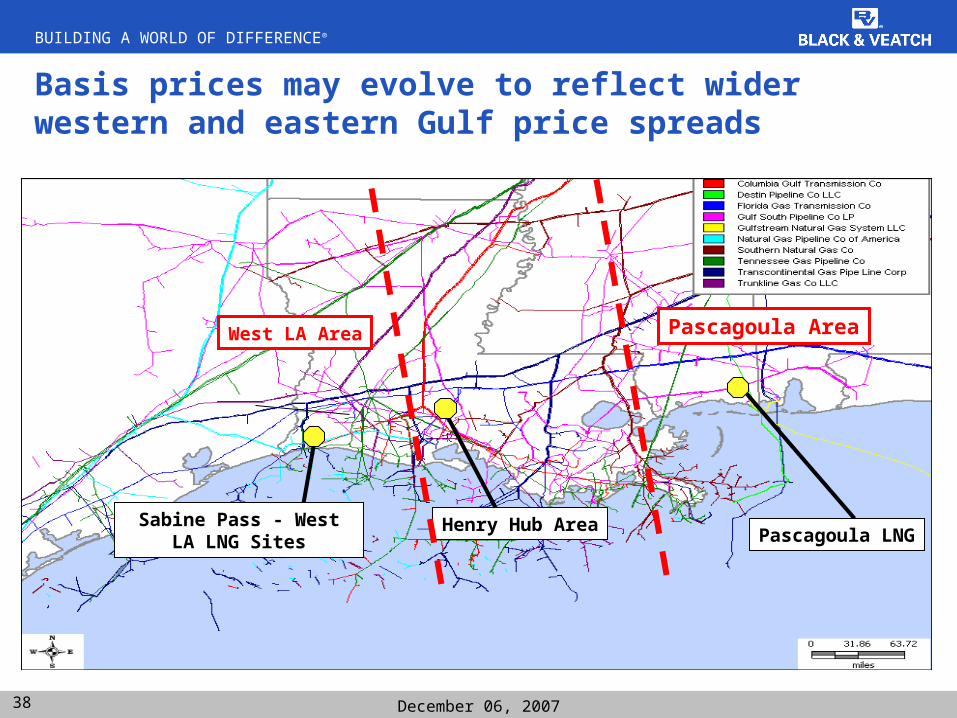
38 December 06, 2007
Basis prices may evolve to reflect wider western and eastern Gulf price spreads
Henry Hub AreaPascagoula LNG
Sabine Pass - West LA LNG Sites
Pascagoula AreaWest LA Area
BUILDING A WORLD OF DIFFERENCE®
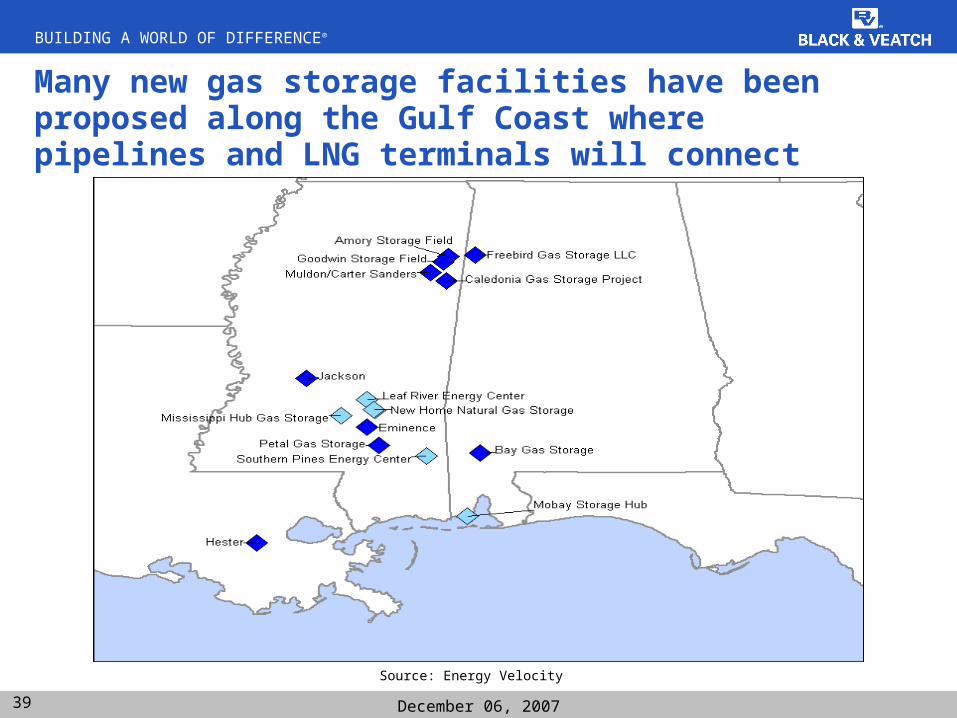
39 December 06, 2007
Many new gas storage facilities have been proposed along the Gulf Coast where pipelines and LNG terminals will connect
Source: Energy Velocity
BUILDING A WORLD OF DIFFERENCE®
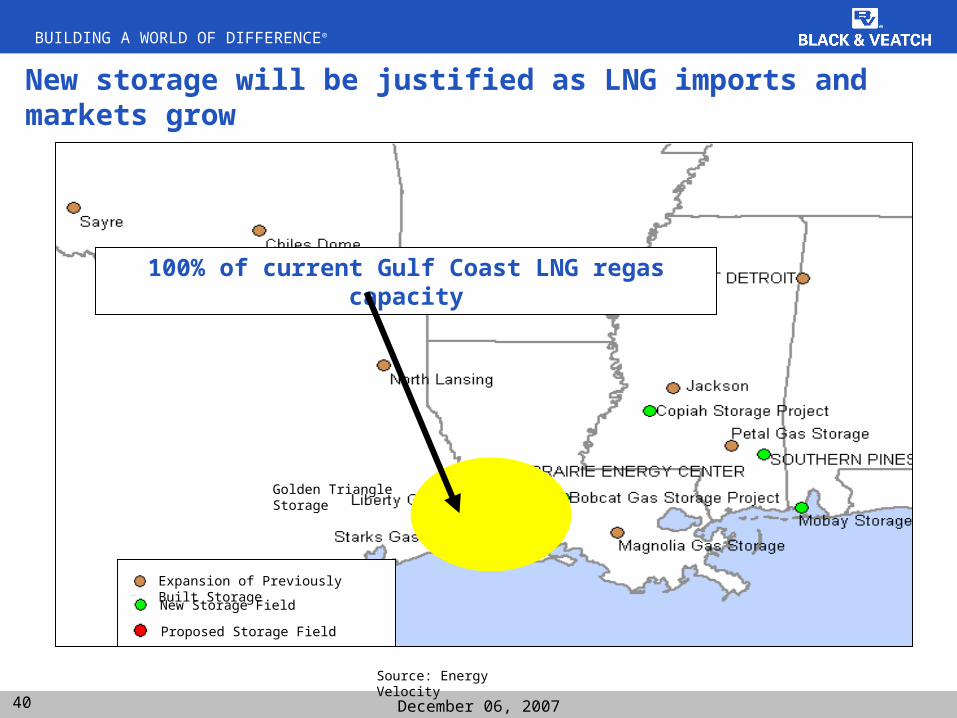
40 December 06, 2007
Golden Triangle Storage
New Storage Field
Expansion of Previously Built Storage
Proposed Storage Field
New storage will be justified as LNG imports and markets grow
100% of current Gulf Coast LNG regas capacity
Source: Energy Velocity
BUILDING A WORLD OF DIFFERENCE®
41 December 06, 2007
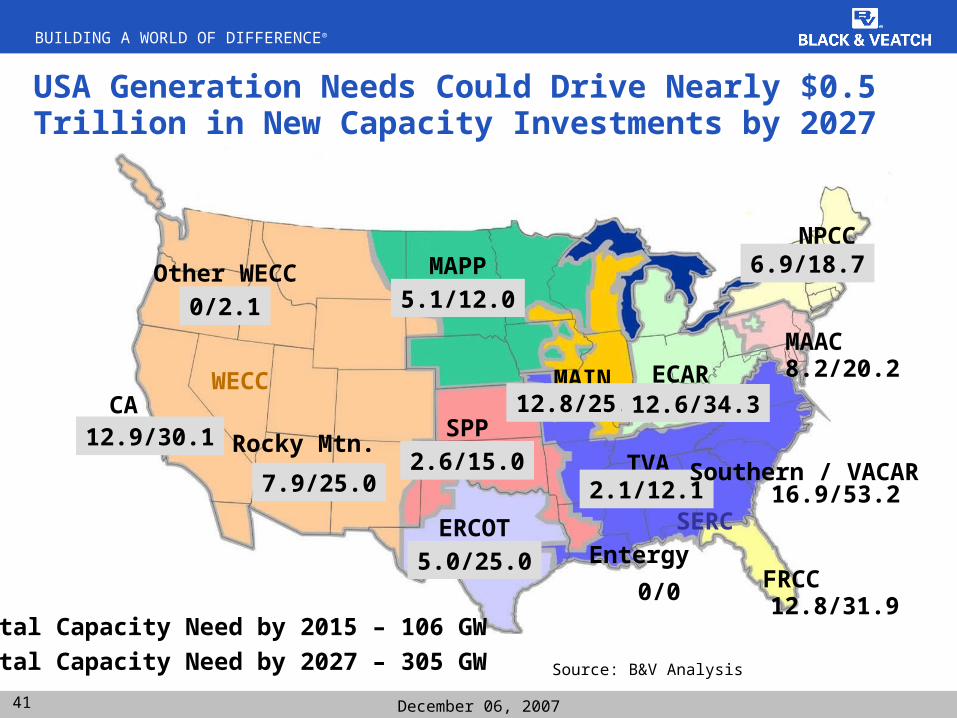
USA Generation Needs Could Drive Nearly $0.5 Trillion in New Capacity Investments by 2027
Other WECC
0/2.1
CA12.9/30.1 Rocky Mtn.
7.9/25.0
MAPP
5.1/12.0
SPP
2.6/15.0
ERCOT
5.0/25.0FRCC
12.8/31.9
MAIN12.8/25.0
ECAR12.6/34.3
NPCC6.9/18.7
MAAC8.2/20.2
SERC
Entergy
0/0
TVA2.1/12.1
Southern / VACAR16.9/53.2
WECC
Total Capacity Need by 2015 – 106 GW
Total Capacity Need by 2027 – 305 GW Source: B&V Analysis
BUILDING A WORLD OF DIFFERENCE®
42 December 06, 2007
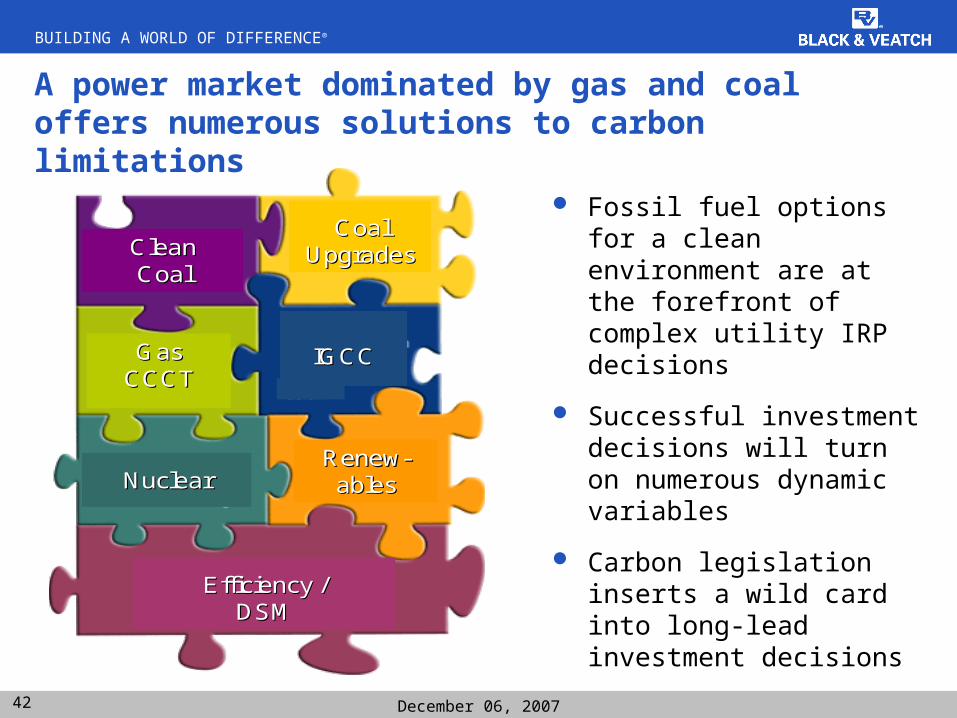
A power market dominated by gas and coal offers numerous solutions to carbon limitations
Fossil fuel options for a clean environment are at the forefront of complex utility IRP decisions
Successful investment decisions will turn on numerous dynamic variables
Carbon legislation inserts a wild card into long-lead investment decisions
Efficiency /Efficiency /DSMDSM
NuclearNuclearRenewRenew--ablesables
Gas Gas CCCTCCCT
IGCCIGCC
CleanCleanCoalCoal
Coal Coal UpgradesUpgrades
Efficiency /Efficiency /DSMDSM
NuclearNuclearRenewRenew--ablesables
Gas Gas CCCTCCCT
IGCCIGCC
CleanCleanCoalCoal
Coal Coal UpgradesUpgrades
BUILDING A WORLD OF DIFFERENCE®
43 December 06, 2007
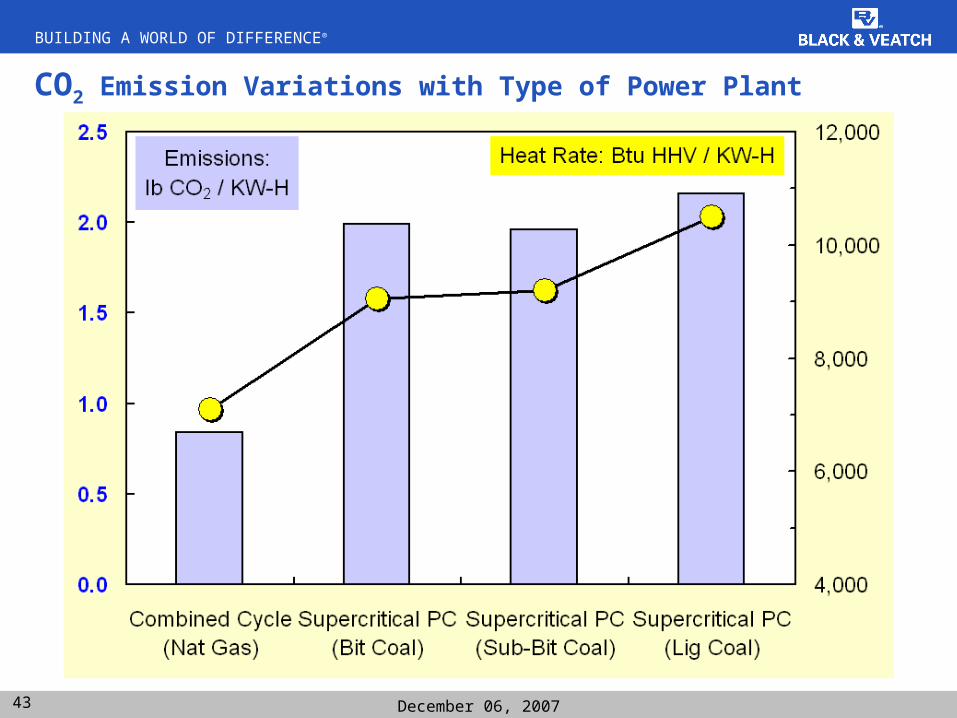
CO2 Emission Variations with Type of Power Plant
BUILDING A WORLD OF DIFFERENCE®
44 December 06, 2007
Kermit was right: “It’s not easy being green”
A 2006 Black & Veatch survey of utility executives showed that 72% believe that federal legislation to limit carbon emissions will be approved in the next five years.
The focus on carbon has redoubled political and popular interest in renewable and nuclear power alternatives to fossil fuels in the generation of electricity
But for all the rhetoric, economics and pragmatism mean that natural gas and coal resources must continue to shoulder society’s need for power
For this reason, our interest in carbon legislation focuses on the tipping point where the incentives for gas or coal use become significantly skewed toward either fuel
BUILDING A WORLD OF DIFFERENCE®
45 December 06, 2007
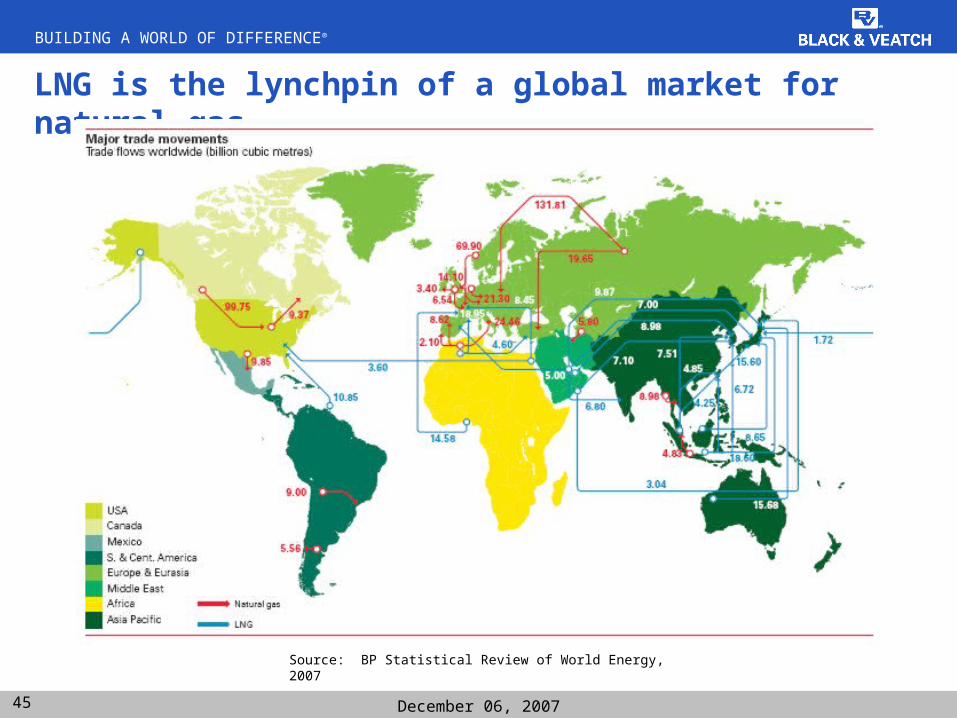
LNG is the lynchpin of a global market for natural gas
Source: BP Statistical Review of World Energy, 2007
BUILDING A WORLD OF DIFFERENCE®
Thank you.Thank you.
Greg W. HopperVice President713.590.2280