Embed Size (px)
Citation preview

“Building an Embedded Enterprise Performance
Management Solution: An Exploratory Case Study"
Caglayan Adiguzel
Project Work presented as partial requirement for obtaining
the master’s degree in Statistics and Information Systems
and Information Technologies Management.
20
18
“Building an Embedded Enterprise Performance Management Solution: An Exploratory Case Study "
Caglayan Adiguzel M2016008 MGI

II

ii
NOVA Information Management School
Instituto Superior de Estatística e Gestão de Informação
Universidade Nova de Lisboa
BUILDING AN EMBEDDED ENTERPRISE PERFORMANCE
MANAGEMENT SOLUTION: AN EXPLORATORY CASE STUDY
by
Caglayan Adiguzel
Project Work presented as a partial requirement for obtaining the master’s degree in Information
Management, with a specialization in Information Systems and Technologies Management
Advisor: Miguel Neto, PhD
October 2018

iii
ACKNOWLEDGEMENTS
First, I would like to thank to my advisor, Professor Miguel Neto, for all the guidance and advices during
the progression of this study. His instructions helped me to progress, both professionally and
personally. With his support, it was possible to finalize this work project. Many thanks to all employees
of the company that is the main target of this study, for providing the necessary resources for the
development of this work project.
Thanks to my family and friends, for always standing by myside and encouraging me to believe in my
abilities to achieve my goals.
Finally, I would like to thank everyone who supported me completely in finishing this project work.

iv
ABSTRACT
Nowadays most companies are struggling to manage large data and spending a lot of money on storing
and capturing. To benefit from the stored data, enterprises implement Business Intelligence solutions
and technology-driven processes. The most significant advantage of BI is analyzing actionable
information and data-driven business decisions for executives and managers. Since technology is
evolving very fast, Business Intelligence processes are getting more advanced every day. These
advancements are promoting accountability, visibility, timely actionable information, increased return
on investment, connected business processes, standardized management processes and augmented
organizational flexibility. In a relationship with BI, enterprise performance management provides more
predictable answers on these advancements by improving planning, budgeting, financial reporting, and
consolidation.
Therefore, this study aims to contribute to a better understanding of the implementation processes of
embedded Enterprise Performance Management Solutions in ERP Embedded BI Platforms by revealing
its methodology, steps, significant milestones, and effectiveness of the organizational structure. The
embedded approach is going to be maintained by Business Intelligence based Business Planning and
Consolidation tool on Enterprise Resource Planning System. Embedded Enterprise Performance
Management solutions consist of Analysis Reporting, Business Planning, and Consolidation. Thoroughly
they cover budgeting, planning, and consolidation as an advance altogether. The Implementation of
an artefact aims to satisfy market competition requirements and to compete with financial demands
which are originated from the growth rate at the organizational level
There are several studies in the literature focuses on the critical success factors of BI projects, but there
are not many studies which are mainly focused on the process evaluation of embedded enterprise
performance management solutions and their success on organizations. This study will be an
exploratory design research case study of a Group Company which is professionalized in language
translation in 30 different countries on five different continents.
KEYWORDS
Budget Planning, Consolidation, EPM, Enterprise Performance Management, Embedded Systems,
Real-Time, Business Intelligence, Finance
v
INDEX
1. Introduction ........................................................................................................................ 1
1.1. Contextualization ............................................................................................................ 1
1.2. Identify Problem and Motivate ....................................................................................... 2
1.3. Define Objectives of Solutions ........................................................................................ 3
1.4. The Main Question Regarding with the Project .............................................................. 3
1.5. Project Goals.................................................................................................................... 3
2. Literature Review ................................................................................................................ 4
2.1. Enterprise Performance Management............................................................................ 4
2.1.1. Planning & Budgeting ............................................................................................... 4
2.1.2. Consolidation ........................................................................................................... 5
2.1.3. Business - Enterprise Reporting ............................................................................... 5
2.1.4. Usage of EPM ........................................................................................................... 5
2.2. Business Intelligence ....................................................................................................... 6
2.2.1. Data Warehouse and Infrastructure ........................................................................ 7
2.2.2. Metadata and Optimization ................................................................................... 11
2.2.3. Business and Management Processes ................................................................... 12
2.2.4. Reporting Tools ...................................................................................................... 13
2.2.5. Development Methodologies ................................................................................ 18
2.2.5.1. Waterfall ............................................................................................................. 18
2.2.5.2. Agile .................................................................................................................... 18
3. Methodology ..................................................................................................................... 21
3.1. Analyze and Design the System..................................................................................... 21
3.2. Build the Prototype ....................................................................................................... 22
3.3. Assumptions and Limitations ........................................................................................ 24
3.4. Observe and Evaluate the System ................................................................................. 25
3.4.1. Project Management Plan ..................................................................................... 25
3.4.2. Planning Preparation.............................................................................................. 26
3.4.3. Top Down Goals and Guidelines ............................................................................ 29
3.4.4. B1-Forecast and Budget ......................................................................................... 29
3.4.4.1. Project Revenue and Cost Planning ................................................................... 29
3.4.4.2. Preliminary Processes......................................................................................... 32
vi
3.4.4.3. CAPEX ................................................................................................................. 34
3.4.4.4. OPEX Planning .................................................................................................... 35
3.4.5. B2-HCM Planning ................................................................................................... 39
3.4.6. B3-Financial and Operational Reporting ................................................................ 41
3.4.6.1. P&L Actuals vs. Budget ....................................................................................... 42
3.4.6.2. Cash Flow actuals vs. Budget.............................................................................. 44
3.4.6.3. Balance Sheet actuals vs. Budget ....................................................................... 47
4. Results And Discussion ...................................................................................................... 49
5. Conclusions ....................................................................................................................... 50
6. Recommendation For Future Developments ................................................................... 51
7. Bibliography ...................................................................................................................... 55
8. Annexes ............................................................................................................................. 58

vii
LIST OF FIGURES
Figure 1.1: Modules of ERP System ............................................................................................ 2
Figure 2.1: Current Architecture by EPM Activity ...................................................................... 6
Figure 2.2: Kimball DW Architecture .......................................................................................... 8
Figure 2.3: Hierarchy Sample ..................................................................................................... 8
Figure 2.4: Structure of Star Schema ....................................................................................... 10
Figure 2.5: SAP S/4HANA .......................................................................................................... 11
Figure 2.6: Magic Quadrant for Analytics and BI Platform ...................................................... 14
Figure 2.7: Magic Quadrant for EPM Tools .............................................................................. 15
Figure 2.8: Comparison of Wide-Scale EPM Solutions ............................................................. 15
Figure 2.9: SAP BPC Solutions................................................................................................... 16
Figure 2.10: SAP BPC Approach on S/4HANA ........................................................................... 17
Figure 2.11: SAP BPC Version List ............................................................................................. 17
Figure 2.12: Waterfall Methodology ........................................................................................ 18
Figure 3.1: Macro Vision of Planning Process .......................................................................... 22
Figure 3.2: Planning and Budgeting Approach ......................................................................... 23
Figure 3.3: Forecast & Budget Process ..................................................................................... 24
Figure 3.4: The legend of Figure 3.3 ......................................................................................... 24
Figure 3.5: Functional Architecture of the Planning Solution .................................................. 25
Figure 3.6: Macro Project Plan ................................................................................................. 26
Figure 3.7: Planning Preparation .............................................................................................. 26
Figure 3.8: Top-down Goals and Guidelines ............................................................................ 29
Figure 3.9: Project Revenue and Cost Planning ....................................................................... 29
Figure 3.10: HANA Studio Overview ......................................................................................... 30
Figure 3.11: Main Info Providers of OPEX and FI Functions ..................................................... 31
Figure 3.12: ZFI_R01 Characteristic Relationships ................................................................... 31
Figure 3.13: Data Slices ............................................................................................................ 31
Figure 3.14: Data Slice of planning for June 2017 .................................................................... 32
Figure 3.15: Planning Account Structure for P&L with *999 Planning Accounts ..................... 32
Figure 3.16: Categories in SPRO ............................................................................................... 33
Figure 3.17: Planning Period for Category in SPRO .................................................................. 33
Figure 3.18: Actual Accounts to *999 Planning Accounts mapping ......................................... 33
Figure 3.19: Accounts not Mapped AFO Report ...................................................................... 34
Figure 3.20: Revenue Account Mapping .................................................................................. 34
Figure 3.21: CJR2 CAPEX Planning Input Screen on S/4HANA ................................................. 35
viii
Figure 3.22: AFO Reports and Planning Elements .................................................................... 36
Figure 3.23: Increased Percentage Input Enabled AFO Report ................................................ 36
Figure 3.24: Cost Center Planning Input Enabled AFO Report ................................................. 36
Figure 3.25: Profit Center Planning Input Enabled AFO Report ............................................... 37
Figure 3.26: AFO Report Prompt .............................................................................................. 39
Figure 3.27: HCM Planning ....................................................................................................... 39
Figure 3.28: All HR HANA Views for Actual Data ...................................................................... 40
Figure 3.29: HR-HCM Planning Applicable Steps ..................................................................... 40
Figure 3.30: HCM Planning FTE - Employee Input Enabled AFO Report .................................. 41
Figure 3.31: HCM Planning Annual Salary - Employee Input Enabled AFO Report.................. 41
Figure 3.32: Financial and Operational Reporting Elements ................................................... 41
Figure 3.33: Planning Control AFO Report ............................................................................... 42
Figure 3.34: P&L Process Flow.................................................................................................. 43
Figure 3.35: Report Tree for P&L .............................................................................................. 43
Figure 3.36: P&L Planning Sequences Running Buttons on Report ......................................... 43
Figure 3.37: P&L Input Enabled AFO Report ............................................................................ 44
Figure 3.38: Profit and Loss Budgeting Info Providers ............................................................. 44
Figure 3.39: Report Tree for Cash Flow .................................................................................... 44
Figure 3.40: Cash Flow Annual Assumptions Input Enabled AFO Report ................................ 45
Figure 3.41: Cash Flow Monthly Assumptions Input Enabled AFO Report .............................. 45
Figure 3.42: P&L to Cash Flow Transfer Assumptions Input Enabled AFO Report .................. 45
Figure 3.43: Cash Flow AFO Report .......................................................................................... 46
Figure 3.44: AFO Reports and Planning Elements .................................................................... 46
Figure 3.45: BPC Balance Sheet and Cash Flow Multi-Provider with Info Cubes ..................... 47
Figure 3.46: FI Actual Planning Multiprovider with Info Cubes ............................................... 47
Figure 3.47: BL/CF Balance Actuals Info Providers ................................................................... 47
Figure 3.48: Report Tree for Balance Sheet ............................................................................. 47
Figure 3.49: P&L to Balance Sheet Transfer Assumptions Input Enabled AFO Report ............ 48
Figure 3.50: Cash Flow to Balance Sheet Transfer Assumptions Input Enabled AFO Report .. 48
Figure 3.51: Balance Sheet AFO Report ................................................................................... 48
Figure 6.1: SAP BPC Web Interface .......................................................................................... 51
Figure 6.2: SAP BPC Web Console My Activities - BPF List ....................................................... 52
Figure 6.3: Consolidation Activities BPF on BPC Web Client .................................................... 52
Figure 6.4: SAP EPM Interface .................................................................................................. 53
Figure 6.5: Validation Report of Consolidated Data in EPM Report ........................................ 54
Figure 8.1: Hana View in Details ............................................................................................... 58
Figure 8.2: HANA View Connected BW Cube Settings ............................................................. 58
ix
Figure 8.3: Virtual Infocube directly connected to Real-Time Hana View ............................... 59
Figure 8.4: Mapping of Info Cube Fields (On the left) and Hana View Fields (On the Right) .. 59
Figure 8.5: Real Time Infocube Designed for Planning Purposes............................................. 60
Figure 8.6: Activate Deactivate Data Slice Planning Functions in PS ....................................... 60
Figure 8.7: Activate/Deactivate Data Slice PF Filter ................................................................. 61
Figure 8.8: Intercompany Recharge PF Filter ........................................................................... 61
Figure 8.9: Intercompany Recharge PF Details ........................................................................ 62
Figure 8.10: Copy Actual PS ...................................................................................................... 64
Figure 8.11: Copy Actual to 9* Accounts PF Filter ................................................................... 64
Figure 8.12: Copy Actual to 9* Accounts PF Details ................................................................. 65
Figure 8.13: Monthly Distribution – Cost Center PS ................................................................ 66
Figure 8.14: Actual Data Monthly Distribution by Cost Center PF Filter ................................. 67
Figure 8.15: Actual Data Monthly Distribution by Cost Center PF Details ............................... 67
Figure 8.16: Planning Data Monthly Distribution by Cost Center PF Filter .............................. 69
Figure 8.17: Planning Data Monthly Distribution by Cost Center PF Details ........................... 69
Figure 8.18: Year Aggregation – Cost Center PS ...................................................................... 71
Figure 8.19: Year Aggregation by Cost Center PF Filter ........................................................... 71
Figure 8.20: Year Aggregation PF Details ................................................................................. 72
Figure 8.21: Monthly Distribution Year+1 by Cost Center PS .................................................. 73
Figure 8.22: Monthly Distribution Year+1 by Cost Center PF Filter ......................................... 73
Figure 8.23: Year Aggregation Year+1 – Cost Center PS .......................................................... 74
Figure 8.24: Monthly Distribution – Profit Center PS .............................................................. 74
Figure 8.25: Monthly Distribution – Profit Center PF Filter ..................................................... 74
Figure 8.26: Monthly Distribution Actual Data by Profit Center PF Filter ............................... 74
Figure 8.27: Year Aggregation by Profit Center PS ................................................................... 75
Figure 8.28: Monthly Distribution Year+1 by Profit Center PS ................................................ 75
Figure 8.29: Monthly Distribution Year+1 by Profit Center PF Filter ....................................... 75
Figure 8.30: Year Aggregation Year+1 by Profit Center PS ...................................................... 75
Figure 8.31: P&L - Full Integration PS ....................................................................................... 76
Figure 8.32: P&L and WBS integration PF Filter ....................................................................... 76
Figure 8.33: P&L WBS Integration by Plan Data PF Details ...................................................... 77
Figure 8.34: P&L - WBS integration – Actual PF Filter .............................................................. 78
Figure 8.35: P&L and WBS Integration by Actual Data PF Details ............................................ 79
Figure 8.36: P&L - Cost and Profit Center Integration PF Filter ............................................... 80
Figure 8.37: P&L Cost and Profit Center Integration PF Details ............................................... 81
Figure 8.38 : P&L - HR Integration PF Filter .............................................................................. 81
Figure 8.39: P&L HR Integration PF Details .............................................................................. 82

x
Figure 8.40: P&L - Cost and Profit Center Integration - Trend Years PF Filter ......................... 84
Figure 8.41: P&L - Cost and Profit Center Integration – Actual PF Filter ................................. 84
Figure 8.42: P&L Cost and Profit Center Integration by Actual PF Details ............................... 85
Figure 8.43: P&L - WBS Integration PS ..................................................................................... 86
Figure 8.44: P&L by Cost and Profit Integration PS .................................................................. 86
Figure 8.45: P&L by HR Integration PS ..................................................................................... 86
Figure 8.46: P&L - Copy P&L to Adjusted P&L PS ..................................................................... 86
Figure 8.47: P&L by Cost and Profit Center Integration - Trend Years PF Filter ...................... 87
Figure 8.48: P&L Copy to adjusted PF Details .......................................................................... 87
Figure 8.49: P&L Copy to adjusted Standard PF ....................................................................... 87
Figure 8.50: P&L - WBS Integration PS ..................................................................................... 88
Figure 8.51: HR FTE Copy Actual PS.......................................................................................... 88
Figure 8.52: FTE Copy Filter PF Filter ........................................................................................ 88
Figure 8.53: HR FTE Input Year Copy PF Details ....................................................................... 89
Figure 8.54: HR Planning PS...................................................................................................... 90
Figure 8.55: HR Percentage Increase PF Filter ......................................................................... 90
Figure 8.56: HR Salary Increase Function PF Details ................................................................ 90
Figure 8.57: HR Salary Month Distribution PF Filter ................................................................ 92
Figure 8.58: Salary Input Year to Month Distribution PF Details ............................................. 92
Figure 8.59: HR FTE Planning Sequence 1 PF Filter .................................................................. 94
Figure 8.60: FTE Distribution 1 PF Details ................................................................................ 95
Figure 8.61: FTE Distribution 2 PF Details ................................................................................ 96
Figure 8.62: HR FTE Planning Sequence 2 PF Filter .................................................................. 97
Figure 8.63: Currency Conversion PF Filter .............................................................................. 97
Figure 8.64: HR Currency Conversion PF Details ...................................................................... 98
Figure 8.65: HR Trend Years Calculation PF Filter .................................................................... 99
Figure 8.66: HR Trend Years Calculation PF Details ................................................................. 99
Figure 8.67: HR Trend Years Calculation PF Standard Copy Formula ...................................... 99
Figure 8.68: P&L to CashFlow Planned PF Details .................................................................. 100
Figure 8.69: P&L to CashFlow Actual Months Accumulated PF Details ................................. 102
Figure 8.70: P&L to CashFlow Actuals PF Details ................................................................... 105
Figure 8.71: CF->BS PF Details ................................................................................................ 107
Figure 8.72: CashFlow Accumulated Balance PF Details ........................................................ 108
Figure 8.73: CashFlow Actual Months Accumulated Balance PF Details ............................... 110
Figure 8.74: CashFlow Copy Final to Adjusted Balance PF Details ......................................... 112
Figure 8.75: CashFlow Copy Final to Adjusted Balance PF Standard Copy Fox Formula ....... 112
Figure 8.76: PL->BS PF Details ................................................................................................ 112

xi
Figure 8.77: Accumulated Beginning Balance PF Details ....................................................... 113
Figure 8.78: Accumulated Beginning Balance PF Standard Copy Fox Formula...................... 114
Figure 8.79: CashFlow Final Month Beginnings Calculation PF Details .................................. 114
Figure 8.80: CashFlow Final Calculations PF Details............................................................... 116
Figure 8.81: CashFlow Adjusted Calculations PF Details ........................................................ 121
xii
LIST OF TABLES
Table 3.1: Methodology Overview ........................................................................................... 21
Table 3.2: Business Steps of Planning ...................................................................................... 23
Table 3.3: Preliminary Processes Steps .................................................................................... 32
Table 3.4: OPEX Planning Applicable Steps .............................................................................. 35
Table 3.5: Profit Center Planning Input Enabled AFO Report Macro Buttons and Functions . 38
Table 3.6: Description of Indices from Figure 3.33 .................................................................. 42
Table 8.1: Deactivate Data Slice PF Fox Formula Code ............................................................ 61
Table 8.2: Activate Data Slice PF Fox Formula Code ................................................................ 61
Table 8.3: Intercompany Recharge PF Fox Formula Code ....................................................... 63
Table 8.4: Copy Actual to 9* Accounts PF Fox Formula Code .................................................. 66
Table 8.5: Actual Data Monthly Distribution by Cost Center PF Fox Formula Code ................ 68
Table 8.6: Planning Data Monthly Distribution by Cost Center PF Fox Formula Code ............ 70
Table 8.7: Year Aggregation PF Fox Formula Code .................................................................. 73
Table 8.8: P&L WBS Integration by Plan Data PF Fox Formula Code ....................................... 78
Table 8.9: P&L and WBS Integration by Actual Data PF Fox Formula Code ............................. 80
Table 8.10: P&L Cost and Profit Center Integration PF Fox Formula Code .............................. 81
Table 8.11: P&L HR Integration PF Fox Formula Code ............................................................. 84
Table 8.12: P&L Cost and Profit Center Integration by Actual PF Fox Formula Code .............. 85
Table 8.13: HR FTE Input Year Copy PF Fox Formula Code ...................................................... 89
Table 8.14: HR Salary Increase Function PF Fox Formula Code ............................................... 91
Table 8.15: Salary Input Year to Month Distribution PF Fox Formula ..................................... 94
Table 8.16: FTE Distribution 1 PF Fox Formula......................................................................... 95
Table 8.17: FTE Distribution 2 PF Fox Formula......................................................................... 97
Table 8.18: HR Currency Conversion PF Fox Formula .............................................................. 98
Table 8.19: Cash Flow copy from P&L PS ............................................................................... 100
Table 8.20: P&L to CashFlow Planned PF Fox Formula .......................................................... 101
Table 8.21: P&L to CashFlow Actual Months Accumulated PF Fox Formula ......................... 104
Table 8.22: P&L to CashFlow Actuals PF Fox Formula ........................................................... 106
Table 8.23: CF->BS PF Fox Formula ........................................................................................ 107
Table 8.24: CashFlow Accumulated Balance PF Fox Formula ................................................ 110
Table 8.25: CashFlow Actual Months Accumulated Balance PF Fox Formula ....................... 111
Table 8.26: PL->BS PF Fox Formula ........................................................................................ 113
Table 8.27: CashFlow Final Month Beginnings Calculation PF Fox Formula .......................... 116
Table 8.28: CashFlow Final Calculations PF Fox Formula ....................................................... 120

xiii
Table 8.29: Cash Flow Adjusted Calculations PS .................................................................... 121
Table 8.30: CashFlow Adjusted Calculations PF Fox Formula ................................................ 125
xiv
LIST OF ABBREVIATIONS AND ACRONYMS
EPM Enterprise Performance Management
BI Business Intelligence
ERP Enterprise Resource Planning
BPC Business Planning and Consolidation
IT Information Technology
IS Information Systems
DW Data Warehouse
OLAP Online Analytical Processing
EDW Enterprise Data Warehouse
SQL Structured Query Language
RAM Random Access Memories
ABAP Advanced Business Application Programming
SAP Systems Applications and Products in Data Processing
BW Business Warehouse
BW-IP Business Warehouse – Integrated Planning
PAK Planning Application KIT
ETL Extract Transform Load
EDM Enterprise Data Model
CRM Customer Relationship Management
HR Human Resources
HRM Human Resources Management
DBMS Database Management System
OLTP Online Transaction Processing Databases
CPM Corporate Performance Management
PF Planning Function
PS Planning Sequence

xv
AFO Analysis for Office
HCM Human Capital Management

1
1. INTRODUCTION
Lately, organizations are investing a lot of money on storing and capturing data. Most companies are
struggling to manage the vast amount of data which is growing day by day with an increasing rate. To
maintain the benefits of stored data, enterprises implement technology-driven Business Intelligence
processes to extract data-driven business decisions. Since technology is evolving very fast, Business
Intelligence processes are getting more advanced every day. Because of that organizations are very
eager to maintain.
Meanwhile, timely, accurate, and relevant intelligence to plan and control the entire organization is
getting essential. Enterprises are trying to collect the most vital metrics to measure the performance
with the help of technology. At this point, the general trend is getting to the idea that all management
systems could work together to provide the needs of the organization at the right time. Enterprise
Performance Management (EPM) provides these enhancements by improving organizations’ planning,
budgeting, financial reporting, and consolidation. The primary motivation of Enterprise Performance
Management is managing integrated business processes on the strategical, financial and operational
level to enable more effective businesses. EPM can provide a competitive aspect for companies which
integrate it by allowing their self to anticipate and respond to a changing business environment.
Henceforth, the aim of this study is the development of an embedded enterprise performance
management solution in ERP embedded business intelligence platform to maintain foresight capacity
and decision-making mechanism for the group company. During the project the chosen embedded
enterprise performance management solution will be implemented to provide a clear understanding
of improved financial reports with planning approach. In the meantime, the developed system will be
providing real-time data for the reporting as well as sustaining real-time planning for a different level
of the group company. The ultimate aim is to retain better-informed decisions and plans.
The study paper is organized in several sections. The first section is completely related with problem,
motivation, objective and project goals. The second one is entirely dedicated to literature review,
where each relevant idea mentioned in the paper is discussed in detail. The third section presents the
methodology considered most appropriate for the problem in analysis. It also includes an extensive
analysis of the findings that are extracted from artefact development performed during the
methodological process. The fourth section is presenting all the significant results and analysis which
are collected during and after the implementation. Finally, the last section displays the conclusions
extracted throughout the master thesis project.
1.1. CONTEXTUALIZATION
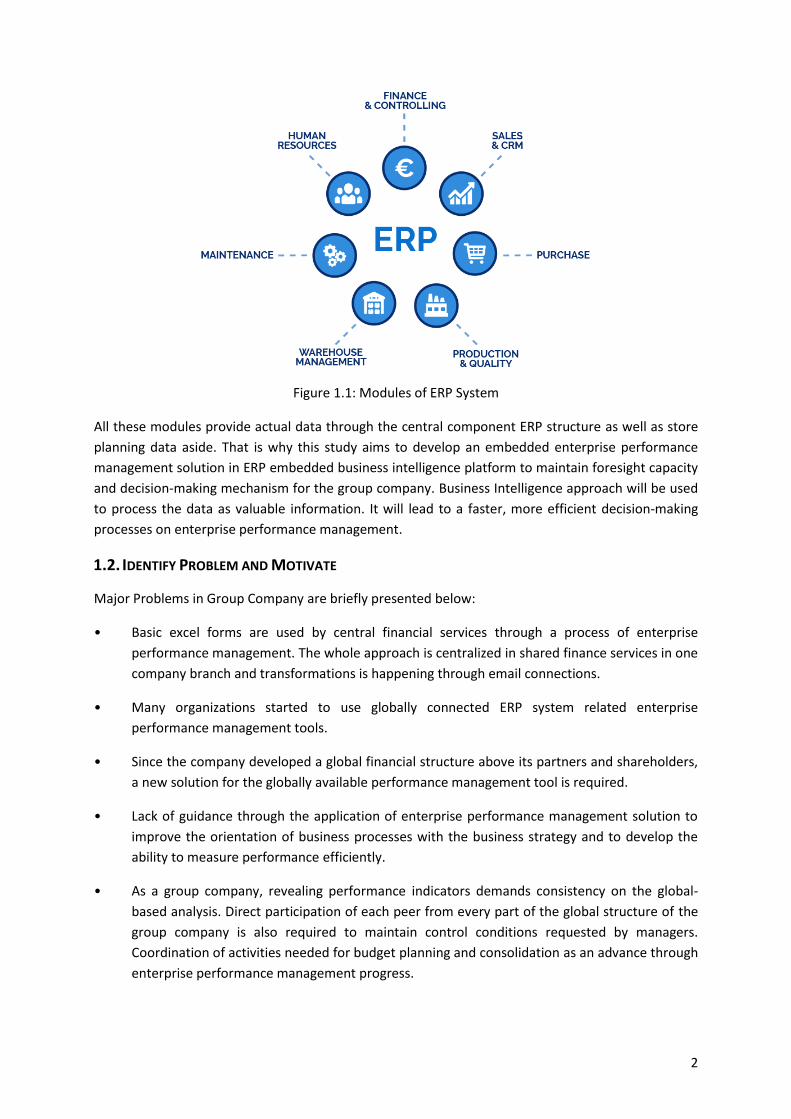
The Group Company which is the main asset of this article has an ERP system which consists of different
modules, such as Financial Accounting (FI), Controlling (CO), Asset Accounting (AA), Sales & Distribution
(SD), Material Management (MM), Project System (PS), Human Resources (HR), etc. ERP system
collects and combines data from the separate modules to provide a complete data store for the
company or organization. A complete combination of the data structure in the ERP system is
summarized in Figure 1.1.
2
Figure 1.1: Modules of ERP System
All these modules provide actual data through the central component ERP structure as well as store
planning data aside. That is why this study aims to develop an embedded enterprise performance
management solution in ERP embedded business intelligence platform to maintain foresight capacity
and decision-making mechanism for the group company. Business Intelligence approach will be used
to process the data as valuable information. It will lead to a faster, more efficient decision-making
processes on enterprise performance management.
1.2. IDENTIFY PROBLEM AND MOTIVATE
Major Problems in Group Company are briefly presented below:
• Basic excel forms are used by central financial services through a process of enterprise
performance management. The whole approach is centralized in shared finance services in one
company branch and transformations is happening through email connections.
• Many organizations started to use globally connected ERP system related enterprise
performance management tools.
• Since the company developed a global financial structure above its partners and shareholders,
a new solution for the globally available performance management tool is required.
• Lack of guidance through the application of enterprise performance management solution to
improve the orientation of business processes with the business strategy and to develop the
ability to measure performance efficiently.
• As a group company, revealing performance indicators demands consistency on the global-
based analysis. Direct participation of each peer from every part of the global structure of the
group company is also required to maintain control conditions requested by managers.
Coordination of activities needed for budget planning and consolidation as an advance through
enterprise performance management progress.
3
1.3. DEFINE OBJECTIVES OF SOLUTIONS
So briefly our objective is: “Propose a method towards the evaluation of the implementation of an
embedded enterprise performance management solution in ERP Embedded BI platform of a group
company, thereby improving the orientation of business processes with the business strategy and
enhancing the ability to measure financial performance by using the advantages of real-time data
support.”
1.4. THE MAIN QUESTION REGARDING WITH THE PROJECT
Based on the problem and objective, the primary research question is: Is it possible to build a specific
artefact to satisfy the needs of the group company. On the other hand, what can be the most suitable
solution for the evaluation of the design and implementation of an embedded enterprise performance
management solution in ERP embedded BI Platform and what are the properties of this solution to
reveal and analyze this question?
Support questions for the workshop are defined according to Span (2009):
• What is the current situation in literature, about enterprise performance management (EPM)?
• What is the current situation in literature, about Business Intelligence (BI)?
• What constraints need to be dealt with through the evaluation of designing and implementing
an embedded EPM solution in practice?
• What are the main properties of an embedded EPM solution in real life?
• Which steps can be separated through the evaluation of the design and implementation process
of an embedded EPM solution in practice?
• Which steps or activities can be executed through the assessment of developing and
implementing an embedded Enterprise Performance Management solution in practice?
• What methods and techniques can be used to reach the objective in practice?
Briefly, the output of this project will be the building of a globally connected enterprise performance
management system.
1.5. PROJECT GOALS
The primary goal is to develop a methodology for the building of embedded Enterprise Performance
Management solution in ERP Embedded BI Platform which has a significant relationship with the new
technology in-memory, column-oriented, relational database ERP system.
This objective is right from the IT-Eye perspective and the actual group company’s structure as well. It
will be very useful in creating this method to provide and relate to the company`s strategy and to
monitor business processes globally. The next step of discovering the applicability of an embedded
enterprise performance management solution will help the group company compared to other
solutions on the market in decision making and systematize management processes. This should
predict new opportunities for the company for further performance improvements. (Span, 2009)
4
2. LITERATURE REVIEW
In this context, Enterprise Performance Management is not a very popular theoretical topic in the
business intelligence area that attracts attention lately. However, it was recently ranked as one of the
top ten technology trends that companies should own. It is considered a jump tool ahead of the
competition (Ariyachandra, 2008). Below, a literature review of EPM is mentioned briefly by the
support of BI understanding of data warehousing. Beside EPM, Business Intelligence approach should
be identified, analyzed and understood completely. The reason is; EPM is directly related with Business
Intelligence in Information Management Systems and Technologies. EPM and Business Intelligence
aspects will be presented briefly in divided sections to cover all the elements of this project.
2.1. ENTERPRISE PERFORMANCE MANAGEMENT
In general, EPM solutions in financial context are formed by Planning & Budgeting, Financial Enterprise
Reporting and companywide Consolidation approaches (Gaiss, 1998). It is very crucial that a company
has a long and short-term planning mindset which is considering the actual financial history of the
organization in each financial term. For big companies, this is one of the most significant requirements
(Ariyachandra, 2008).
2.1.1. Planning & Budgeting
Planning & Budgeting is the process by which the group will establish financial goals to reflect its
choices and tactics, including the use of actual and historical data to predict the financial outcome of
the upcoming months (forecasting). The group’s budget method follows a bottom-up approach where
individual responsibility centers start to plan future conditions for the company. Subsequent
procedures will become more and more centralized along the planning flow, resulting in a corporate
budget reflected on projected financial statements and reports. Specifically, budgeting is the method
of analyzing the future about how to spend actual money for a defined period. Budget planning
includes planned sales volumes and revenues, resource quantities, costs and expenses, assets,
liabilities and cash flows (Gaiss, 1998). Creating a future transaction plan allows to control and check if
enough money is available to afford needs or planned investments in advance. It is the method of
balancing expenses and income altogether. Nowadays budgeting, planning, and forecasting are one of
the most crucial processes for companies to estimate the future and prepared for the upcoming
financial periods. Because of that preferences, consistency is critical when it comes to future financial
analysis. Details can be beneficial, and timing also can reveal risks and shortages. It reveals strategic
plans of business units and an organization, activities or events in defined term with measurements
(Zeng, 2006).
A budget planning helps to improve the planning of actual operations by demanding consideration on
how the conditions might affect the plan and what aids should be taken now by managers. It also
encourages managers to consider problems before they arise from a variety of subjects. Helps the
coordination of activities in the organization by informing managers to examine relationships between
their operation and related departments (Bose, 2006). Other significant roles of the budget include:
• To control resources
• To motivate and encourage managers to achieve budget goals.
5
• To evaluate the performance
• To provide visibility and clearance into the company's performance
• The support mechanism of responsibility
2.1.2. Consolidation
Consolidation is merging assets, equity, liabilities and operating accounts of a parent firm and its
subsidiaries into one financial statement. Joining two or more firms through purchase, merger, or
ownership transfer to form a new group company is the basic definition of consolidation. In the
corporate dictionary, consolidation is also known as amalgamation which is the merger and acquisition
of smaller companies into a more larger group company. In the financial accounting framework,
consolidation refers to the combination of financial statements of a group company as consolidated
financial statements with a parent-child financial relationship (Loebbecke, 2016).
Consolidation methods occur in a different kind of investment methods. Percentages signify the
influence of parent(purchasing) company on a child (Purchased) company. These are 20% ownership
or less (Investment), 20% to 50% ownership (Associate Company) and more than 50% ownership
(Subsidiary). In this case, a remarkable point is if the company owns more than 50% common stocks of
child company, purchasing company has control over the acquired company (Elias, 2012).
Consolidation shows both parent and subsidiaries in a consolidated financial as one single entity.
Parent company uses its investment power on subsidiary to make further investments (Bose, 2006).
2.1.3. Business - Enterprise Reporting
Business reporting or enterprise reporting is an analysis of financial data by a business enterprise. On
the other hand, reporting is the acquirement of information for decision-makers within an organization
to support their work effort. Implementation of a project consists of extract, transform and load (ETL)
processes in coordination with business warehouse (Data Warehouse) (Bose, 2006). After these
operations finished, reporting tools are used to create provisions from the collected data for decision
making. These reports delivered to designated users by different distribution channels like print out,
email or cloud-based presentations. Nowadays, with the expansion of information technology and the
increases in the desire of corporations, the computer is the only way of reporting. All these approaches
are originated from analytics which is discovery and interpretation of meaningful part of data.
Organizations apply analytics to their data to describe, provision and improve their business
performance in advanced level. Especially, areas of analytics which includes predictive analytics,
prescriptive analytics, and enterprise decision management are critical and beneficial. There is also a
different analytics method to improve prediction and provisioning. According to that information, we
can analyze possible problem which can mostly affect the building process (Bose, 2006).
2.1.4. Usage of EPM
Regarding the usage of the EPM tools, the study of Desroches (2014) presents a lot of facts that are
directly related with the motivation of users and EPM. According to Desroches (2014), there is still a
significant dependency on the use of spreadsheet-based tools to support EPM activities. This is
particularly true for support of planning and budgeting as well as business intelligence and analysis.

6
Survey analysis shows that more than half of the respondents rely on spreadsheets and manual
processes to support planning and budgeting activities.
Figure 2.1: Current Architecture by EPM Activity
Source: (Desroches, 2014)
But users who are dependent on the use of spreadsheets and manual processes expressed that their
satisfaction level regarding with the technology is the lowest. In the meantime, respondents who are
using cloud technology or internal EPM Software to support EPM activities, they expressed the highest
overall level of satisfaction among all technologies considered as well as the highest level of satisfaction
for supporting financial close and disclosure activity and business intelligence (Desroches, 2014).
Spreadsheet-dependent users are not satisfied enough that their planning and financial close activities
are efficient and effective or that they have excellent processes for monitoring performance. Users
who are using only ERP, are most likely to believe that their planning and financial close activities are
efficient and effective. On the other hand, users who are using cloud technology or internal EPM
Software are highly satisfied that their standard reports provide the information needed to perform
their job, that their internal stakeholders can run their reports efficiently without relying on accounting
or IT, that they have useful tools for answering ad hoc questions, and that their organization has an
excellent process for monitoring performance (Desroches, 2014).
2.2. BUSINESS INTELLIGENCE
Business Intelligence is considered one of the most crucial advantages of the company by many
authorities. Ability to store, explore and add value by making decisions are the top benefits of BI tools.
Operational systems are where you put data and BI systems is where you get the information out.
(Kimball & Ross, 2013)
The success of BI on competitive advantages is driving the market to evolve every day. A lot of studies
show the importance of BI platform in decision making and future planning in any organization (Dobrev
& Hart, 2015).
7
On the other hand, maintaining BI has many requirements (Kimball & Ross, 2013):
• Easy Access to Information
• Consistent Information
• Adaptation to changes
• Presentation of information on time
• Security of the Information
• Authority and Trustworthiness of the system
• Acceptation of the success of the system
2.2.1. Data Warehouse and Infrastructure
This section will be related to Data Warehouse and its design processes. The concept of a data
warehouse with its benefits and requirements and its design will be covered briefly in this section.
As a first step, some major functional requirements should be identified before starting the design of
Data Warehouse (Boateng, Singh, Greeshma, & Singh, 2011).
• Business needs
• Outputs
• Expectations
• An indication of scope for the required data
• The delivery method of the data
• Defining Subject Model
• Documentation of Data
These requirements will help to create a scope of Data Warehouse with its aim, goals, and limitations.
After clarifying requirements, choosing the most appropriate architecture will be the next step for
maintaining the data warehouse. Nature of user tasks, independent information between
organizational units, social and political factors, business constraints, technical issues and
compatibility with the existing system are the major factors that can affect this process (Boateng,
Singh, Greeshma, & Singh, 2011).
In the meantime, the right questions should be asked regarding with the architecture also (Kimball &
Ross, 2013).
• Which tool or system should be used for analysis, data recovery, database management, data
migration (ETL, etc.).
• Will, there be parallel processing to maintain the system, or it will be partitioning.
According to Moody and Kortink (2000), steps of Data Warehouse creation is defined as it is presented
below:
1. Develop EDM
2. Design Data Warehouse
3. Classify Entities
4. Identify Hierarchies

8
5. Design Data Marts – design star schema structures for each transactional data source in the
data warehouse model.
One of the important data warehouse architecture is defined by Ralph Kimball (2013) which is a
Dimensional Data Warehouse Architecture. Dimensional Data Warehouse is a database that is
managed independently of an Operational database (OLTP - On-Line Transaction Processing
databases), according to Kimball & Ross (2013). It is the favorite technique for the developers because
it helps to maintain the analytical data which provides logical data for business users and fast
performances on query running. It is straightforward and goal oriented (Kimball & Ross, 2013).
Figure 2.2: Kimball DW Architecture
Source: (Kimball & Ross, 2013)
On dimensional modeling, the Hierarchical structure has an important role. Because it helps to
construct the core points of dimensional modeling by maintaining the relationship between each other
in Master Data concept (Moody & Kortink, 2000). They are generally maintained in one to many
relationships which are aligned all to the same direction.
Figure 2.3: Hierarchy Sample
Source: (Moody & Kortink, 2000)
9
According to Moody & Kortink (2000), a hierarchy in an Entity-Relationship Model is formed as “State”
at the top and “Sale Item” at the bottom. As it is presented in Figure 2.3; “State” is the parent of
“Region”, “Region” is the child of “State”, “Sale Item” with “Sale Location” and “Region” are all child of
“State” as well. In this case “Sale”, “Location”, “Region” and “State” are all parents of “Sale Item”.
As presented in Figure 2.2, Kimball’s Data Warehouse Architecture considers Data Source, ETL, Data
presentation area and Business Intelligence Applications as the main components of the structure. In
this concept, Data Source keeps the potential of combining useful and business-related data from
different kind of business modules-resources. As an example; ERP, CRM or HRM systems are the most
favorite ones. These data sources can be structured with relational databases with many tables or
different independent databases with spreadsheets and plaintexts. (Ranjan, 2009)
The other concept ETL is defined as the process that consists of Extraction, Transformation, and Load
which is the transporting-replicating amount of specific data from the source system to the data
warehouse. ETL is very important when it comes to maintaining a good data warehouse with accurate
historical or updated and maintenance of the date. To maintain it, it can also be created with full of
process which is anti-duplication, character type correction, missing entry or misspelling. It is also very
useful on master data change logging which provides the historical information at the Datawarehouse
separated from the source system (Vassiliadis, Simitsis, & Skiadopoulos, 2003).
Another concept is the Data Presentation Area. According to Kimball & Ross (2013), it should be
organized for the needs of business processes and their events. Data in the presentation area should
be dimensional and business process centric. Its structure should be designed for the standard
department needs, not individual department needs (Kimball & Ross, 2013). Hereafter, the concept
star schema and online analytical process(OLAP) cubes take control of data structure. If the
presentation area includes one of these structure designs, it is accepted that the dimensional concept
is maintained on the Data Warehouse (Moody & Kortink, 2000).
Moody & Kortink (2000) identifies star schema as a basic building block which is used in Dimensional
Modelling. There is a central table which is called “Fact Table” and the number of smaller tables which
are called dimension tables are surrounding this fact table (Moody & Kortink, 2000).

10
Figure 2.4: Structure of Star Schema
Source: (Moody & Kortink, 2000)
Primary Keys in all dimension tables should be maintained as concatenated in Fact Table. Because fact
table is linked to other dimensional tables through those primary keys by one-to-many relationships.
With this relationship, dimension tables provide more detailed master data for the element from the
fact table when it is needed. In this case, the fact table is designed to store primary keys with
measurements (quantity, amount, price) and dimension tables to store master data for each
aggregated element from fact table (Moody & Kortink, 2000).
Both Star Schema and OLAP cubes have identifiable dimensions, but their implementation is made
differently. When it comes to OLAP cubes, data is deposited with specially formatted indexes which
are designed for dimensional data. On the other hand, OLAP Engine is performing pre-calculated
summary tables by indexing strategies and other optimizations to provide superior query
performances. Time and Hierarchies are the main navigation dimensions to slice and dice and drill
down on OLAP cubes concept. OLAP techniques and tools can be used to work with data warehouses
or data marts designed for sophisticated enterprise intelligence systems, as reported by Ranjan (2009).
According to Kimball & Ross (2013), the primary benefit of using star schema is that it reduces the
number of tables in database and number of relationships between them. It is also stated that it either
be implemented with special OLAP tools or using Database management Systems(DBMS).

11
Since Group Company has in-memory, column-oriented, relational database management system(SAP
HANA), it would be much more beneficial to have a solution which is embedded in the system directly.
SAP HANA is designed to replicate and ingest structured data from SAP and non-SAP databases,
applications, and other systems in a faster way. It has three styles of data replication available which
are trigger-based, ETL-based, or log-based and can be used depending on the source system and
desired use-case. The replicated data is stored in random access memories (RAM) rather than loaded
onto disk drive which is the the traditional method of application data storage concept. Because the
data is stored in-RAM, it can be accessed in real-time by analytic and transactional applications that
runs on top of HANA (Merz, Hugens, & Blum, Implementing SAP BW on SAP HANA, 2015). Derivation
of real-time data will be much faster and effortless. On the other hand, new technology, in-memory,
column-oriented, relational database management systems offers to create and manage actual
database by integrated development environment (IDE) tools (Pattanayak & Koppolu, 2016).
Figure 2.5: SAP S/4HANA
Source: (Pattanayak & Koppolu, 2016)
Creating Data Sources from ERP and establishing a connection between Info Providers can be handled
by IDE tools (ABAP for Eclipse) as well. Regarding embedded connection feature, Info Providers can be
loaded by real-time data acquisition without any data transfer load process regulation. (Darlak &
Christensen, 2014)
2.2.2. Metadata and Optimization
On the second section, metadata will be covered. Importance of Metadata and its usage in Business
Intelligence approach will be covered in this section. Metadata is data that keeps information about
other data in the system. Examples for metadata can be filenames, author name, file sizes, etc.
According to Inmon (2002), Document ID, Data of entry, Description, Source, Classification, Index
Words, Purge Date, Physical Location Reference, Length, and Related References should be included
as metadata.
Generally, metadata maintenance is handled by ETL suites and data warehouse systems. According to
Boateng, Singh, Greeshma, & Singh (2011), metadata capturing and delivery are primary tasks of ETL.
12
They should be provided by ETL suites already through the processes. Also, data warehouse
architecture should be available to maintain and provide metadata repository (Kimball & Ross, 2013).
According to Boateng, Singh, Greeshma, & Singh (2011), the major issues regarding with the
optimization are presented as:
• The amount of data in the warehouse
• The growth rate of the warehouse and the expectation
• The number of parallel users
• The complexity of user queries
• Queries and other data access functions should grow linearly with the increase of the data
warehouse
Dimensional approach on modeling provides extreme optimization and scalability options. Fact tables
are getting bigger every day, and their enlargement increases the arguments about simplicity on data
warehousing. As Kimball & Ross (2013) stated that the key factor of data warehousing is the simplicity
itself. It enhances the fast maintenance and understanding of data for the business. It also increases
the query performances and runs time statistics.
2.2.3. Business and Management Processes
Nowadays, studies on data warehouse projects show that proper management on BI and holistic
concepts of BI maturity is critical. Usually, Bi solution life cycle includes implementation and support
processes. BI solution implementation and support services can be in-source or out-source. Successful
management of BI can be maintained with a close relationship of IT and business through the BI
solution life cycle. That is why, Wieder & Ossimitz (2015) suggests that Implementing and retaining a
BI solution in support of “effective problem and opportunity identification, critical decision-making,
and strategy formulation, implementation, and evaluation” should not be outsourced entirely. It
requires internal resources beyond the IT department. Wieder & Ossimitz (2015) also states that
organizations can reveal the most benefits out of BI applications if proper management of BI is
maintained in the organization. According to their perspective, the relationship between BI
Management Quality, Information Quality, and Data Quality are described with bullets below:
• BI management quality is positively related to the quality of managerial decision making
• Information quality is positively associated with the quality of managerial decision making
• Data quality is positively related to information quality
• BI management quality is positively related to data quality
• BI management quality is positively related to information quality
According to Couture (2013) basic dimensions that can be expanded upon over time are presented
below:
• Completeness - Source-to-target validation; Monitored and reported
• Timeliness – Defined Service Level Agreements7 (SLAs); Reviewed and approved; Monitored
and reported
• Validity – Data profiling8; Data cleansing9; Inline data quality checks; Monitored and reported
• Consistency – Inline data quality; Trended; Monitored and reported

13
Data integration processes should be, according to Sherman (2014):
• Holistic – avoid costly overlaps and inconsistencies
• Incremental – more manageable and practical
• Iterative – discover and learn from each project
• Reusable – ensure consistency
• Documented – identify data for reuse, and create leverage for future projects
• Auditable – necessary for government regulations and industry standards.
According to Horakova & Skalska (2013), BI tools are more and more often focused on Corporate
Performance Management(CPM) or lately it is called Enterprise Performance Management(EPM). CPM
is designed for managing and analyzing general business efficiency. Key performance indicators are
generally supervised both at the corporate level and at the department or division level. CPM provides
metrics for verification of business efficiency development, and BI solutions can support the practical
realization of CPM.
According to (Lingle, 1996), organizations using balanced performance measurement systems as the
foundation for management perform, are better than those that do not have or use the technique.
Because of that companies should at least have a minor knowledge of what is EPM and its advantages
on management performance. According to the related importance, there is a massive gap in the
literature about EPM and its aspects. There are not enough methodological approaches analyzed and
proposed for EPM design and implementation.
As (Dresner, 2008) explains, anyone can approach EPM in multiple ways when different business cases
require different approaches as well. This statement may be considered as a restriction on the topic,
but it reveals the needed effort on EPM area which has a broad variability within its parameters.
Current EPM approaches in the literature include the BPM framework by (Ariyachandra, 2008), the
BPM lifecycle by (Zeng, 2006) and PDCA cycle from (Deming, 1986). These approaches are mainly
focused on continuous improvement of EPM implementation. This study tries to extend the literature
by using an exploratory case study of the building of embedded version of EPM solution on an in-
memory, column-oriented, relational database management system. By describing this aspect, the gap
which is originated from high variability within EPM and business relation parameters will be decreased
(Span, 2009).
2.2.4. Reporting Tools
Kimball & Ross (2013) describes the term BI application as the variety of abilities provided to business
users to control the presentation area for analytic decision-making purposes. A BI application can be:
• Ad hoc queries – as simple as an ad hoc query tool or as complex as a sophisticated data mining
or modeling application
• Standard reports – Most corporate users will probably access the data through prebuilt
parameter is driven applications and templates that do not require users to construct queries
directly
• Analytic apps – Ad hoc query tools may be understood and used efficiently by only a minor
percentage of the potential data warehouse business users
14
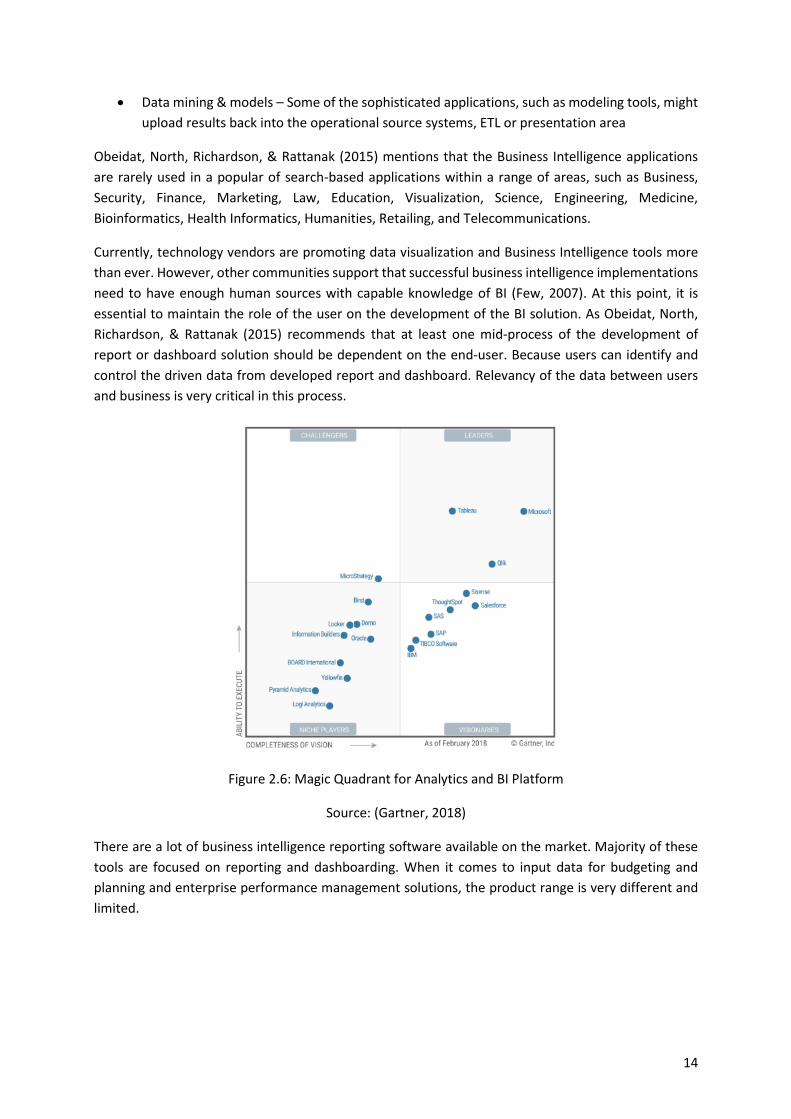
• Data mining & models – Some of the sophisticated applications, such as modeling tools, might
upload results back into the operational source systems, ETL or presentation area
Obeidat, North, Richardson, & Rattanak (2015) mentions that the Business Intelligence applications
are rarely used in a popular of search-based applications within a range of areas, such as Business,
Security, Finance, Marketing, Law, Education, Visualization, Science, Engineering, Medicine,
Bioinformatics, Health Informatics, Humanities, Retailing, and Telecommunications.
Currently, technology vendors are promoting data visualization and Business Intelligence tools more
than ever. However, other communities support that successful business intelligence implementations
need to have enough human sources with capable knowledge of BI (Few, 2007). At this point, it is
essential to maintain the role of the user on the development of the BI solution. As Obeidat, North,
Richardson, & Rattanak (2015) recommends that at least one mid-process of the development of
report or dashboard solution should be dependent on the end-user. Because users can identify and
control the driven data from developed report and dashboard. Relevancy of the data between users
and business is very critical in this process.
Figure 2.6: Magic Quadrant for Analytics and BI Platform
Source: (Gartner, 2018)
There are a lot of business intelligence reporting software available on the market. Majority of these
tools are focused on reporting and dashboarding. When it comes to input data for budgeting and
planning and enterprise performance management solutions, the product range is very different and
limited.

15
Figure 2.7: Magic Quadrant for EPM Tools
Source: (G2CROWD, 2018)
The comparison of five of these full-scale Enterprise Performance Management solutions are
presented below (G2CROWD, 2018):
Figure 2.8: Comparison of Wide-Scale EPM Solutions
Source: (G2CROWD, 2018)
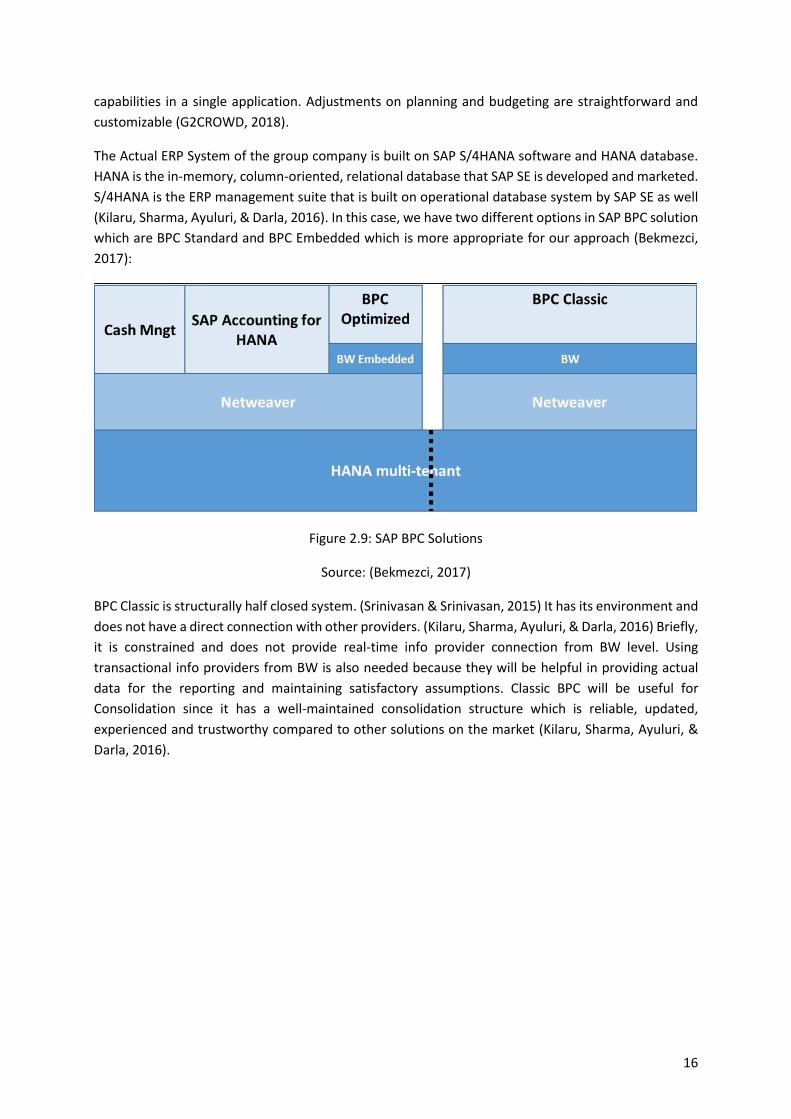
In this case, the market provides SAP BPC tool as an option for the artefact. SAP BPC (Business Planning
and Consolidation) software delivers planning, budgeting, forecasting, and financial consolidation
16
capabilities in a single application. Adjustments on planning and budgeting are straightforward and
customizable (G2CROWD, 2018).
The Actual ERP System of the group company is built on SAP S/4HANA software and HANA database.
HANA is the in-memory, column-oriented, relational database that SAP SE is developed and marketed.
S/4HANA is the ERP management suite that is built on operational database system by SAP SE as well
(Kilaru, Sharma, Ayuluri, & Darla, 2016). In this case, we have two different options in SAP BPC solution
which are BPC Standard and BPC Embedded which is more appropriate for our approach (Bekmezci,
2017):
Figure 2.9: SAP BPC Solutions
Source: (Bekmezci, 2017)
BPC Classic is structurally half closed system. (Srinivasan & Srinivasan, 2015) It has its environment and
does not have a direct connection with other providers. (Kilaru, Sharma, Ayuluri, & Darla, 2016) Briefly,
it is constrained and does not provide real-time info provider connection from BW level. Using
transactional info providers from BW is also needed because they will be helpful in providing actual
data for the reporting and maintaining satisfactory assumptions. Classic BPC will be useful for
Consolidation since it has a well-maintained consolidation structure which is reliable, updated,
experienced and trustworthy compared to other solutions on the market (Kilaru, Sharma, Ayuluri, &
Darla, 2016).
17
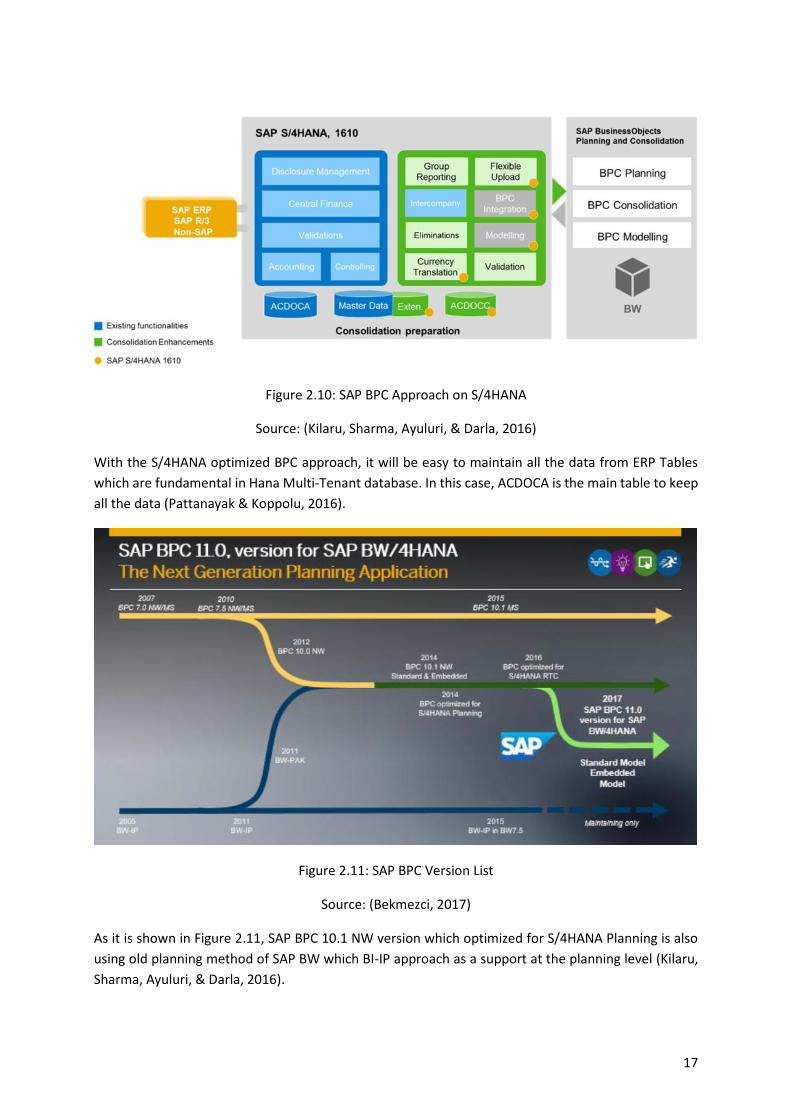
Figure 2.10: SAP BPC Approach on S/4HANA
Source: (Kilaru, Sharma, Ayuluri, & Darla, 2016)
With the S/4HANA optimized BPC approach, it will be easy to maintain all the data from ERP Tables
which are fundamental in Hana Multi-Tenant database. In this case, ACDOCA is the main table to keep
all the data (Pattanayak & Koppolu, 2016).
Figure 2.11: SAP BPC Version List
Source: (Bekmezci, 2017)
As it is shown in Figure 2.11, SAP BPC 10.1 NW version which optimized for S/4HANA Planning is also
using old planning method of SAP BW which BI-IP approach as a support at the planning level (Kilaru,
Sharma, Ayuluri, & Darla, 2016).

18
2.2.5. Development Methodologies
2.2.5.1. Waterfall
Waterfall methodology is one of the top software development approaches. It is designed as a
sequential top-down flowing model that only continues to the next step when the step before is
finished (Mahadevan, Kettinger, & Meservy, 2015). It is also described as a phase-oriented approach.
Each phase is separated by defined quality gates to review the results of the previous phase and to
authorize work on the subsequent phase. As Royce (1970) stated that waterfall methodology consists
of implementation steps to develop a large computer program for delivery to a customer.
Methodology is focused on milestones. It provides the separation of the project scope into end-to-end
features.
Figure 2.12: Waterfall Methodology
Source: (Grech, 2015).
Because of the structure, waterfall methodology is very open to adapt to shifting teams. Because it is
forcing structured organization, control processes are fundamental. Key decision-makers who have a
deep understanding of the system should be identified clearly for each step. Authorization structure
of the project should also be identified by the other team members (Grech, 2015).
2.2.5.2. Agile
Nowadays, global scale projects and market conditions are pressuring for more dynamic environments
and more flexible services when it comes to software development and implementation. Every day
changing business systems are getting more common and flexible requirements with important
changes during the project cycle are increasing day by day (Mahadevan, Kettinger, & Meservy, 2015).
Agile supporters claim that changes and learning must take place throughout a project. It is designed
to deliver increased efficiency, quality and project success (Ionel, 2009).
Some authorities define Agile as a lightweight approach to project management because of its iterative
and change driven aspect. Like the name implies, agile stands for faster turnaround and the dynamic
19
ability to quickly adapt to required changes or developments. The agile approach has a habit of taking
more people-centric perspective, implementing short, iterative phases which are called sprints. Sprints
depend on ongoing feedback that continuously restructures and enhances the project design and plan
(Mahadevan, Kettinger, & Meservy, 2015).
In 2001, seventeen authors released the agile manifesto which has finished the reign of traditional
methodologies. Authors presented twelve principles about how the agile methodology should be
practiced. Customer value, iterative delivery, intense collaboration, small integrated teams, self-
organization, and small-continuous improvements were primary focuses (Mahadevan, Kettinger, &
Meservy, 2015).
Principles (Beedle, et al., 2001):
1. Our highest priority is to satisfy the customer through the early and continuous delivery of
valuable software
2. Welcome changing requirements, even late in development. Agile processes harness change
for the customer's competitive advantage
3. Deliver working software frequently, from a couple of weeks to a couple of months, with a
preference to the shorter timescale
4. Business people and developers must work together daily throughout the project
5. Build projects around motivated individuals. Give them the environment and support they
need, and trust them to get the job done
6. The most efficient and effective method of conveying information to and within a development
team is a face-to-face conversation
7. Working software is the primary measure of progress
8. Agile processes promote sustainable development. The sponsors, developers, and users
should be able to maintain a constant pace indefinitely
9. Continuous attention to technical excellence and good design enhances agility
10. Simplicity--the art of maximizing the amount of work not done--is essential
11. The best architectures, requirements, and designs emerge from self-organizing teams
12. At regular intervals, the team reflects on how to become more active, then tunes and adjusts
its behavior accordingly.
Mahadevan, Kettinger, & Meservy (2015) states that In the Waterfall approach, responsibility is often
gathered in the information systems function. In the Agile approach, shared project responsibility is
assigned to the information systems function and business function areas. During the project,
representatives from both functions are located accordingly. Agile team members cooperatively
provide status reports daily. Iteration cycles which are called “Sprints” are only a few weeks long and
involve customer and management feedback at the end of each session to mark the main points of the
actual sprints. Requirements are continuously evaluated, and priorities are changed depending on
customer involvement. Cooperative responsibility, daily reporting, multiple quick iterations, and
volatility in requirements adjust the Agile methodology a significant organizational conversion
(Mahadevan, Kettinger, & Meservy, 2015).
Ionel (2009) also suggests two main assumptions between agile and traditional methodologies:

20
• Traditional methodologies assume that customers are not capable of arranging their future
requirements. In this case, developers need to provide extra functionalities to meet these
unexpected future needs. This generally leads to the overdesigned system. Briefly, in
traditional methodologies, developers require a detailed specification at the beginning of the
project.
• Agile methodologies assume that both customers and developers don’t have a complete
understanding of requirements when the project starts. In agile methodologies, customers and
developers need to learn together about the system requirements throughout the project.
Basically, in the Agile development process evolves in time.
21
3. METHODOLOGY
In management theory, there is no uniform approach to define the central concept (Dresner, 2008).
Because of that, the methodology of this study is related to the creation of organizational and
economically associated enterprise performance management system to provide global wide
enterprise performance analysis. Since the primary objective is the development of the methodology
to create a new artefact to solve the problem of the company, design science research methods are
the most appropriate elements to finalize this progress from top to bottom. At this point artefact
building, approaches will be used to support the primary outcome.
This exploratory case study was exercised at the group company to reveal the success performances
of the building of an Embedded Enterprise Performance Management software. This study aims to
comply with the criteria of relevance, applicability, and specificity, as proposed by Cheng(1983). The
integrity of organization research and practice also be taken into consideration as Loebbecke(2016)
presented.
Presented Group Company is selected because the organization is trying to implement the first ERP
level EPM solution with an embedded approach for the very first time. Because of that the process
itself, vulnerable to propose challenges and difficulties. The company does not have any Business
Intelligence department but has a big shared financial services team which is mainly working with
spreadsheets.
Table 3.1: Methodology Overview
According to methodology, the first three steps are already covered at Section 1 and Section 2 which
are presented above. Remaining steps will be covered below:
3.1. ANALYZE AND DESIGN THE SYSTEM
Analysis of the system and work structure is done by the Technical Team and Project Team. Group
Company wants to implement a planning and budgeting tool to accomplish business goals at a planning
level, integrated with reviewed processes that can be more aligned with the benefits that can be
achieved by the tool. SAP BPC optimized for S/4HANA is ready to interact and communicate with SAP
S/4HANA using the same infrastructure, taking advantage of other tools as Analysis for Office. (Kilaru,
Sharma, Ayuluri, & Darla, 2016). SAP BPC is also providing embedded consolidation which is considered
as future development regarding this project.
Group Company is present in 21 countries with 28 fully owned companies.
Observe and
Evaluate the System
Build the Prototype
Analyze and Design the
System
Literature Review
Define Objectives of Solution
Identify Problem
and Motivate
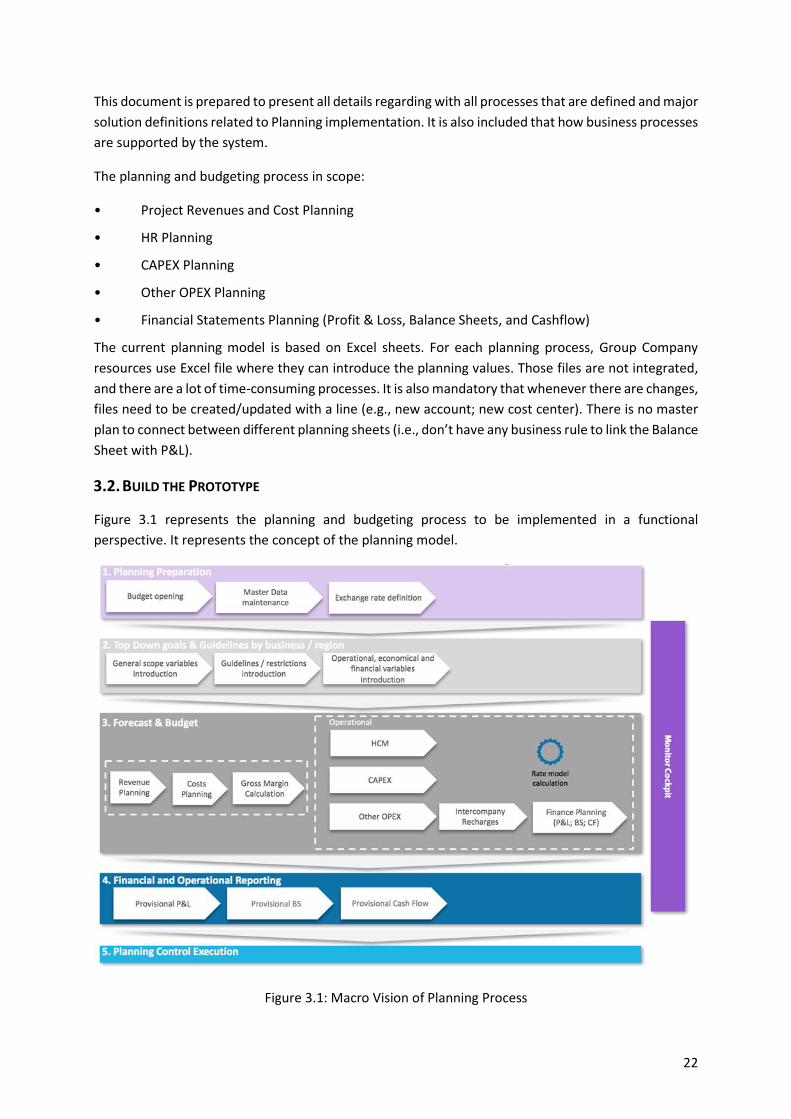
22
This document is prepared to present all details regarding with all processes that are defined and major
solution definitions related to Planning implementation. It is also included that how business processes
are supported by the system.
The planning and budgeting process in scope:
• Project Revenues and Cost Planning
• HR Planning
• CAPEX Planning
• Other OPEX Planning
• Financial Statements Planning (Profit & Loss, Balance Sheets, and Cashflow)
The current planning model is based on Excel sheets. For each planning process, Group Company
resources use Excel file where they can introduce the planning values. Those files are not integrated,
and there are a lot of time-consuming processes. It is also mandatory that whenever there are changes,
files need to be created/updated with a line (e.g., new account; new cost center). There is no master
plan to connect between different planning sheets (i.e., don’t have any business rule to link the Balance
Sheet with P&L).
3.2. BUILD THE PROTOTYPE
Figure 3.1 represents the planning and budgeting process to be implemented in a functional
perspective. It represents the concept of the planning model.
Figure 3.1: Macro Vision of Planning Process

23
The optimization of the current budget and planning process, as the premise of a new sustainable,
scalable and transversal process for the group is split into five different steps:
1. Planning preparation → manual operations for a new planning cycle as define, adjust master
data and exchange rate definition;
2. Top-down goals & guidelines → introduced by top-level Group Company
administration/direction, it reflects the main goals of the organization;
3. Forecast & Budget → forecast calculation for the time periods of non-actual data of the current
year and the introduction of planning data for operational and financial budgeting;
4. Financial and Operational Reporting → Reporting figures based on planning data introduced;
5. Planning Control Execution → Reports for Real vs. Planning control during the current year.
The planning and budgeting process will be done in two different perspectives:
• In S/4HANA;
• In BPC.
Figure 3.2: Planning and Budgeting Approach
The Project Revenue and Cost Planning and CAPEX Planning will be done in S/4HANA environment,
using existing process planning tool on standard ERP. The HCM Planning, Other Opex (Cost Center
planning), Intercompany Recharges and Financial Statements Model (Finance Planning) will be
developed using BPC embedded tools. The picture below illustrates those two perspectives divided
into three stages:
Table 3.2: Business Steps of Planning
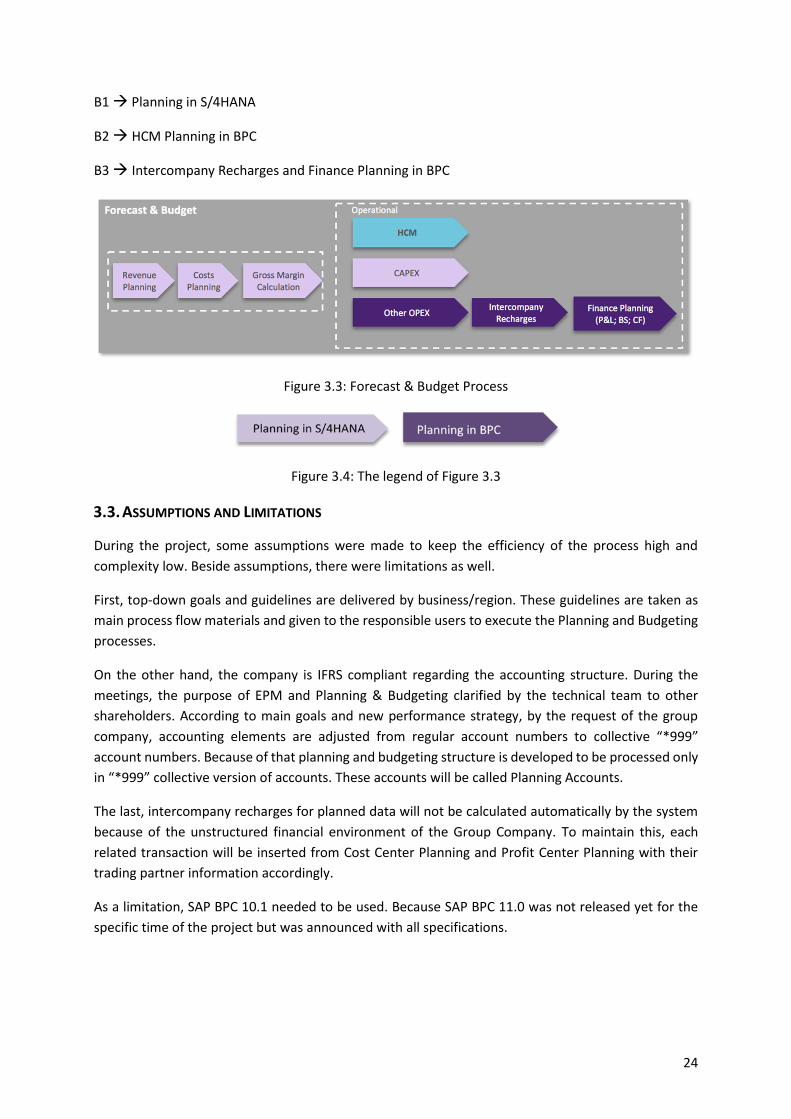
24
B1 → Planning in S/4HANA
B2 → HCM Planning in BPC
B3 → Intercompany Recharges and Finance Planning in BPC
Figure 3.3: Forecast & Budget Process
Figure 3.4: The legend of Figure 3.3
3.3. ASSUMPTIONS AND LIMITATIONS
During the project, some assumptions were made to keep the efficiency of the process high and
complexity low. Beside assumptions, there were limitations as well.
First, top-down goals and guidelines are delivered by business/region. These guidelines are taken as
main process flow materials and given to the responsible users to execute the Planning and Budgeting
processes.
On the other hand, the company is IFRS compliant regarding the accounting structure. During the
meetings, the purpose of EPM and Planning & Budgeting clarified by the technical team to other
shareholders. According to main goals and new performance strategy, by the request of the group
company, accounting elements are adjusted from regular account numbers to collective “*999”
account numbers. Because of that planning and budgeting structure is developed to be processed only
in “*999” collective version of accounts. These accounts will be called Planning Accounts.
The last, intercompany recharges for planned data will not be calculated automatically by the system
because of the unstructured financial environment of the Group Company. To maintain this, each
related transaction will be inserted from Cost Center Planning and Profit Center Planning with their
trading partner information accordingly.
As a limitation, SAP BPC 10.1 needed to be used. Because SAP BPC 11.0 was not released yet for the
specific time of the project but was announced with all specifications.
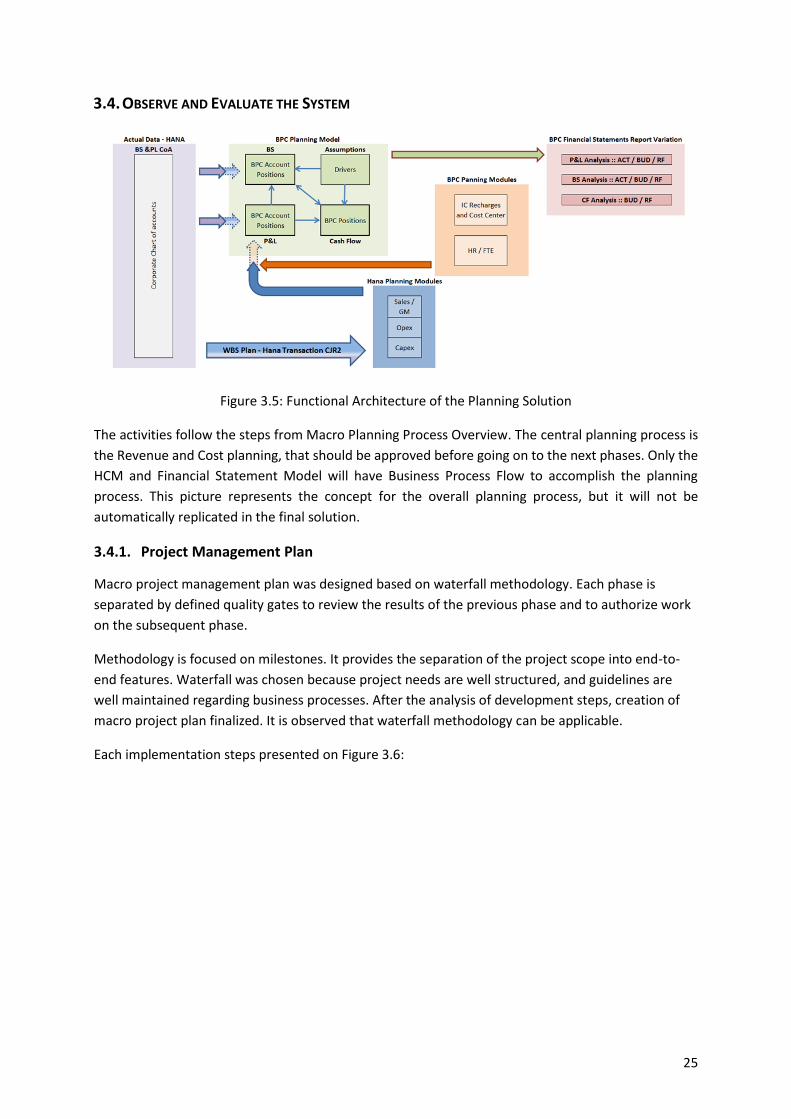
25
3.4. OBSERVE AND EVALUATE THE SYSTEM
Figure 3.5: Functional Architecture of the Planning Solution
The activities follow the steps from Macro Planning Process Overview. The central planning process is
the Revenue and Cost planning, that should be approved before going on to the next phases. Only the
HCM and Financial Statement Model will have Business Process Flow to accomplish the planning
process. This picture represents the concept for the overall planning process, but it will not be
automatically replicated in the final solution.
3.4.1. Project Management Plan
Macro project management plan was designed based on waterfall methodology. Each phase is
separated by defined quality gates to review the results of the previous phase and to authorize work
on the subsequent phase.
Methodology is focused on milestones. It provides the separation of the project scope into end-to-
end features. Waterfall was chosen because project needs are well structured, and guidelines are
well maintained regarding business processes. After the analysis of development steps, creation of
macro project plan finalized. It is observed that waterfall methodology can be applicable.
Each implementation steps presented on Figure 3.6:
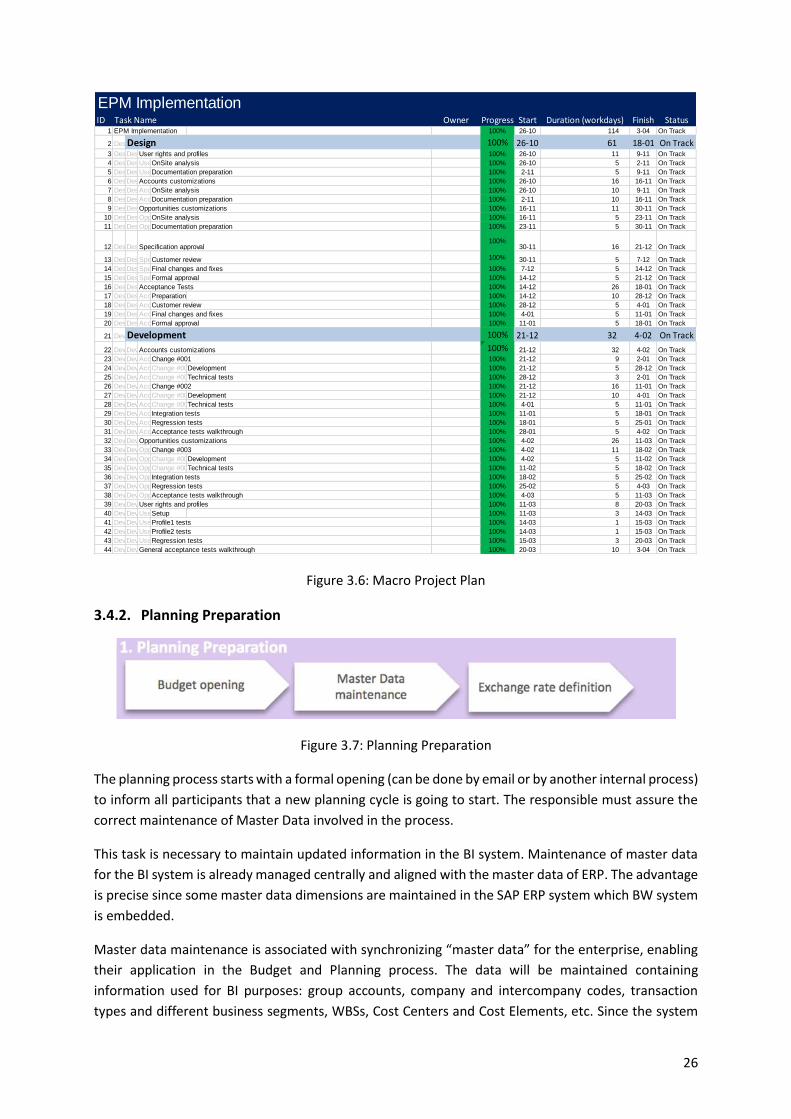
26
Figure 3.6: Macro Project Plan
3.4.2. Planning Preparation
Figure 3.7: Planning Preparation
The planning process starts with a formal opening (can be done by email or by another internal process)
to inform all participants that a new planning cycle is going to start. The responsible must assure the
correct maintenance of Master Data involved in the process.
This task is necessary to maintain updated information in the BI system. Maintenance of master data
for the BI system is already managed centrally and aligned with the master data of ERP. The advantage
is precise since some master data dimensions are maintained in the SAP ERP system which BW system
is embedded.
Master data maintenance is associated with synchronizing “master data” for the enterprise, enabling
their application in the Budget and Planning process. The data will be maintained containing
information used for BI purposes: group accounts, company and intercompany codes, transaction
types and different business segments, WBSs, Cost Centers and Cost Elements, etc. Since the system
ID1 EPM Implementation 100% 26-10 114 3-04 On Track
2 DesignDesign 100% 26-10 61 18-01 On Track3 Design - User rights and profilesDesignUser rights and profiles 100% 26-10 11 9-11 On Track
4 Design - User rights and profiles - OnSite analysisDesignUser rights and profilesOnSite analysis 100% 26-10 5 2-11 On Track
5 Design - User rights and profiles - Documentation preparationDesignUser rights and profilesDocumentation preparation 100% 2-11 5 9-11 On Track
6 Design - Accounts customizationsDesignAccounts customizations 100% 26-10 16 16-11 On Track
7 Design - Accounts customizations - OnSite analysisDesignAccounts customizationsOnSite analysis 100% 26-10 10 9-11 On Track
8 Design - Accounts customizations - Documentation preparationDesignAccounts customizationsDocumentation preparation 100% 2-11 10 16-11 On Track
9 Design - Opportunities customizationsDesignOpportunities customizations 100% 16-11 11 30-11 On Track
10 Design - Opportunities customizations - OnSite analysisDesignOpportunities customizationsOnSite analysis 100% 16-11 5 23-11 On Track
11 Design - Opportunities customizations - Documentation preparationDesignOpportunities customizationsDocumentation preparation 100% 23-11 5 30-11 On Track
12 Design - Specification approvalDesignSpecification approval100%
30-11 16 21-12 On Track
13 Design - Specification approval - Customer reviewDesignSpecification approvalCustomer review 100% 30-11 5 7-12 On Track
14 Design - Specification approval - Final changes and fixesDesignSpecification approvalFinal changes and fixes 100% 7-12 5 14-12 On Track
15 Design - Specification approval - Formal approvalDesignSpecification approvalFormal approval 100% 14-12 5 21-12 On Track
16 Design - Acceptance TestsDesignAcceptance Tests 100% 14-12 26 18-01 On Track
17 Design - Acceptance Tests - PreparationDesignAcceptance TestsPreparation 100% 14-12 10 28-12 On Track
18 Design - Acceptance Tests - Customer reviewDesignAcceptance TestsCustomer review 100% 28-12 5 4-01 On Track
19 Design - Acceptance Tests - Final changes and fixesDesignAcceptance TestsFinal changes and fixes 100% 4-01 5 11-01 On Track
20 Design - Acceptance Tests - Formal approvalDesignAcceptance TestsFormal approval 100% 11-01 5 18-01 On Track
21 DevelopmentDevelopment 100% 21-12 32 4-02 On Track
22 Development - Accounts customizationsDevelopmentAccounts customizations 100% 21-12 32 4-02 On Track
23 Development - Accounts customizations - Change #001DevelopmentAccounts customizationsChange #001 100% 21-12 9 2-01 On Track
24 Development - Accounts customizations - Change #001 - DevelopmentDevelopmentAccounts customizationsChange #001Development 100% 21-12 5 28-12 On Track
25 Development - Accounts customizations - Change #001 - Technical testsDevelopmentAccounts customizationsChange #001Technical tests 100% 28-12 3 2-01 On Track
26 Development - Accounts customizations - Change #002DevelopmentAccounts customizationsChange #002 100% 21-12 16 11-01 On Track
27 Development - Accounts customizations - Change #002 - DevelopmentDevelopmentAccounts customizationsChange #002Development 100% 21-12 10 4-01 On Track
28 Development - Accounts customizations - Change #002 - Technical testsDevelopmentAccounts customizationsChange #002Technical tests 100% 4-01 5 11-01 On Track
29 Development - Accounts customizations - Integration testsDevelopmentAccounts customizationsIntegration tests 100% 11-01 5 18-01 On Track
30 Development - Accounts customizations - Regression testsDevelopmentAccounts customizationsRegression tests 100% 18-01 5 25-01 On Track
31 Development - Accounts customizations - Acceptance tests walkthroughDevelopmentAccounts customizationsAcceptance tests walkthrough 100% 28-01 5 4-02 On Track
32 Development - Opportunities customizationsDevelopmentOpportunities customizations 100% 4-02 26 11-03 On Track
33 Development - Opportunities customizations - Change #003DevelopmentOpportunities customizationsChange #003 100% 4-02 11 18-02 On Track
34 Development - Opportunities customizations - Change #003 - DevelopmentDevelopmentOpportunities customizationsChange #003Development 100% 4-02 5 11-02 On Track
35 Development - Opportunities customizations - Change #003 - Technical testsDevelopmentOpportunities customizationsChange #003Technical tests 100% 11-02 5 18-02 On Track
36 Development - Opportunities customizations - Integration testsDevelopmentOpportunities customizationsIntegration tests 100% 18-02 5 25-02 On Track
37 Development - Opportunities customizations - Regression testsDevelopmentOpportunities customizationsRegression tests 100% 25-02 5 4-03 On Track
38 Development - Opportunities customizations - Acceptance tests walkthroughDevelopmentOpportunities customizationsAcceptance tests walkthrough 100% 4-03 5 11-03 On Track
39 Development - User rights and profilesDevelopmentUser rights and profiles 100% 11-03 8 20-03 On Track
40 Development - User rights and profiles - SetupDevelopmentUser rights and profilesSetup 100% 11-03 3 14-03 On Track
41 Development - User rights and profiles - Profile1 testsDevelopmentUser rights and profilesProfile1 tests 100% 14-03 1 15-03 On Track
42 Development - User rights and profiles - Profile2 testsDevelopmentUser rights and profilesProfile2 tests 100% 14-03 1 15-03 On Track
43 Development - User rights and profiles - Regression testsDevelopmentUser rights and profilesRegression tests 100% 15-03 3 20-03 On Track
44 Development - General acceptance tests walkthroughDevelopmentGeneral acceptance tests walkthrough 100% 20-03 10 3-04 On Track
Finish Status
EPM ImplementationTask Name Owner Progress Start Duration (workdays)
27
is embedded, SAP BW and SAP BPC will be using the data in real time. In this case, the source of master
data maintenance is ERP itself by Standard Hana Views which are specifically designed for standard
Characteristics (Dimensions) of BW 7.5 Embedded on S/4HANA (Pattanayak & Koppolu, 2016).
The exchange rates are also maintained for the planning year. It is important to have a currency type
by planning year to see always the same figures in the reporting layer. For the currency exchange
purposes, standard currency exchange method that is designed in the Analysis for Office is used.
Reports are using exchange rates in ERP system automatically to convert any exchange rate to default
exchange rate by considering date dimension in the report.
Any storing data, calculation, data retraction, transformation, and transportation will be held by
standard BW and BPC elements which are presented below:
The designed unified model comprises a set of objects whose purpose is to store, relate, display and
enable, manual input of data. To be able to interpret the future Planning & Budgeting technical model,
it is useful to be aware of data warehouse technical concepts. The list below describes the most
relevant and essential concepts that apply to a data warehouse system.
1) Info Package – An Info Package is a data loading scheduler where data from the source system
is extracted from the data warehouse system.
2) Transformation – A transformation allows data consolidation, cleansing, and integration. It
converts the fields of the source into the format of the target.
3) Info Cube – From an analytical perspective, an Info Cube describes a self-contained dataset,
for example, for a business-orientated area. It is structured by a set of relational tables that
follow the extended star schema where one fact table is surrounded by several dimension
tables. It is used to store aggregated data for long periods of time, on which a user can execute
queries.
4) Info Object – An Info Object is the smallest units of BI. It can be defined as a business evaluation
object divided into characteristics (for example, customers), key figures (for example,
revenue), units (for example, currency, amount unit), time characteristics (for example, fiscal
year) and technical characteristics (for example, purchase number).
5) Data Store Object - A DataStore object, serves as a storage location for consolidated and
cleansed transaction data or master data on a document (atomic) level.
A Data Store object contains key fields (such as document number, document item) and data
fields that, in addition to key figures, can also include character fields (such as order status,
customer). The data from a DataStore object can be updated with a delta update into Info
Cubes (standard) and other DataStore objects or master data tables (attributes or texts) in the
same system or across different systems.
6) Info Provider - Info Providers are various metadata objects that can be seen as uniform data
providers from the viewpoint of a query definition. Their data can, therefore, be analyzed
uniformly. The type of data staging and the degree of detail or 'proximity' to the source system
in the data flow diagram differs from Info Provider to Info Provider (Bekmezci, 2017).
7) Multi-Provider - A Multi-Provider is a type of Info Provider that combines data from some Info
Providers and makes it available for analysis purposes. The Multi-Provider itself does not
contain any data. Its data comes entirely from the Info Providers on which it is based. These
Info Providers are connected by a union operation.
28
8) Aggregation level - Aggregation levels are used as Info Providers for planning: with an
aggregation level, the system can model levels whose data can be changed manually using
input-ready queries or automatically using planning functions. An aggregation level is set using
a set of characteristics and key figures from the underlying Info Provider (Bekmezci, 2017).
9) Planning Functions – Planning functions are used to perform mass updates in planning
scenarios such as copying actual to plan, deletions, and calculating revenue.
10) Planning Sequences – A Planning Sequence, is used to group planning functions. It allows
saving groups of planning functions in a sorted sequence and executing groups of planning
functions sequentially.
11) Filters - A Filter is an object that describes a multidimensional segment of data from a dataset.
Filters are used in reporting, analysis, and planning, for example, to restrict data to a specific
business area, certain product groups or specific time periods.
12) Characteristics – Characteristics are descriptive attributes used to describe entities such as
Customers, Vendor, Materials, Plants, etc. These represent who, what, when, where scenario.
13) Master Data Characteristics – Master Data Characteristics are the characteristics that contain
text, attributes and sometimes hierarchies. In general, master data will be loaded into these
characteristics using a direct update from the source system (Merz, Hugens, & Blum,
Implementing SAP BW on SAP HANA, 2015).
14) Key Figures – Key Figures are operational attributes, which indicates statistical measures such
as amount related, Weight-related, a quantity related, etc. These represent how much and
how many scenarios.
15) Data Manager Packages - All transactional data for performing a consolidation is sourced from
the respective ledger (IFRS or Local) maintained in SAP ERP, according to each Scope and
Version of Data selected. Initially, data will be extracted from the SAP ERP system into SAP BW
staging info provider. Once this extraction process is completed, key users in SAP BPC, using a
data manager package, will load data on demand.
The data loaded from BW will also require creating BPC transformation and conversion files
that will complete the process of transforming the general ledger data into the record with
valid SAP BPC dimension members.
SAP BW system will be the collector of data from different source systems: flat-files (for Out-
SAP companies) and SAP ERP. Business routines, transformations and specific rules to the
Group Company consolidation process will be applied throughout this process stage. SAP BW
embedded will be the only system responsible for the BPC’s data storage.
16) Manual Journal entry – Each application can have one journal entry template which can be
used to enter financial transactions on manual type data sources in BPC. These can represent
various journal entries such as reporting reclassifications, which are not natively part of the
data loaded from G/L
17) Manual Input Schedules – While most transaction data would come via data obtained from
the general ledger using a data manager package, there are additional unstructured data that
would be required by the system to process a consolidation. In cases where loading data from
BW or files does not make sense, then such data would be loaded using manual input schedules
(Bekmezci, 2017).
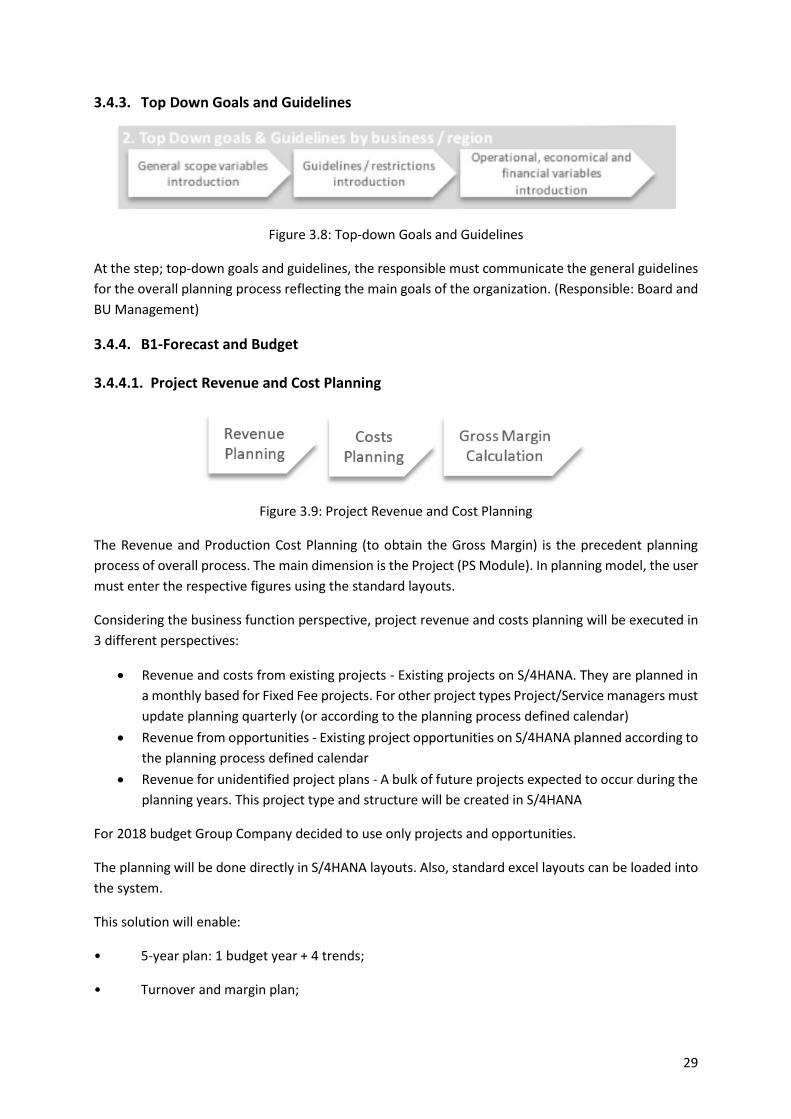
29
3.4.3. Top Down Goals and Guidelines
Figure 3.8: Top-down Goals and Guidelines
At the step; top-down goals and guidelines, the responsible must communicate the general guidelines
for the overall planning process reflecting the main goals of the organization. (Responsible: Board and
BU Management)
3.4.4. B1-Forecast and Budget
3.4.4.1. Project Revenue and Cost Planning
Figure 3.9: Project Revenue and Cost Planning
The Revenue and Production Cost Planning (to obtain the Gross Margin) is the precedent planning
process of overall process. The main dimension is the Project (PS Module). In planning model, the user
must enter the respective figures using the standard layouts.
Considering the business function perspective, project revenue and costs planning will be executed in
3 different perspectives:
• Revenue and costs from existing projects - Existing projects on S/4HANA. They are planned in
a monthly based for Fixed Fee projects. For other project types Project/Service managers must
update planning quarterly (or according to the planning process defined calendar)
• Revenue from opportunities - Existing project opportunities on S/4HANA planned according to
the planning process defined calendar
• Revenue for unidentified project plans - A bulk of future projects expected to occur during the
planning years. This project type and structure will be created in S/4HANA
For 2018 budget Group Company decided to use only projects and opportunities.
The planning will be done directly in S/4HANA layouts. Also, standard excel layouts can be loaded into
the system.
This solution will enable:
• 5-year plan: 1 budget year + 4 trends;
• Turnover and margin plan;
30
• Forecasts: can be done for a new budget cycle or during budget revision.
Main Structure in BW regarding with OPEX, P&L, Balance Sheet, Cash Flow planning includes structures
below:
Three types of Data providers are used to maintain the store, union, and aggregate in SAP S/4HANA
Embedded Business Warehouse. Each cube has either planning or reporting property enabled and each
of aggregation regarding with those cubes are running planning functions to make the calculations by
the limitation of filters which are also designed for them. Aggregation levels are getting created on
Multi Providers which consist both actual data info cube and planning info cube underneath. Actual
data info cubes are connected to real-time Hana views to show live data from ERP. Hana Views are
views of ERP tables which store real-time data. These real-time data is also presented in the Info Cubes
on live.
Figure 3.10: HANA Studio Overview
Planning cubes are open for planning for the budget inputs from Analysis for Office Input Reports which
are presented below. Function Modules are used for any calculation on Aggregation levels. These
Functions can be available to run from Analysis for Office Reports by assigning to buttons or links via
macros. When the user clicks on these buttons, Planning Engines runs the functions on the aggregation
level that they are assigned and make the calculated values visible on the reports on time. These
calculated values are on the air if they are not saved by the save function.

31
Figure 3.11: Main Info Providers of OPEX and FI Functions
Each Planning cube has a standard data slice which is supported by an external function. This
function enables and cancels the data slice of the planning cubes with the help of “run command”
from planning functions. Each planning sequences have these activate and deactivate planning
functions at the begging and end of planning sequence.
Figure 3.12: ZFI_R01 Characteristic Relationships
Figure 3.13: Data Slices
These planning functions are presented at Annexes – Figure 8.6, Table 8.1 and Table 8.2. Purpose of
the data slice is to block the time interval which is out of the planning period. On Figure 3.13, Data Slice
can be identified clearly. When months before June has a purple color and not open to plan, the rest
Description Type Technical ID Planning Divison Information Input Planning Objects
ZFI Info Area N/A N/A N/A N/A
BL Mappings Aggregation ZAL_FI006 BS, CF Planning BL Account Mappings ZFI_M03
BL/CF Assumptions Aggregation ZAL_FI007 BS, CF Planning BL/CF Assumptions Input Aggregation ZFI_M03
BPC:Active/Deactive Data Slice Aggregation ZAL_FI099 Data Slice Time Data Slice for Planning ZFI_M01
Balance - Accumulated Aggregation ZAL_FI012 BS, CF Planning BL Accumulated Data ZFI_M03
Balance - PL->BS Aggregation ZAL_FI011 BS, CF Planning Data Transformation from PL to BS ZFI_M03
CF Mappings Aggregation ZAL_FI008 BS, CF Planning CF Account Mappings ZFI_M03
CF Report Aggregation ZAL_FI009 BS, CF Planning CF Reporting Data ZFI_M03
Cash Flow - Accumulated Aggregation ZAL_FI013 BS, CF Planning CF Accumulated Data ZFI_M03
Cash Flow - Final Aggregation ZAL_FI014 BS, CF Planning CF Final Data ZFI_M03
Cash Flow - Calculation Assumptions Aggregation ZAL_FI015 BS, CF Planning CF Assumption Data ZFI_M03
Non-Production - Cost to Profit Actual Aggregation ZAL_FI010 OPEX OPEX Cost to Profit Center Actual ZFI_M01
Non-Production - Cost to Profit by month Aggregation ZAL_FI003 OPEX OPEX Cost to Profit Center Actual by Month ZFI_M01
Non-Production Cost Center Planning on Years Aggregation ZAL_FI001 OPEX OPEX Cost Center Planning on Years ZFI_M01
P&L - Integration BPC and ERP Aggregation ZAL_FI004 P&L Planning P&L All Data Collection Aggregation ZFI_M02
P&L Copy Aggregation ZAL_FI016 P&L Planning Not Used ZFI_M04
P&L Input Data Aggregation ZAL_FI005 P&L Planning P&L Input Data ZFI_M02
Percent Input for Cost Center Aggregation ZAL_FI002 OPEX OPEX Percentage Input Aggregation ZFI_M01
BL/CF Balance Actuals Cube ZFI_C01 BS, CF Planning BS, CF Planning Actuals from FI Data Source ZFI_M03
BPC: Balance Sheet Cube ZFI_R03 BS, CF Planning Balance Sheet Cube ZFI_M03
BPC: Cash Flow Cube ZFI_R05 BS, CF Planning Cash Flow Cube ZFI_M03
BPC: FI Planning Cube ZFI_R01 OPEX OPEX Cube ZFI_M01
BPC: P&L Cube ZFI_R02 P&L Planning P&L Cube ZFI_M02
BPC: P&L for Report Cube ZFI_R06 P&L Planning P&L Cube for only Reporting(not input ready) ZFI_M02
BPC: Balance and CF Multi ProviderZFI_M03 BS, CF Planning BS and CF MP(Details are below) ZFI_M03
BPC: FI Actual-Planning MP Multi ProviderZFI_M01 OPEX OPEX MP(Details are below) ZFI_M01
BPC: P&L Multi ProviderZFI_M02 P&L Planning P&L MP(Details are below) ZFI_M02
BPC FI Cost Center Plan Comments(Direct Update) DSO ZFI_O01 OPEX OPEX Input Planning Comments N/A
OPEX, P&L, BS, CF
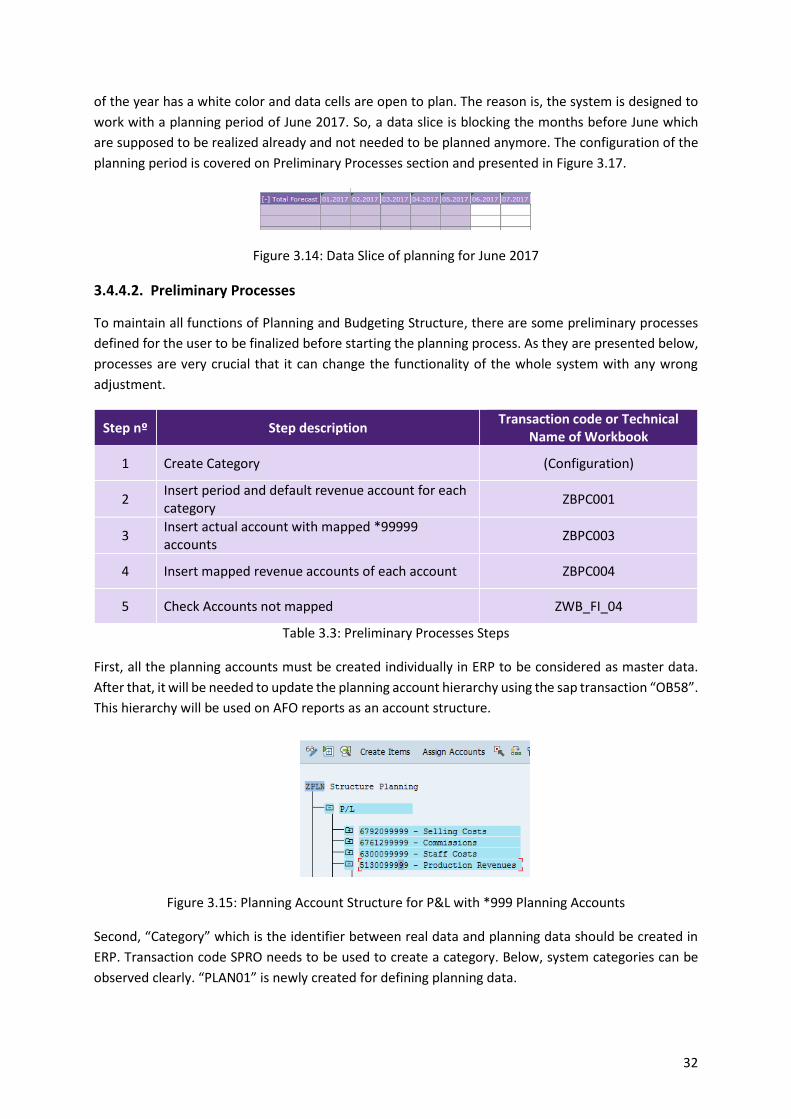
32
of the year has a white color and data cells are open to plan. The reason is, the system is designed to
work with a planning period of June 2017. So, a data slice is blocking the months before June which
are supposed to be realized already and not needed to be planned anymore. The configuration of the
planning period is covered on Preliminary Processes section and presented in Figure 3.17.
Figure 3.14: Data Slice of planning for June 2017
3.4.4.2. Preliminary Processes
To maintain all functions of Planning and Budgeting Structure, there are some preliminary processes
defined for the user to be finalized before starting the planning process. As they are presented below,
processes are very crucial that it can change the functionality of the whole system with any wrong
adjustment.
Step nº Step description Transaction code or Technical
Name of Workbook
1 Create Category (Configuration)
2 Insert period and default revenue account for each category
ZBPC001
3 Insert actual account with mapped *99999 accounts
ZBPC003
4 Insert mapped revenue accounts of each account ZBPC004
5 Check Accounts not mapped ZWB_FI_04
Table 3.3: Preliminary Processes Steps
First, all the planning accounts must be created individually in ERP to be considered as master data.
After that, it will be needed to update the planning account hierarchy using the sap transaction “OB58”.
This hierarchy will be used on AFO reports as an account structure.
Figure 3.15: Planning Account Structure for P&L with *999 Planning Accounts
Second, “Category” which is the identifier between real data and planning data should be created in
ERP. Transaction code SPRO needs to be used to create a category. Below, system categories can be
observed clearly. “PLAN01” is newly created for defining planning data.

33
Figure 3.16: Categories in SPRO
Then the planning period needs to be addressed in the system through custom transaction code
“ZBPC0003”.
Figure 3.17: Planning Period for Category in SPRO
After that mapped *999 planning accounts need to be introduced in the system with their related
actual accounts. For this function, the custom table is created with custom SAP transaction code
“ZBPC0003”.
Figure 3.18: Actual Accounts to *999 Planning Accounts mapping
To have a checkpoint, “AFO Report Accounts not Mapped” is created advance. It will show all the
accounts that have actual values to the year selected and will be possible to check which accounts are
still not mapped.

34
Figure 3.19: Accounts not Mapped AFO Report
At last every actual revenue account for each actual cost accounts needs to be addressed in the custom
transaction code “ZBPC0004”. If the cost account is not mapped to any revenue account on this table,
the revenue account of that account will be assumed as the same revenue account which is designated
for the category itself as it is presented in Figure 3.17.
Figure 3.20: Revenue Account Mapping
3.4.4.3. CAPEX
For CAPEX two different approaches will be taken:
• Investment Projects
• Investment Projects to fixed assets.
The CAPEX planning will be done by different users in S/4HANA at WBS level. This process already exists
in S/4HANA (ERP) environment. This functionality allows the user to plan values by cost element for a
project in ERP itself. This is an ERP standard process that is designed to keep planned costs in the FI
module of ERP.
SAP FIORI APP: S/4HANA Menu
SAP TCODE: CJR2

35
Figure 3.21: CJR2 CAPEX Planning Input Screen on S/4HANA
3.4.4.4. OPEX Planning
Other OPEX can be planned by using a specific Analysis for Office Input Report. This layout will be
developed in BPC side because the standard Cost Center Planning in S/4HANA doesn’t have Trading
Partner dimension available.
The user must insert the respective costs of his entity by year, and the system will split by budget
months, but the user can change monthly.
Step nº Step description Transaction code or Technical
Name of Workbook
1 Load actual and insert actual year forecast or 5 years’ trend.
ZWB_FI_01
2 Insert Actual Year Forecast and Budget Year by month
ZWB_FI_05
3 Insert percentages to change budget years. ZWB_FI_02
Table 3.4: OPEX Planning Applicable Steps
As the project planning is an important operation at a project level, because it gives the project
manager an overview of the costs, different versions will be available to do the planning. Therefore,
history will be available with all the changes which can be compared at any time. The currency is fixed
as “EURO” by default.
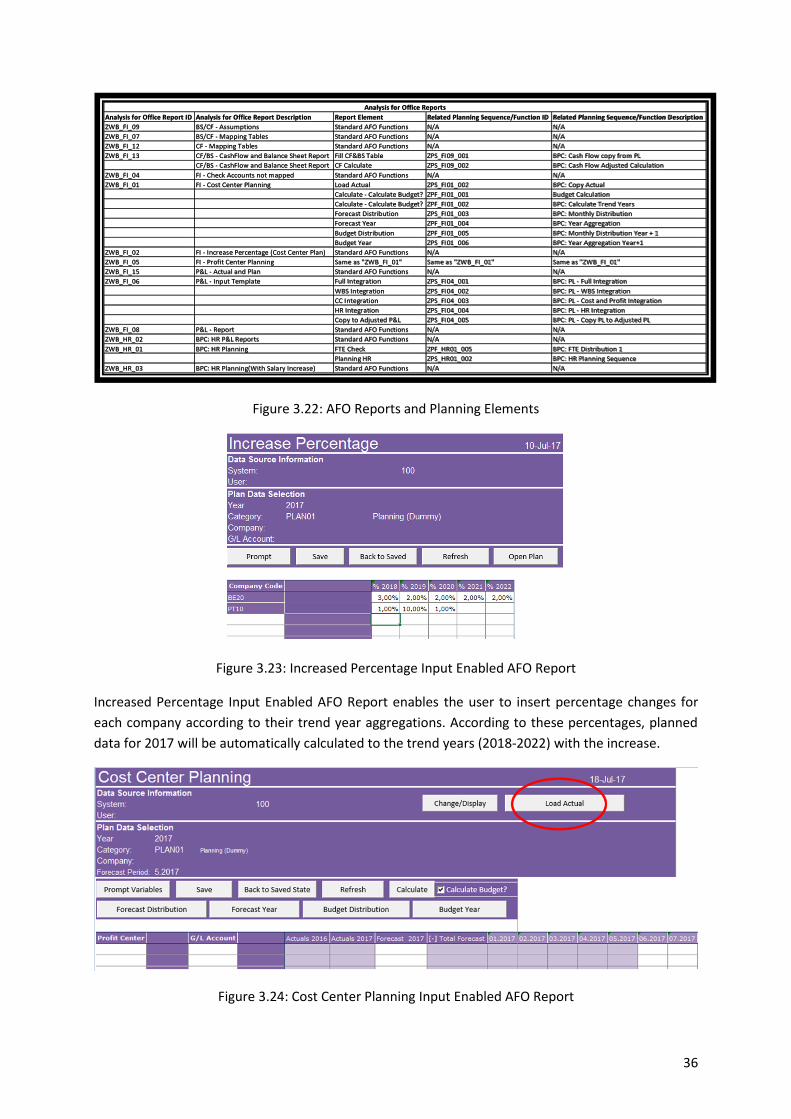
36
Figure 3.22: AFO Reports and Planning Elements
Figure 3.23: Increased Percentage Input Enabled AFO Report
Increased Percentage Input Enabled AFO Report enables the user to insert percentage changes for
each company according to their trend year aggregations. According to these percentages, planned
data for 2017 will be automatically calculated to the trend years (2018-2022) with the increase.
Figure 3.24: Cost Center Planning Input Enabled AFO Report
Analysis for Office Report ID Analysis for Office Report Description Report Element Related Planning Sequence/Function ID Related Planning Sequence/Function Description
ZWB_FI_09 BS/CF - Assumptions Standard AFO Functions N/A N/A
ZWB_FI_07 BS/CF - Mapping Tables Standard AFO Functions N/A N/A
ZWB_FI_12 CF - Mapping Tables Standard AFO Functions N/A N/A
ZWB_FI_13 CF/BS - CashFlow and Balance Sheet Report Fill CF&BS Table ZPS_FI09_001 BPC: Cash Flow copy from PL
CF/BS - CashFlow and Balance Sheet Report CF Calculate ZPS_FI09_002 BPC: Cash Flow Adjusted Calculation
ZWB_FI_04 FI - Check Accounts not mapped Standard AFO Functions N/A N/A
ZWB_FI_01 FI - Cost Center Planning Load Actual ZPS_FI01_002 BPC: Copy Actual
Calculate - Calculate Budget? ZPF_FI01_001 Budget Calculation
Calculate - Calculate Budget? ZPF_FI01_002 BPC: Calculate Trend Years
Forecast Distribution ZPS_FI01_003 BPC: Monthly Distribution
Forecast Year ZPF_FI01_004 BPC: Year Aggregation
Budget Distribution ZPF_FI01_005 BPC: Monthly Distribution Year + 1
Budget Year ZPS_FI01_006 BPC: Year Aggregation Year+1
ZWB_FI_02 FI - Increase Percentage (Cost Center Plan) Standard AFO Functions N/A N/A
ZWB_FI_05 FI - Profit Center Planning Same as "ZWB_FI_01" Same as "ZWB_FI_01" Same as "ZWB_FI_01"
ZWB_FI_15 P&L - Actual and Plan Standard AFO Functions N/A N/A
ZWB_FI_06 P&L - Input Template Full Integration ZPS_FI04_001 BPC: PL - Full Integration
WBS Integration ZPS_FI04_002 BPC: PL - WBS Integration
CC Integration ZPS_FI04_003 BPC: PL - Cost and Profit Integration
HR Integration ZPS_FI04_004 BPC: PL - HR Integration
Copy to Adjusted P&L ZPS_FI04_005 BPC: PL - Copy PL to Adjusted PL
ZWB_FI_08 P&L - Report Standard AFO Functions N/A N/A
ZWB_HR_02 BPC: HR P&L Reports Standard AFO Functions N/A N/A
ZWB_HR_01 BPC: HR Planning FTE Check ZPF_HR01_005 BPC: FTE Distribution 1
Planning HR ZPS_HR01_002 BPC: HR Planning Sequence
ZWB_HR_03 BPC: HR Planning(With Salary Increase) Standard AFO Functions N/A N/A
Analysis for Office Reports
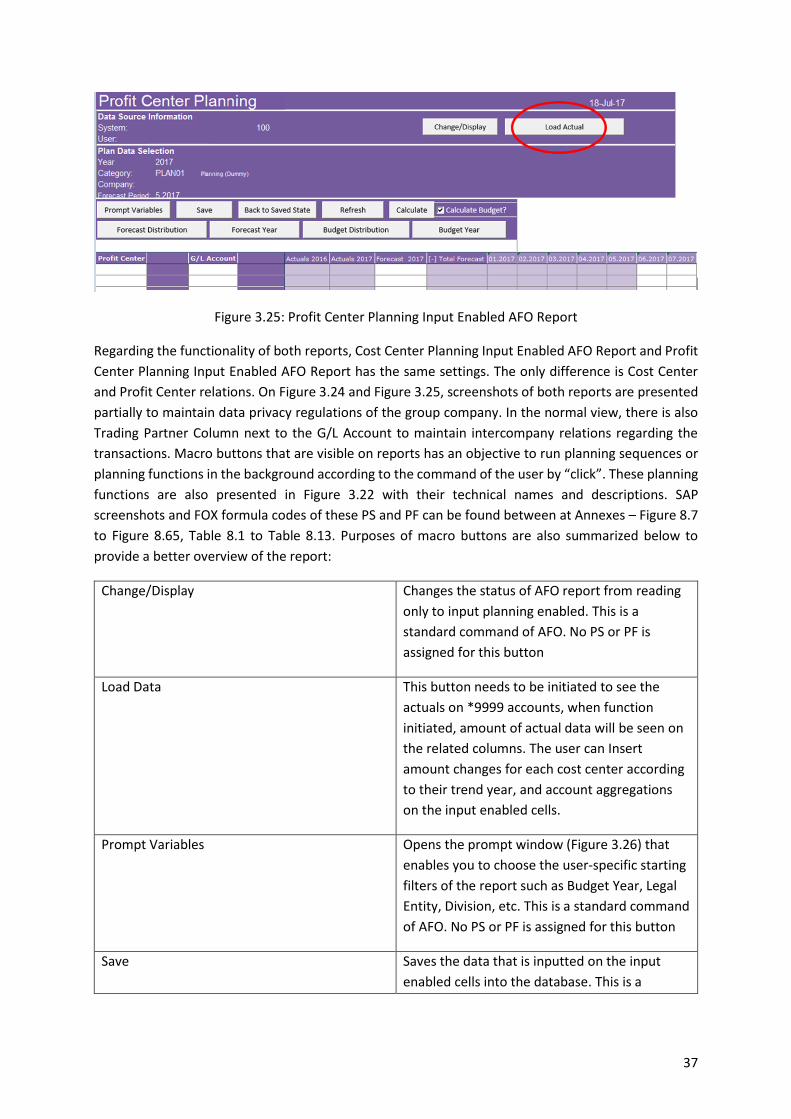
37
Figure 3.25: Profit Center Planning Input Enabled AFO Report
Regarding the functionality of both reports, Cost Center Planning Input Enabled AFO Report and Profit
Center Planning Input Enabled AFO Report has the same settings. The only difference is Cost Center
and Profit Center relations. On Figure 3.24 and Figure 3.25, screenshots of both reports are presented
partially to maintain data privacy regulations of the group company. In the normal view, there is also
Trading Partner Column next to the G/L Account to maintain intercompany relations regarding the
transactions. Macro buttons that are visible on reports has an objective to run planning sequences or
planning functions in the background according to the command of the user by “click”. These planning
functions are also presented in Figure 3.22 with their technical names and descriptions. SAP
screenshots and FOX formula codes of these PS and PF can be found between at Annexes – Figure 8.7
to Figure 8.65, Table 8.1 to Table 8.13. Purposes of macro buttons are also summarized below to
provide a better overview of the report:
Change/Display Changes the status of AFO report from reading
only to input planning enabled. This is a
standard command of AFO. No PS or PF is
assigned for this button
Load Data This button needs to be initiated to see the
actuals on *9999 accounts, when function
initiated, amount of actual data will be seen on
the related columns. The user can Insert
amount changes for each cost center according
to their trend year, and account aggregations
on the input enabled cells.
Prompt Variables Opens the prompt window (Figure 3.26) that
enables you to choose the user-specific starting
filters of the report such as Budget Year, Legal
Entity, Division, etc. This is a standard command
of AFO. No PS or PF is assigned for this button
Save Saves the data that is inputted on the input
enabled cells into the database. This is a
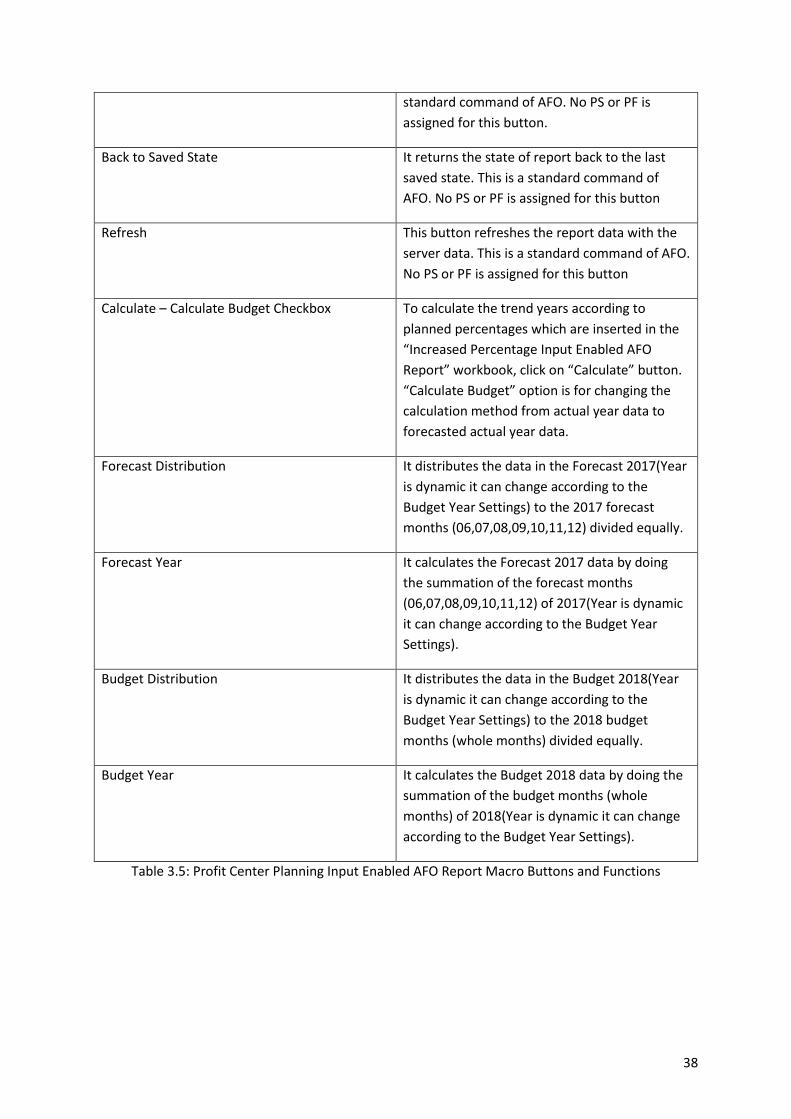
38
standard command of AFO. No PS or PF is
assigned for this button.
Back to Saved State It returns the state of report back to the last
saved state. This is a standard command of
AFO. No PS or PF is assigned for this button
Refresh This button refreshes the report data with the
server data. This is a standard command of AFO.
No PS or PF is assigned for this button
Calculate – Calculate Budget Checkbox To calculate the trend years according to
planned percentages which are inserted in the
“Increased Percentage Input Enabled AFO
Report” workbook, click on “Calculate” button.
“Calculate Budget” option is for changing the
calculation method from actual year data to
forecasted actual year data.
Forecast Distribution It distributes the data in the Forecast 2017(Year
is dynamic it can change according to the
Budget Year Settings) to the 2017 forecast
months (06,07,08,09,10,11,12) divided equally.
Forecast Year It calculates the Forecast 2017 data by doing
the summation of the forecast months
(06,07,08,09,10,11,12) of 2017(Year is dynamic
it can change according to the Budget Year
Settings).
Budget Distribution It distributes the data in the Budget 2018(Year
is dynamic it can change according to the
Budget Year Settings) to the 2018 budget
months (whole months) divided equally.
Budget Year It calculates the Budget 2018 data by doing the
summation of the budget months (whole
months) of 2018(Year is dynamic it can change
according to the Budget Year Settings).
Table 3.5: Profit Center Planning Input Enabled AFO Report Macro Buttons and Functions
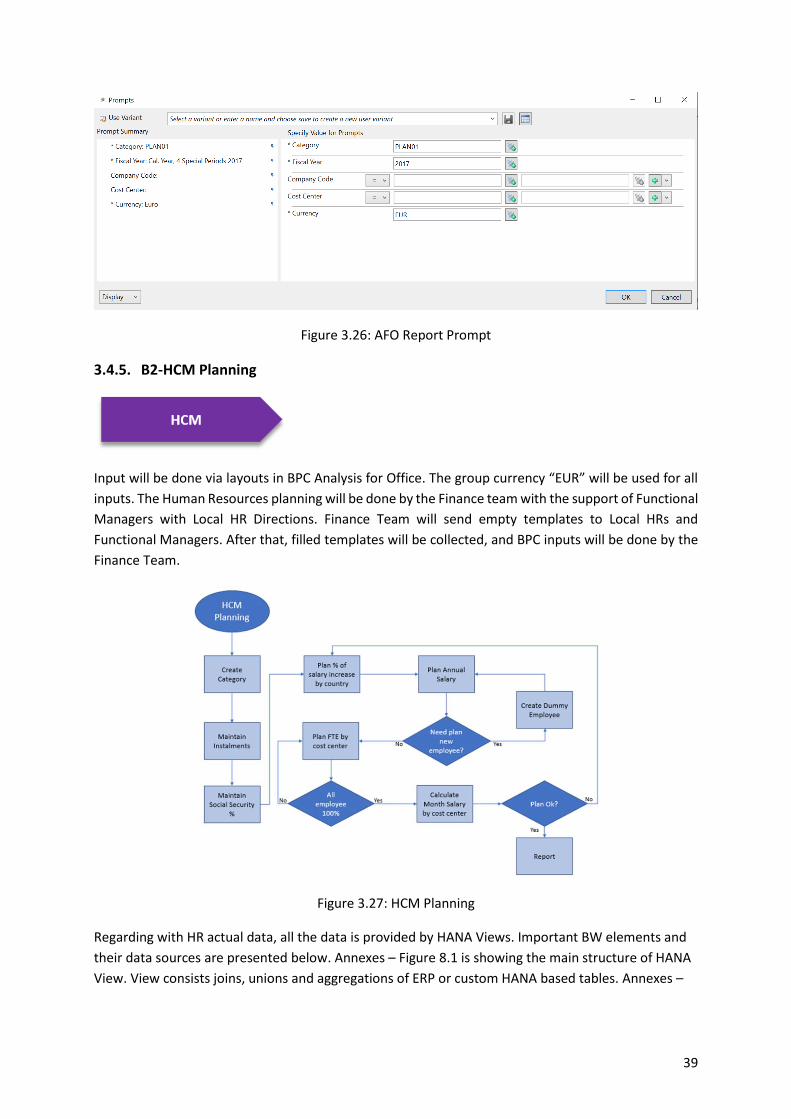
39
Figure 3.26: AFO Report Prompt
3.4.5. B2-HCM Planning
Input will be done via layouts in BPC Analysis for Office. The group currency “EUR” will be used for all
inputs. The Human Resources planning will be done by the Finance team with the support of Functional
Managers with Local HR Directions. Finance Team will send empty templates to Local HRs and
Functional Managers. After that, filled templates will be collected, and BPC inputs will be done by the
Finance Team.
Figure 3.27: HCM Planning
Regarding with HR actual data, all the data is provided by HANA Views. Important BW elements and
their data sources are presented below. Annexes – Figure 8.1 is showing the main structure of HANA
View. View consists joins, unions and aggregations of ERP or custom HANA based tables. Annexes –

40
Figure 8.2 to Figure 8.4 are showing the main details of SAP BW structure of Info Cubes and their
design1.
ZEMPLOYEE: CV_EMPLOYEE_DM
/ERP/COSTCNTR: CV_COSTCENTER_DM
ZHR_V02: CV_HR_01 (Test)
ZHR_V01: CV_HRSALARY TOTAL (Real)
All HR HANA Views:
Figure 3.28: All HR HANA Views for Actual Data
Figure 3.29: HR-HCM Planning Applicable Steps
FTE – Employee Input Enabled AFO Report allows the user to plan employee’s salary and FTEs. On this
report, the actual FTEs for the actual year, by the employee, will be shown as well. It is possible to
change the planning data, by filling the input enabled cells. The months that will be available for input,
dependent on the planning period that is assigned. So actual months before the planning period are
locked to plan. Planning of FTEs for the next year is fully available without any lock.
1 Because of the data and metadata privacy limitations from the business side, details of used
Info Cubes and HANA Views are not presented in the annexes. Example structures from the system is presented to cover all functionalities which are used.

41
Figure 3.30: HCM Planning FTE - Employee Input Enabled AFO Report
HCM Planning Annual Salary - Employee Input Enabled AFO Report allows the user to plan every detail
of the cost of an employee including salary, benefits, promotions and, etc. “Planning Sequence” button
will run the planning sequence calculation presented in Annexes – Figure 8.54 that is calculating the
total cost for each employee. Involved planning functions are also presented in Annexes – Figure 3.22
with their technical names and descriptions. SAP screenshots and FOX formula codes of these planning
sequences and planning functions can be found at Annexes – Figure 8.51 to Figure 8.67 and Table 8.13
to Table 8.18.
Figure 3.31: HCM Planning Annual Salary - Employee Input Enabled AFO Report
3.4.6. B3-Financial and Operational Reporting
Figure 3.32: Financial and Operational Reporting Elements
It was defined a new P&L (Profit and Loss), BS (Balance Sheet) and CF (Cash Flow) structure for planning
purposes and a new set of business rules to derive the BS and CF statements directly from P&L. This
structure must be defined in the BPC solution, and the engine derivation will be created specifically for
this process. Customized tables and specific ABAP programs will be developed to accomplish this
functionality.
The Finance Planning is the aggregation of data from operational budgets (Project Revenues and Costs,
CAPEX, HCM, and other OPEX) and Intercompany Recharge planning to generate automatically
Financial Statements by the entity. It will be created several tables in the system to customize the
accounting rules for Financial Statements derivation (P&L - BS; P&L - CF; CF - BS). The engine derivation
will read the input data from previous budgets and populate P&L Input Layout. From here the system
will calculate the Balance Sheet and Cash Flow based on accounting rules previously defined.
During the current planning year, the user can execute the existent reports in S/4HANA side and the
reports developed for this solution to control the deviation from actuals and plan data.
The reports to be developed are:
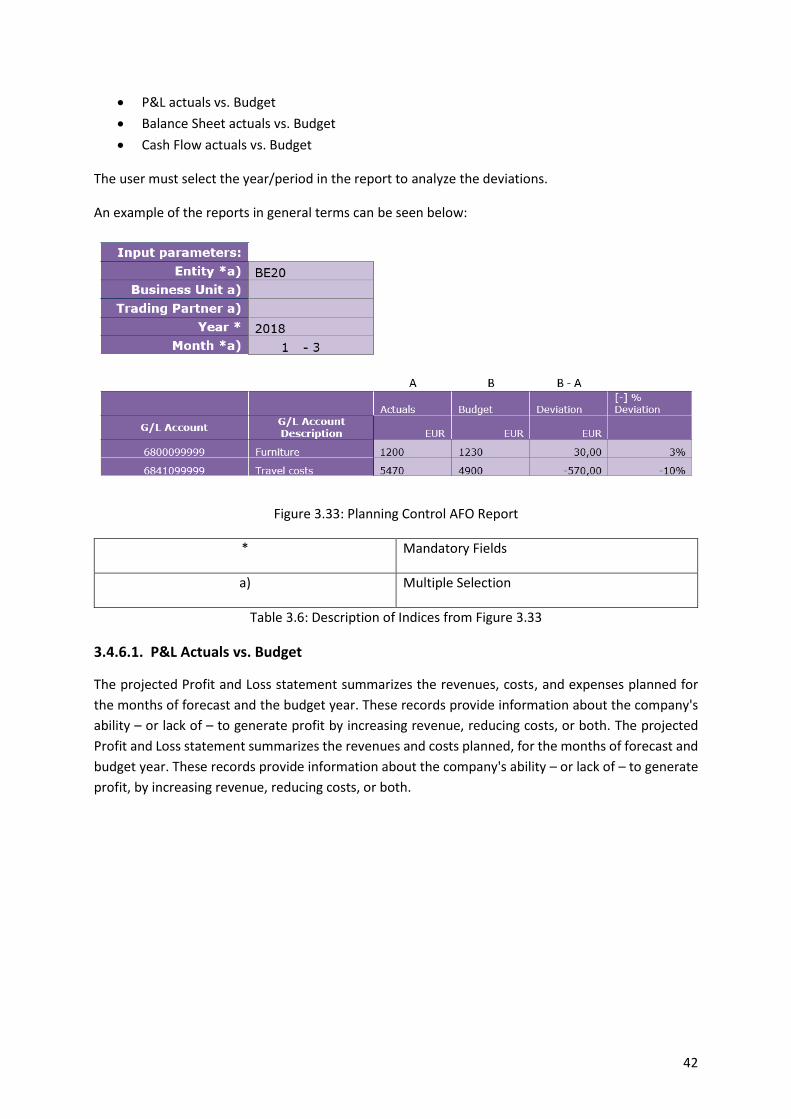
42
• P&L actuals vs. Budget
• Balance Sheet actuals vs. Budget
• Cash Flow actuals vs. Budget
The user must select the year/period in the report to analyze the deviations.
An example of the reports in general terms can be seen below:
Figure 3.33: Planning Control AFO Report
* Mandatory Fields
a) Multiple Selection
Table 3.6: Description of Indices from Figure 3.33
3.4.6.1. P&L Actuals vs. Budget
The projected Profit and Loss statement summarizes the revenues, costs, and expenses planned for
the months of forecast and the budget year. These records provide information about the company's
ability – or lack of – to generate profit by increasing revenue, reducing costs, or both. The projected
Profit and Loss statement summarizes the revenues and costs planned, for the months of forecast and
budget year. These records provide information about the company's ability – or lack of – to generate
profit, by increasing revenue, reducing costs, or both.
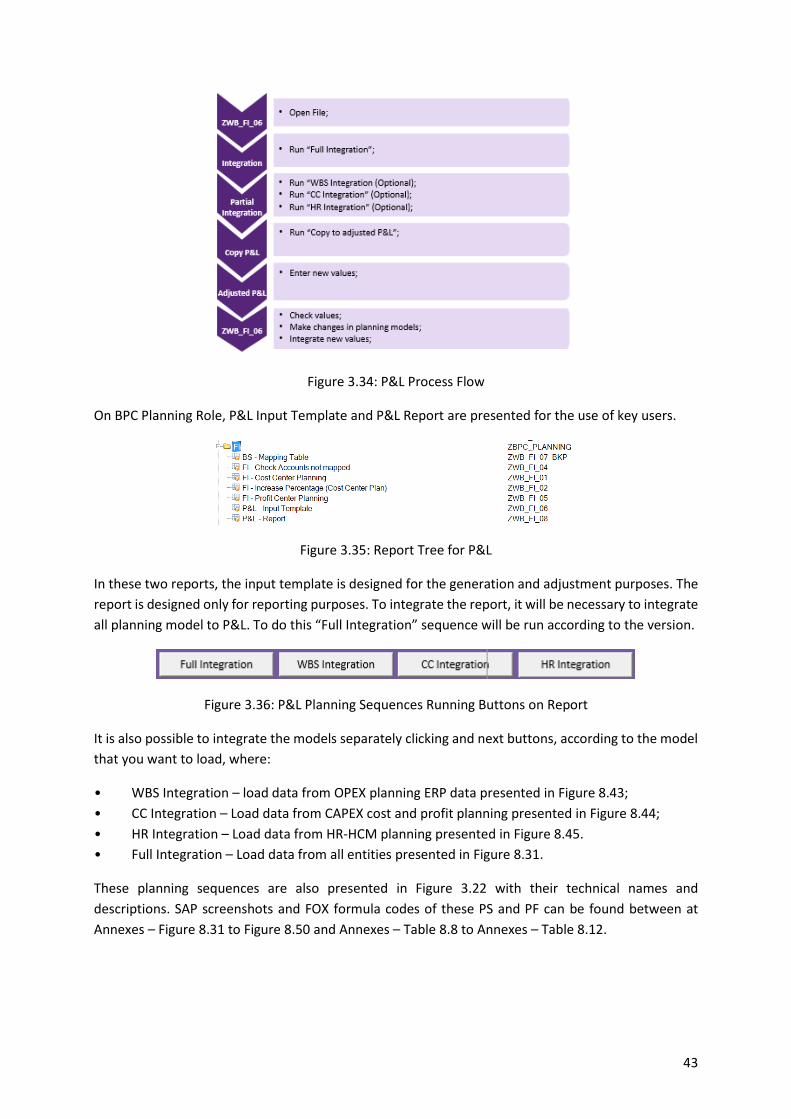
43
Figure 3.34: P&L Process Flow
On BPC Planning Role, P&L Input Template and P&L Report are presented for the use of key users.
Figure 3.35: Report Tree for P&L
In these two reports, the input template is designed for the generation and adjustment purposes. The
report is designed only for reporting purposes. To integrate the report, it will be necessary to integrate
all planning model to P&L. To do this “Full Integration” sequence will be run according to the version.
Figure 3.36: P&L Planning Sequences Running Buttons on Report
It is also possible to integrate the models separately clicking and next buttons, according to the model
that you want to load, where:
• WBS Integration – load data from OPEX planning ERP data presented in Figure 8.43;
• CC Integration – Load data from CAPEX cost and profit planning presented in Figure 8.44;
• HR Integration – Load data from HR-HCM planning presented in Figure 8.45.
• Full Integration – Load data from all entities presented in Figure 8.31.
These planning sequences are also presented in Figure 3.22 with their technical names and
descriptions. SAP screenshots and FOX formula codes of these PS and PF can be found between at
Annexes – Figure 8.31 to Figure 8.50 and Annexes – Table 8.8 to Annexes – Table 8.12.

44
Figure 3.37: P&L Input Enabled AFO Report
In the adjusted P&L, it will be possible to change values for all years (by month to first two years and
by year to the other years), without affect planning data.
This functionality will allow the planner to simulate a P&L without back to the other models but will
not possible to retract values automatically. To have the value changes in the official P&L, planner will
need to change the source data.
Figure 3.38: Profit and Loss Budgeting Info Providers
3.4.6.2. Cash Flow actuals vs. Budget
Projected Cash flow will be used to assess the quality of the company's income during forecast months
and budget year, which means, how liquid it will be. It will be able to indicate whether the company is
positioned to remain solvent. Projected Cash flow will be used to assess the quality of the company's
income, during forecast months and budget year, which means, how liquid it will be. It will be able to
indicate whether the company is positioned to remain solvent.
Cash flow, is the net amount of cash and cash-equivalents, moving into and out of business. Positive
cash flow indicates that a company's liquid assets are increasing, enabling it to settle debts, return
money to shareholders, pay expenses, reinvest in its business and provide a buffer against future
financial challenges. Negative cash flow indicates that a company's liquid assets are decreasing.
Figure 3.39: Report Tree for Cash Flow
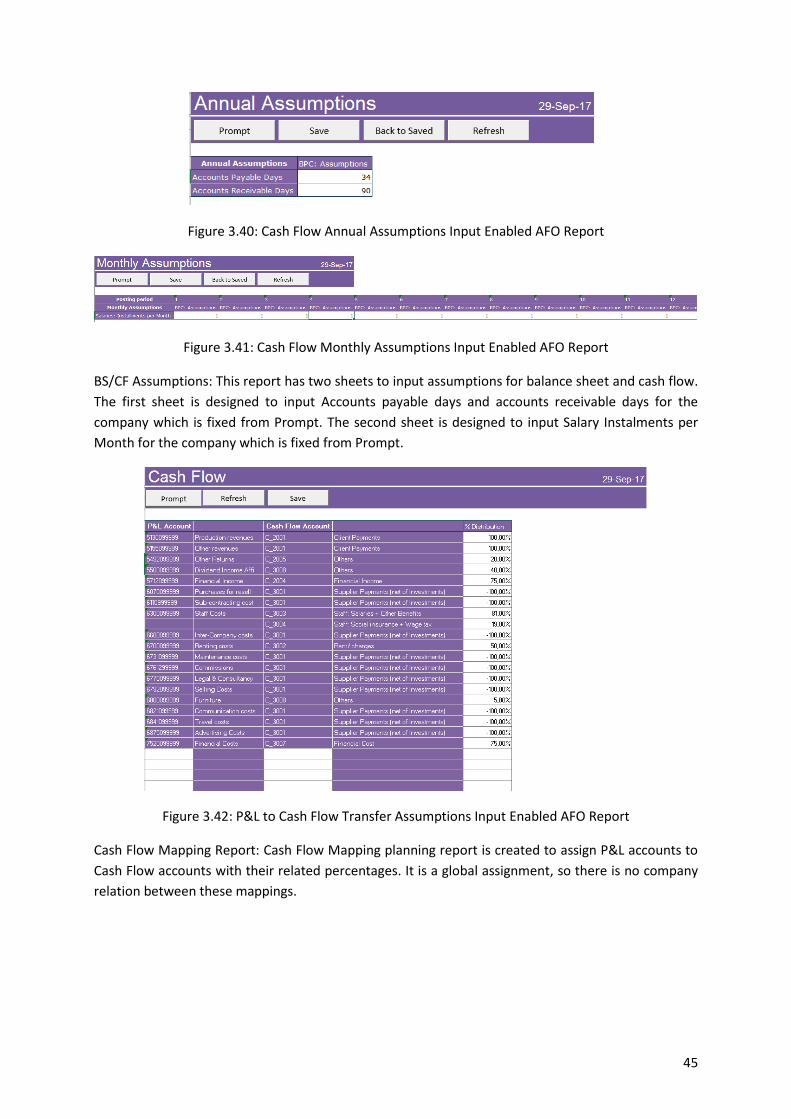
45
Figure 3.40: Cash Flow Annual Assumptions Input Enabled AFO Report
Figure 3.41: Cash Flow Monthly Assumptions Input Enabled AFO Report
BS/CF Assumptions: This report has two sheets to input assumptions for balance sheet and cash flow.
The first sheet is designed to input Accounts payable days and accounts receivable days for the
company which is fixed from Prompt. The second sheet is designed to input Salary Instalments per
Month for the company which is fixed from Prompt.
Figure 3.42: P&L to Cash Flow Transfer Assumptions Input Enabled AFO Report
Cash Flow Mapping Report: Cash Flow Mapping planning report is created to assign P&L accounts to
Cash Flow accounts with their related percentages. It is a global assignment, so there is no company
relation between these mappings.
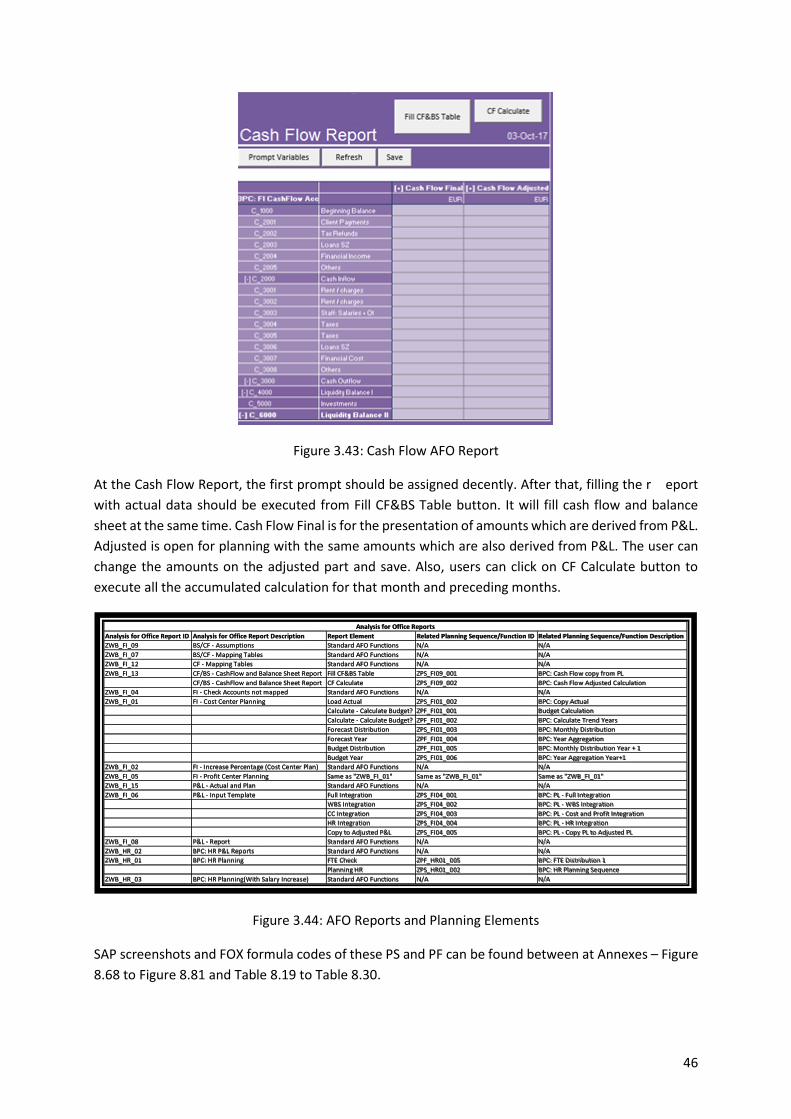
46
Figure 3.43: Cash Flow AFO Report
At the Cash Flow Report, the first prompt should be assigned decently. After that, filling the r eport
with actual data should be executed from Fill CF&BS Table button. It will fill cash flow and balance
sheet at the same time. Cash Flow Final is for the presentation of amounts which are derived from P&L.
Adjusted is open for planning with the same amounts which are also derived from P&L. The user can
change the amounts on the adjusted part and save. Also, users can click on CF Calculate button to
execute all the accumulated calculation for that month and preceding months.
Figure 3.44: AFO Reports and Planning Elements
SAP screenshots and FOX formula codes of these PS and PF can be found between at Annexes – Figure
8.68 to Figure 8.81 and Table 8.19 to Table 8.30.
Analysis for Office Report ID Analysis for Office Report Description Report Element Related Planning Sequence/Function ID Related Planning Sequence/Function Description
ZWB_FI_09 BS/CF - Assumptions Standard AFO Functions N/A N/A
ZWB_FI_07 BS/CF - Mapping Tables Standard AFO Functions N/A N/A
ZWB_FI_12 CF - Mapping Tables Standard AFO Functions N/A N/A
ZWB_FI_13 CF/BS - CashFlow and Balance Sheet Report Fill CF&BS Table ZPS_FI09_001 BPC: Cash Flow copy from PL
CF/BS - CashFlow and Balance Sheet Report CF Calculate ZPS_FI09_002 BPC: Cash Flow Adjusted Calculation
ZWB_FI_04 FI - Check Accounts not mapped Standard AFO Functions N/A N/A
ZWB_FI_01 FI - Cost Center Planning Load Actual ZPS_FI01_002 BPC: Copy Actual
Calculate - Calculate Budget? ZPF_FI01_001 Budget Calculation
Calculate - Calculate Budget? ZPF_FI01_002 BPC: Calculate Trend Years
Forecast Distribution ZPS_FI01_003 BPC: Monthly Distribution
Forecast Year ZPF_FI01_004 BPC: Year Aggregation
Budget Distribution ZPF_FI01_005 BPC: Monthly Distribution Year + 1
Budget Year ZPS_FI01_006 BPC: Year Aggregation Year+1
ZWB_FI_02 FI - Increase Percentage (Cost Center Plan) Standard AFO Functions N/A N/A
ZWB_FI_05 FI - Profit Center Planning Same as "ZWB_FI_01" Same as "ZWB_FI_01" Same as "ZWB_FI_01"
ZWB_FI_15 P&L - Actual and Plan Standard AFO Functions N/A N/A
ZWB_FI_06 P&L - Input Template Full Integration ZPS_FI04_001 BPC: PL - Full Integration
WBS Integration ZPS_FI04_002 BPC: PL - WBS Integration
CC Integration ZPS_FI04_003 BPC: PL - Cost and Profit Integration
HR Integration ZPS_FI04_004 BPC: PL - HR Integration
Copy to Adjusted P&L ZPS_FI04_005 BPC: PL - Copy PL to Adjusted PL
ZWB_FI_08 P&L - Report Standard AFO Functions N/A N/A
ZWB_HR_02 BPC: HR P&L Reports Standard AFO Functions N/A N/A
ZWB_HR_01 BPC: HR Planning FTE Check ZPF_HR01_005 BPC: FTE Distribution 1
Planning HR ZPS_HR01_002 BPC: HR Planning Sequence
ZWB_HR_03 BPC: HR Planning(With Salary Increase) Standard AFO Functions N/A N/A
Analysis for Office Reports
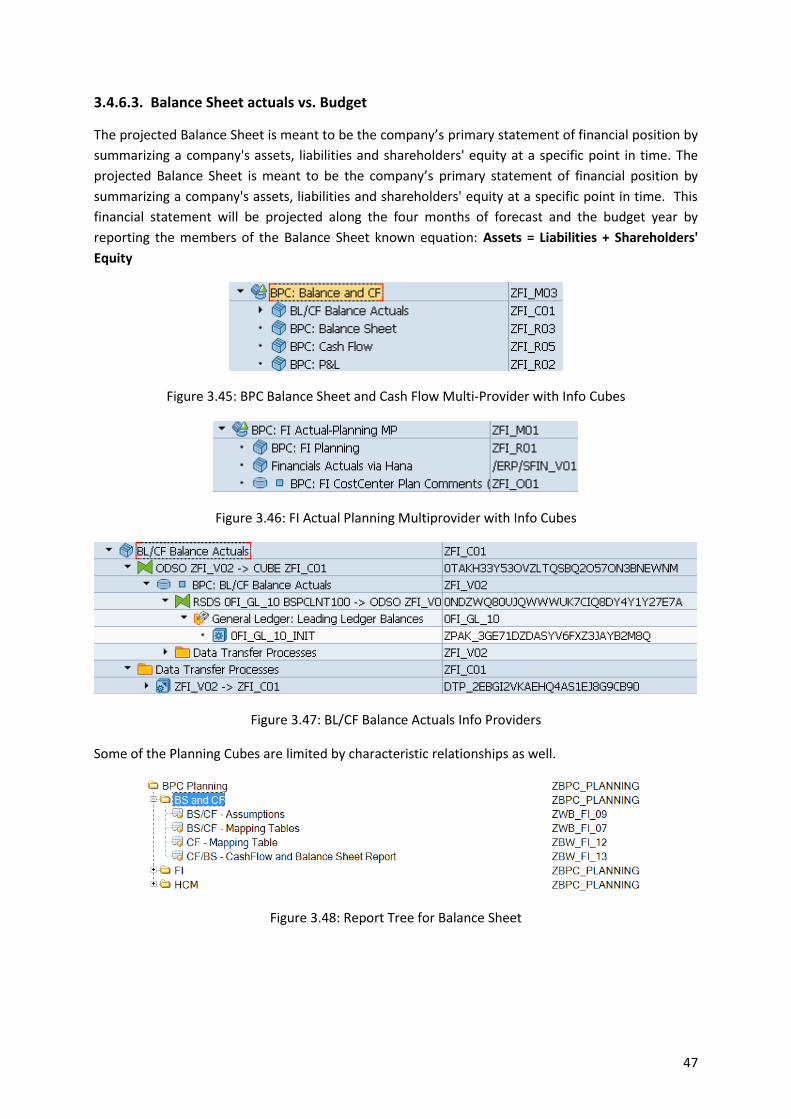
47
3.4.6.3. Balance Sheet actuals vs. Budget
The projected Balance Sheet is meant to be the company’s primary statement of financial position by
summarizing a company's assets, liabilities and shareholders' equity at a specific point in time. The
projected Balance Sheet is meant to be the company’s primary statement of financial position by
summarizing a company's assets, liabilities and shareholders' equity at a specific point in time. This
financial statement will be projected along the four months of forecast and the budget year by
reporting the members of the Balance Sheet known equation: Assets = Liabilities + Shareholders'
Equity
Figure 3.45: BPC Balance Sheet and Cash Flow Multi-Provider with Info Cubes
Figure 3.46: FI Actual Planning Multiprovider with Info Cubes
Figure 3.47: BL/CF Balance Actuals Info Providers
Some of the Planning Cubes are limited by characteristic relationships as well.
Figure 3.48: Report Tree for Balance Sheet

48
Figure 3.49: P&L to Balance Sheet Transfer Assumptions Input Enabled AFO Report
Figure 3.50: Cash Flow to Balance Sheet Transfer Assumptions Input Enabled AFO Report
On BS/CF Mapping tables, there are two sheets created to assign P&L to Balance Sheet percentages
and Cash Flow to Balance Sheet percentages. These sheets are globally prompted, so they are company
code free assignments. After the “Fill CF&BS Table button” execution Balance Sheet will be available.
PS that collects Balance Sheet planning functions and runs with this command is presented in Table
8.19. At the prompt, there will be two company code options. The first company code is to execute
Cash Flow(mandatory) and second company code is optional for Balance Sheet.
Figure 3.51: Balance Sheet AFO Report
49
4. RESULTS AND DISCUSSION
After the implementation, it is revealed that the total process time of planning and budgeting is much
shorter compared to the old system. Easy and fast connection to the actual data is a big enhancement
for the company. Real-time data integration from the HANA database is very useful for the actual
reporting purposes but also can be very helpful for future developments such as consolidation reports
and reporting. Before data integration was happening by excel with human effort and processing
wrong values were very common. Because of that, there was a big approval chain to check financial
reports. With the integration of Enterprise Performance Management tool, all the processes regarding
with finance and business is automated in the SAP BPC Planning Application Kit platform. Processes
are formulated with Planning Sequences and calculations are structured by planning functions with
FOX formula. One of the remarkable aspects of the project is Improvement on the consistency of the
data in the reports.
Through the development of the artefact, a lot of technical and business challenges has been solved.
Technical challenges were generally related with the AFO reports performances and inconsistency of
the timings. Mainly, processing times of Planning Sequences and Planning Functions on reports were
not at the desired level in the beginning. Revealing and solving the process complexity with best
practices and innovative enhancements was the big part of the unit tests and acceptance tests.
Adjusting the actual FOX Formula codes to be leaner and more straight-forward, was the most
successful method that is pursued on performance issues. The project has a tight schedule so, in some
cases, project agenda was shifted to performance enhancements instead of visual enhancements of
reports.
On the other hand, the artefact has brought a newly structured process flows to the Budget Planning
and for future developments such as consolidation processes. It is inevitable that the company could
not stay with the old process flow with 100% similarity because of technical and business limitations.
There were many adjustments on the core of business flow which is considered and negotiated with
the Group Company and business side. In the end, it has brought a lack of know-how from the business
side even if the training were done with a big success. Adaptation of the Business Members took some
time but, in the end, the artefact is being accepted by both business managerial level and end-user
level without any resistance.

50
5. CONCLUSIONS
The goal of this project work was to develop a methodology for the building of embedded Enterprise
Performance Management solution in ERP Embedded BI Platform which has a significant relationship
with the new technology in-memory, column-oriented, relational database ERP system.
In the search of possibility for building a specific artefact to satisfy the needs of the group company,
major problems are analyzed and collected accordingly. A new methodology proposed towards the
evaluation of the implementation of an embedded enterprise performance management solution in
ERP Embedded BI platform of a group company, thereby improving the orientation of business
processes with the business strategy and enhancing the ability to measure financial performance by
using the advantages of real-time data support.
Hence, this project work aimed to develop an embedded enterprise performance management
solution in ERP embedded business intelligence platform to maintain foresight capacity and decision-
making mechanism for the group company. During the project, the chosen embedded enterprise
performance management solution is implemented to provide a clear understanding of improved
financial reports with planning approach. In the meantime, the developed system is providing real-
time data for the reporting as well as sustaining real-time planning for a different level of the group
company.
Finally, this project has shown that towards the evaluation of the implementation of an embedded
enterprise performance management solution by using ERP embedded BI platform, the orientation of
business processes with the business strategy is slightly improved. On the other hand, the ability to
measure financial performance is remarkably enhanced by using the advantages of real-time data
support.
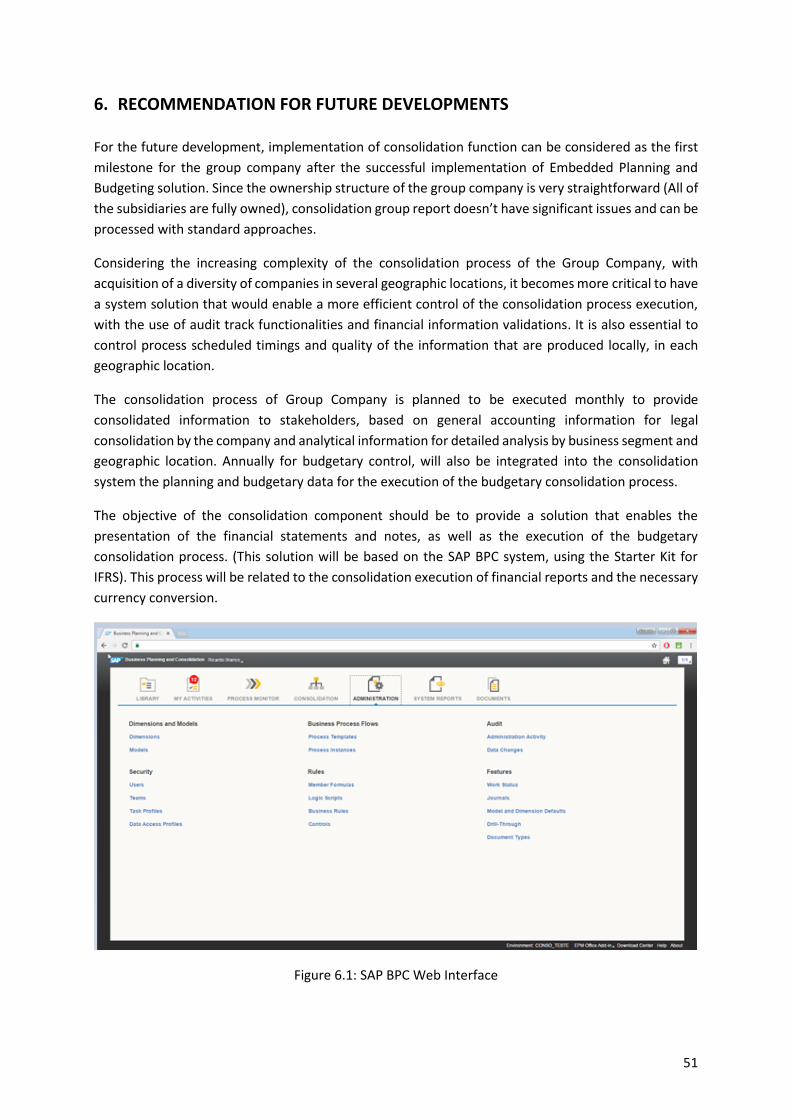
51
6. RECOMMENDATION FOR FUTURE DEVELOPMENTS
For the future development, implementation of consolidation function can be considered as the first
milestone for the group company after the successful implementation of Embedded Planning and
Budgeting solution. Since the ownership structure of the group company is very straightforward (All of
the subsidiaries are fully owned), consolidation group report doesn’t have significant issues and can be
processed with standard approaches.
Considering the increasing complexity of the consolidation process of the Group Company, with
acquisition of a diversity of companies in several geographic locations, it becomes more critical to have
a system solution that would enable a more efficient control of the consolidation process execution,
with the use of audit track functionalities and financial information validations. It is also essential to
control process scheduled timings and quality of the information that are produced locally, in each
geographic location.
The consolidation process of Group Company is planned to be executed monthly to provide
consolidated information to stakeholders, based on general accounting information for legal
consolidation by the company and analytical information for detailed analysis by business segment and
geographic location. Annually for budgetary control, will also be integrated into the consolidation
system the planning and budgetary data for the execution of the budgetary consolidation process.
The objective of the consolidation component should be to provide a solution that enables the
presentation of the financial statements and notes, as well as the execution of the budgetary
consolidation process. (This solution will be based on the SAP BPC system, using the Starter Kit for
IFRS). This process will be related to the consolidation execution of financial reports and the necessary
currency conversion.
Figure 6.1: SAP BPC Web Interface
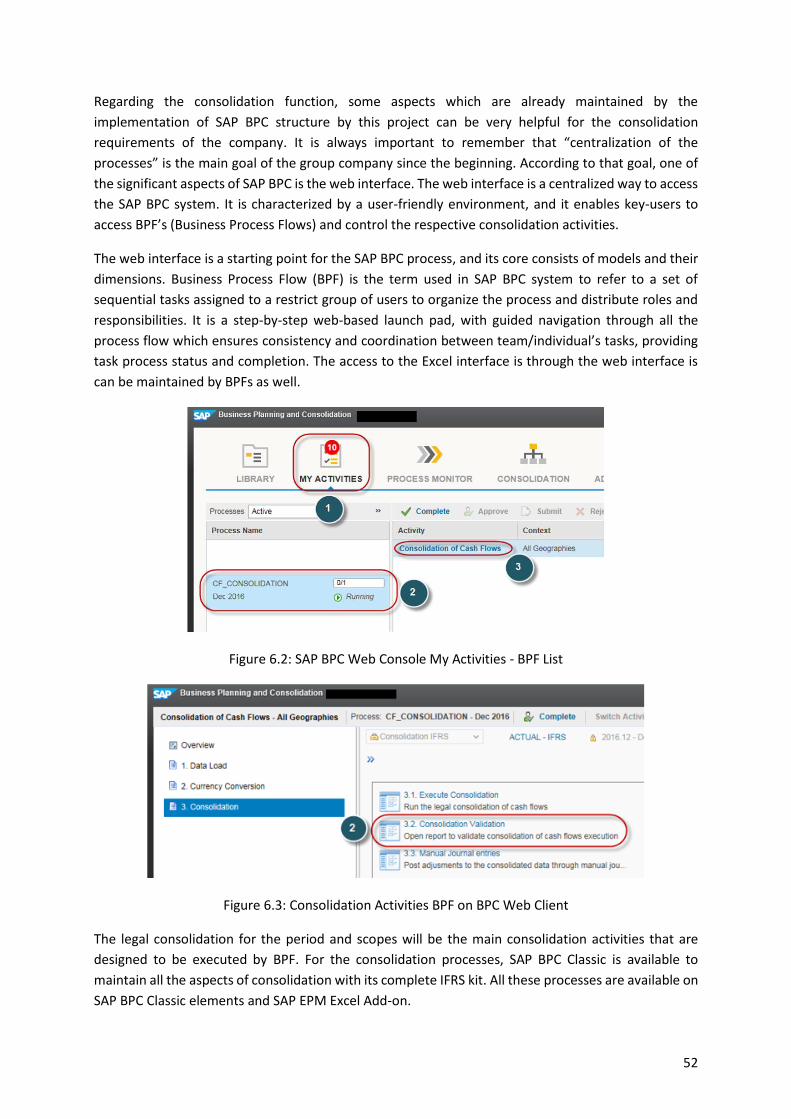
52
Regarding the consolidation function, some aspects which are already maintained by the
implementation of SAP BPC structure by this project can be very helpful for the consolidation
requirements of the company. It is always important to remember that “centralization of the
processes” is the main goal of the group company since the beginning. According to that goal, one of
the significant aspects of SAP BPC is the web interface. The web interface is a centralized way to access
the SAP BPC system. It is characterized by a user-friendly environment, and it enables key-users to
access BPF’s (Business Process Flows) and control the respective consolidation activities.
The web interface is a starting point for the SAP BPC process, and its core consists of models and their
dimensions. Business Process Flow (BPF) is the term used in SAP BPC system to refer to a set of
sequential tasks assigned to a restrict group of users to organize the process and distribute roles and
responsibilities. It is a step-by-step web-based launch pad, with guided navigation through all the
process flow which ensures consistency and coordination between team/individual’s tasks, providing
task process status and completion. The access to the Excel interface is through the web interface is
can be maintained by BPFs as well.
Figure 6.2: SAP BPC Web Console My Activities - BPF List
Figure 6.3: Consolidation Activities BPF on BPC Web Client
The legal consolidation for the period and scopes will be the main consolidation activities that are
designed to be executed by BPF. For the consolidation processes, SAP BPC Classic is available to
maintain all the aspects of consolidation with its complete IFRS kit. All these processes are available on
SAP BPC Classic elements and SAP EPM Excel Add-on.

53
Ideally, Business Process Flows consist of Data Package and Report. Data package automatically
executes the following operations:
• Aggregation of all companies’ regarding financial reports within the selected consolidation
perimeter
• Intercompany eliminations
The Data Manager is a module which enables the user to load data into SAP BPC system, through data
manager Packages, as well as copy or move data within and between models. It is also where data
mapping and conversion is maintained. In this case, data packages are not very different than the
Planning Functions or Planning Sequences. The major difference is all the processes are standard in
BPC. No customization is needed if the company’s processes are IFRS standard. Consolidation structure
is well designed in the system with related data packages, scripts and validation reports for IFRS so that
the only challenge will be the implementation of the solution to the actual structure.
Through Data Manager it is possible to:
• Upload master data
• Upload transactional data
• Elimination of transactional data
• Move data between SAP BPC models
• Currency Translation
• Intercompany Recharge
• Consolidation
Validation Reports that are standard in SAP BPC and can be placed in BPF are the corresponding EPM
reports which show the consolidated data in a financial format.
Figure 6.4: SAP EPM Interface
The EPM Microsoft Office Excel add-in enables the visualization of SAP BPC data, transforming them in
real time, supporting the consolidation reports available. SAP EPM has pretty much the same purposes
with SAP Analysis for Office regarding with reporting. But It is also working with the SAP BPC ABAP
background on parallel as well.
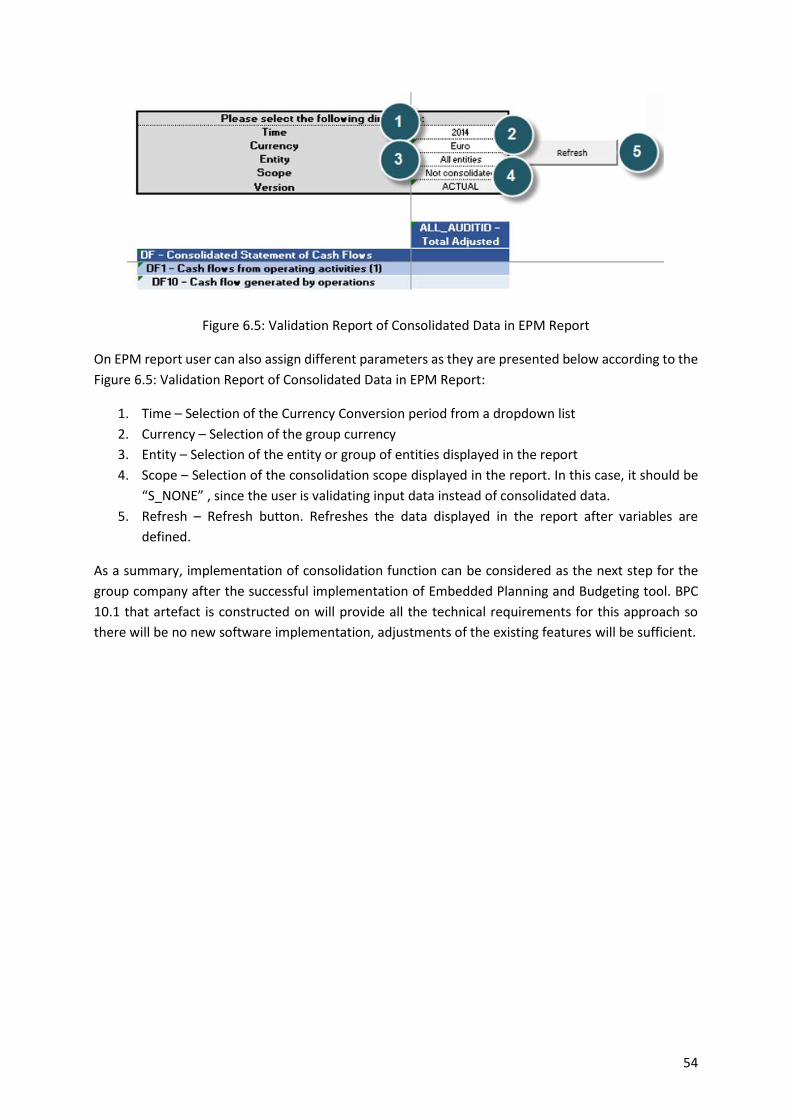
54
Figure 6.5: Validation Report of Consolidated Data in EPM Report
On EPM report user can also assign different parameters as they are presented below according to the
Figure 6.5: Validation Report of Consolidated Data in EPM Report:
1. Time – Selection of the Currency Conversion period from a dropdown list
2. Currency – Selection of the group currency
3. Entity – Selection of the entity or group of entities displayed in the report
4. Scope – Selection of the consolidation scope displayed in the report. In this case, it should be
“S_NONE” , since the user is validating input data instead of consolidated data.
5. Refresh – Refresh button. Refreshes the data displayed in the report after variables are
defined.
As a summary, implementation of consolidation function can be considered as the next step for the
group company after the successful implementation of Embedded Planning and Budgeting tool. BPC
10.1 that artefact is constructed on will provide all the technical requirements for this approach so
there will be no new software implementation, adjustments of the existing features will be sufficient.

55
7. BIBLIOGRAPHY
Ariyachandra, T. R. (2008). Critical Success Factors in Business Performance Management - Striving
for Success. Information systems management, Taylor & Francis, 25: 113 - 120.
Beedle, M., Beck, K., Bennekum, A., Cockburn, A., Cunningham, W., Fowler, M., . . . Thomas, D.
(2001). Manifesto for Agile Software Development. Retrieved from Agile Manifesto:
http://agilemanifesto.org/principles.html
Bekmezci, O. (2017). Business Planning and Consolidation with SAP: Business User Guide (1st ed.). (O.
Bekmezci, Ed.) Istanbul, Turkey: SAP Press.
Boateng, O., Singh, J., Greeshma, & Singh, P. (2011). Data Warehousing. Business Intelligence Journal,
224-240.
Bose, R. (2006). Understanding management data systems for enterprise performance management.
Industrial Management & Data Systems, Vol. 106(Issue: 1), pp.43-59.
Cheng, J. L. (1983). Toward an Integration of Organization Research and Practice: A Contingency
Study of Bureaucratic Control and Performance in Scientific Settings. Administrative Science
Quarterly, 8(1), 85–100.
Christensen, J., Darlak, J., Harrington, R., Kong, L., Poles, M., & Savelli, C. (2017). SAp BW/4HANA.
Waldorf: SAP Press.
Couture, N. (2013). Implementing an Enterprise Data Quality Strategy. Business Intelligence Journal,
7.
Darlak, J., & Christensen, J. (2014). SAP BW: Administration and Performance Optimization. Waldorf:
SAP Press.
Deming, W. E. (1986). Out of the Crisis. Cambridge: Massachusetts Institute of Technology.
Desroches, D. (2014). Enterprise Performance Management: Management Accountants’ Perceptions.
IMA, the association of accountants and financial.
Dobrev, K., & Hart, M. (2015). Benefits, Justification and Implementation Planning of Real-Time.
Electronic Journal of Information Systems Evaluation, 18(2), 104-118.
Dresner, H. (2008). The Performance Management Revolution. Hoboken, New Jersey: John Wiley &
Sons.
Elias, M. (2012). Enhancing User Interaction with Business Intelligence Dashboards. Other. Ecole
Centrale Paris, (20).12.
Few, S. (2007). Data Visualization Past, Present and Future. Perceptual Edge, 12.
G2CROWD. (2018). Best Corporate Performance Management (CPM) Software. Retrieved from
G2CROWD Global: https://www.g2crowd.com/categories/corporate-performance-
management-cpm

56
Gaiss, M. (1998, Dec). Enterprise Performance Management. Management Accounting, Vol. 80(Iss.
6), 44-46.
Gartner. (2018, February). Magic Quadrant for Analytics and Business Intelligence Platforms.
Retrieved from Gartner Global: https://www.gartner.com/webinar/3856063
Georgian, B., & Joo, A. (2013). SAP NetWeaver BW - 100 Things You Should Know About... Waldorf:
Galileo Press.
Grant, K. P. (2006). Project Management Maturity: An Assessment of Project Management
Capabilities Among and Between Selected Industries. IEEE Transactions on engineering
management, 53(1): 59-68.
Grech, T. (2015). The intersection of agile and waterfall. Industrial Engineer, 4.
Hamerman, P. D. (2007). The Forrester Wave™: Business Performance Solutions. Forrester Research,
Inc.
Horakova, M., & Skalska, H. (2013). Business Intelligence and Implementation in a Small Enterprise.
Journal of Systems Integration, 12.
Inmon, W. (2002). Building the Data Warehouse (Vol. Third Edition). New Mexico State University Las
Cruces: John Wiley & Sons, Inc.
Ionel, N. (2009). Agile Software Development Methodologies: An Overview of the current State of
Research. University of Economic Studies (ASE) Bucharest Faculty of Management, 6.
Jones, P., & Charles, S. (2015). Using Script Logic and Fox Code in SAP BPC. SAP Headquarter: SAP
Press.
Jones, P., & Soper, C. (2015). Implementing SAP Business Planning and Consolidation (2nd ed.).
Waldorf: SAP Press.
Kilaru, R., Sharma, S., Ayuluri, B., & Darla, K. (2016). Introducing SAP BPC for SAP S/4HANA Finance.
SAP Headquarter: SAP Press.
Kimball, R., & Ross, M. (2013). The Data Warehouse Toolkit: The Definitive Guide to Dimensional
Modeling (3rd ed.). Indianapolis: John Wiley & Sons, Inc.
Kraft, J. (2011). SAP NetWeaver BW 7.x Reporting–Practical Guide. Waldorf: Galileo Press.
Lingle, J. H. (1996). From Balanced Scorecard to Strategy Gauge: is measurement worth it?
Management Review(March), 56-62.
Loebbecke, C. &. (2016). Developing and enforcing internal information systems standards:
InduMaker’s standards management process. International Journal of Information Systems
and Project Management, 4(1), 5–24. H.
Mahadevan, L., Kettinger, W., & Meservy, T. (2015). Running on Hybrid: Control Changes when
Introducing an Agile Methodology in a Traditional “Waterfall” System Development
Environment. Communications of the Association for Information Systems, 28.
57
Matthias, M., Hugens, T., & Blum, S. (2017). SAP BW 7.4 on SAP HANA: Administration with SAP HANA
Studio. Walldorf, Germany: SAP Press.
Merz, M., Hugens, T., & Blum, S. (2015). Implementing SAP BW on SAP HANA. Waldorf: SAP Press.
Merz, M., Hugens, T., & Blum, S. (2017). SAP BW 7.4 on SAP HANA: Data Modeling. Waldorf: SAP
Press.
Milanov, G., & Njegus, A. (2012). Analysis of Return on Investment in Different Types of Agile
Software Development Project Teams. Informatica Economică, 13.
Moody, D., & Kortink, M. (2000). From Enterprise Models to Dimensional Models: A Methodology for
Data Warehouse and Data Mart Design.
Obeidat, M., North, M., Richardson, R., & Rattanak, V. (2015). Business Intelligence Technology,
Applications, and Trends. International Management Review, 11.
Palekar, A., Patel, B., & Shiralkar, S. (2015). Building Planning Applications with SAP BW Integrated
Planning. Waldorf: SAP Press.
Palekar, A., Patel, B., & Shiralkar, S. (2015). SAP BW 7.4 Practical Guide (3rd ed.). Waldorf: SAP Press.
Pattanayak, A., & Koppolu, R. (2016). Introducing SAP S/4HANA Embedded Analytics. Waldorf: SAP
Press.
Ranjan, J. (2009). Business Intelligence: Concepts, Components, Techniques ,and Benefits. Journal of
Theoretical and Applied Information Technology, 11.
Royce, W. (1970). Managing the Development of Large Software Systems.
Sherman, R. (2014). Business Intelligence Guidebook: From Data Integration to Analytics. Elsevier.
Singh, V. (2016). Creating and Using Advanced DSOs in SAP BW on SAP HANA. Waldorf: SAP Press.
Span, R. (2009). Towards an Enterprise Performance Management Solution. Twente: University of
Twente.
Srinivasan, K., & Srinivasan, S. (2015). SAP Business Planning and Consolidation (4th ed.). SAP
Headquarter: SAP Press.
Vassiliadis, P., Simitsis, A., & Skiadopoulos, S. (2003). A Methodology for the Conceptual Modeling of
ETL Processes. Online Proceedings for Scientific Workshops, 12.
Wieder, B., & Ossimitz, M.-L. (2015). The impact of Business Intelligence on the quality of decision
making – a mediation model. Elsevier.
Zeng, L. L. (2006). Dynamic Evolution of Business Performance Management. E-Business Engineering,
IEEE International Conference on.
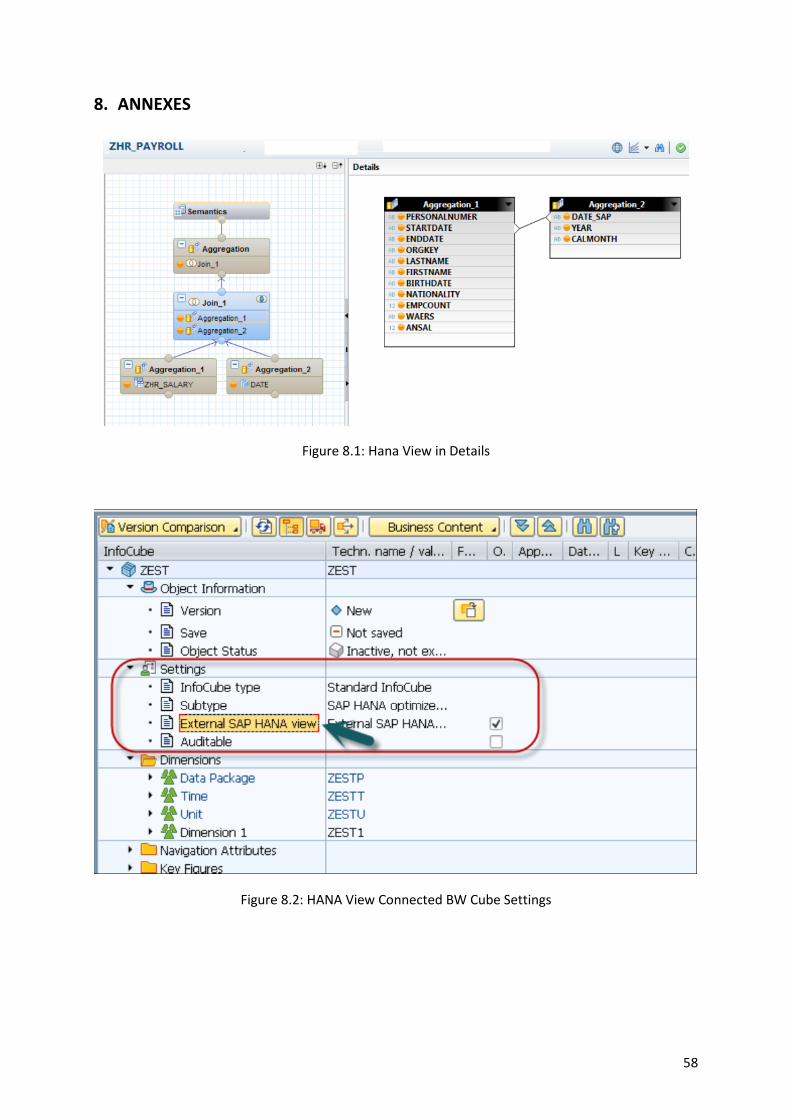
58
8. ANNEXES
Figure 8.1: Hana View in Details
Figure 8.2: HANA View Connected BW Cube Settings
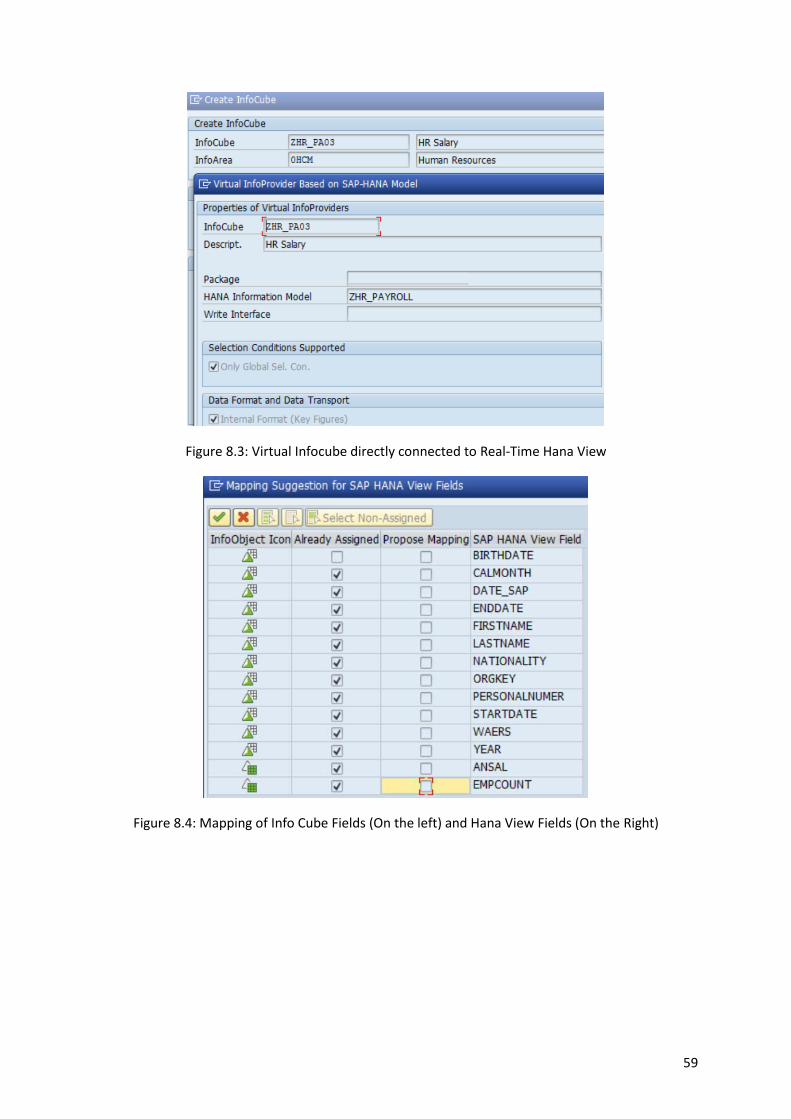
59
Figure 8.3: Virtual Infocube directly connected to Real-Time Hana View
Figure 8.4: Mapping of Info Cube Fields (On the left) and Hana View Fields (On the Right)

60
Figure 8.5: Real Time Infocube Designed for Planning Purposes
Figure 8.6: Activate Deactivate Data Slice Planning Functions in PS

61
Figure 8.7: Activate/Deactivate Data Slice PF Filter
CALL FUNCTION Z_DSLICE_CHANGE_STATUS
EXPORTING
I_VAR = ZDS_FI_R01_STATUS
I_STATUS = 2.
Table 8.1: Deactivate Data Slice PF Fox Formula Code
CALL FUNCTION Z_DSLICE_CHANGE_STATUS
EXPORTING
I_VAR = ZDS_FI_R01_STATUS
I_STATUS = 1.
Table 8.2: Activate Data Slice PF Fox Formula Code
Figure 8.8: Intercompany Recharge PF Filter
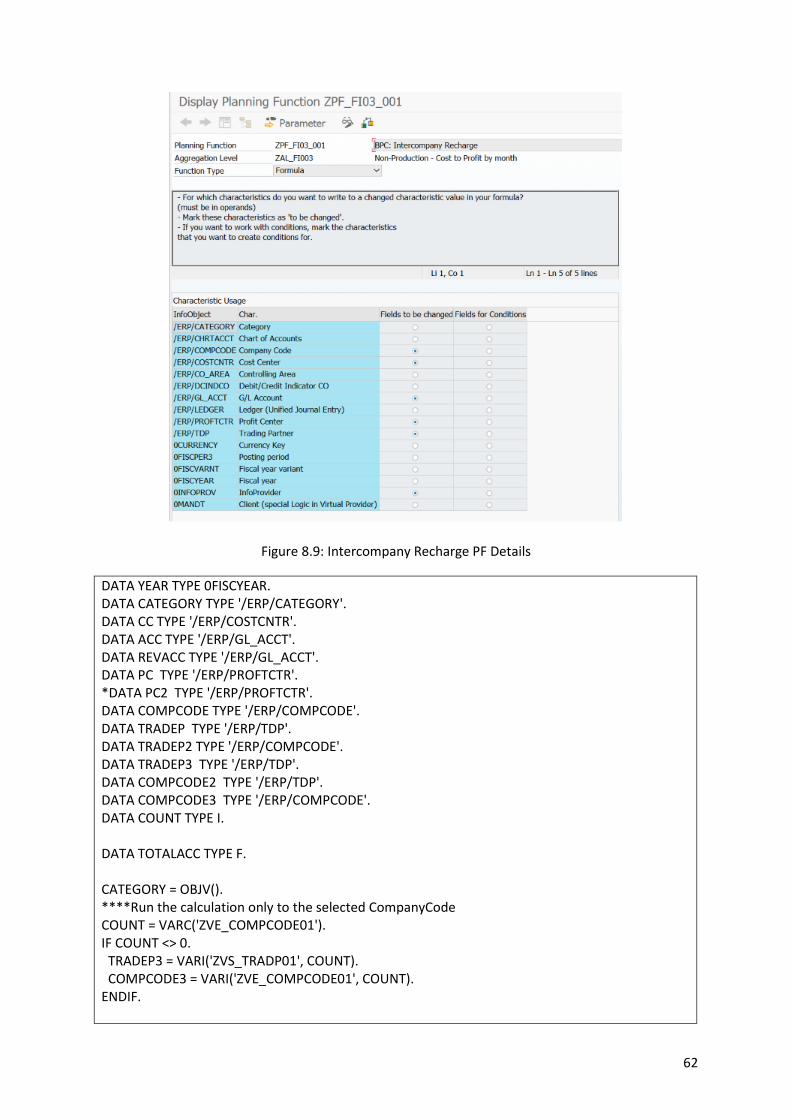
62
Figure 8.9: Intercompany Recharge PF Details
DATA YEAR TYPE 0FISCYEAR. DATA CATEGORY TYPE '/ERP/CATEGORY'. DATA CC TYPE '/ERP/COSTCNTR'. DATA ACC TYPE '/ERP/GL_ACCT'. DATA REVACC TYPE '/ERP/GL_ACCT'. DATA PC TYPE '/ERP/PROFTCTR'. *DATA PC2 TYPE '/ERP/PROFTCTR'. DATA COMPCODE TYPE '/ERP/COMPCODE'. DATA TRADEP TYPE '/ERP/TDP'. DATA TRADEP2 TYPE '/ERP/COMPCODE'. DATA TRADEP3 TYPE '/ERP/TDP'. DATA COMPCODE2 TYPE '/ERP/TDP'. DATA COMPCODE3 TYPE '/ERP/COMPCODE'. DATA COUNT TYPE I. DATA TOTALACC TYPE F. CATEGORY = OBJV(). ****Run the calculation only to the selected CompanyCode COUNT = VARC('ZVE_COMPCODE01'). IF COUNT <> 0. TRADEP3 = VARI('ZVS_TRADP01', COUNT). COMPCODE3 = VARI('ZVE_COMPCODE01', COUNT). ENDIF.
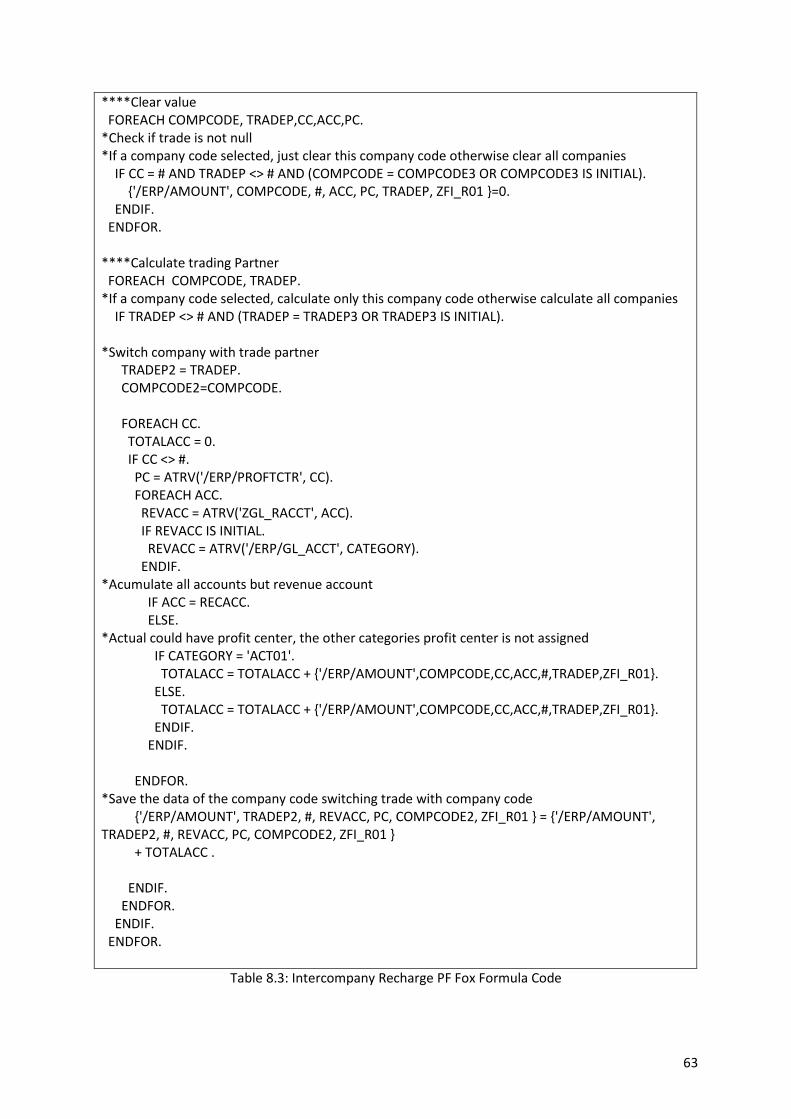
63
****Clear value FOREACH COMPCODE, TRADEP,CC,ACC,PC. *Check if trade is not null *If a company code selected, just clear this company code otherwise clear all companies IF CC = # AND TRADEP <> # AND (COMPCODE = COMPCODE3 OR COMPCODE3 IS INITIAL). {'/ERP/AMOUNT', COMPCODE, #, ACC, PC, TRADEP, ZFI_R01 }=0. ENDIF. ENDFOR. ****Calculate trading Partner FOREACH COMPCODE, TRADEP. *If a company code selected, calculate only this company code otherwise calculate all companies IF TRADEP <> # AND (TRADEP = TRADEP3 OR TRADEP3 IS INITIAL). *Switch company with trade partner TRADEP2 = TRADEP. COMPCODE2=COMPCODE. FOREACH CC. TOTALACC = 0. IF CC <> #. PC = ATRV('/ERP/PROFTCTR', CC). FOREACH ACC. REVACC = ATRV('ZGL_RACCT', ACC). IF REVACC IS INITIAL. REVACC = ATRV('/ERP/GL_ACCT', CATEGORY). ENDIF. *Acumulate all accounts but revenue account IF ACC = RECACC. ELSE. *Actual could have profit center, the other categories profit center is not assigned IF CATEGORY = 'ACT01'. TOTALACC = TOTALACC + {'/ERP/AMOUNT',COMPCODE,CC,ACC,#,TRADEP,ZFI_R01}. ELSE. TOTALACC = TOTALACC + {'/ERP/AMOUNT',COMPCODE,CC,ACC,#,TRADEP,ZFI_R01}. ENDIF. ENDIF. ENDFOR. *Save the data of the company code switching trade with company code {'/ERP/AMOUNT', TRADEP2, #, REVACC, PC, COMPCODE2, ZFI_R01 } = {'/ERP/AMOUNT', TRADEP2, #, REVACC, PC, COMPCODE2, ZFI_R01 } + TOTALACC . ENDIF. ENDFOR. ENDIF. ENDFOR.
Table 8.3: Intercompany Recharge PF Fox Formula Code

64
Figure 8.10: Copy Actual PS
Figure 8.11: Copy Actual to 9* Accounts PF Filter

65
Figure 8.12: Copy Actual to 9* Accounts PF Details
DATA YEAR TYPE 0FISCYEAR. DATA CATEGORY TYPE '/ERP/CATEGORY'. DATA ACC TYPE '/ERP/GL_ACCT'. DATA ACC9 TYPE '/ERP/GL_ACCT'. DATA PC TYPE '/ERP/PROFTCTR'. DATA COMPCODE TYPE '/ERP/COMPCODE'. DATA CC TYPE '/ERP/COSTCNTR'. DATA PP TYPE '0FISCPER3'. DATA DC TYPE '/ERP/DCINDCO'. FOREACH ACC, COMPCODE, CC, PC, PP. * ACC9 = ATRV( 'ZGL_ACCT', ACC ). IF NOT ACC IS INITIAL. IF NOT CC IS INITIAL. * IF CATEGORY = 'ACT01'. { '/ERP/AMOUNT', COMPCODE, CC, #, ACC, #, PP, ZFI_R01 } = 0. { '/ERP/AMOUNT', COMPCODE, CC, #, ACC, #, PP, ZFI_R01 } = { '/ERP/AMOUNT', COMPCODE, CC, #, ACC, #, PP, ZFI_R01 } + 0. * ENDIF. ELSE. IF NOT PC IS INITIAL. { '/ERP/AMOUNT', COMPCODE, #, #, ACC, PC, PP, ZFI_R01 } = 0. { '/ERP/AMOUNT', COMPCODE, #, #, ACC, PC, PP, ZFI_R01 } =
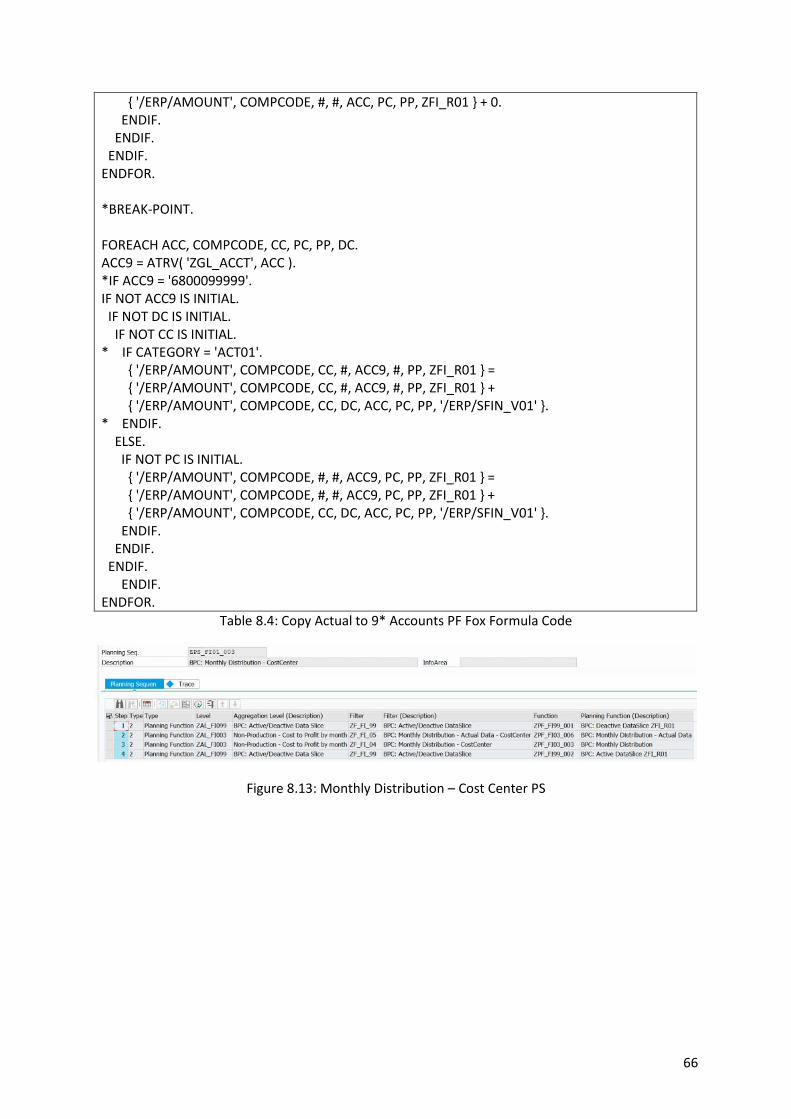
66
{ '/ERP/AMOUNT', COMPCODE, #, #, ACC, PC, PP, ZFI_R01 } + 0. ENDIF. ENDIF. ENDIF. ENDFOR. *BREAK-POINT. FOREACH ACC, COMPCODE, CC, PC, PP, DC. ACC9 = ATRV( 'ZGL_ACCT', ACC ). *IF ACC9 = '6800099999'. IF NOT ACC9 IS INITIAL. IF NOT DC IS INITIAL. IF NOT CC IS INITIAL. * IF CATEGORY = 'ACT01'. { '/ERP/AMOUNT', COMPCODE, CC, #, ACC9, #, PP, ZFI_R01 } = { '/ERP/AMOUNT', COMPCODE, CC, #, ACC9, #, PP, ZFI_R01 } + { '/ERP/AMOUNT', COMPCODE, CC, DC, ACC, PC, PP, '/ERP/SFIN_V01' }. * ENDIF. ELSE. IF NOT PC IS INITIAL. { '/ERP/AMOUNT', COMPCODE, #, #, ACC9, PC, PP, ZFI_R01 } = { '/ERP/AMOUNT', COMPCODE, #, #, ACC9, PC, PP, ZFI_R01 } + { '/ERP/AMOUNT', COMPCODE, CC, DC, ACC, PC, PP, '/ERP/SFIN_V01' }. ENDIF. ENDIF. ENDIF. ENDIF. ENDFOR.
Table 8.4: Copy Actual to 9* Accounts PF Fox Formula Code
Figure 8.13: Monthly Distribution – Cost Center PS
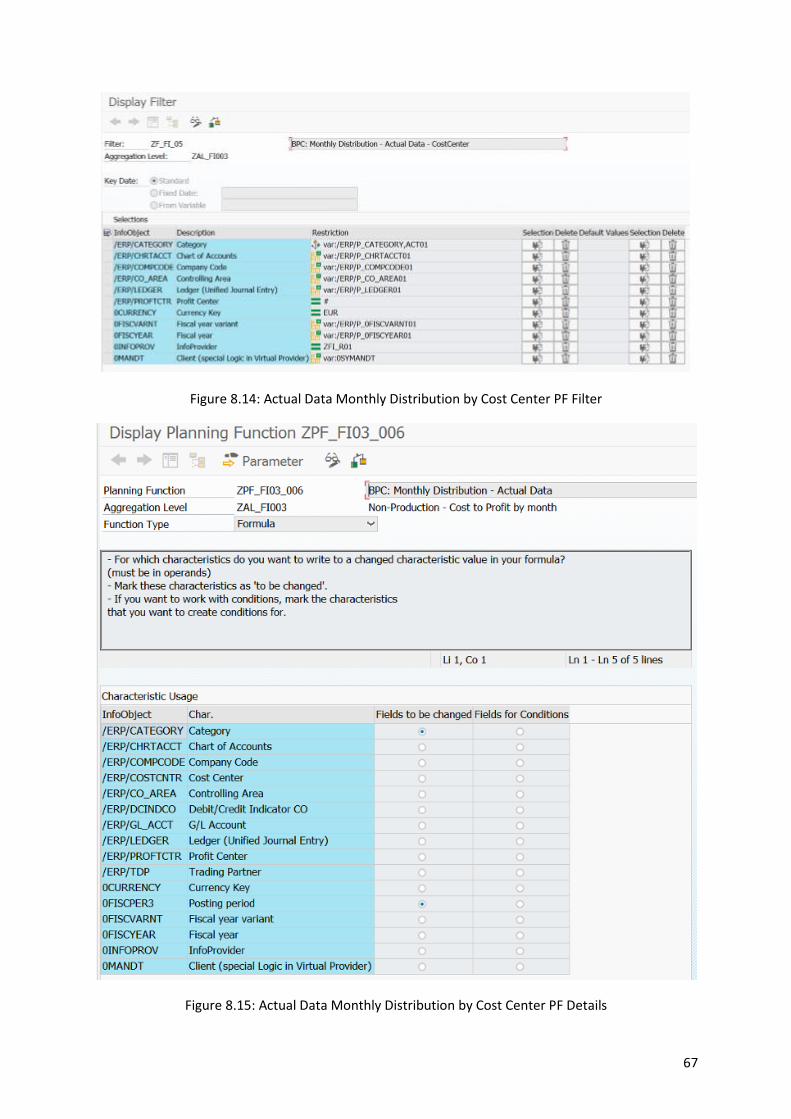
67
Figure 8.14: Actual Data Monthly Distribution by Cost Center PF Filter
Figure 8.15: Actual Data Monthly Distribution by Cost Center PF Details

68
DATA YEAR TYPE 0FISCYEAR. DATA YEAR2 TYPE 0FISCYEAR. DATA CATEGORY TYPE '/ERP/CATEGORY'. DATA CATEGORY_M TYPE '/ERP/CATEGORY'. DATA MONTH TYPE '0FISCPER3'. DATA M_COUNT TYPE '0FISCPER3'. DATA M_FCST TYPE '0FISCPER3'. DATA M_VAL TYPE I. DATA DIV_VAL TYPE I. CATEGORY_M = VARV( '/ERP/P_CATEGORY' ). M_FCST = ATRV( '0FISCPER3', CATEGORY_M ). *M_VAL = ATRV( '0FISCPER3', CATEGORY_M ). YEAR = OBJV( ). YEAR2 = ATRV( '0FISCYEAR', CATEGORY_M ). M_COUNT = 000. FOREACH CATEGORY. IF CATEGORY = 'ACT01'. DO. IF M_COUNT >= 012. EXIT. ELSE. M_COUNT = TMVL( M_COUNT, 1 ). MONTH = M_COUNT. IF YEAR = YEAR2. IF M_COUNT <= M_FCST. { '/ERP/AMOUNT', CATEGORY_M, MONTH} = { '/ERP/AMOUNT', 'ACT01', MONTH }. ENDIF. ENDIF. ENDIF. ENDDO. ENDIF. ENDFOR.
Table 8.5: Actual Data Monthly Distribution by Cost Center PF Fox Formula Code

69
Figure 8.16: Planning Data Monthly Distribution by Cost Center PF Filter
Figure 8.17: Planning Data Monthly Distribution by Cost Center PF Details

70
DATA YEAR TYPE 0FISCYEAR. DATA YEAR2 TYPE 0FISCYEAR. DATA CATEGORY TYPE '/ERP/CATEGORY'. DATA CATEGORY_M TYPE '/ERP/CATEGORY'. DATA MONTH TYPE '0FISCPER3'. DATA M_COUNT TYPE '0FISCPER3'. DATA M_FCST TYPE '0FISCPER3'. DATA M_VAL TYPE I. DATA DIV_VAL TYPE I. CATEGORY_M = VARV('/ERP/P_CATEGORY'). CATEGORY = OBJV(). M_FCST = ATRV( '0FISCPER3', CATEGORY_M ). M_VAL = ATRV( '0FISCPER3', CATEGORY_M ). YEAR = OBJV( ). YEAR2 = ATRV( '0FISCYEAR', CATEGORY_M ). M_COUNT = 000. DO. IF M_COUNT >= 012. EXIT. ELSE. M_COUNT = TMVL( M_COUNT, 1 ). MONTH = M_COUNT. IF CATEGORY <> 'ACT01'. IF YEAR = YEAR2. IF M_COUNT > M_FCST. DIV_VAL = 12 - M_VAL. { '/ERP/AMOUNT', MONTH } = { '/ERP/AMOUNT', # } / DIV_VAL. ENDIF. ELSE. { '/ERP/AMOUNT', MONTH } = { '/ERP/AMOUNT', # } / 12. ENDIF. ELSE. ENDIF. ENDIF. ENDDO.
Table 8.6: Planning Data Monthly Distribution by Cost Center PF Fox Formula Code

71
Figure 8.18: Year Aggregation – Cost Center PS
Figure 8.19: Year Aggregation by Cost Center PF Filter
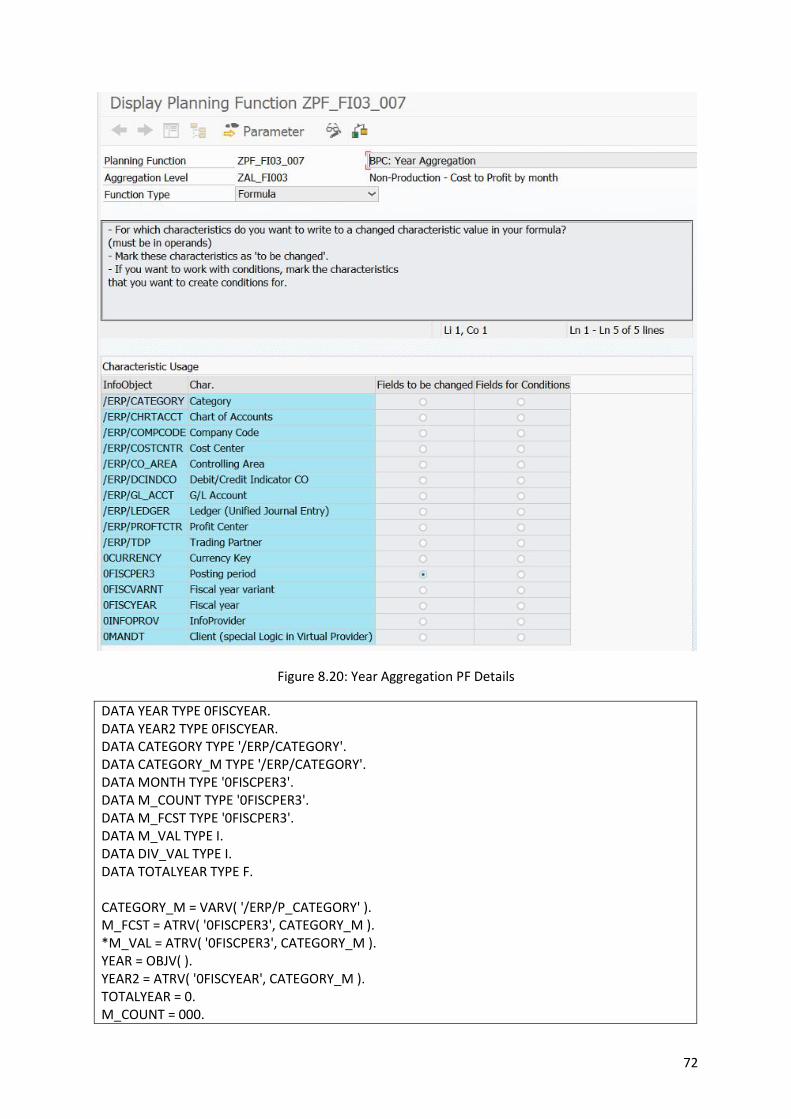
72
Figure 8.20: Year Aggregation PF Details
DATA YEAR TYPE 0FISCYEAR. DATA YEAR2 TYPE 0FISCYEAR. DATA CATEGORY TYPE '/ERP/CATEGORY'. DATA CATEGORY_M TYPE '/ERP/CATEGORY'. DATA MONTH TYPE '0FISCPER3'. DATA M_COUNT TYPE '0FISCPER3'. DATA M_FCST TYPE '0FISCPER3'. DATA M_VAL TYPE I. DATA DIV_VAL TYPE I. DATA TOTALYEAR TYPE F. CATEGORY_M = VARV( '/ERP/P_CATEGORY' ). M_FCST = ATRV( '0FISCPER3', CATEGORY_M ). *M_VAL = ATRV( '0FISCPER3', CATEGORY_M ). YEAR = OBJV( ). YEAR2 = ATRV( '0FISCYEAR', CATEGORY_M ). TOTALYEAR = 0. M_COUNT = 000.

73
DO. IF M_COUNT >= 012. EXIT. ELSE. M_COUNT = TMVL( M_COUNT, 1 ). MONTH = M_COUNT. IF YEAR = YEAR2. IF M_COUNT > M_FCST. TOTALYEAR = TOTALYEAR + { '/ERP/AMOUNT', MONTH }. ENDIF. ELSE. TOTALYEAR = TOTALYEAR + { '/ERP/AMOUNT', MONTH }. ENDIF. ENDIF. ENDDO. { '/ERP/AMOUNT', # } = TOTALYEAR.
Table 8.7: Year Aggregation PF Fox Formula Code
Figure 8.21: Monthly Distribution Year+1 by Cost Center PS
Figure 8.22: Monthly Distribution Year+1 by Cost Center PF Filter
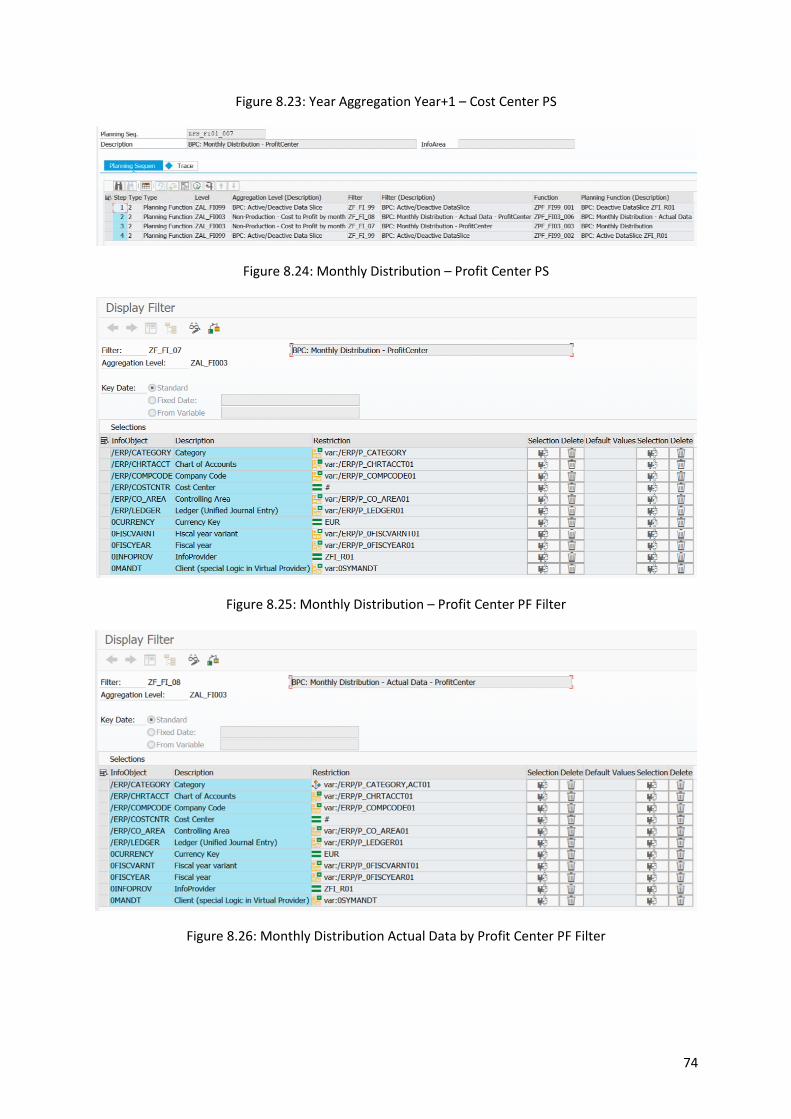
74
Figure 8.23: Year Aggregation Year+1 – Cost Center PS
Figure 8.24: Monthly Distribution – Profit Center PS
Figure 8.25: Monthly Distribution – Profit Center PF Filter
Figure 8.26: Monthly Distribution Actual Data by Profit Center PF Filter

75
Figure 8.27: Year Aggregation by Profit Center PS
Figure 8.28: Monthly Distribution Year+1 by Profit Center PS
Figure 8.29: Monthly Distribution Year+1 by Profit Center PF Filter
Figure 8.30: Year Aggregation Year+1 by Profit Center PS
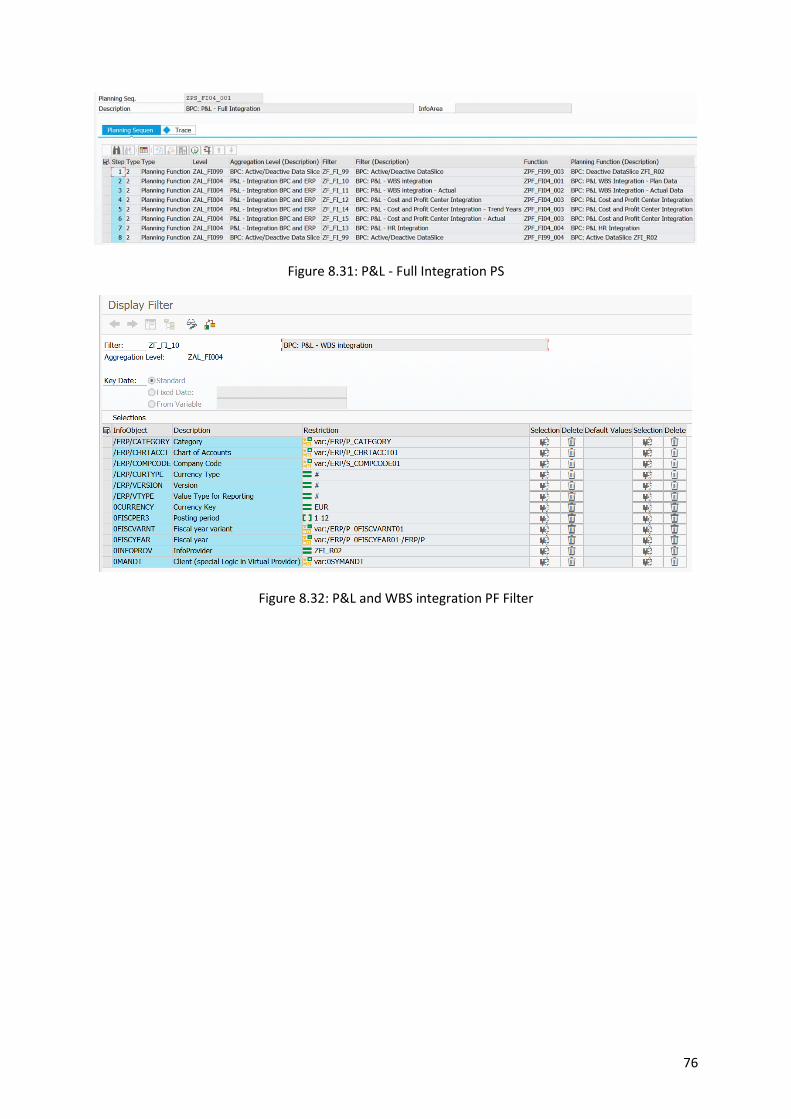
76
Figure 8.31: P&L - Full Integration PS
Figure 8.32: P&L and WBS integration PF Filter
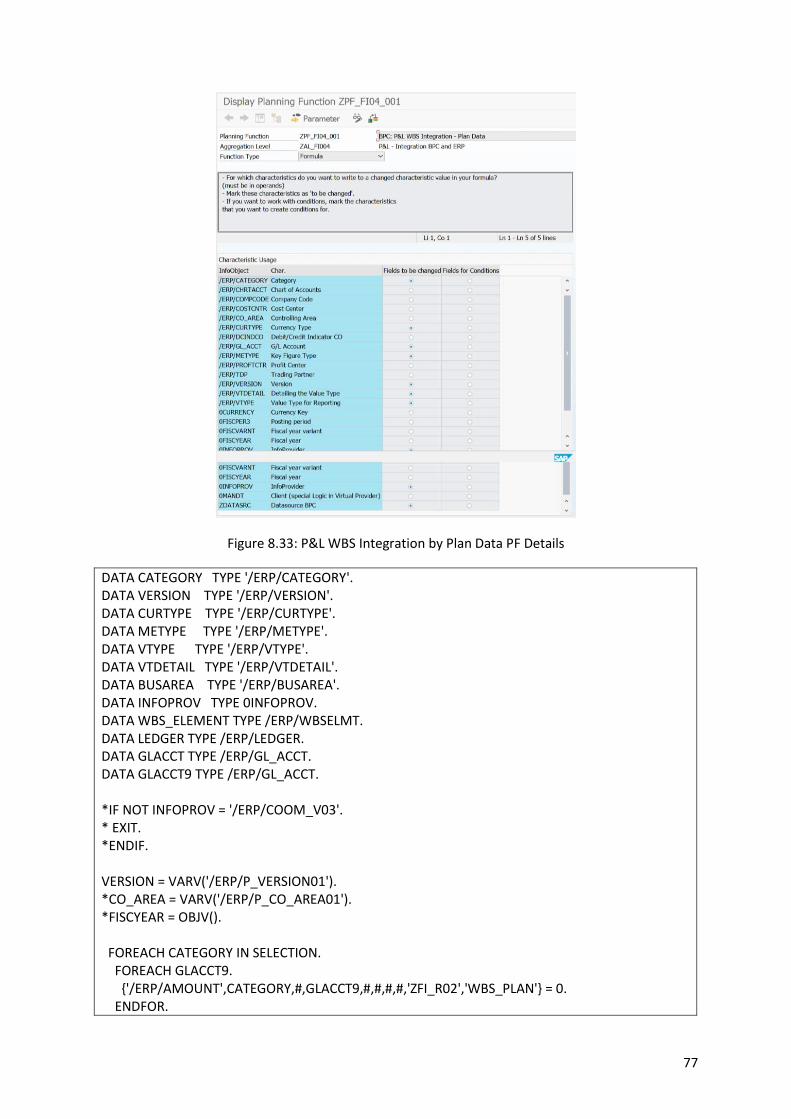
77
Figure 8.33: P&L WBS Integration by Plan Data PF Details
DATA CATEGORY TYPE '/ERP/CATEGORY'. DATA VERSION TYPE '/ERP/VERSION'. DATA CURTYPE TYPE '/ERP/CURTYPE'. DATA METYPE TYPE '/ERP/METYPE'. DATA VTYPE TYPE '/ERP/VTYPE'. DATA VTDETAIL TYPE '/ERP/VTDETAIL'. DATA BUSAREA TYPE '/ERP/BUSAREA'. DATA INFOPROV TYPE 0INFOPROV. DATA WBS_ELEMENT TYPE /ERP/WBSELMT. DATA LEDGER TYPE /ERP/LEDGER. DATA GLACCT TYPE /ERP/GL_ACCT. DATA GLACCT9 TYPE /ERP/GL_ACCT. *IF NOT INFOPROV = '/ERP/COOM_V03'. * EXIT. *ENDIF. VERSION = VARV('/ERP/P_VERSION01'). *CO_AREA = VARV('/ERP/P_CO_AREA01'). *FISCYEAR = OBJV(). FOREACH CATEGORY IN SELECTION. FOREACH GLACCT9. {'/ERP/AMOUNT',CATEGORY,#,GLACCT9,#,#,#,#,'ZFI_R02','WBS_PLAN'} = 0. ENDFOR.

78
FOREACH GLACCT, METYPE, VTDETAIL IN REFDATA. {'/ERP/AMOUNT',CATEGORY,#,GLACCT,#,#,#,#,'ZFI_R02','WBS_PLAN'} = {'/ERP/AMOUNT',CATEGORY,#,GLACCT,#,#,#,#,'ZFI_R02','WBS_PLAN'} + {'/ERP/AMOUNT',#,20,GLACCT,METYPE,VERSION,VTDETAIL,020,'/ERP/COOM_V03', #}. ENDFOR. ENDFOR.
Table 8.8: P&L WBS Integration by Plan Data PF Fox Formula Code
Figure 8.34: P&L - WBS integration – Actual PF Filter

79
Figure 8.35: P&L and WBS Integration by Actual Data PF Details
DATA CATEGORY TYPE '/ERP/CATEGORY'. DATA VERSION TYPE '/ERP/VERSION'. DATA CURTYPE TYPE '/ERP/CURTYPE'. DATA METYPE TYPE '/ERP/METYPE'. DATA VTYPE TYPE '/ERP/VTYPE'. DATA VTDETAIL TYPE '/ERP/VTDETAIL'. DATA BUSAREA TYPE '/ERP/BUSAREA'. DATA INFOPROV TYPE 0INFOPROV. DATA WBS_ELEMENT TYPE /ERP/WBSELMT. DATA LEDGER TYPE /ERP/LEDGER. DATA GLACCT TYPE /ERP/GL_ACCT. DATA GLACCT9 TYPE /ERP/GL_ACCT. *BREAK-POINT. *VERSION = VARV('/ERP/P_VERSION01'). *CO_AREA = VARV('/ERP/P_CO_AREA01'). *FISCYEAR = OBJV(). * FOREACH CATEGORY IN SELECTION. FOREACH CATEGORY IN REFDATA. FOREACH GLACCT9. {'/ERP/AMOUNT','ACT01', #,GLACCT9,#,#,#,#,'ZFI_R02','WBS_ACTUAL'} = 0. ENDFOR. FOREACH GLACCT, METYPE, VTDETAIL IN REFDATA. GLACCT9 = ATRV(ZGL_ACCT, GLACCT). IF NOT GLACCT9 IS INITIAL.
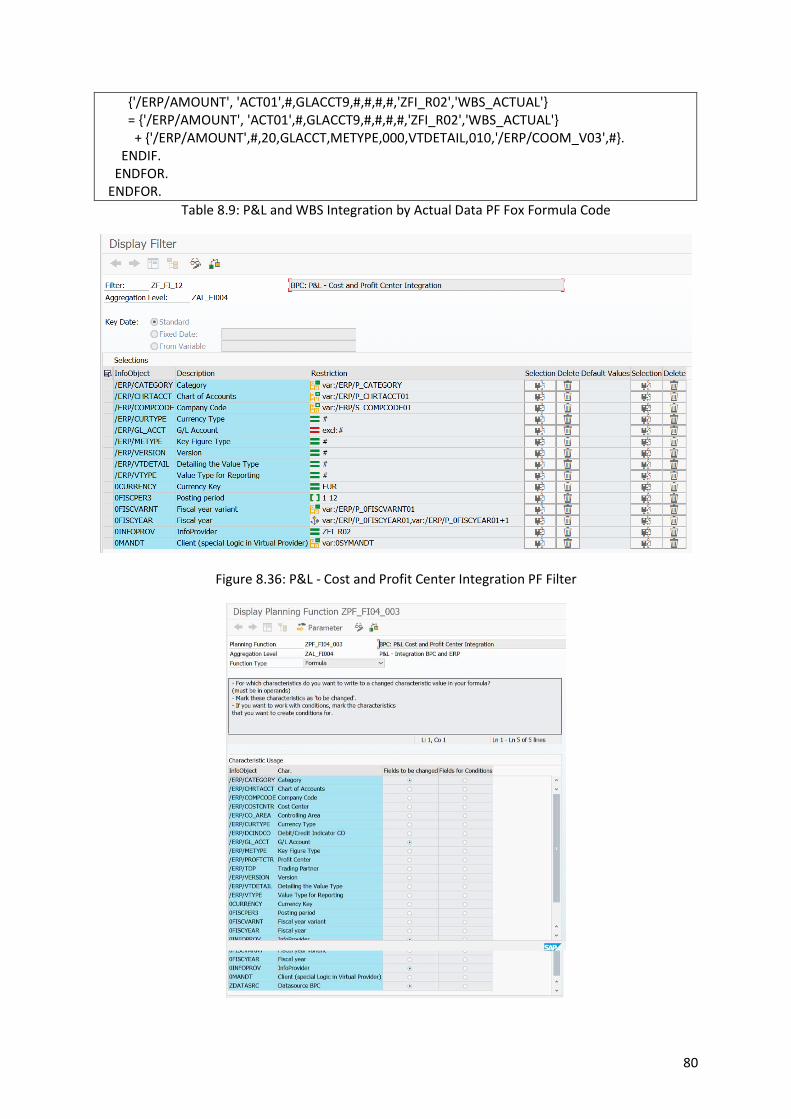
80
{'/ERP/AMOUNT', 'ACT01',#,GLACCT9,#,#,#,#,'ZFI_R02','WBS_ACTUAL'} = {'/ERP/AMOUNT', 'ACT01',#,GLACCT9,#,#,#,#,'ZFI_R02','WBS_ACTUAL'} + {'/ERP/AMOUNT',#,20,GLACCT,METYPE,000,VTDETAIL,010,'/ERP/COOM_V03',#}. ENDIF. ENDFOR. ENDFOR.
Table 8.9: P&L and WBS Integration by Actual Data PF Fox Formula Code
Figure 8.36: P&L - Cost and Profit Center Integration PF Filter
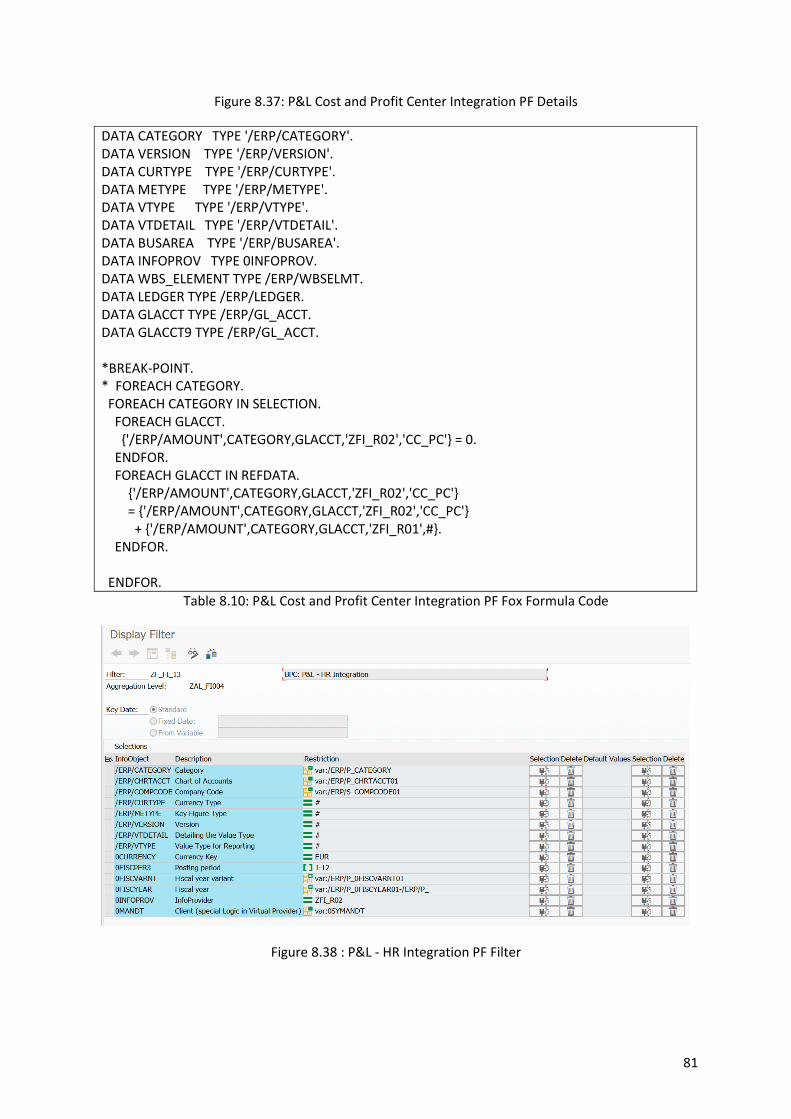
81
Figure 8.37: P&L Cost and Profit Center Integration PF Details
DATA CATEGORY TYPE '/ERP/CATEGORY'. DATA VERSION TYPE '/ERP/VERSION'. DATA CURTYPE TYPE '/ERP/CURTYPE'. DATA METYPE TYPE '/ERP/METYPE'. DATA VTYPE TYPE '/ERP/VTYPE'. DATA VTDETAIL TYPE '/ERP/VTDETAIL'. DATA BUSAREA TYPE '/ERP/BUSAREA'. DATA INFOPROV TYPE 0INFOPROV. DATA WBS_ELEMENT TYPE /ERP/WBSELMT. DATA LEDGER TYPE /ERP/LEDGER. DATA GLACCT TYPE /ERP/GL_ACCT. DATA GLACCT9 TYPE /ERP/GL_ACCT. *BREAK-POINT. * FOREACH CATEGORY. FOREACH CATEGORY IN SELECTION. FOREACH GLACCT. {'/ERP/AMOUNT',CATEGORY,GLACCT,'ZFI_R02','CC_PC'} = 0. ENDFOR. FOREACH GLACCT IN REFDATA. {'/ERP/AMOUNT',CATEGORY,GLACCT,'ZFI_R02','CC_PC'} = {'/ERP/AMOUNT',CATEGORY,GLACCT,'ZFI_R02','CC_PC'} + {'/ERP/AMOUNT',CATEGORY,GLACCT,'ZFI_R01',#}. ENDFOR. ENDFOR.
Table 8.10: P&L Cost and Profit Center Integration PF Fox Formula Code
Figure 8.38 : P&L - HR Integration PF Filter

82
Figure 8.39: P&L HR Integration PF Details
DATA CATEGORY TYPE '/ERP/CATEGORY'. DATA CATEGORY_M TYPE '/ERP/CATEGORY'. DATA VERSION TYPE '/ERP/VERSION'. DATA CURTYPE TYPE '/ERP/CURTYPE'. DATA METYPE TYPE '/ERP/METYPE'. DATA VTYPE TYPE '/ERP/VTYPE'. DATA VTDETAIL TYPE '/ERP/VTDETAIL'. DATA BUSAREA TYPE '/ERP/BUSAREA'. DATA PERIOD TYPE '0FISCPER3'. DATA M_FCST TYPE '0FISCPER3'. DATA CHARTACC TYPE '/ERP/CHRTACCT'. DATA YEAR TYPE '0FISCYEAR'. DATA YEAR2 TYPE '0FISCYEAR'. DATA MANDT TYPE 0MANDT. DATA INFOPROV TYPE 0INFOPROV. DATA WBS_ELEMENT TYPE / ERP / WBSELMT. DATA LEDGER TYPE / ERP / LEDGER. DATA GLACCT TYPE / ERP / GL_ACCT. DATA GLACCT1 TYPE / ERP / GL_ACCT. DATA GLACCT2 TYPE / ERP / GL_ACCT. *DATA GLACCT9 TYPE /ERP/GL_ACCT. *Change(25.09.2017)............................................. CATEGORY_M = VARV( '/ERP/P_CATEGORY' ). M_FCST = ATRV( '0FISCPER3', CATEGORY_M ).

83
*M_VAL = ATRV( '0FISCPER3', CATEGORY_M ). YEAR = OBJV( ). YEAR2 = ATRV( '0FISCYEAR', CATEGORY_M ). *Change......................................................... *Staff Cost GLACCT = '6300099999'. ******ADDED FOR CHANGE REQUEST 04.10.2017******* GLACCT1 = '6300099999'. GLACCT2 = '6332099999'. ************************************************ *BREAK-POINT. FOREACH CATEGORY, MANDT, CHARTACC IN SELECTION. FOREACH PERIOD. { '/ERP/AMOUNT', CATEGORY, CHARTACC, GLACCT, PERIOD, 'ZFI_R02', MANDT, 'HR_PLAN' } = 0. { '/ERP/AMOUNT', CATEGORY, CHARTACC, GLACCT2, PERIOD, 'ZFI_R02', MANDT, 'HR_PLAN' } = 0. ENDFOR. * {'/ERP/AMOUNT',CATEGORY,GLACCT,'ZFI_R02','CC_PC'} = 0. FOREACH PERIOD IN REFDATA. IF PERIOD > M_FCST. **************.....COMMENTED FOR THE CHANGE REQUEST BELOW.....*************************** * {'/ERP/AMOUNT',CATEGORY,CHARTACC,GLACCT, PERIOD, 'ZFI_R02',MANDT,'HR_PLAN'} * = {'/ERP/AMOUNT',CATEGORY,CHARTACC,GLACCT, PERIOD, 'ZFI_R02',MANDT,'HR_PLAN' } * + {'ZEMPCOST',CATEGORY,#,#, PERIOD, 'ZHR_R02',#,#}. *************************************04.10.2017****************************************** *******************************ACCOUNT CHANGE REQUEST 04.10.2017************************* { '/ERP/AMOUNT', CATEGORY, CHARTACC, GLACCT, PERIOD, 'ZFI_R02', MANDT, 'HR_PLAN' } = { '/ERP/AMOUNT', CATEGORY, CHARTACC, GLACCT, PERIOD, 'ZFI_R02', MANDT, 'HR_PLAN' } + ( { 'ZEMPCOST', CATEGORY, #, #, PERIOD, 'ZHR_R02', #, # } - { 'ZLNCHVOU', CATEGORY, #, #, PERIOD, 'ZHR_R02', #, # } - { 'ZHLTHINS', CATEGORY, #, #, PERIOD, 'ZHR_R02', #, # } - { 'ZMEALALL', CATEGORY, #, #, PERIOD, 'ZHR_R02', #, # } - { 'ZKMINDEM', CATEGORY, #, #, PERIOD, 'ZHR_R02', #, # } ). { '/ERP/AMOUNT', CATEGORY, CHARTACC, GLACCT2, PERIOD, 'ZFI_R02', MANDT, 'HR_PLAN' } = { '/ERP/AMOUNT', CATEGORY, CHARTACC, GLACCT2, PERIOD, 'ZFI_R02', MANDT, 'HR_PLAN' } + { 'ZLNCHVOU', CATEGORY, #, #, PERIOD, 'ZHR_R02', #, # } + { 'ZHLTHINS', CATEGORY, #, #, PERIOD, 'ZHR_R02', #, # } + { 'ZMEALALL', CATEGORY, #, #, PERIOD, 'ZHR_R02', #, # } + { 'ZKMINDEM', CATEGORY, #, #, PERIOD, 'ZHR_R02', #, # }.
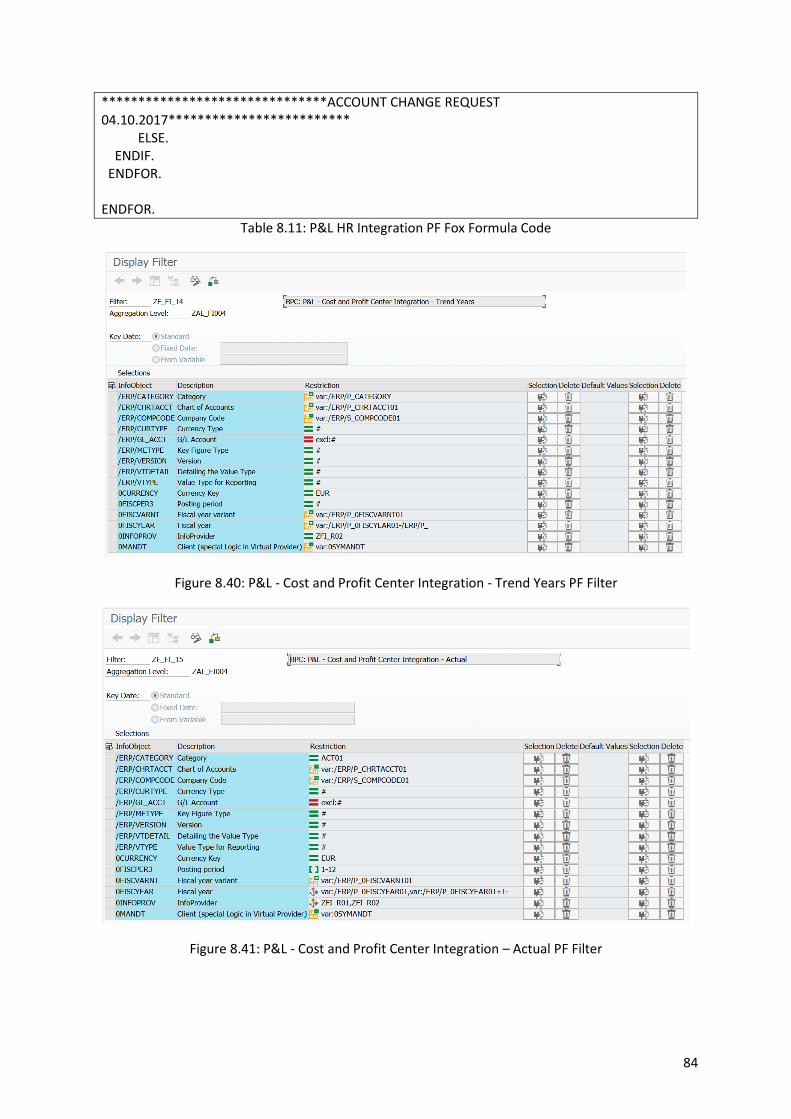
84
*******************************ACCOUNT CHANGE REQUEST 04.10.2017************************* ELSE. ENDIF. ENDFOR. ENDFOR.
Table 8.11: P&L HR Integration PF Fox Formula Code
Figure 8.40: P&L - Cost and Profit Center Integration - Trend Years PF Filter
Figure 8.41: P&L - Cost and Profit Center Integration – Actual PF Filter

85
Figure 8.42: P&L Cost and Profit Center Integration by Actual PF Details
DATA CATEGORY TYPE '/ERP/CATEGORY'. DATA VERSION TYPE '/ERP/VERSION'. DATA CURTYPE TYPE '/ERP/CURTYPE'. DATA METYPE TYPE '/ERP/METYPE'. DATA VTYPE TYPE '/ERP/VTYPE'. DATA VTDETAIL TYPE '/ERP/VTDETAIL'. DATA BUSAREA TYPE '/ERP/BUSAREA'. DATA INFOPROV TYPE 0INFOPROV. DATA WBS_ELEMENT TYPE /ERP/WBSELMT. DATA LEDGER TYPE /ERP/LEDGER. DATA GLACCT TYPE /ERP/GL_ACCT. DATA GLACCT9 TYPE /ERP/GL_ACCT. BREAK-POINT. FOREACH GLACCT. {'/ERP/AMOUNT','ACT01', GLACCT,'ZFI_R02','CC_PC'} = 0. ENDFOR. FOREACH GLACCT IN REFDATA. {'/ERP/AMOUNT','ACT01',GLACCT,'ZFI_R02','CC_PC'} = {'/ERP/AMOUNT','ACT01',GLACCT,'ZFI_R02','CC_PC'} + {'/ERP/AMOUNT','ACT01',GLACCT,'ZFI_R01',#}. ENDFOR.
Table 8.12: P&L Cost and Profit Center Integration by Actual PF Fox Formula Code
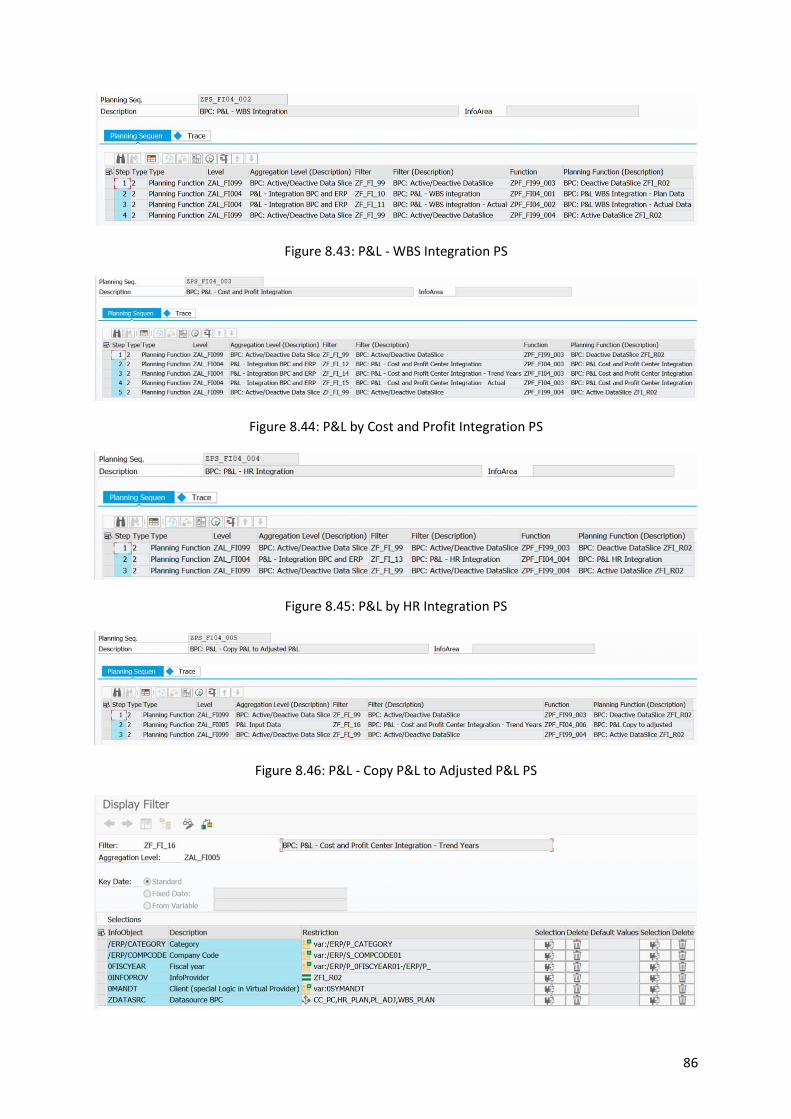
86
Figure 8.43: P&L - WBS Integration PS
Figure 8.44: P&L by Cost and Profit Integration PS
Figure 8.45: P&L by HR Integration PS
Figure 8.46: P&L - Copy P&L to Adjusted P&L PS
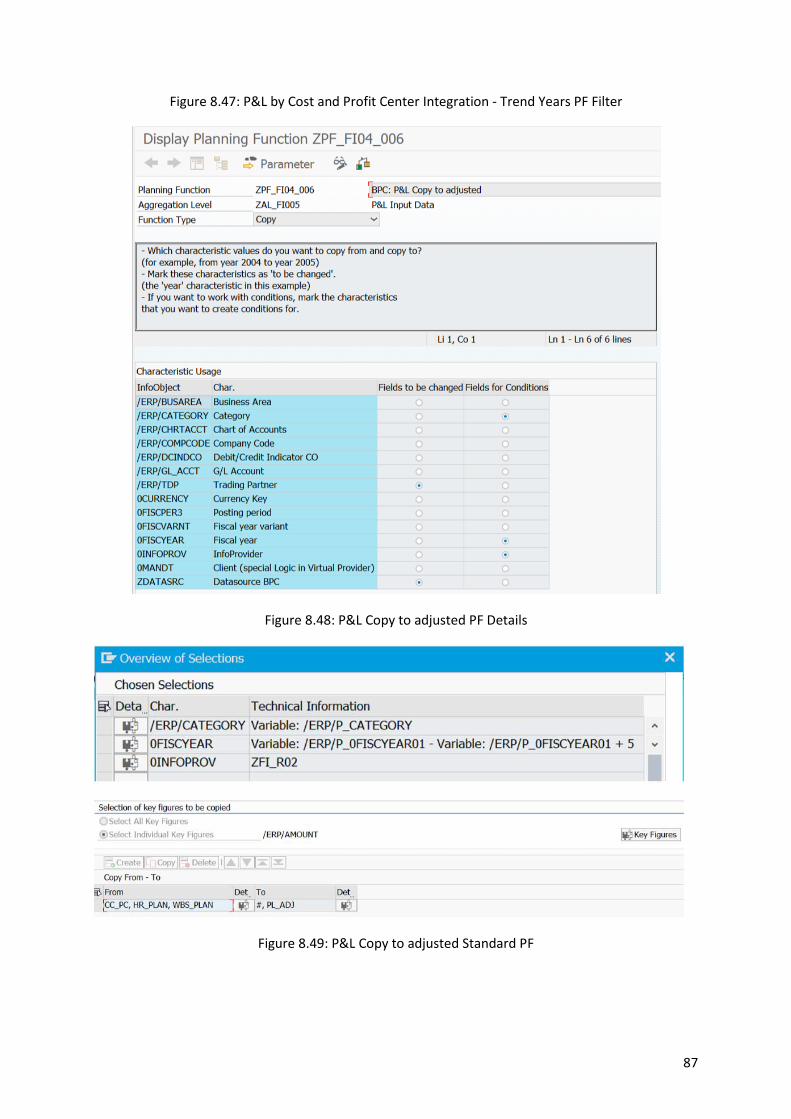
87
Figure 8.47: P&L by Cost and Profit Center Integration - Trend Years PF Filter
Figure 8.48: P&L Copy to adjusted PF Details
Figure 8.49: P&L Copy to adjusted Standard PF
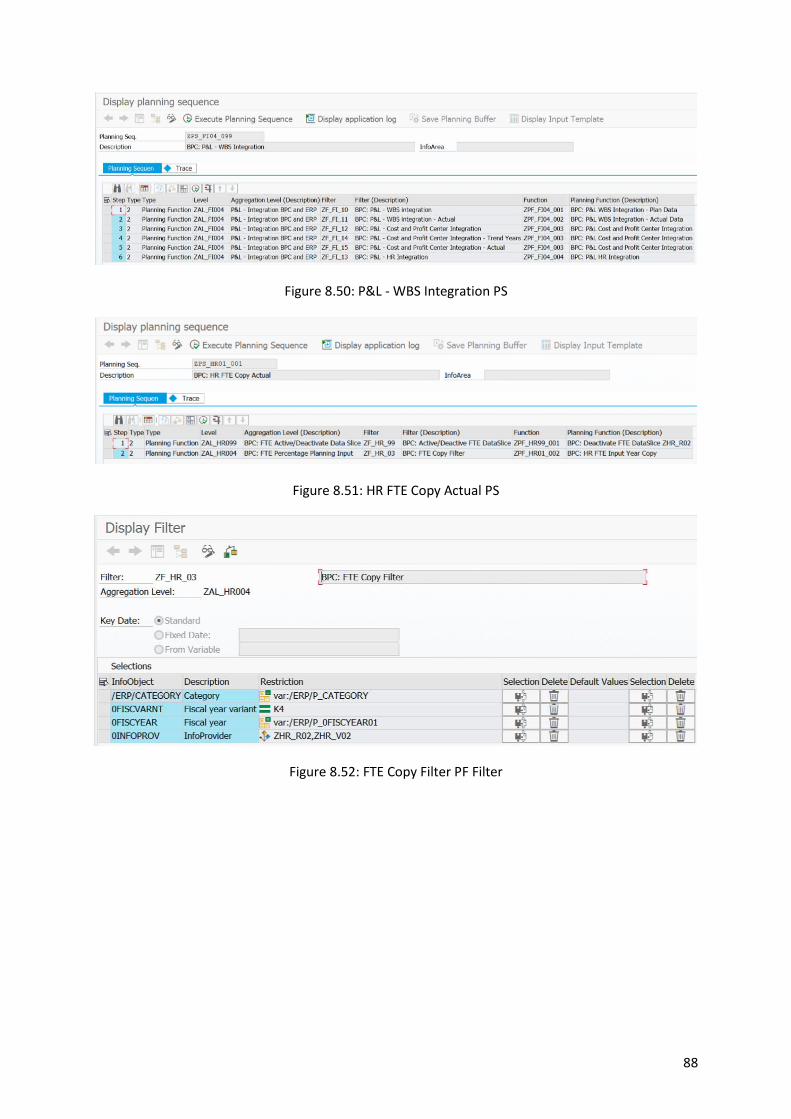
88
Figure 8.50: P&L - WBS Integration PS
Figure 8.51: HR FTE Copy Actual PS
Figure 8.52: FTE Copy Filter PF Filter
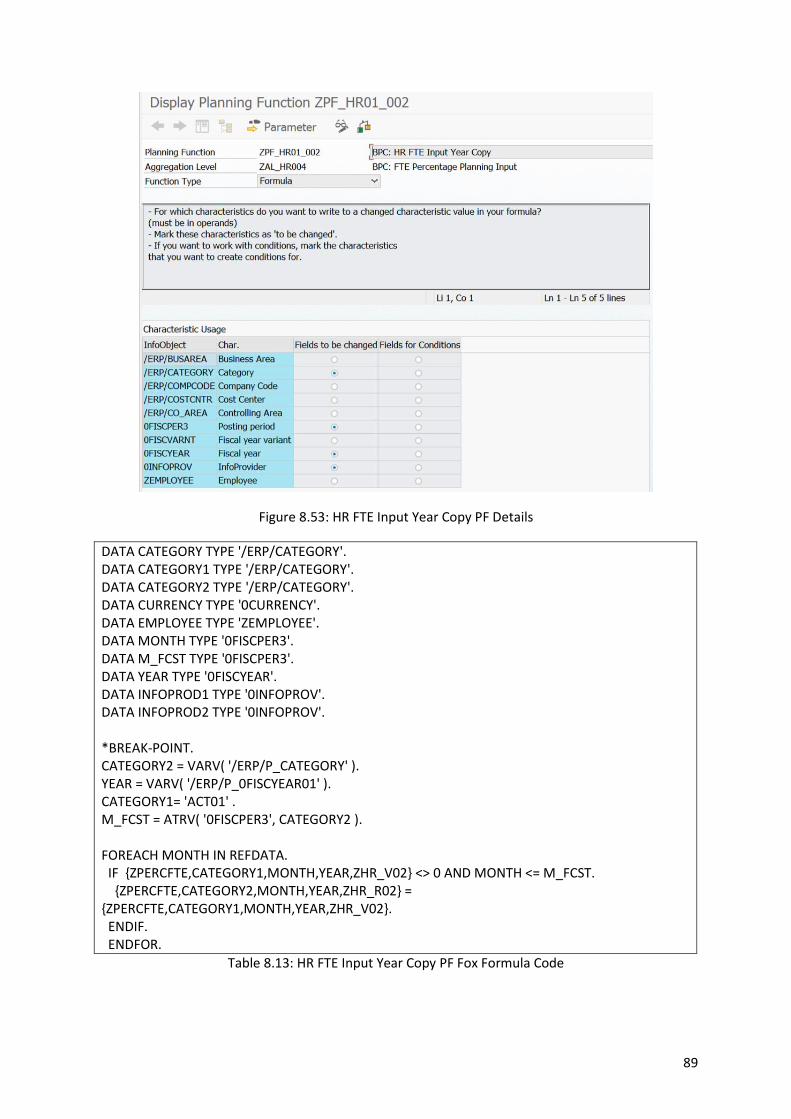
89
Figure 8.53: HR FTE Input Year Copy PF Details
DATA CATEGORY TYPE '/ERP/CATEGORY'. DATA CATEGORY1 TYPE '/ERP/CATEGORY'. DATA CATEGORY2 TYPE '/ERP/CATEGORY'. DATA CURRENCY TYPE '0CURRENCY'. DATA EMPLOYEE TYPE 'ZEMPLOYEE'. DATA MONTH TYPE '0FISCPER3'. DATA M_FCST TYPE '0FISCPER3'. DATA YEAR TYPE '0FISCYEAR'. DATA INFOPROD1 TYPE '0INFOPROV'. DATA INFOPROD2 TYPE '0INFOPROV'. *BREAK-POINT. CATEGORY2 = VARV( '/ERP/P_CATEGORY' ). YEAR = VARV( '/ERP/P_0FISCYEAR01' ). CATEGORY1= 'ACT01' . M_FCST = ATRV( '0FISCPER3', CATEGORY2 ). FOREACH MONTH IN REFDATA. IF {ZPERCFTE,CATEGORY1,MONTH,YEAR,ZHR_V02} <> 0 AND MONTH <= M_FCST. {ZPERCFTE,CATEGORY2,MONTH,YEAR,ZHR_R02} = {ZPERCFTE,CATEGORY1,MONTH,YEAR,ZHR_V02}. ENDIF. ENDFOR.
Table 8.13: HR FTE Input Year Copy PF Fox Formula Code
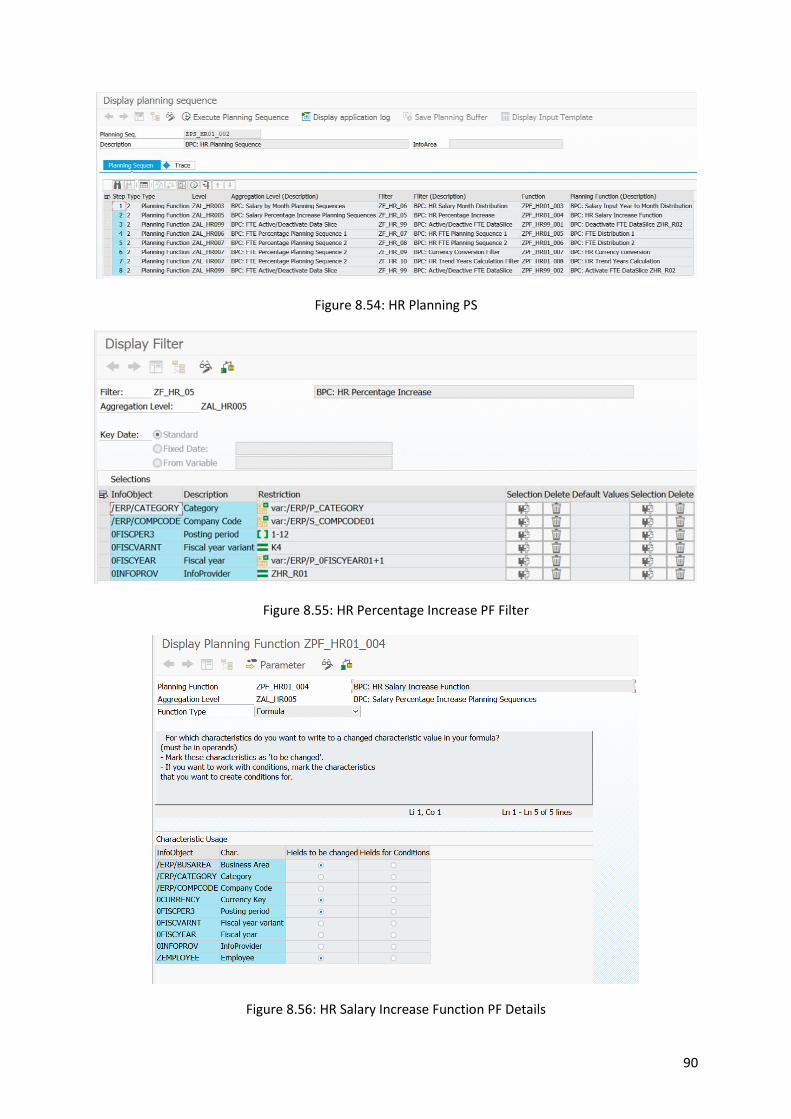
90
Figure 8.54: HR Planning PS
Figure 8.55: HR Percentage Increase PF Filter
Figure 8.56: HR Salary Increase Function PF Details

91
DATA CATEGORY TYPE '/ERP/CATEGORY'. DATA COMPCODE TYPE '/ERP/COMPCODE'. DATA BUSAREA TYPE '/ERP/BUSAREA'. DATA CURRENCY TYPE '0CURRENCY'. DATA EMPLOYEE TYPE 'ZEMPLOYEE'. DATA YEAR TYPE '0FISCYEAR'. DATA M_COUNT TYPE '0FISCPER3'. DATA PERCENTAGE TYPE F. DATA PERC_AUX TYPE F. DATA KF TYPE KEYFIGURE_NAME. DATA MONTH TYPE '0FISCPER3'. DATA AMOUNT TYPE F. DATA BP TYPE I. DATA CHECK TYPE I. BP = 0. M_COUNT = 000. PERCENTAGE = 1. DO. IF M_COUNT >= 012. EXIT. ELSE. M_COUNT = TMVL( M_COUNT, 1 ). PERCENTAGE = PERCENTAGE * ( 1 + ( { 'ZPERCSLRY', #, #, M_COUNT, # } / 100 ) ). IF PERCENTAGE <> 0. FOREACH EMPLOYEE, KF, BUSAREA, CURRENCY. IF KF <> 'ZPERCSLRY' AND NOT EMPLOYEE IS INITIAL. { KF, BUSAREA, CURRENCY, M_COUNT, EMPLOYEE } = { KF, BUSAREA, CURRENCY, M_COUNT, EMPLOYEE } * PERCENTAGE. ENDIF. ENDFOR. ENDIF. ENDIF. ENDDO.
Table 8.14: HR Salary Increase Function PF Fox Formula Code

92
Figure 8.57: HR Salary Month Distribution PF Filter
Figure 8.58: Salary Input Year to Month Distribution PF Details
DATA YEAR TYPE 0FISCYEAR. DATA EMPLOYEE TYPE ZEMPLOYEE. DATA YEAR2 TYPE 0FISCYEAR. DATA CATEGORY TYPE '/ERP/CATEGORY'. DATA CATEGORY_M TYPE '/ERP/CATEGORY'. DATA MONTH TYPE '0FISCPER3'. DATA MONTH2 TYPE '0FISCPER3'. DATA M_COUNT TYPE '0FISCPER3'. DATA M_FCST TYPE '0FISCPER3'. DATA KEYFIGURE TYPE KEYFIGURE_NAME. DATA M_VAL TYPE I. DATA DIV_VAL TYPE I. DATA TOTALMONTH TYPE F. DATA BP TYPE I. DATA X TYPE KEYFIGURE_NAME. DATA EMPCONT TYPE F. TOTALMONTH = 12. *MONTH2 = '00'. BP = 0. *DO. * IF BP = 1. * EXIT. * ENDIF. *ENDDO. CATEGORY = VARV( '/ERP/P_CATEGORY' ). EMPLOYEE = OBJV( ). *CATEGORY = OBJV( ).
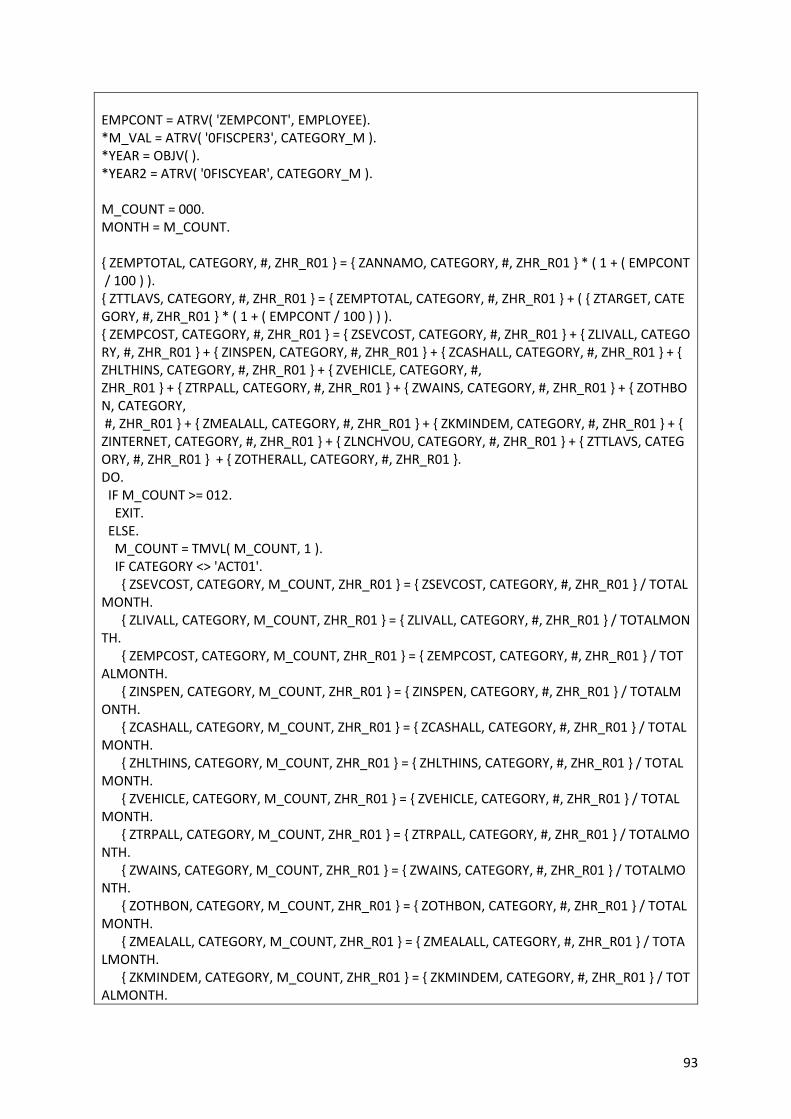
93
EMPCONT = ATRV( 'ZEMPCONT', EMPLOYEE). *M_VAL = ATRV( '0FISCPER3', CATEGORY_M ). *YEAR = OBJV( ). *YEAR2 = ATRV( '0FISCYEAR', CATEGORY_M ). M_COUNT = 000. MONTH = M_COUNT. { ZEMPTOTAL, CATEGORY, #, ZHR_R01 } = { ZANNAMO, CATEGORY, #, ZHR_R01 } * ( 1 + ( EMPCONT / 100 ) ). { ZTTLAVS, CATEGORY, #, ZHR_R01 } = { ZEMPTOTAL, CATEGORY, #, ZHR_R01 } + ( { ZTARGET, CATEGORY, #, ZHR_R01 } * ( 1 + ( EMPCONT / 100 ) ) ). { ZEMPCOST, CATEGORY, #, ZHR_R01 } = { ZSEVCOST, CATEGORY, #, ZHR_R01 } + { ZLIVALL, CATEGORY, #, ZHR_R01 } + { ZINSPEN, CATEGORY, #, ZHR_R01 } + { ZCASHALL, CATEGORY, #, ZHR_R01 } + { ZHLTHINS, CATEGORY, #, ZHR_R01 } + { ZVEHICLE, CATEGORY, #, ZHR_R01 } + { ZTRPALL, CATEGORY, #, ZHR_R01 } + { ZWAINS, CATEGORY, #, ZHR_R01 } + { ZOTHBON, CATEGORY, #, ZHR_R01 } + { ZMEALALL, CATEGORY, #, ZHR_R01 } + { ZKMINDEM, CATEGORY, #, ZHR_R01 } + { ZINTERNET, CATEGORY, #, ZHR_R01 } + { ZLNCHVOU, CATEGORY, #, ZHR_R01 } + { ZTTLAVS, CATEGORY, #, ZHR_R01 } + { ZOTHERALL, CATEGORY, #, ZHR_R01 }. DO. IF M_COUNT >= 012. EXIT. ELSE. M_COUNT = TMVL( M_COUNT, 1 ). IF CATEGORY <> 'ACT01'. { ZSEVCOST, CATEGORY, M_COUNT, ZHR_R01 } = { ZSEVCOST, CATEGORY, #, ZHR_R01 } / TOTALMONTH. { ZLIVALL, CATEGORY, M_COUNT, ZHR_R01 } = { ZLIVALL, CATEGORY, #, ZHR_R01 } / TOTALMONTH. { ZEMPCOST, CATEGORY, M_COUNT, ZHR_R01 } = { ZEMPCOST, CATEGORY, #, ZHR_R01 } / TOTALMONTH. { ZINSPEN, CATEGORY, M_COUNT, ZHR_R01 } = { ZINSPEN, CATEGORY, #, ZHR_R01 } / TOTALMONTH. { ZCASHALL, CATEGORY, M_COUNT, ZHR_R01 } = { ZCASHALL, CATEGORY, #, ZHR_R01 } / TOTALMONTH. { ZHLTHINS, CATEGORY, M_COUNT, ZHR_R01 } = { ZHLTHINS, CATEGORY, #, ZHR_R01 } / TOTALMONTH. { ZVEHICLE, CATEGORY, M_COUNT, ZHR_R01 } = { ZVEHICLE, CATEGORY, #, ZHR_R01 } / TOTALMONTH. { ZTRPALL, CATEGORY, M_COUNT, ZHR_R01 } = { ZTRPALL, CATEGORY, #, ZHR_R01 } / TOTALMONTH. { ZWAINS, CATEGORY, M_COUNT, ZHR_R01 } = { ZWAINS, CATEGORY, #, ZHR_R01 } / TOTALMONTH. { ZOTHBON, CATEGORY, M_COUNT, ZHR_R01 } = { ZOTHBON, CATEGORY, #, ZHR_R01 } / TOTALMONTH. { ZMEALALL, CATEGORY, M_COUNT, ZHR_R01 } = { ZMEALALL, CATEGORY, #, ZHR_R01 } / TOTALMONTH. { ZKMINDEM, CATEGORY, M_COUNT, ZHR_R01 } = { ZKMINDEM, CATEGORY, #, ZHR_R01 } / TOTALMONTH.

94
{ ZINTERNET, CATEGORY, M_COUNT, ZHR_R01 } = { ZINTERNET, CATEGORY, #, ZHR_R01 } / TOTALMONTH. { ZLNCHVOU, CATEGORY, M_COUNT, ZHR_R01 } = { ZLNCHVOU, CATEGORY, #, ZHR_R01 } / TOTALMONTH. { ZTARGET, CATEGORY, M_COUNT, ZHR_R01 } = { ZTARGET, CATEGORY, #, ZHR_R01 } / TOTALMONTH. { ZEMPTOTAL, CATEGORY, M_COUNT, ZHR_R01 } = { ZEMPTOTAL, CATEGORY, #, ZHR_R01 } / TOTALMONTH. { ZBASPAY, CATEGORY, M_COUNT, ZHR_R01 } = { ZBASPAY, CATEGORY, #, ZHR_R01 } / TOTALMONTH. { ZANNAMO, CATEGORY, M_COUNT, ZHR_R01 } = { ZANNAMO, CATEGORY, #, ZHR_R01 } / TOTALMONTH. { ZTTLAVS, CATEGORY, M_COUNT, ZHR_R01 } = { ZTTLAVS, CATEGORY, #, ZHR_R01 } / TOTALMONTH. { ZOTHERALL, CATEGORY, M_COUNT, ZHR_R01 } = { ZOTHERALL, CATEGORY, #, ZHR_R01 } / TOTALMONTH. ENDIF. ENDIF. ENDDO.
Table 8.15: Salary Input Year to Month Distribution PF Fox Formula
Figure 8.59: HR FTE Planning Sequence 1 PF Filter

95
Figure 8.60: FTE Distribution 1 PF Details
DATA CATEGORY TYPE '/ERP/CATEGORY'. DATA COMPCODE TYPE '/ERP/COMPCODE'. DATA BUSAREA TYPE '/ERP/BUSAREA'. DATA CURRENCY TYPE '0CURRENCY'. DATA EMPLOYEE TYPE 'ZEMPLOYEE'. DATA MONTH TYPE '0FISCPER3'. DATA KF TYPE KEYFIGURE_NAME. DATA PERCENTAGE TYPE F. DATA TOTAL TYPE F. *BREAK-POINT. EMPLOYEE = OBJV(). MONTH=OBJV(). PERCENTAGE = { 'ZPERCFTE' }. IF PERCENTAGE <> 0. { 'ZTOTLFTE' } = PERCENTAGE. IF { 'ZTOTLFTE' } > 100. MESSAGE E000(ZBPC) WITH EMPLOYEE MONTH . EXIT. ELSE. ENDIF. ENDIF.
Table 8.16: FTE Distribution 1 PF Fox Formula

96
Figure 8.61: FTE Distribution 2 PF Details
DATA CATEGORY TYPE '/ERP/CATEGORY'. DATA COMPCODE TYPE '/ERP/COMPCODE'. DATA BUSAREA TYPE '/ERP/BUSAREA'. DATA CURRENCY TYPE '0CURRENCY'. DATA EMPLOYEE TYPE 'ZEMPLOYEE'. DATA YEAR TYPE '0FISCYEAR'. DATA M_COUNT TYPE '0FISCPER3'. DATA COAREA TYPE '/ERP/CO_AREA'. DATA COSTCENTER TYPE '/ERP/COSTCNTR'. DATA TOTALPERCENTAGE TYPE F. DATA PERCENTAGE TYPE F. DATA INFOPROD TYPE '0INFOPROV'. DATA KF TYPE KEYFIGURE_NAME. DATA AMOUNT TYPE F. DATA BP TYPE I. BP = 0. *DO. * IF BP = 1. * EXIT. * ENDIF. *ENDDO. *BREAK-POINT. INFOPROD = 'ZHR_R02'. FOREACH COSTCENTER, COAREA. IF NOT COSTCENTER IS INITIAL. TOTALPERCENTAGE = { 'ZTOTLFTE', #, #, #, ZHR_R02 }. PERCENTAGE = { 'ZPERCFTE', COSTCENTER, COAREA, #, ZHR_R02 }.
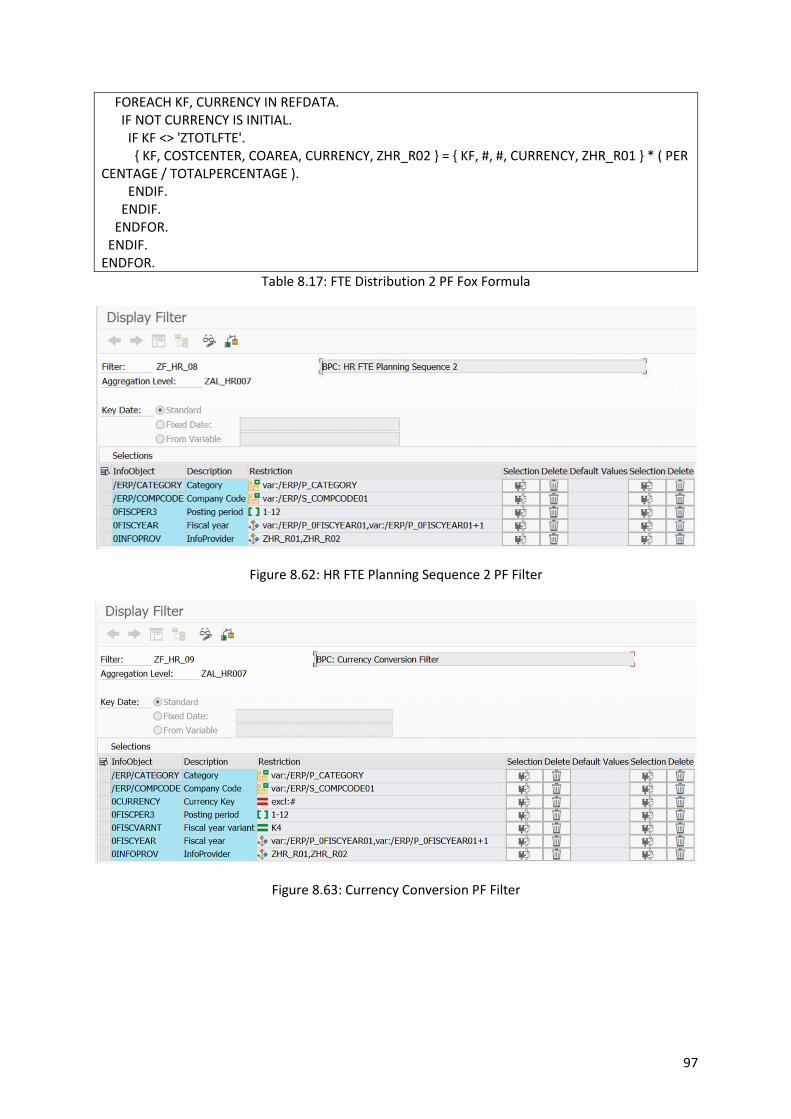
97
FOREACH KF, CURRENCY IN REFDATA. IF NOT CURRENCY IS INITIAL. IF KF <> 'ZTOTLFTE'. { KF, COSTCENTER, COAREA, CURRENCY, ZHR_R02 } = { KF, #, #, CURRENCY, ZHR_R01 } * ( PERCENTAGE / TOTALPERCENTAGE ). ENDIF. ENDIF. ENDFOR. ENDIF. ENDFOR.
Table 8.17: FTE Distribution 2 PF Fox Formula
Figure 8.62: HR FTE Planning Sequence 2 PF Filter
Figure 8.63: Currency Conversion PF Filter

98
Figure 8.64: HR Currency Conversion PF Details
DATA LCUR TYPE 0CURRENCY. DATA ECUR TYPE 0CURRENCY. DATA COMPCODE TYPE '/ERP/COMPCODE'. DATA AMOUNT TYPE F. DATA DATE TYPE D. DATA KF TYPE KEYFIGURE_NAME. DATA YEAR TYPE 0FISCYEAR. *BREAK-POINT. ECUR = EUR. YEAR = OBJV( ). CALL FUNCTION ZCURR_CONV_BPC EXPORTING I_YEAR = YEAR I_EX_TYPE = 'ZB' IMPORTING E_DATE = DATE. * E_EX_TYPE = EX_TYPE. FOREACH KF, LCUR. IF LCUR <> 'EUR' OR NOT LCUR IS INITIAL. AMOUNT = { KF, LCUR }. AMOUNT = CURC( AMOUNT, DATE, ZB, LCUR, EUR ). { KF, EUR } = AMOUNT. ENDIF. ENDFOR.
Table 8.18: HR Currency Conversion PF Fox Formula
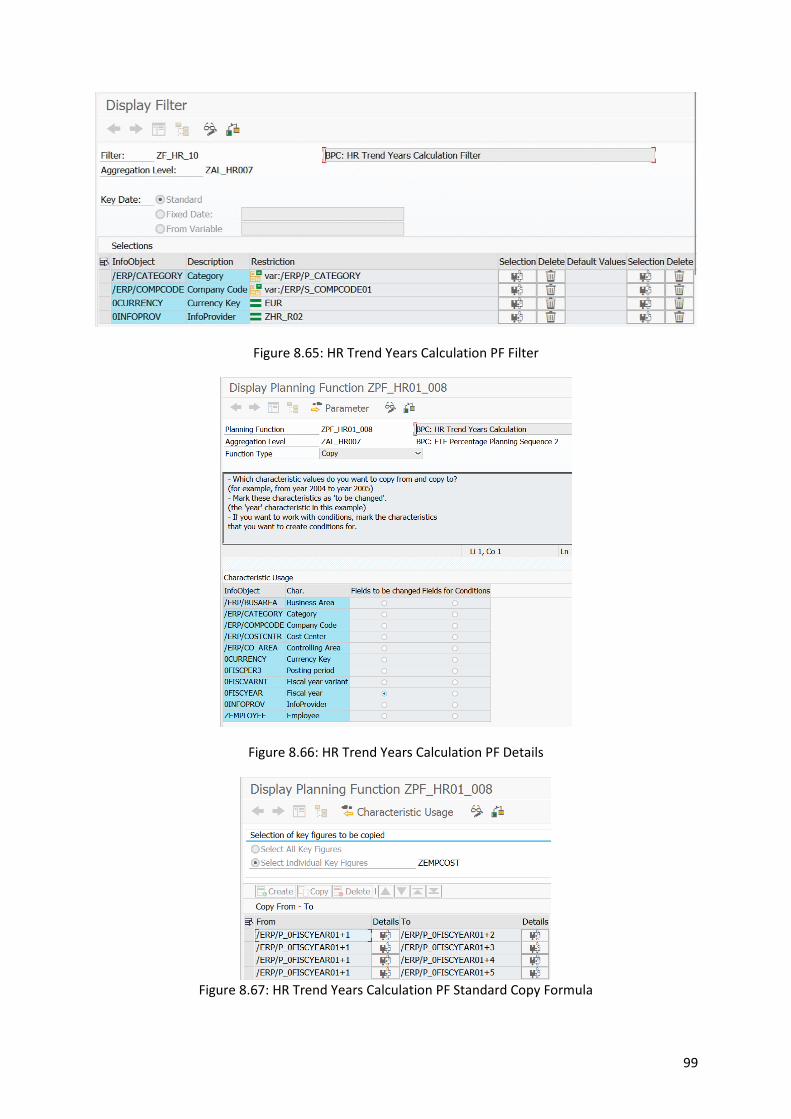
99
Figure 8.65: HR Trend Years Calculation PF Filter
Figure 8.66: HR Trend Years Calculation PF Details
Figure 8.67: HR Trend Years Calculation PF Standard Copy Formula
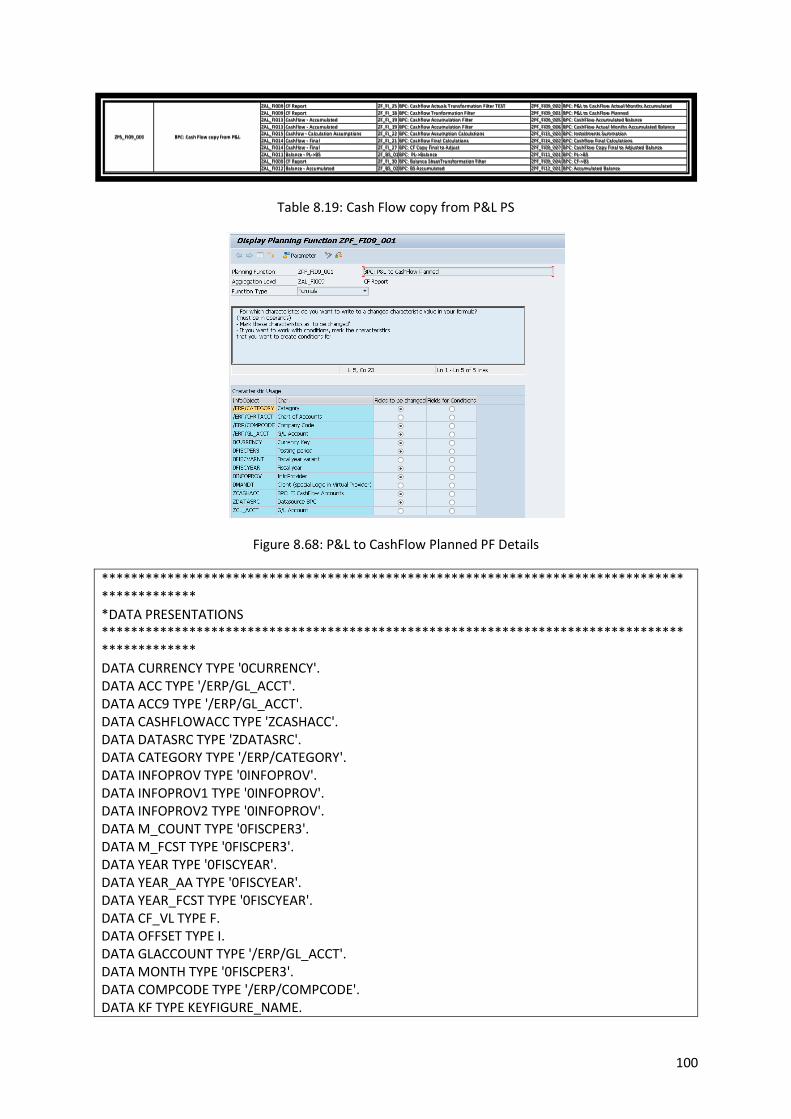
100
Table 8.19: Cash Flow copy from P&L PS
Figure 8.68: P&L to CashFlow Planned PF Details
********************************************************************************************* *DATA PRESENTATIONS ********************************************************************************************* DATA CURRENCY TYPE '0CURRENCY'. DATA ACC TYPE '/ERP/GL_ACCT'. DATA ACC9 TYPE '/ERP/GL_ACCT'. DATA CASHFLOWACC TYPE 'ZCASHACC'. DATA DATASRC TYPE 'ZDATASRC'. DATA CATEGORY TYPE '/ERP/CATEGORY'. DATA INFOPROV TYPE '0INFOPROV'. DATA INFOPROV1 TYPE '0INFOPROV'. DATA INFOPROV2 TYPE '0INFOPROV'. DATA M_COUNT TYPE '0FISCPER3'. DATA M_FCST TYPE '0FISCPER3'. DATA YEAR TYPE '0FISCYEAR'. DATA YEAR_AA TYPE '0FISCYEAR'. DATA YEAR_FCST TYPE '0FISCYEAR'. DATA CF_VL TYPE F. DATA OFFSET TYPE I. DATA GLACCOUNT TYPE '/ERP/GL_ACCT'. DATA MONTH TYPE '0FISCPER3'. DATA COMPCODE TYPE '/ERP/COMPCODE'. DATA KF TYPE KEYFIGURE_NAME.
Planning Sequence ID Planning Sequence Desc DP ID DP Desc Filter ID Filter Desc Function ID Function Desc
ZAL_FI099 BPC: Active/Deactive Data Slice ZF_FI_99 BPC: Active/Deactive DataSlice ZPF_FI99_001 BPC: Deactive DataSlice ZFI_R01
ZAL_FI003 Non-Production - Cost to Profit by month ZF_FI_02 Filter to Intercompany Recharges ZPF_FI03_001 BPC: Intercompany Recharge
ZAL_FI099 BPC: Active/Deactive Data Slice ZF_FI_99 BPC: Active/Deactive DataSlice ZPF_FI99_002 BPC: Active DataSlice ZFI_R01
ZAL_FI099 BPC: Active/Deactive Data Slice ZF_FI_99 BPC: Active/Deactive DataSlice ZPF_FI99_001 BPC: Deactive DataSlice ZFI_R01
ZAL_FI003 Non-Production - Cost to Profit by month ZF_FI_03 Filter to Copy Actual to 9* accounts ZPF_FI03_002 BPC: Copy Actual to 9* accounts
ZAL_FI003 Non-Production - Cost to Profit by month ZF_FI_38 Filter to Copy Actual to 9* accounts (Accounts 900000000*) ZPF_FI03_011 BPC: Copy Actual to 9* accounts (Accounts 900000000*)
ZAL_FI099 BPC: Active/Deactive Data Slice ZF_FI_99 BPC: Active/Deactive DataSlice ZPF_FI99_002 BPC: Active DataSlice ZFI_R01
ZAL_FI099 BPC: Active/Deactive Data Slice ZF_FI_99 BPC: Active/Deactive DataSlice ZPF_FI99_001 BPC: Deactive DataSlice ZFI_R01
ZAL_FI003 Non-Production - Cost to Profit by month ZF_FI_05 BPC: Monthly Distribution - Actual Data - CostCenter ZPF_FI03_006 BPC: Monthly Distribution - Actual Data
ZAL_FI003 Non-Production - Cost to Profit by month ZF_FI_04 BPC: Monthly Distribution - CostCenter ZPF_FI03_003 BPC: Monthly Distribution
ZAL_FI099 BPC: Active/Deactive Data Slice ZF_FI_99 BPC: Active/Deactive DataSlice ZPF_FI99_002 BPC: Active DataSlice ZFI_R01
ZAL_FI099 BPC: Active/Deactive Data Slice ZF_FI_99 BPC: Active/Deactive DataSlice ZPF_FI99_001 BPC: Deactive DataSlice ZFI_R01
ZAL_FI003 Non-Production - Cost to Profit by month ZF_FI_04 BPC: Monthly Distribution - CostCenter ZPF_FI03_007 BPC: Year Aggregation
ZAL_FI099 BPC: Active/Deactive Data Slice ZF_FI_99 BPC: Active/Deactive DataSlice ZPF_FI99_002 BPC: Active DataSlice ZFI_R01
ZAL_FI099 BPC: Active/Deactive Data Slice ZF_FI_99 BPC: Active/Deactive DataSlice ZPF_FI99_001 BPC: Deactive DataSlice ZFI_R01
ZAL_FI003 Non-Production - Cost to Profit by month ZF_FI_06 BPC: Monthly Distribution Year+1 - CostCenter ZPF_FI03_003 BPC: Monthly Distribution
ZAL_FI099 BPC: Active/Deactive Data Slice ZF_FI_99 BPC: Active/Deactive DataSlice ZPF_FI99_002 BPC: Active DataSlice ZFI_R01
ZAL_FI099 BPC: Active/Deactive Data Slice ZF_FI_99 BPC: Active/Deactive DataSlice ZPF_FI99_001 BPC: Deactive DataSlice ZFI_R01
ZAL_FI003 Non-Production - Cost to Profit by month ZF_FI_06 BPC: Monthly Distribution Year+1 - CostCenter ZPF_FI03_007 BPC: Year Aggregation
ZAL_FI099 BPC: Active/Deactive Data Slice ZF_FI_99 BPC: Active/Deactive DataSlice ZPF_FI99_002 BPC: Active DataSlice ZFI_R01
ZAL_FI099 BPC: Active/Deactive Data Slice ZF_FI_99 BPC: Active/Deactive DataSlice ZPF_FI99_001 BPC: Deactive DataSlice ZFI_R01
ZAL_FI003 Non-Production - Cost to Profit by month ZF_FI_08 BPC: Monthly Distribution - Actual Data - ProfitCenter ZPF_FI03_006 BPC: Monthly Distribution - Actual Data
ZAL_FI003 Non-Production - Cost to Profit by month ZF_FI_07 BPC: Monthly Distribution - ProfitCenter ZPF_FI03_003 BPC: Monthly Distribution
ZAL_FI099 BPC: Active/Deactive Data Slice ZF_FI_99 BPC: Active/Deactive DataSlice ZPF_FI99_002 BPC: Active DataSlice ZFI_R01
ZAL_FI099 BPC: Active/Deactive Data Slice ZF_FI_99 BPC: Active/Deactive DataSlice ZPF_FI99_001 BPC: Deactive DataSlice ZFI_R01
ZAL_FI003 Non-Production - Cost to Profit by month ZF_FI_07 BPC: Monthly Distribution - ProfitCenter ZPF_FI03_007 BPC: Year Aggregation
ZAL_FI099 BPC: Active/Deactive Data Slice ZF_FI_99 BPC: Active/Deactive DataSlice ZPF_FI99_002 BPC: Active DataSlice ZFI_R01
ZAL_FI099 BPC: Active/Deactive Data Slice ZF_FI_99 BPC: Active/Deactive DataSlice ZPF_FI99_001 BPC: Deactive DataSlice ZFI_R01
ZAL_FI003 Non-Production - Cost to Profit by month ZF_FI_09 BPC: Monthly Distribution Year+1 - ProfitCenter ZPF_FI03_003 BPC: Monthly Distribution
ZAL_FI099 BPC: Active/Deactive Data Slice ZF_FI_99 BPC: Active/Deactive DataSlice ZPF_FI99_002 BPC: Active DataSlice ZFI_R01
ZAL_FI099 BPC: Active/Deactive Data Slice ZF_FI_99 BPC: Active/Deactive DataSlice ZPF_FI99_001 BPC: Deactive DataSlice ZFI_R01
ZAL_FI003 Non-Production - Cost to Profit by month ZF_FI_09 BPC: Monthly Distribution Year+1 - ProfitCenter ZPF_FI03_007 BPC: Year Aggregation
ZAL_FI099 BPC: Active/Deactive Data Slice ZF_FI_99 BPC: Active/Deactive DataSlice ZPF_FI99_002 BPC: Active DataSlice ZFI_R01
ZAL_FI099 BPC: Active/Deactive Data Slice ZF_FI_99 BPC: Active/Deactive DataSlice ZPF_FI99_001 BPC: Deactive DataSlice ZFI_R01
ZAL_FI003 Non-Production - Cost to Profit by month ZF_FI_39 BPC: Monthly Distribution - Actual Data - Costcenter (All) ZPF_FI03_006 BPC: Monthly Distribution - Actual Data
ZAL_FI003 Non-Production - Cost to Profit by month ZF_FI_40 BPC: Monthly Distribution - Actual Data - ProfitCenter (All) ZPF_FI03_006 BPC: Monthly Distribution - Actual Data
ZAL_FI099 BPC: Active/Deactive Data Slice ZF_FI_99 BPC: Active/Deactive DataSlice ZPF_FI99_002 BPC: Active DataSlice ZFI_R01
ZAL_FI099 BPC: Active/Deactive Data Slice ZF_FI_99 BPC: Active/Deactive DataSlice ZPF_FI99_001 BPC: Deactive DataSlice ZFI_R01
ZAL_FI003 Non-Production - Cost to Profit by month ZF_FI_41 Filter to Copy Actual to 9* accounts (All Companies) ZPF_FI03_002 BPC: Copy Actual to 9* accounts
ZAL_FI003 Non-Production - Cost to Profit by month ZF_FI_42 Filter to Copy Actual to 9* (Accounts 900000000*)(All) ZPF_FI03_011 BPC: Copy Actual to 9* accounts (Accounts 900000000*)
ZAL_FI099 BPC: Active/Deactive Data Slice ZF_FI_99 BPC: Active/Deactive DataSlice ZPF_FI99_002 BPC: Active DataSlice ZFI_R01
ZAL_FI099 BPC: Active/Deactive Data Slice ZF_FI_99 BPC: Active/Deactive DataSlice ZPF_FI99_003 BPC: Deactive DataSlice ZFI_R02
ZAL_FI004 P&L - Integration BPC and ERP ZF_FI_10 BPC: P&L - WBS integration ZPF_FI04_001 BPC: P&L WBS Integration - Plan Data
ZAL_FI004 P&L - Integration BPC and ERP ZF_FI_11 BPC: P&L - WBS integration - Actual ZPF_FI04_002 BPC: P&L WBS Integration - Actual Data
ZAL_FI004 P&L - Integration BPC and ERP ZF_FI_12 BPC: P&L - Cost and Profit Center Integration ZPF_FI04_003 BPC: P&L Cost and Profit Center Integration
ZAL_FI004 P&L - Integration BPC and ERP ZF_FI_14 BPC: P&L - Cost and Profit Center Integration - Trend Years ZPF_FI04_003 BPC: P&L Cost and Profit Center Integration
ZAL_FI004 P&L - Integration BPC and ERP ZF_FI_15 BPC: P&L - Cost and Profit Center Integration - Actual ZPF_FI04_003 BPC: P&L Cost and Profit Center Integration
ZAL_FI004 P&L - Integration BPC and ERP ZF_FI_32 BPC: P&L - HR Integration Variable Year ZPF_FI04_004 BPC: P&L HR Integration Variable Year
ZAL_FI004 P&L - Integration BPC and ERP ZF_FI_31 BPC: P&L - HR Integration for Plan Years ZPF_FI04_007 BPC: P&L HR Integration Plan Years
ZAL_FI099 BPC: Active/Deactive Data Slice ZF_FI_99 BPC: Active/Deactive DataSlice ZPF_FI99_004 BPC: Active DataSlice ZFI_R02
ZAL_FI099 BPC: Active/Deactive Data Slice ZF_FI_99 BPC: Active/Deactive DataSlice ZPF_FI99_003 BPC: Deactive DataSlice ZFI_R02
ZAL_FI004 P&L - Integration BPC and ERP ZF_FI_10 BPC: P&L - WBS integration ZPF_FI04_001 BPC: P&L WBS Integration - Plan Data
ZAL_FI004 P&L - Integration BPC and ERP ZF_FI_11 BPC: P&L - WBS integration - Actual ZPF_FI04_002 BPC: P&L WBS Integration - Actual Data
ZAL_FI099 BPC: Active/Deactive Data Slice ZF_FI_99 BPC: Active/Deactive DataSlice ZPF_FI99_004 BPC: Active DataSlice ZFI_R02
ZAL_FI099 BPC: Active/Deactive Data Slice ZF_FI_99 BPC: Active/Deactive DataSlice ZPF_FI99_003 BPC: Deactive DataSlice ZFI_R02
ZAL_FI004 P&L - Integration BPC and ERP ZF_FI_12 BPC: P&L - Cost and Profit Center Integration ZPF_FI04_003 BPC: P&L Cost and Profit Center Integration
ZAL_FI004 P&L - Integration BPC and ERP ZF_FI_14 BPC: P&L - Cost and Profit Center Integration - Trend Years ZPF_FI04_003 BPC: P&L Cost and Profit Center Integration
ZAL_FI004 P&L - Integration BPC and ERP ZF_FI_15 BPC: P&L - Cost and Profit Center Integration - Actual ZPF_FI04_003 BPC: P&L Cost and Profit Center Integration
ZAL_FI099 BPC: Active/Deactive Data Slice ZF_FI_99 BPC: Active/Deactive DataSlice ZPF_FI99_004 BPC: Active DataSlice ZFI_R02
ZAL_FI099 BPC: Active/Deactive Data Slice ZF_FI_99 BPC: Active/Deactive DataSlice ZPF_FI99_003 BPC: Deactive DataSlice ZFI_R02
ZAL_FI004 P&L - Integration BPC and ERP ZF_FI_32 BPC: P&L - HR Integration Variable Year ZPF_FI04_004 BPC: P&L HR Integration Variable Year
ZAL_FI004 P&L - Integration BPC and ERP ZF_FI_31 BPC: P&L - HR Integration for Plan Years ZPF_FI04_007 BPC: P&L HR Integration Plan Years
ZAL_FI099 BPC: Active/Deactive Data Slice ZF_FI_99 BPC: Active/Deactive DataSlice ZPF_FI99_004 BPC: Active DataSlice ZFI_R02
ZAL_FI099 BPC: Active/Deactive Data Slice ZF_FI_99 BPC: Active/Deactive DataSlice ZPF_FI99_003 BPC: Deactive DataSlice ZFI_R02
ZAL_FI005 P&L Input Data ZF_FI_16 BPC: P&L - Cost and Profit Center Integration - Trend Years ZPF_FI04_006 BPC: P&L Copy to adjusted
ZAL_FI099 BPC: Active/Deactive Data Slice ZF_FI_99 BPC: Active/Deactive DataSlice ZPF_FI99_004 BPC: Active DataSlice ZFI_R02
ZAL_FI009 CF Report ZF_FI_25 BPC: Cashflow Actuals Transformation Filter TEST ZPF_FI09_002 BPC: P&L to CashFlow Actual Months Accumulated
ZAL_FI009 CF Report ZF_FI_18 BPC: Cashflow Tranformation Filter ZPF_FI09_001 BPC: P&L to CashFlow Planned
ZAL_FI013 Cashflow - Accumulated ZF_FI_19 BPC: Cashflow Accumulation Filter ZPF_FI09_005 BPC: CashFlow Accumulated Balance
ZAL_FI013 Cashflow - Accumulated ZF_FI_19 BPC: Cashflow Accumulation Filter ZPF_FI09_006 BPC: CashFlow Actual Months Accumulated Balance
ZAL_FI015 Cashfow - Calculation Assumptions ZF_FI_22 BPC: Cashflow Assumption Calculations ZPF_FI15_003 BPC: Installments Summation
ZAL_FI014 Cashflow - Final ZF_FI_21 BPC: Cashflow Final Calculations ZPF_FI14_002 BPC: Cashflow Final Calculations
ZAL_FI014 Cashflow - Final ZF_FI_27 BPC: CF Copy Final to Adjust ZPF_FI09_007 BPC: CashFlow Copy Final to Adjusted Balance
ZAL_FI011 Balance - PL->BS ZF_BS_01 BPC: PL->Balance ZPF_FI11_001 BPC: PL->BS
ZAL_FI009 CF Report ZF_FI_30 BPC: Balance SheetTransformation Filter ZPF_FI09_004 BPC: CF->BS
ZAL_FI012 Balance - Accumulated ZF_BS_02 BPC: BS Accumulated ZPF_FI12_001 BPC: Accumulated Balance
ZPS_FI09_002 BPC: Cash Flow Adjusted Calculations ZAL_FI014 Cashflow - Final ZF_FI_29 BPC: Cashflow Adjusted Final Calculations ZPF_FI14_003 BPC: Cashflow Adjusted Final Calculations
ZAL_HR099BPC: FTE Active/Deactivate Data Slice ZF_HR_99BPC: Active/Deactive FTE DataSlice ZPF_HR99_001BPC: Deactivate FTE DataSlice ZHR_R02
ZAL_HR004BPC: FTE Percentage Planning Input ZF_HR_03BPC: FTE Copy Filter ZPF_HR01_002BPC: HR FTE Input Year Copy
ZAL_HR003BPC: Salary by Month Planning Sequences ZF_HR_06BPC: HR Salary Month Distribution ZPF_HR01_003BPC: Salary Input Year to Month Distribution
ZAL_HR005BPC: Salary Percentage Increase Planning SequencesZF_HR_05BPC: HR Percentage Increase ZPF_HR01_004BPC: HR Salary Increase Function
ZAL_HR099BPC: FTE Active/Deactivate Data Slice ZF_HR_99BPC: Active/Deactive FTE DataSlice ZPF_HR99_001BPC: Deactivate FTE DataSlice ZHR_R02
ZAL_HR006BPC: FTE Percentage Planning Sequence 1 ZF_HR_07BPC: HR FTE Planning Sequence 1 ZPF_HR01_005BPC: FTE Distribution 1
ZAL_HR007BPC: FTE Percentage Planning Sequence 2 ZF_HR_08BPC: HR FTE Planning Sequence 2 ZPF_HR01_006BPC: FTE Distribution 2
ZAL_HR007BPC: FTE Percentage Planning Sequence 2 ZF_HR_08BPC: HR FTE Planning Sequence 2 ZPF_HR01_010BPC: FTE Distribution 3
ZAL_HR007BPC: FTE Percentage Planning Sequence 2 ZF_HR_09BPC: Currency Conversion Filter ZPF_HR01_007BPC: HR Currency conversion
ZAL_HR007BPC: FTE Percentage Planning Sequence 2 ZF_HR_10BPC: HR Trend Years Calculation Filter ZPF_HR01_008BPC: HR Trend Years Calculation
ZAL_HR099BPC: FTE Active/Deactivate Data Slice ZF_HR_99BPC: Active/Deactive FTE DataSlice ZPF_HR99_002BPC: Activate FTE DataSlice ZHR_R02
ZAL_HR099BPC: FTE Active/Deactivate Data Slice ZF_HR_99BPC: Active/Deactive FTE DataSlice ZPF_HR99_001BPC: Deactivate FTE DataSlice ZHR_R02
ZAL_HR004BPC: FTE Percentage Planning Input ZF_HR_11BPC: FTE Copy Filter All Years ZPF_HR01_009BPC: HR FTE Input Year Copy
ZPS_HR01_001 BPC: HR FTE Copy Actual
ZPS_HR01_002 BPC: HR Planning Sequence
ZPS_HR01_003 BPC: HR FTE Copy Actual All Years
ZPS_FI04_004 BPC: P&L - HR Integration
ZPS_FI04_005 BPC: P&L - Copy P&L to Adjusted P&L
ZPS_FI09_001 BPC: Cash Flow copy from P&L
ZPS_FI04_001 BPC: P&L - Full Integration
ZPS_FI04_002 BPC: P&L - WBS Integration
ZPS_FI04_003 BPC: P&L - Cost and Profit Integration
ZPS_FI01_010 BPC: Year Aggregation Year+1 - ProfitCenter
ZPS_FI01_011 BPC: Monthly Distribution - Actual Values
ZPS_FI01_012 BPC: Copy Actual (All Companies)
ZPS_FI01_007 BPC: Monthly Distribution - ProfitCenter
ZPS_FI01_008 BPC: Year Aggregation - ProfitCenter
ZPS_FI01_009 BPC: Monthly Distribution Year+1 - ProfitCenter
ZPS_FI01_004 BPC: Year Aggregation - CostCenter
ZPS_FI01_005 BPC: Monthly Distribution Year+1 - CostCenter
ZPS_FI01_006 BPC: Year Aggregation Year+1 - CostCenter
ZPS_FI01_001 BPC: Intercompany Recharge
ZPS_FI01_002 BPC: Copy Actual
ZPS_FI01_003 BPC: Monthly Distribution - CostCenter

101
DATA PERCENTAGE TYPE F. *BREAK-POINT. ********************************************************************************************* ********************************************************************************************* *CLEARING TARGET SOURCE TO AVOID DUPLICATION. ********************************************************************************************* FOREACH COMPCODE, GLACCOUNT, CASHFLOWACC, MONTH, YEAR, CATEGORY IN REFDATA. IF NOT GLACCOUNT IS INITIAL AND NOT CASHFLOWACC IS INITIAL AND NOT COMPCODE IS INITIAL AND NOT MONTH IS INITIAL AND NOT YEAR IS INITIAL. { 'ZCASHTTL', CATEGORY, COMPCODE, GLACCOUNT, EUR, MONTH, YEAR, ZFI_R05, CASHFLOWACC, CF_PLAN } = 0. ENDIF. ENDFOR. ********************************************************************************************* ********************************************************************************************* *CALCULATION FOR PLAN MONTHS>MONTH FORECAST(NOT ACCUMULATED) AMOUNTS FROM P&L CUBE. ********************************************************************************************* FOREACH COMPCODE, MONTH, GLACCOUNT, CATEGORY, YEAR IN REFDATA. IF NOT GLACCOUNT IS INITIAL. FOREACH DATASRC IN REFDATA. IF DATASRC <> 'CF_PLAN'. FOREACH CASHFLOWACC IN REFDATA. IF NOT CASHFLOWACC IS INITIAL. { ZCASHTTL, CATEGORY, COMPCODE, GLACCOUNT, EUR, MONTH, YEAR, ZFI_R05, CASHFLOWACC, CF_PLAN } = { ZCASHTTL, CATEGORY, COMPCODE, GLACCOUNT, EUR, MONTH, YEAR, ZFI_R05, CASHFLOWACC, CF_PLAN } + ( { / ERP / AMOUNT, CATEGORY, COMPCODE, GLACCOUNT, EUR, MONTH, YEAR, ZFI_R02, #, DATASRC } * { ZPERCCF, CATEGORY, PT10, GLACCOUNT, #, #, YEAR, ZFI_R05, CASHFLOWACC, PL_CF } ). ENDIF. ENDFOR. ENDIF. ENDFOR. ENDIF. ENDFOR. *********************************************************************************************
Table 8.20: P&L to CashFlow Planned PF Fox Formula
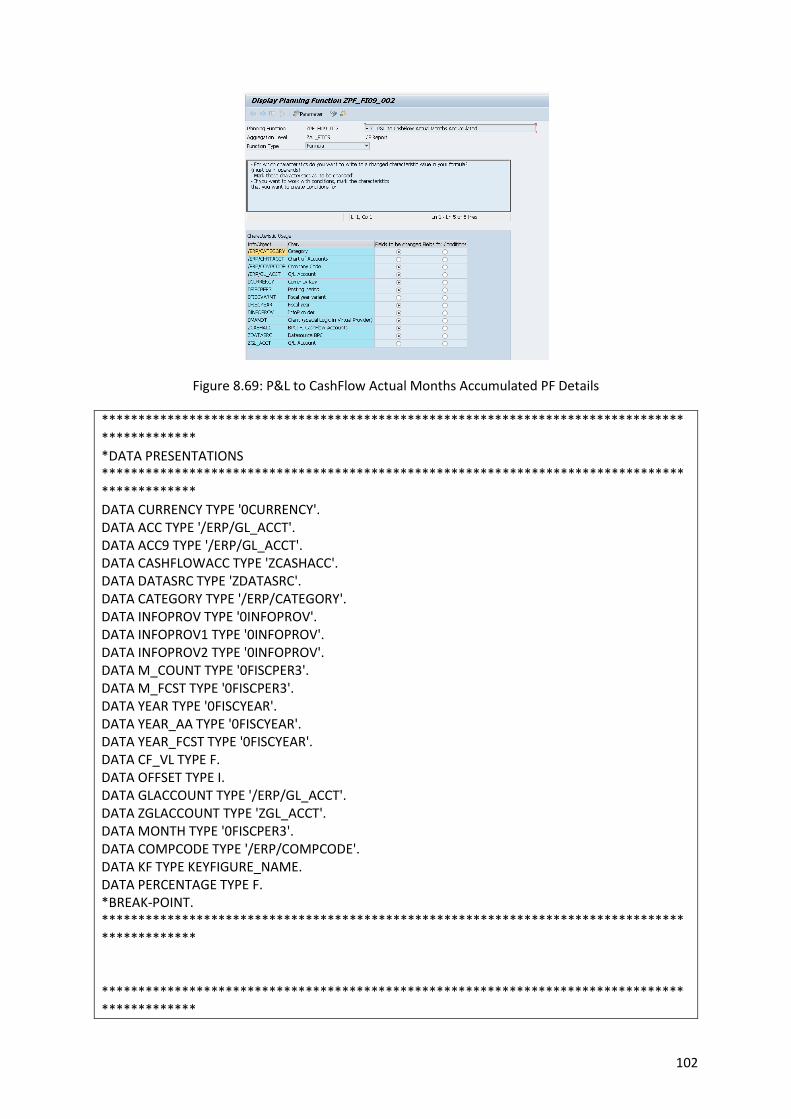
102
Figure 8.69: P&L to CashFlow Actual Months Accumulated PF Details
********************************************************************************************* *DATA PRESENTATIONS ********************************************************************************************* DATA CURRENCY TYPE '0CURRENCY'. DATA ACC TYPE '/ERP/GL_ACCT'. DATA ACC9 TYPE '/ERP/GL_ACCT'. DATA CASHFLOWACC TYPE 'ZCASHACC'. DATA DATASRC TYPE 'ZDATASRC'. DATA CATEGORY TYPE '/ERP/CATEGORY'. DATA INFOPROV TYPE '0INFOPROV'. DATA INFOPROV1 TYPE '0INFOPROV'. DATA INFOPROV2 TYPE '0INFOPROV'. DATA M_COUNT TYPE '0FISCPER3'. DATA M_FCST TYPE '0FISCPER3'. DATA YEAR TYPE '0FISCYEAR'. DATA YEAR_AA TYPE '0FISCYEAR'. DATA YEAR_FCST TYPE '0FISCYEAR'. DATA CF_VL TYPE F. DATA OFFSET TYPE I. DATA GLACCOUNT TYPE '/ERP/GL_ACCT'. DATA ZGLACCOUNT TYPE 'ZGL_ACCT'. DATA MONTH TYPE '0FISCPER3'. DATA COMPCODE TYPE '/ERP/COMPCODE'. DATA KF TYPE KEYFIGURE_NAME. DATA PERCENTAGE TYPE F. *BREAK-POINT. ********************************************************************************************* *********************************************************************************************

103
*CLEARING TARGET SOURCE TO AVOID DUPLICATION. ********************************************************************************************* FOREACH COMPCODE, GLACCOUNT, CASHFLOWACC, MONTH, YEAR, CATEGORY IN REFDATA. IF NOT GLACCOUNT IS INITIAL AND NOT CASHFLOWACC IS INITIAL AND NOT COMPCODE IS INITIAL AND NOT MONTH IS INITIAL AND NOT YEAR IS INITIAL. { 'ZCASHTTL', CATEGORY, COMPCODE, GLACCOUNT, EUR, MONTH, YEAR, ZFI_R05, 100, CASHFLOWACC, CF_ACTUAL } = 0. ENDIF. ENDFOR. ********************************************************************************************* ********************************************************************************************* *CALCULATION FOR ACTUAL MONTHS<MONTH FORECAST(ALREADY ACCUMULATED IN THE ACTUAL CUBE) AMOUNTS *FROM ACTUAL CUBE. ********************************************************************************************* FOREACH CATEGORY, YEAR IN REFDATA. IF NOT CATEGORY IS INITIAL AND NOT YEAR IS INITIAL. M_FCST = ATRV( '0FISCPER3', CATEGORY ). YEAR_FCST = ATRV( '0FISCYEAR', CATEGORY ). FOREACH GLACCOUNT, CASHFLOWACC IN REFDATA. IF NOT GLACCOUNT IS INITIAL AND NOT CASHFLOWACC IS INITIAL. FOREACH COMPCODE IN REFDATA. IF NOT COMPCODE IS INITIAL. FOREACH MONTH IN REFDATA. IF YEAR = YEAR_FCST. IF MONTH < M_FCST OR MONTH = M_FCST OR MONTH = 000. { ZCASHTTL, CATEGORY, COMPCODE, GLACCOUNT, EUR, MONTH, YEAR, ZFI_R05, 100, CASHFLOWACC, CF_ACTUAL } = ( { '/ERP/AMOUNT', #, COMPCODE, GLACCOUNT, EUR, MONTH, YEAR, ZFI_C01, #, #, # } * { ZPERCCF, CATEGORY, PT10, GLACCOUNT, #, #, YEAR, ZFI_R05, 100, CASHFLOWACC, PL_CF } ). ENDIF. ENDIF. ENDFOR. ENDIF. ENDFOR. ENDIF. ENDFOR. ENDIF. ENDFOR. *********************************************************************************************

104
********************************************************************************************* *NORMALLY THERE IS NO C_1000 in MAPPING. THIS IS THE CALCULATION FOR ACTUAL MONTH = "0" or " " *(ALREADY ACCUMULATED IN THE ACTUAL CUBE) AMOUNTS FROM ACTUAL CUBE. ********************************************************************************************* FOREACH CATEGORY, YEAR IN REFDATA. IF NOT CATEGORY IS INITIAL AND NOT YEAR IS INITIAL. M_FCST = ATRV( '0FISCPER3', CATEGORY ). YEAR_FCST = ATRV( '0FISCYEAR', CATEGORY ). FOREACH GLACCOUNT, CASHFLOWACC IN REFDATA. IF NOT GLACCOUNT IS INITIAL AND NOT CASHFLOWACC IS INITIAL. FOREACH COMPCODE IN REFDATA. IF NOT COMPCODE IS INITIAL. FOREACH MONTH IN REFDATA. IF YEAR = YEAR_FCST. IF MONTH IS INITIAL OR MONTH = 000. { ZCASHTTL, CATEGORY, COMPCODE, GLACCOUNT, EUR, MONTH, YEAR, ZFI_R05, 100, C_1000, CF_ACTUAL } = ( { ZCASHTTL, CATEGORY, COMPCODE, GLACCOUNT, EUR, MONTH, YEAR, ZFI_R05, 100, CASHFLOWACC, CF_ACTUAL } ). ENDIF. ENDIF. ENDFOR. ENDIF. ENDFOR. ENDIF. ENDFOR. ENDIF. ENDFOR. *********************************************************************************************
Table 8.21: P&L to CashFlow Actual Months Accumulated PF Fox Formula
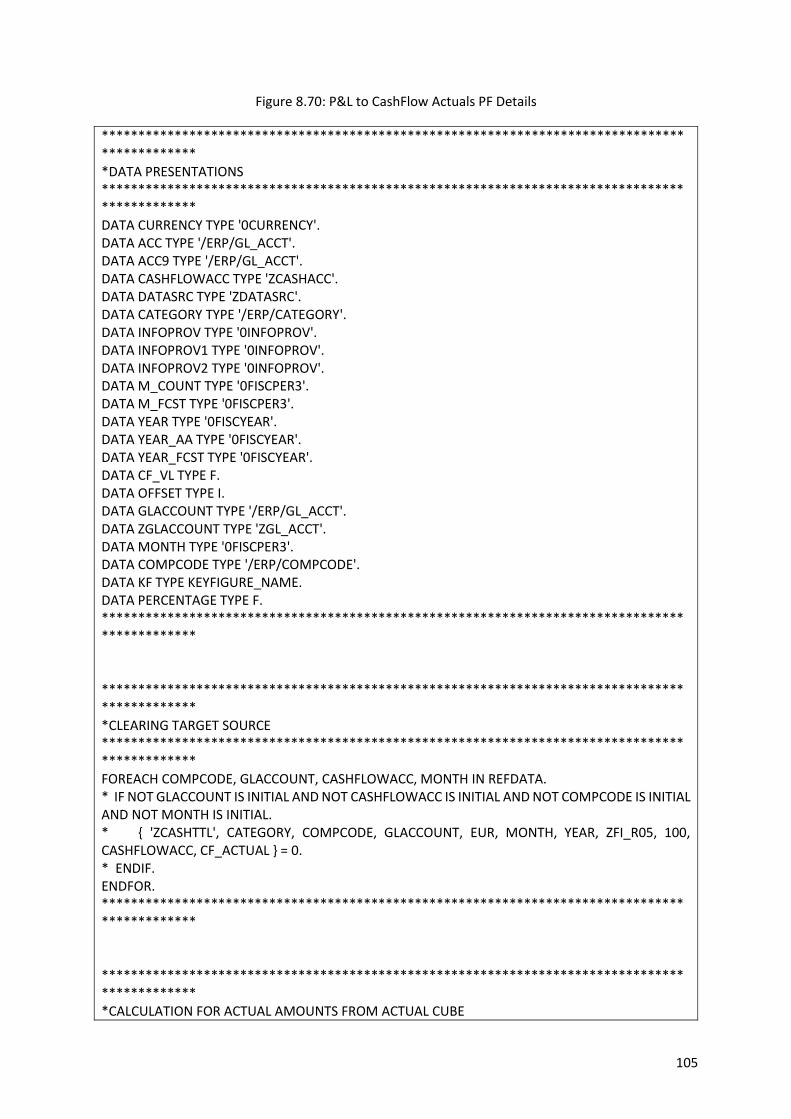
105
Figure 8.70: P&L to CashFlow Actuals PF Details
********************************************************************************************* *DATA PRESENTATIONS ********************************************************************************************* DATA CURRENCY TYPE '0CURRENCY'. DATA ACC TYPE '/ERP/GL_ACCT'. DATA ACC9 TYPE '/ERP/GL_ACCT'. DATA CASHFLOWACC TYPE 'ZCASHACC'. DATA DATASRC TYPE 'ZDATASRC'. DATA CATEGORY TYPE '/ERP/CATEGORY'. DATA INFOPROV TYPE '0INFOPROV'. DATA INFOPROV1 TYPE '0INFOPROV'. DATA INFOPROV2 TYPE '0INFOPROV'. DATA M_COUNT TYPE '0FISCPER3'. DATA M_FCST TYPE '0FISCPER3'. DATA YEAR TYPE '0FISCYEAR'. DATA YEAR_AA TYPE '0FISCYEAR'. DATA YEAR_FCST TYPE '0FISCYEAR'. DATA CF_VL TYPE F. DATA OFFSET TYPE I. DATA GLACCOUNT TYPE '/ERP/GL_ACCT'. DATA ZGLACCOUNT TYPE 'ZGL_ACCT'. DATA MONTH TYPE '0FISCPER3'. DATA COMPCODE TYPE '/ERP/COMPCODE'. DATA KF TYPE KEYFIGURE_NAME. DATA PERCENTAGE TYPE F. ********************************************************************************************* ********************************************************************************************* *CLEARING TARGET SOURCE ********************************************************************************************* FOREACH COMPCODE, GLACCOUNT, CASHFLOWACC, MONTH IN REFDATA. * IF NOT GLACCOUNT IS INITIAL AND NOT CASHFLOWACC IS INITIAL AND NOT COMPCODE IS INITIAL AND NOT MONTH IS INITIAL. * { 'ZCASHTTL', CATEGORY, COMPCODE, GLACCOUNT, EUR, MONTH, YEAR, ZFI_R05, 100, CASHFLOWACC, CF_ACTUAL } = 0. * ENDIF. ENDFOR. ********************************************************************************************* ********************************************************************************************* *CALCULATION FOR ACTUAL AMOUNTS FROM ACTUAL CUBE

106
********************************************************************************************* *FOREACH CATEGORY, YEAR IN REFDATA. * IF NOT CATEGORY IS INITIAL AND NOT YEAR IS INITIAL. * M_FCST = ATRV( '0FISCPER3', CATEGORY ). * YEAR_FCST = ATRV( '0FISCYEAR', CATEGORY ). * FOREACH GLACCOUNT, CASHFLOWACC IN REFDATA. * IF NOT GLACCOUNT IS INITIAL AND NOT CASHFLOWACC IS INITIAL. * FOREACH COMPCODE IN REFDATA. * IF NOT COMPCODE IS INITIAL. * IF YEAR = YEAR_FCST. * IF M_FCST IS INITIAL OR M_FCST = 000. * { ZCASHTTL, CATEGORY, COMPCODE, GLACCOUNT, EUR, #, YEAR, ZFI_R05, 100, CASHFLOWACC, CF_ACTUAL } * = ({ '/ERP/AMOUNT', #, COMPCODE, GLACCOUNT, EUR, #, YEAR, ZFI_C01, #, #, # } * * { ZPERCCF, CATEGORY, PT10, GLACCOUNT, #, #, YEAR, ZFI_R05, 100, CASHFLOWACC, PL_CF } ). * ELSE. ** { ZCASHTTL, CATEGORY, COMPCODE, GLACCOUNT, EUR, M_FCST, YEAR, ZFI_R05, 100, CASHFLOWACC, CF_ACTUAL } ** = { '/ERP/AMOUNT', #, COMPCODE, GLACCOUNT, EUR, M_FCST, YEAR, ZFI_C01, #, #, # } * ** ( 1 + { ZPERCCF, CATEGORY, PT10, GLACCOUNT, #, #, YEAR, ZFI_R05, 100, CASHFLOWACC, PL_CF } ). * ENDIF. * ELSE. * ENDIF. * ENDIF. * ENDFOR. * ENDIF. * ENDFOR. * ENDIF. *ENDFOR. *********************************************************************************************
Table 8.22: P&L to CashFlow Actuals PF Fox Formula
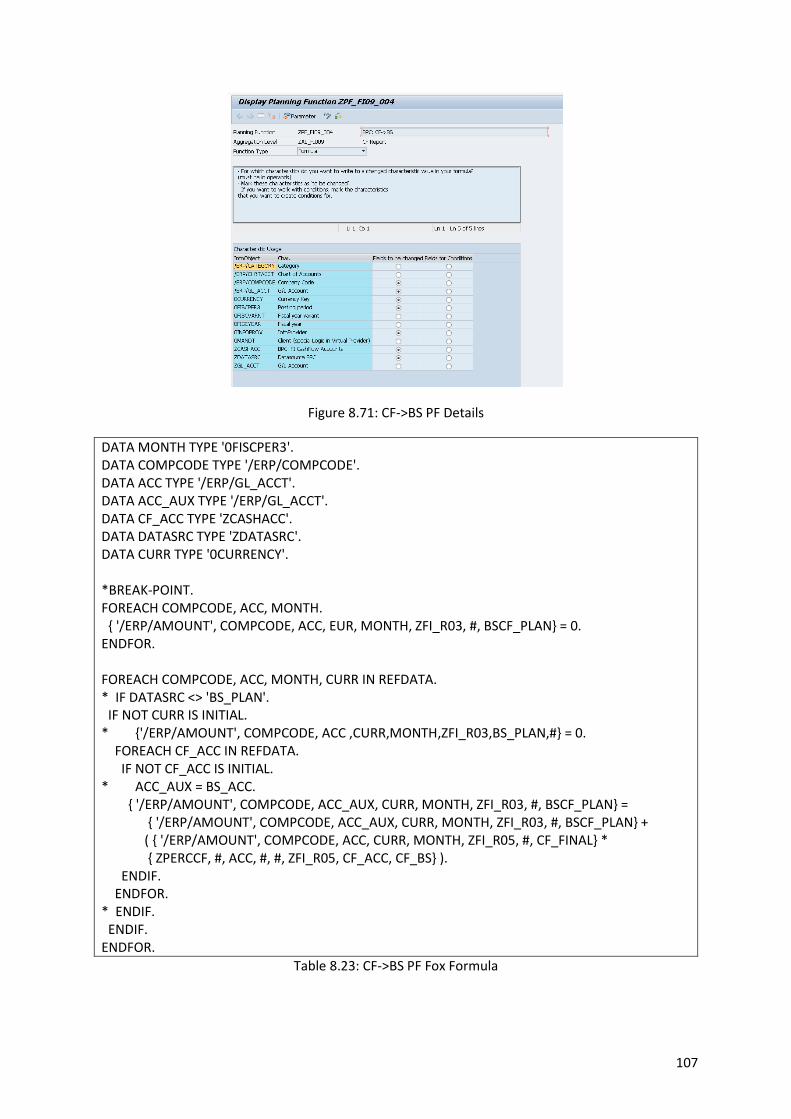
107
Figure 8.71: CF->BS PF Details
DATA MONTH TYPE '0FISCPER3'. DATA COMPCODE TYPE '/ERP/COMPCODE'. DATA ACC TYPE '/ERP/GL_ACCT'. DATA ACC_AUX TYPE '/ERP/GL_ACCT'. DATA CF_ACC TYPE 'ZCASHACC'. DATA DATASRC TYPE 'ZDATASRC'. DATA CURR TYPE '0CURRENCY'. *BREAK-POINT. FOREACH COMPCODE, ACC, MONTH. { '/ERP/AMOUNT', COMPCODE, ACC, EUR, MONTH, ZFI_R03, #, BSCF_PLAN} = 0. ENDFOR. FOREACH COMPCODE, ACC, MONTH, CURR IN REFDATA. * IF DATASRC <> 'BS_PLAN'. IF NOT CURR IS INITIAL. * {'/ERP/AMOUNT', COMPCODE, ACC ,CURR,MONTH,ZFI_R03,BS_PLAN,#} = 0. FOREACH CF_ACC IN REFDATA. IF NOT CF_ACC IS INITIAL. * ACC_AUX = BS_ACC. { '/ERP/AMOUNT', COMPCODE, ACC_AUX, CURR, MONTH, ZFI_R03, #, BSCF_PLAN} = { '/ERP/AMOUNT', COMPCODE, ACC_AUX, CURR, MONTH, ZFI_R03, #, BSCF_PLAN} + ( { '/ERP/AMOUNT', COMPCODE, ACC, CURR, MONTH, ZFI_R05, #, CF_FINAL} * { ZPERCCF, #, ACC, #, #, ZFI_R05, CF_ACC, CF_BS} ). ENDIF. ENDFOR. * ENDIF. ENDIF. ENDFOR.
Table 8.23: CF->BS PF Fox Formula
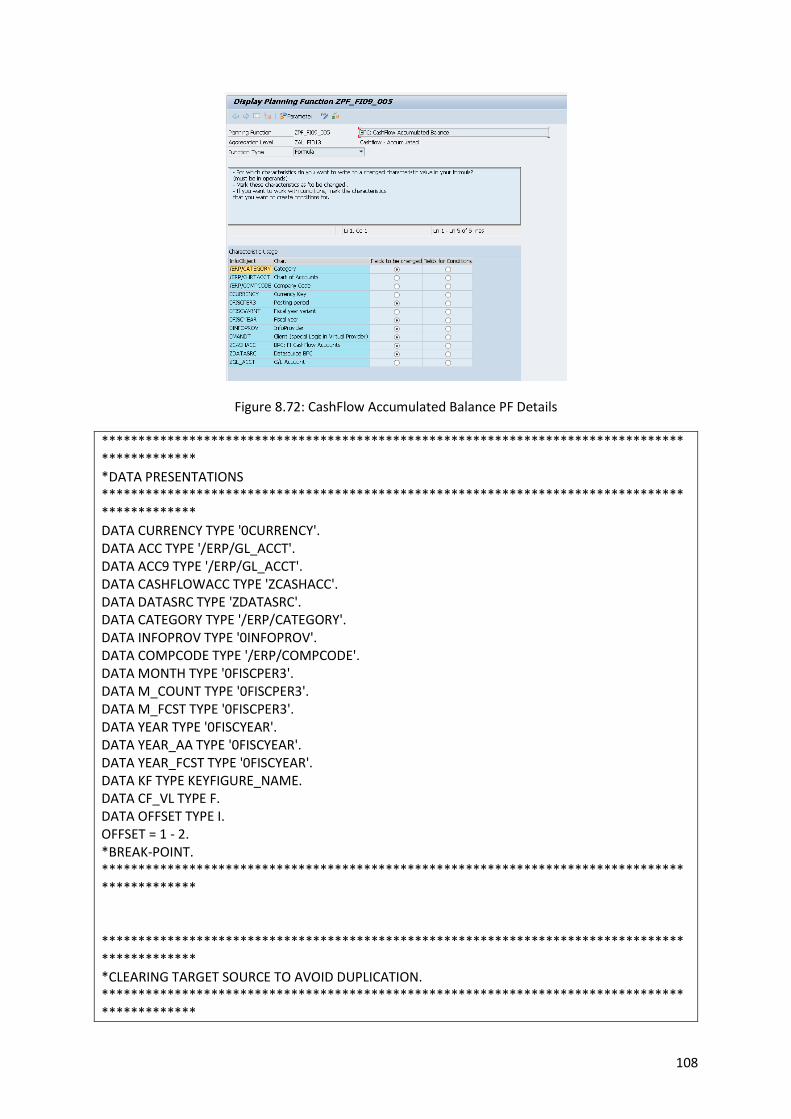
108
Figure 8.72: CashFlow Accumulated Balance PF Details
********************************************************************************************* *DATA PRESENTATIONS ********************************************************************************************* DATA CURRENCY TYPE '0CURRENCY'. DATA ACC TYPE '/ERP/GL_ACCT'. DATA ACC9 TYPE '/ERP/GL_ACCT'. DATA CASHFLOWACC TYPE 'ZCASHACC'. DATA DATASRC TYPE 'ZDATASRC'. DATA CATEGORY TYPE '/ERP/CATEGORY'. DATA INFOPROV TYPE '0INFOPROV'. DATA COMPCODE TYPE '/ERP/COMPCODE'. DATA MONTH TYPE '0FISCPER3'. DATA M_COUNT TYPE '0FISCPER3'. DATA M_FCST TYPE '0FISCPER3'. DATA YEAR TYPE '0FISCYEAR'. DATA YEAR_AA TYPE '0FISCYEAR'. DATA YEAR_FCST TYPE '0FISCYEAR'. DATA KF TYPE KEYFIGURE_NAME. DATA CF_VL TYPE F. DATA OFFSET TYPE I. OFFSET = 1 - 2. *BREAK-POINT. ********************************************************************************************* ********************************************************************************************* *CLEARING TARGET SOURCE TO AVOID DUPLICATION. *********************************************************************************************
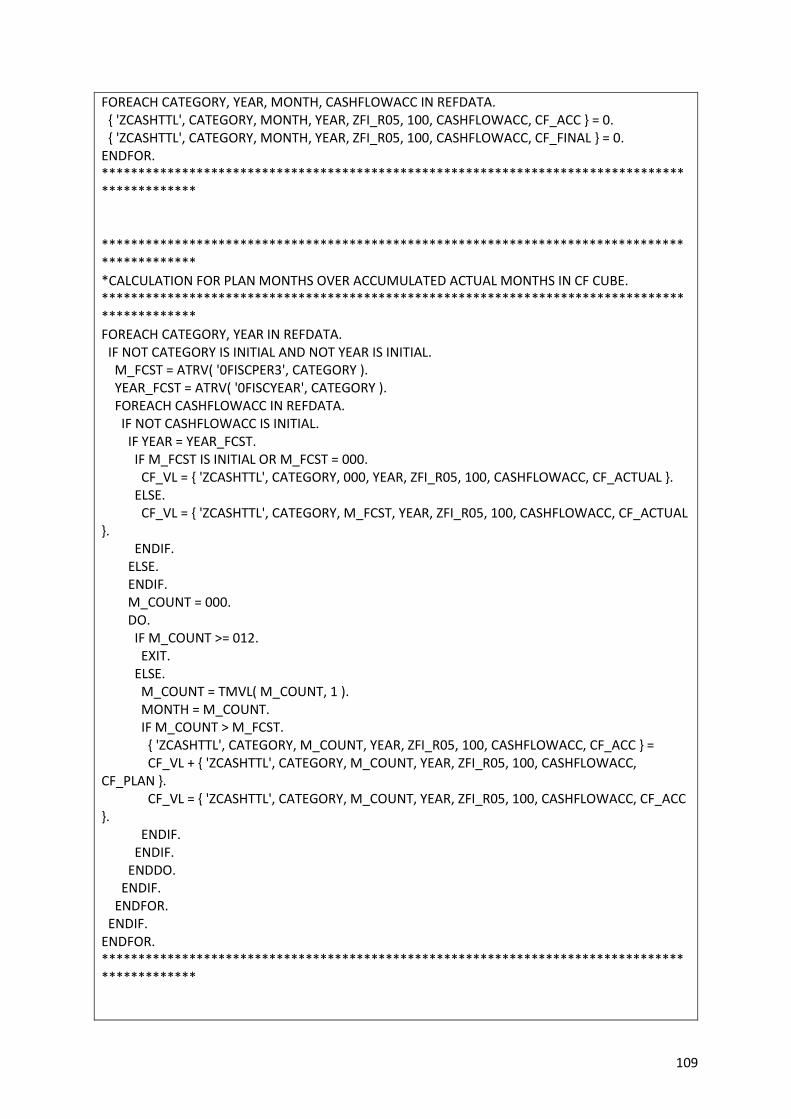
109
FOREACH CATEGORY, YEAR, MONTH, CASHFLOWACC IN REFDATA. { 'ZCASHTTL', CATEGORY, MONTH, YEAR, ZFI_R05, 100, CASHFLOWACC, CF_ACC } = 0. { 'ZCASHTTL', CATEGORY, MONTH, YEAR, ZFI_R05, 100, CASHFLOWACC, CF_FINAL } = 0. ENDFOR. ********************************************************************************************* ********************************************************************************************* *CALCULATION FOR PLAN MONTHS OVER ACCUMULATED ACTUAL MONTHS IN CF CUBE. ********************************************************************************************* FOREACH CATEGORY, YEAR IN REFDATA. IF NOT CATEGORY IS INITIAL AND NOT YEAR IS INITIAL. M_FCST = ATRV( '0FISCPER3', CATEGORY ). YEAR_FCST = ATRV( '0FISCYEAR', CATEGORY ). FOREACH CASHFLOWACC IN REFDATA. IF NOT CASHFLOWACC IS INITIAL. IF YEAR = YEAR_FCST. IF M_FCST IS INITIAL OR M_FCST = 000. CF_VL = { 'ZCASHTTL', CATEGORY, 000, YEAR, ZFI_R05, 100, CASHFLOWACC, CF_ACTUAL }. ELSE. CF_VL = { 'ZCASHTTL', CATEGORY, M_FCST, YEAR, ZFI_R05, 100, CASHFLOWACC, CF_ACTUAL }. ENDIF. ELSE. ENDIF. M_COUNT = 000. DO. IF M_COUNT >= 012. EXIT. ELSE. M_COUNT = TMVL( M_COUNT, 1 ). MONTH = M_COUNT. IF M_COUNT > M_FCST. { 'ZCASHTTL', CATEGORY, M_COUNT, YEAR, ZFI_R05, 100, CASHFLOWACC, CF_ACC } = CF_VL + { 'ZCASHTTL', CATEGORY, M_COUNT, YEAR, ZFI_R05, 100, CASHFLOWACC, CF_PLAN }. CF_VL = { 'ZCASHTTL', CATEGORY, M_COUNT, YEAR, ZFI_R05, 100, CASHFLOWACC, CF_ACC }. ENDIF. ENDIF. ENDDO. ENDIF. ENDFOR. ENDIF. ENDFOR. *********************************************************************************************
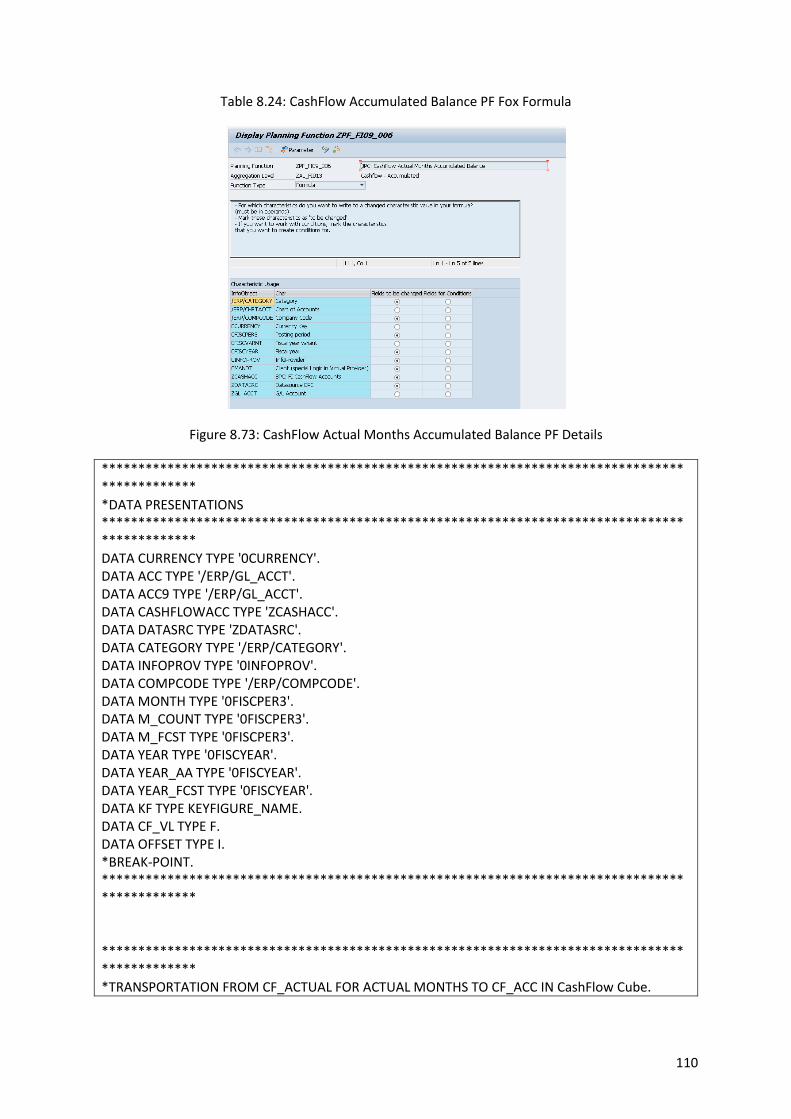
110
Table 8.24: CashFlow Accumulated Balance PF Fox Formula
Figure 8.73: CashFlow Actual Months Accumulated Balance PF Details
********************************************************************************************* *DATA PRESENTATIONS ********************************************************************************************* DATA CURRENCY TYPE '0CURRENCY'. DATA ACC TYPE '/ERP/GL_ACCT'. DATA ACC9 TYPE '/ERP/GL_ACCT'. DATA CASHFLOWACC TYPE 'ZCASHACC'. DATA DATASRC TYPE 'ZDATASRC'. DATA CATEGORY TYPE '/ERP/CATEGORY'. DATA INFOPROV TYPE '0INFOPROV'. DATA COMPCODE TYPE '/ERP/COMPCODE'. DATA MONTH TYPE '0FISCPER3'. DATA M_COUNT TYPE '0FISCPER3'. DATA M_FCST TYPE '0FISCPER3'. DATA YEAR TYPE '0FISCYEAR'. DATA YEAR_AA TYPE '0FISCYEAR'. DATA YEAR_FCST TYPE '0FISCYEAR'. DATA KF TYPE KEYFIGURE_NAME. DATA CF_VL TYPE F. DATA OFFSET TYPE I. *BREAK-POINT. ********************************************************************************************* ********************************************************************************************* *TRANSPORTATION FROM CF_ACTUAL FOR ACTUAL MONTHS TO CF_ACC IN CashFlow Cube.

111
********************************************************************************************* OFFSET = 1 - 2. M_COUNT = 000. FOREACH CATEGORY, YEAR IN REFDATA. IF NOT CATEGORY IS INITIAL AND NOT YEAR IS INITIAL. M_FCST = ATRV( '0FISCPER3', CATEGORY ). YEAR_FCST = ATRV( '0FISCYEAR', CATEGORY ). FOREACH CASHFLOWACC IN REFDATA. IF NOT CASHFLOWACC IS INITIAL. FOREACH COMPCODE IN REFDATA. FOREACH M_COUNT IN REFDATA. IF M_COUNT > M_FCST. EXIT. ELSE. MONTH = M_COUNT. { 'ZCASHTTL', CATEGORY, COMPCODE, M_COUNT, YEAR, ZFI_R05, 100, CASHFLOWACC, CF_ACC } = { 'ZCASHTTL', CATEGORY, COMPCODE, M_COUNT, YEAR, ZFI_R05, 100, CASHFLOWACC, CF_ACC } + { 'ZCASHTTL', CATEGORY, COMPCODE, M_COUNT, YEAR, ZFI_R05, 100, CASHFLOWACC, CF_ACTUAL }. M_COUNT = TMVL( M_COUNT, 1 ). ENDIF. ENDFOR. ENDFOR. ENDIF. ENDFOR. ENDIF. ENDFOR. *********************************************************************************************
Table 8.25: CashFlow Actual Months Accumulated Balance PF Fox Formula
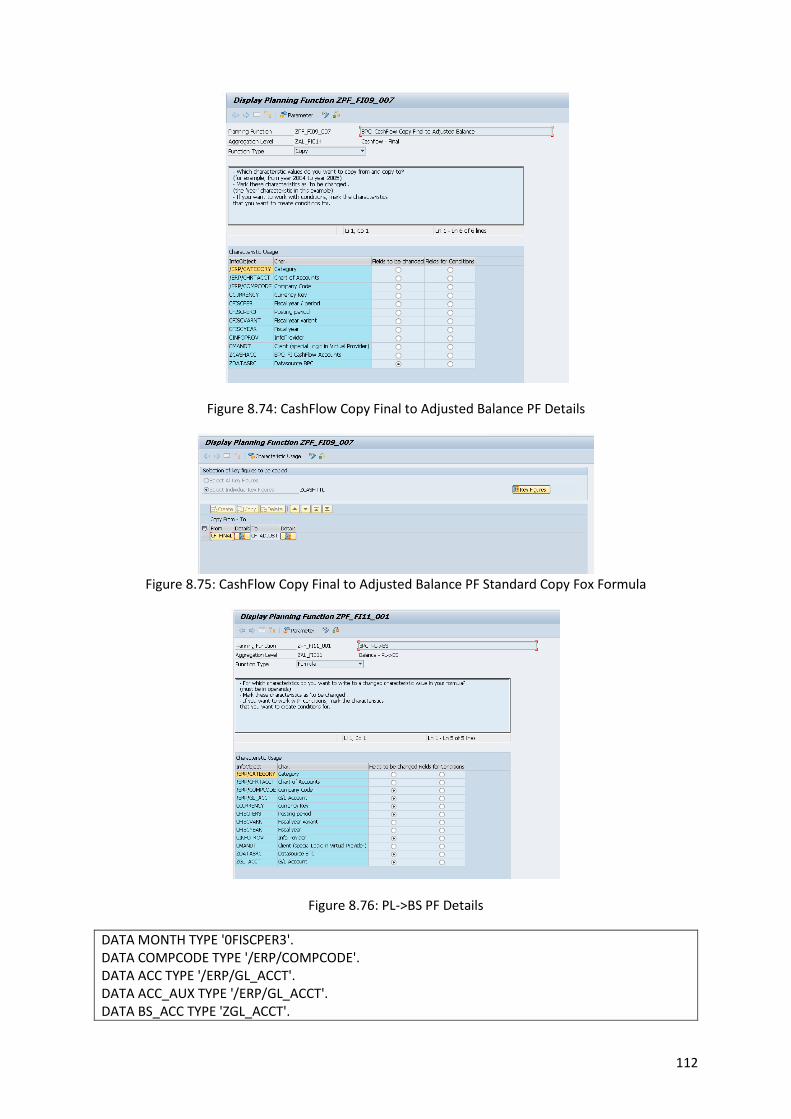
112
Figure 8.74: CashFlow Copy Final to Adjusted Balance PF Details
Figure 8.75: CashFlow Copy Final to Adjusted Balance PF Standard Copy Fox Formula
Figure 8.76: PL->BS PF Details
DATA MONTH TYPE '0FISCPER3'. DATA COMPCODE TYPE '/ERP/COMPCODE'. DATA ACC TYPE '/ERP/GL_ACCT'. DATA ACC_AUX TYPE '/ERP/GL_ACCT'. DATA BS_ACC TYPE 'ZGL_ACCT'.

113
DATA DATASRC TYPE 'ZDATASRC'. DATA CURR TYPE '0CURRENCY'. *BREAK-POINT. FOREACH COMPCODE, ACC, MONTH. { '/ERP/AMOUNT', COMPCODE, ACC, EUR, MONTH, ZFI_R03, BS_PLAN, # } = 0. ENDFOR. FOREACH COMPCODE, ACC, MONTH, DATASRC, CURR IN REFDATA. IF DATASRC <> 'BS_PLAN'. IF NOT CURR IS INITIAL. * {'/ERP/AMOUNT', COMPCODE, ACC ,CURR,MONTH,ZFI_R03,BS_PLAN,#} = 0. FOREACH BS_ACC IN REFDATA. IF NOT BS_ACC IS INITIAL. ACC_AUX = BS_ACC. { '/ERP/AMOUNT', COMPCODE, ACC_AUX, CURR, MONTH, ZFI_R03, BS_PLAN, # } = { '/ERP/AMOUNT', COMPCODE, ACC_AUX, CURR, MONTH, ZFI_R03, BS_PLAN, # } + ( { '/ERP/AMOUNT', COMPCODE, ACC, CURR, MONTH, ZFI_R02, DATASRC, # } * { ZPERCBS, #, ACC, #, #, ZFI_R03, PL_BS, BS_ACC } ). ENDIF. ENDFOR. ENDIF. ENDIF. ENDFOR.
Table 8.26: PL->BS PF Fox Formula
Figure 8.77: Accumulated Beginning Balance PF Details
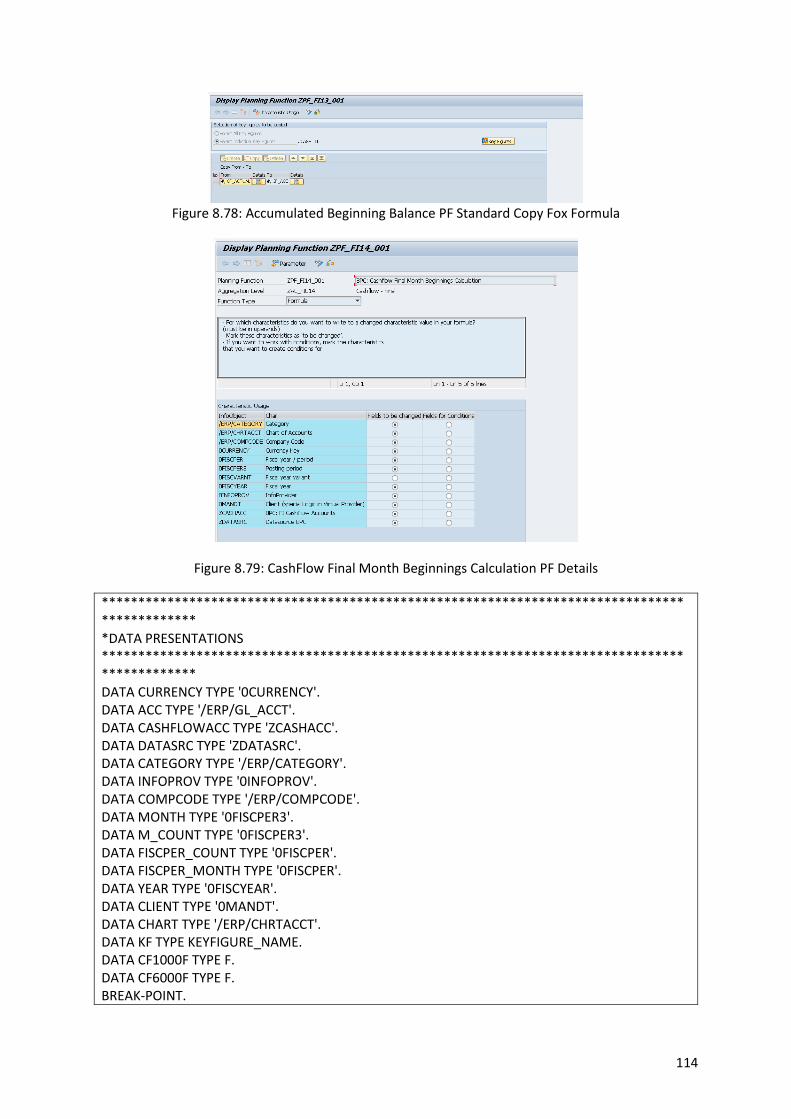
114
Figure 8.78: Accumulated Beginning Balance PF Standard Copy Fox Formula
Figure 8.79: CashFlow Final Month Beginnings Calculation PF Details
********************************************************************************************* *DATA PRESENTATIONS ********************************************************************************************* DATA CURRENCY TYPE '0CURRENCY'. DATA ACC TYPE '/ERP/GL_ACCT'. DATA CASHFLOWACC TYPE 'ZCASHACC'. DATA DATASRC TYPE 'ZDATASRC'. DATA CATEGORY TYPE '/ERP/CATEGORY'. DATA INFOPROV TYPE '0INFOPROV'. DATA COMPCODE TYPE '/ERP/COMPCODE'. DATA MONTH TYPE '0FISCPER3'. DATA M_COUNT TYPE '0FISCPER3'. DATA FISCPER_COUNT TYPE '0FISCPER'. DATA FISCPER_MONTH TYPE '0FISCPER'. DATA YEAR TYPE '0FISCYEAR'. DATA CLIENT TYPE '0MANDT'. DATA CHART TYPE '/ERP/CHRTACCT'. DATA KF TYPE KEYFIGURE_NAME. DATA CF1000F TYPE F. DATA CF6000F TYPE F. BREAK-POINT.

115
********************************************************************************************* ********************************************************************************************* *CLEARING TARGET SOURCE TO AVOID DUPLICATION. ********************************************************************************************* FOREACH CATEGORY, COMPCODE, CASHFLOWACC, MONTH, FISCPER_MONTH, YEAR IN REFDATA. { 'ZCASHTTL', CATEGORY, CCOA, COMPCODE, EUR, FISCPER_MONTH, MONTH, YEAR, ZFI_R05, 100, C_1000, CF_FINAL } = 0. ENDFOR. ********************************************************************************************* ********************************************************************************************* *TRANSPORTATION FROM CF_ACTUAL FOR ACTUAL MONTHS TO CF_ACC IN CashFlow Cube. ********************************************************************************************* FOREACH CATEGORY, COMPCODE, YEAR IN REFDATA. IF NOT YEAR IS INITIAL AND NOT COMPCODE IS INITIAL. FOREACH M_COUNT, FISCPER_COUNT IN REFDATA. * FOREACH MONTH, FISCPER_MONTH IN REFDATA. * FOREACH M_COUNT IN REFDATA. * CF1000F = { 'ZCASHTTL', CATEGORY, CCOA, COMPCODE, EUR, FISCPER, MONTH, YEAR, ZFI_R05, 100, C_1000, CF_FINAL }. * CF6000F = { 'ZCASHTTL', CATEGORY, CCOA, COMPCODE, EUR, FISCPER, M_COUNT, YEAR, ZFI_R05, 100, C_6000, CF_FINAL }. **************************************CALCULATIONS******************************************************* * M_COUNT = 000. * DO. IF M_COUNT >= 011. EXIT. ELSE. MONTH = TMVL( M_COUNT, 1 ). FISCPER_MONTH = TMVL( FISCPER_COUNT, 1 ). { 'ZCASHTTL', CATEGORY, CCOA, COMPCODE, EUR, FISCPER_MONTH, MONTH, YEAR, ZFI_R05, 100, C_1000, CF_FINAL } = { 'ZCASHTTL', CATEGORY, CCOA, COMPCODE, EUR, FISCPER_COUNT, M_COUNT, YEAR, ZFI_R05, 100, C_6000, CF_FINAL }. M_COUNT = TMVL( M_COUNT, 1 ). ENDIF. * ENDDO. * ENDFOR. **************************************CALCULATIONS*******************************************************
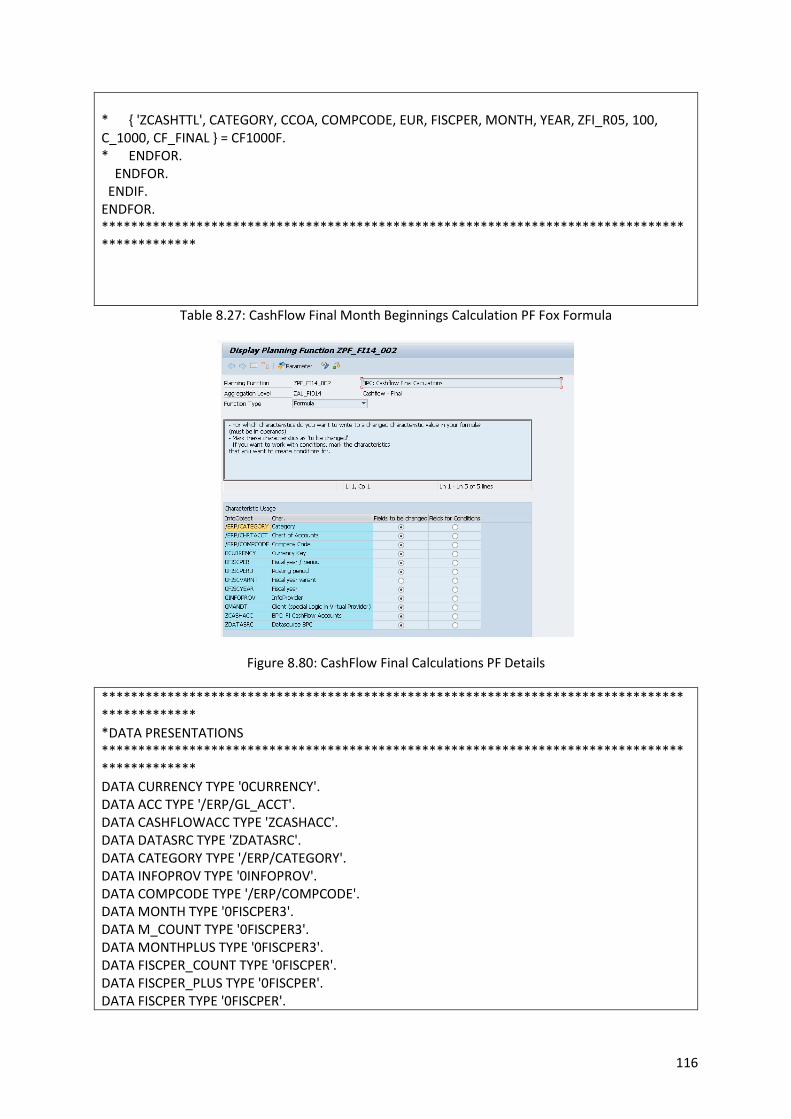
116
* { 'ZCASHTTL', CATEGORY, CCOA, COMPCODE, EUR, FISCPER, MONTH, YEAR, ZFI_R05, 100, C_1000, CF_FINAL } = CF1000F. * ENDFOR. ENDFOR. ENDIF. ENDFOR. *********************************************************************************************
Table 8.27: CashFlow Final Month Beginnings Calculation PF Fox Formula
Figure 8.80: CashFlow Final Calculations PF Details
********************************************************************************************* *DATA PRESENTATIONS ********************************************************************************************* DATA CURRENCY TYPE '0CURRENCY'. DATA ACC TYPE '/ERP/GL_ACCT'. DATA CASHFLOWACC TYPE 'ZCASHACC'. DATA DATASRC TYPE 'ZDATASRC'. DATA CATEGORY TYPE '/ERP/CATEGORY'. DATA INFOPROV TYPE '0INFOPROV'. DATA COMPCODE TYPE '/ERP/COMPCODE'. DATA MONTH TYPE '0FISCPER3'. DATA M_COUNT TYPE '0FISCPER3'. DATA MONTHPLUS TYPE '0FISCPER3'. DATA FISCPER_COUNT TYPE '0FISCPER'. DATA FISCPER_PLUS TYPE '0FISCPER'. DATA FISCPER TYPE '0FISCPER'.

117
DATA YEAR TYPE '0FISCYEAR'. DATA CLIENT TYPE '0MANDT'. DATA CHART TYPE '/ERP/CHRTACCT'. DATA KF TYPE KEYFIGURE_NAME. DATA CF2001A TYPE F. DATA CF2002A TYPE F. DATA CF2003A TYPE F. DATA CF2004A TYPE F. DATA CF2005A TYPE F. DATA CF3000A TYPE F. DATA CF3001A TYPE F. DATA CF3002A TYPE F. DATA CF3003A TYPE F. DATA CF3004A TYPE F. DATA CF3005A TYPE F. DATA CF3006A TYPE F. DATA CF3007A TYPE F. DATA CF3008A TYPE F. DATA CF4000A TYPE F. DATA CF1000F TYPE F. DATA CF2001F TYPE F. DATA CF2002F TYPE F. DATA CF2003F TYPE F. DATA CF2004F TYPE F. DATA CF2005F TYPE F. DATA CF3000F TYPE F. DATA CF3001F TYPE F. DATA CF3002F TYPE F. DATA CF3003F TYPE F. DATA CF3004F TYPE F. DATA CF3005F TYPE F. DATA CF3006F TYPE F. DATA CF3007F TYPE F. DATA CF3008F TYPE F. DATA CF4000F TYPE F. DATA CF5000F TYPE F. DATA CF6000F TYPE F. DATA ACCPDAYS TYPE F. DATA ACCRDAYS TYPE F. DATA ASMONTHS TYPE F. DATA ASMONTHSTOTAL TYPE F. *BREAK-POINT. ********************************************************************************************* ********************************************************************************************* *CLEARING TARGET SOURCE TO AVOID DUPLICATION. *********************************************************************************************
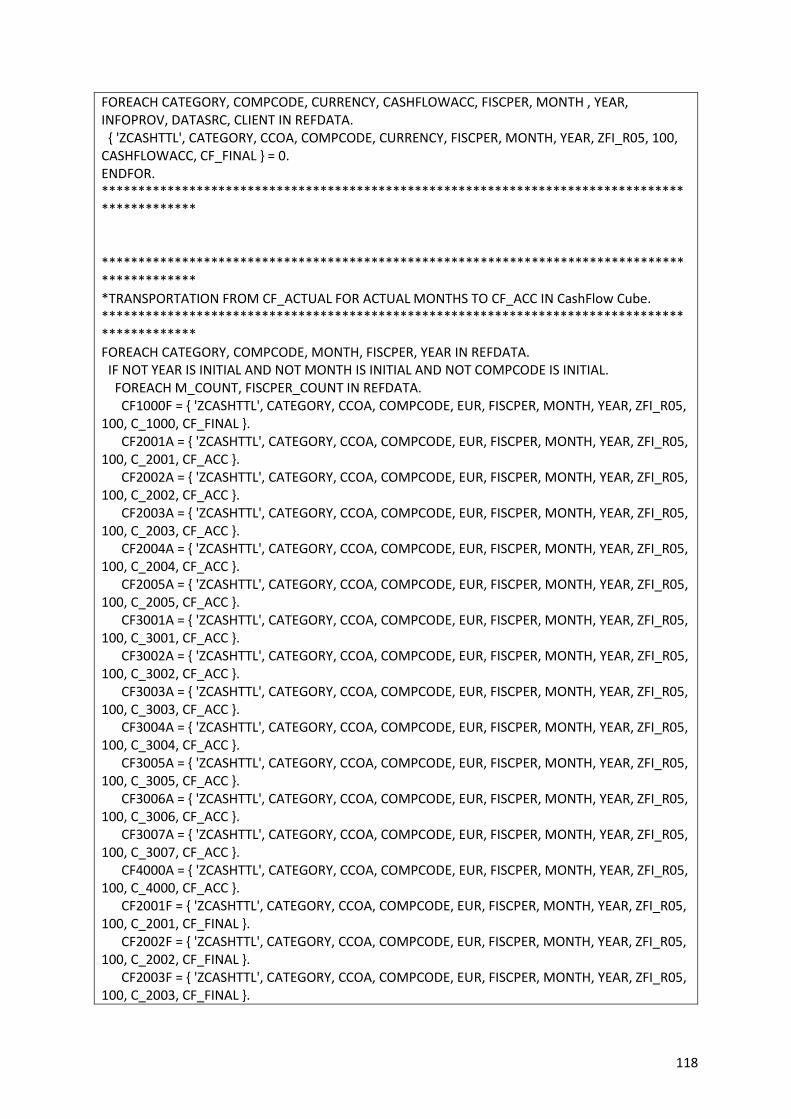
118
FOREACH CATEGORY, COMPCODE, CURRENCY, CASHFLOWACC, FISCPER, MONTH , YEAR, INFOPROV, DATASRC, CLIENT IN REFDATA. { 'ZCASHTTL', CATEGORY, CCOA, COMPCODE, CURRENCY, FISCPER, MONTH, YEAR, ZFI_R05, 100, CASHFLOWACC, CF_FINAL } = 0. ENDFOR. ********************************************************************************************* ********************************************************************************************* *TRANSPORTATION FROM CF_ACTUAL FOR ACTUAL MONTHS TO CF_ACC IN CashFlow Cube. ********************************************************************************************* FOREACH CATEGORY, COMPCODE, MONTH, FISCPER, YEAR IN REFDATA. IF NOT YEAR IS INITIAL AND NOT MONTH IS INITIAL AND NOT COMPCODE IS INITIAL. FOREACH M_COUNT, FISCPER_COUNT IN REFDATA. CF1000F = { 'ZCASHTTL', CATEGORY, CCOA, COMPCODE, EUR, FISCPER, MONTH, YEAR, ZFI_R05, 100, C_1000, CF_FINAL }. CF2001A = { 'ZCASHTTL', CATEGORY, CCOA, COMPCODE, EUR, FISCPER, MONTH, YEAR, ZFI_R05, 100, C_2001, CF_ACC }. CF2002A = { 'ZCASHTTL', CATEGORY, CCOA, COMPCODE, EUR, FISCPER, MONTH, YEAR, ZFI_R05, 100, C_2002, CF_ACC }. CF2003A = { 'ZCASHTTL', CATEGORY, CCOA, COMPCODE, EUR, FISCPER, MONTH, YEAR, ZFI_R05, 100, C_2003, CF_ACC }. CF2004A = { 'ZCASHTTL', CATEGORY, CCOA, COMPCODE, EUR, FISCPER, MONTH, YEAR, ZFI_R05, 100, C_2004, CF_ACC }. CF2005A = { 'ZCASHTTL', CATEGORY, CCOA, COMPCODE, EUR, FISCPER, MONTH, YEAR, ZFI_R05, 100, C_2005, CF_ACC }. CF3001A = { 'ZCASHTTL', CATEGORY, CCOA, COMPCODE, EUR, FISCPER, MONTH, YEAR, ZFI_R05, 100, C_3001, CF_ACC }. CF3002A = { 'ZCASHTTL', CATEGORY, CCOA, COMPCODE, EUR, FISCPER, MONTH, YEAR, ZFI_R05, 100, C_3002, CF_ACC }. CF3003A = { 'ZCASHTTL', CATEGORY, CCOA, COMPCODE, EUR, FISCPER, MONTH, YEAR, ZFI_R05, 100, C_3003, CF_ACC }. CF3004A = { 'ZCASHTTL', CATEGORY, CCOA, COMPCODE, EUR, FISCPER, MONTH, YEAR, ZFI_R05, 100, C_3004, CF_ACC }. CF3005A = { 'ZCASHTTL', CATEGORY, CCOA, COMPCODE, EUR, FISCPER, MONTH, YEAR, ZFI_R05, 100, C_3005, CF_ACC }. CF3006A = { 'ZCASHTTL', CATEGORY, CCOA, COMPCODE, EUR, FISCPER, MONTH, YEAR, ZFI_R05, 100, C_3006, CF_ACC }. CF3007A = { 'ZCASHTTL', CATEGORY, CCOA, COMPCODE, EUR, FISCPER, MONTH, YEAR, ZFI_R05, 100, C_3007, CF_ACC }. CF4000A = { 'ZCASHTTL', CATEGORY, CCOA, COMPCODE, EUR, FISCPER, MONTH, YEAR, ZFI_R05, 100, C_4000, CF_ACC }. CF2001F = { 'ZCASHTTL', CATEGORY, CCOA, COMPCODE, EUR, FISCPER, MONTH, YEAR, ZFI_R05, 100, C_2001, CF_FINAL }. CF2002F = { 'ZCASHTTL', CATEGORY, CCOA, COMPCODE, EUR, FISCPER, MONTH, YEAR, ZFI_R05, 100, C_2002, CF_FINAL }. CF2003F = { 'ZCASHTTL', CATEGORY, CCOA, COMPCODE, EUR, FISCPER, MONTH, YEAR, ZFI_R05, 100, C_2003, CF_FINAL }.
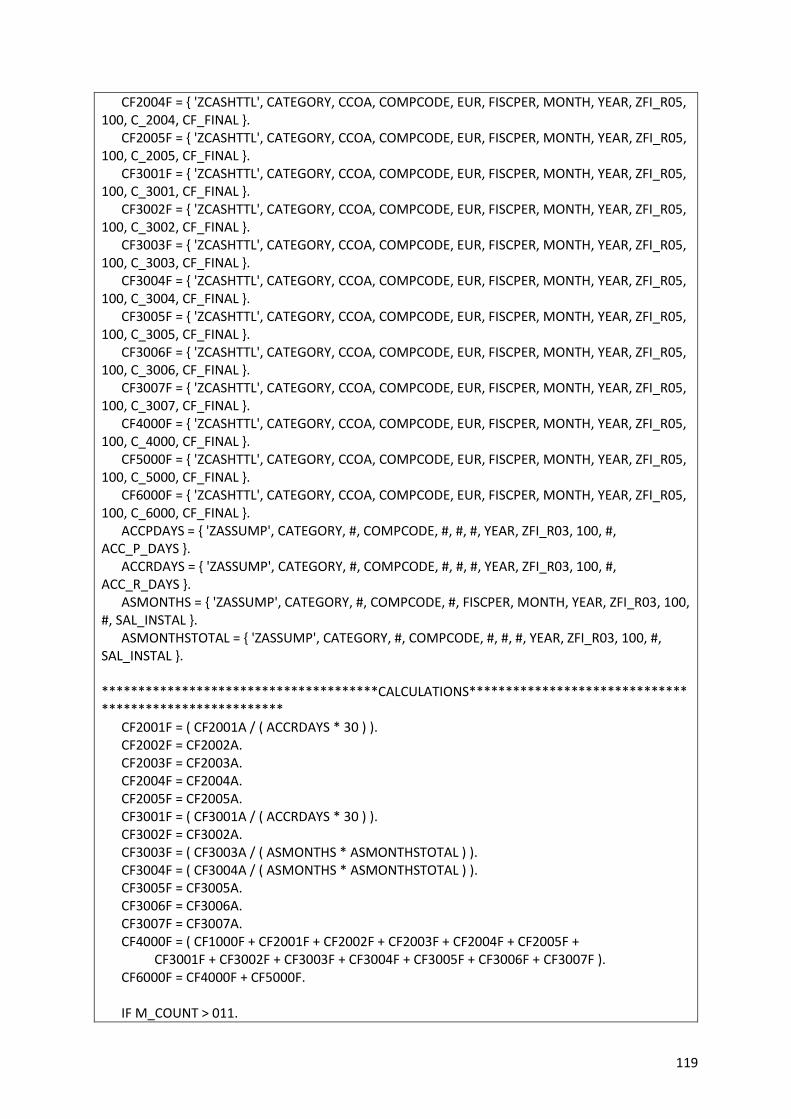
119
CF2004F = { 'ZCASHTTL', CATEGORY, CCOA, COMPCODE, EUR, FISCPER, MONTH, YEAR, ZFI_R05, 100, C_2004, CF_FINAL }. CF2005F = { 'ZCASHTTL', CATEGORY, CCOA, COMPCODE, EUR, FISCPER, MONTH, YEAR, ZFI_R05, 100, C_2005, CF_FINAL }. CF3001F = { 'ZCASHTTL', CATEGORY, CCOA, COMPCODE, EUR, FISCPER, MONTH, YEAR, ZFI_R05, 100, C_3001, CF_FINAL }. CF3002F = { 'ZCASHTTL', CATEGORY, CCOA, COMPCODE, EUR, FISCPER, MONTH, YEAR, ZFI_R05, 100, C_3002, CF_FINAL }. CF3003F = { 'ZCASHTTL', CATEGORY, CCOA, COMPCODE, EUR, FISCPER, MONTH, YEAR, ZFI_R05, 100, C_3003, CF_FINAL }. CF3004F = { 'ZCASHTTL', CATEGORY, CCOA, COMPCODE, EUR, FISCPER, MONTH, YEAR, ZFI_R05, 100, C_3004, CF_FINAL }. CF3005F = { 'ZCASHTTL', CATEGORY, CCOA, COMPCODE, EUR, FISCPER, MONTH, YEAR, ZFI_R05, 100, C_3005, CF_FINAL }. CF3006F = { 'ZCASHTTL', CATEGORY, CCOA, COMPCODE, EUR, FISCPER, MONTH, YEAR, ZFI_R05, 100, C_3006, CF_FINAL }. CF3007F = { 'ZCASHTTL', CATEGORY, CCOA, COMPCODE, EUR, FISCPER, MONTH, YEAR, ZFI_R05, 100, C_3007, CF_FINAL }. CF4000F = { 'ZCASHTTL', CATEGORY, CCOA, COMPCODE, EUR, FISCPER, MONTH, YEAR, ZFI_R05, 100, C_4000, CF_FINAL }. CF5000F = { 'ZCASHTTL', CATEGORY, CCOA, COMPCODE, EUR, FISCPER, MONTH, YEAR, ZFI_R05, 100, C_5000, CF_FINAL }. CF6000F = { 'ZCASHTTL', CATEGORY, CCOA, COMPCODE, EUR, FISCPER, MONTH, YEAR, ZFI_R05, 100, C_6000, CF_FINAL }. ACCPDAYS = { 'ZASSUMP', CATEGORY, #, COMPCODE, #, #, #, YEAR, ZFI_R03, 100, #, ACC_P_DAYS }. ACCRDAYS = { 'ZASSUMP', CATEGORY, #, COMPCODE, #, #, #, YEAR, ZFI_R03, 100, #, ACC_R_DAYS }. ASMONTHS = { 'ZASSUMP', CATEGORY, #, COMPCODE, #, FISCPER, MONTH, YEAR, ZFI_R03, 100, #, SAL_INSTAL }. ASMONTHSTOTAL = { 'ZASSUMP', CATEGORY, #, COMPCODE, #, #, #, YEAR, ZFI_R03, 100, #, SAL_INSTAL }. **************************************CALCULATIONS******************************************************* CF2001F = ( CF2001A / ( ACCRDAYS * 30 ) ). CF2002F = CF2002A. CF2003F = CF2003A. CF2004F = CF2004A. CF2005F = CF2005A. CF3001F = ( CF3001A / ( ACCRDAYS * 30 ) ). CF3002F = CF3002A. CF3003F = ( CF3003A / ( ASMONTHS * ASMONTHSTOTAL ) ). CF3004F = ( CF3004A / ( ASMONTHS * ASMONTHSTOTAL ) ). CF3005F = CF3005A. CF3006F = CF3006A. CF3007F = CF3007A. CF4000F = ( CF1000F + CF2001F + CF2002F + CF2003F + CF2004F + CF2005F + CF3001F + CF3002F + CF3003F + CF3004F + CF3005F + CF3006F + CF3007F ). CF6000F = CF4000F + CF5000F. IF M_COUNT > 011.
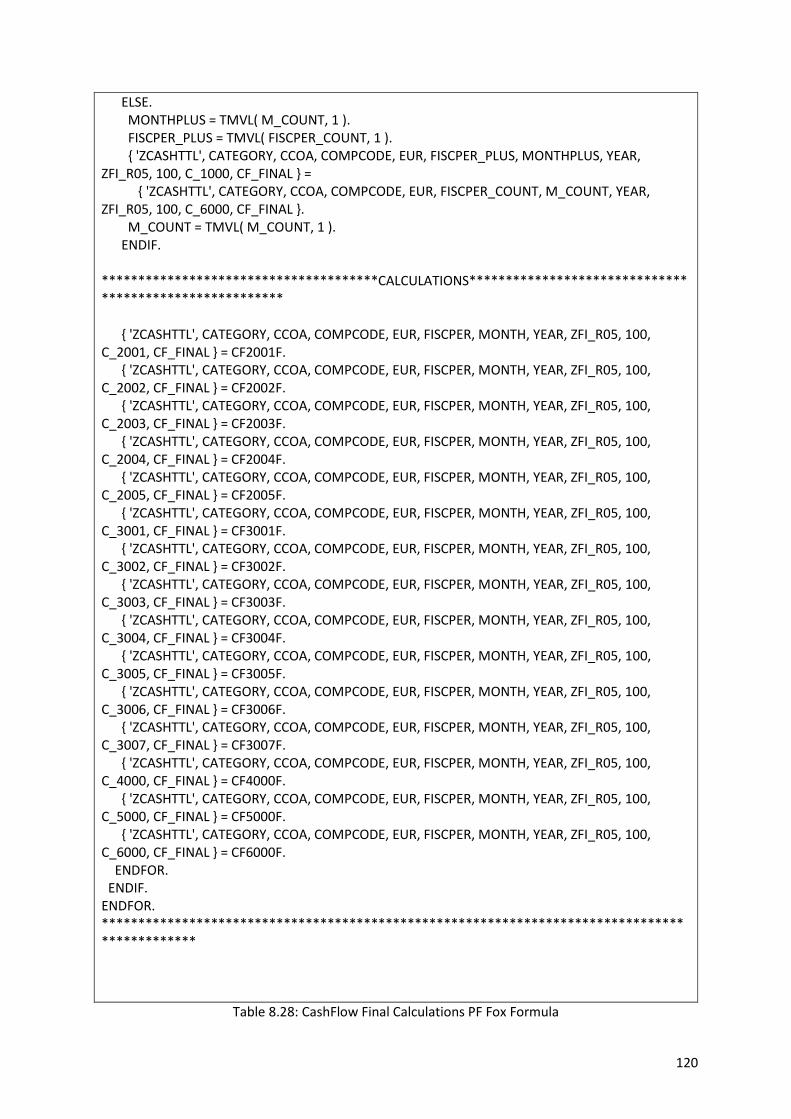
120
ELSE. MONTHPLUS = TMVL( M_COUNT, 1 ). FISCPER_PLUS = TMVL( FISCPER_COUNT, 1 ). { 'ZCASHTTL', CATEGORY, CCOA, COMPCODE, EUR, FISCPER_PLUS, MONTHPLUS, YEAR, ZFI_R05, 100, C_1000, CF_FINAL } = { 'ZCASHTTL', CATEGORY, CCOA, COMPCODE, EUR, FISCPER_COUNT, M_COUNT, YEAR, ZFI_R05, 100, C_6000, CF_FINAL }. M_COUNT = TMVL( M_COUNT, 1 ). ENDIF. **************************************CALCULATIONS******************************************************* { 'ZCASHTTL', CATEGORY, CCOA, COMPCODE, EUR, FISCPER, MONTH, YEAR, ZFI_R05, 100, C_2001, CF_FINAL } = CF2001F. { 'ZCASHTTL', CATEGORY, CCOA, COMPCODE, EUR, FISCPER, MONTH, YEAR, ZFI_R05, 100, C_2002, CF_FINAL } = CF2002F. { 'ZCASHTTL', CATEGORY, CCOA, COMPCODE, EUR, FISCPER, MONTH, YEAR, ZFI_R05, 100, C_2003, CF_FINAL } = CF2003F. { 'ZCASHTTL', CATEGORY, CCOA, COMPCODE, EUR, FISCPER, MONTH, YEAR, ZFI_R05, 100, C_2004, CF_FINAL } = CF2004F. { 'ZCASHTTL', CATEGORY, CCOA, COMPCODE, EUR, FISCPER, MONTH, YEAR, ZFI_R05, 100, C_2005, CF_FINAL } = CF2005F. { 'ZCASHTTL', CATEGORY, CCOA, COMPCODE, EUR, FISCPER, MONTH, YEAR, ZFI_R05, 100, C_3001, CF_FINAL } = CF3001F. { 'ZCASHTTL', CATEGORY, CCOA, COMPCODE, EUR, FISCPER, MONTH, YEAR, ZFI_R05, 100, C_3002, CF_FINAL } = CF3002F. { 'ZCASHTTL', CATEGORY, CCOA, COMPCODE, EUR, FISCPER, MONTH, YEAR, ZFI_R05, 100, C_3003, CF_FINAL } = CF3003F. { 'ZCASHTTL', CATEGORY, CCOA, COMPCODE, EUR, FISCPER, MONTH, YEAR, ZFI_R05, 100, C_3004, CF_FINAL } = CF3004F. { 'ZCASHTTL', CATEGORY, CCOA, COMPCODE, EUR, FISCPER, MONTH, YEAR, ZFI_R05, 100, C_3005, CF_FINAL } = CF3005F. { 'ZCASHTTL', CATEGORY, CCOA, COMPCODE, EUR, FISCPER, MONTH, YEAR, ZFI_R05, 100, C_3006, CF_FINAL } = CF3006F. { 'ZCASHTTL', CATEGORY, CCOA, COMPCODE, EUR, FISCPER, MONTH, YEAR, ZFI_R05, 100, C_3007, CF_FINAL } = CF3007F. { 'ZCASHTTL', CATEGORY, CCOA, COMPCODE, EUR, FISCPER, MONTH, YEAR, ZFI_R05, 100, C_4000, CF_FINAL } = CF4000F. { 'ZCASHTTL', CATEGORY, CCOA, COMPCODE, EUR, FISCPER, MONTH, YEAR, ZFI_R05, 100, C_5000, CF_FINAL } = CF5000F. { 'ZCASHTTL', CATEGORY, CCOA, COMPCODE, EUR, FISCPER, MONTH, YEAR, ZFI_R05, 100, C_6000, CF_FINAL } = CF6000F. ENDFOR. ENDIF. ENDFOR. *********************************************************************************************
Table 8.28: CashFlow Final Calculations PF Fox Formula

121
Table 8.29: Cash Flow Adjusted Calculations PS
Figure 8.81: CashFlow Adjusted Calculations PF Details
********************************************************************************************* *DATA PRESENTATIONS ********************************************************************************************* DATA CURRENCY TYPE '0CURRENCY'. DATA ACC TYPE '/ERP/GL_ACCT'. DATA CASHFLOWACC TYPE 'ZCASHACC'. DATA DATASRC TYPE 'ZDATASRC'. DATA CATEGORY TYPE '/ERP/CATEGORY'. DATA INFOPROV TYPE '0INFOPROV'. DATA COMPCODE TYPE '/ERP/COMPCODE'. DATA MONTH TYPE '0FISCPER3'. DATA M_COUNT TYPE '0FISCPER3'. DATA MONTHPLUS TYPE '0FISCPER3'. DATA FISCPER_COUNT TYPE '0FISCPER'. DATA FISCPER_PLUS TYPE '0FISCPER'. DATA FISCPER TYPE '0FISCPER'. DATA YEAR TYPE '0FISCYEAR'. DATA CLIENT TYPE '0MANDT'. DATA CHART TYPE '/ERP/CHRTACCT'. DATA KF TYPE KEYFIGURE_NAME. DATA CF2001A TYPE F. DATA CF2002A TYPE F. DATA CF2003A TYPE F. DATA CF2004A TYPE F. DATA CF2005A TYPE F.
Planning Sequence ID Planning Sequence Desc DP ID DP Desc Filter ID Filter Desc Function ID Function Desc
ZAL_FI099 BPC: Active/Deactive Data Slice ZF_FI_99 BPC: Active/Deactive DataSlice ZPF_FI99_001 BPC: Deactive DataSlice ZFI_R01
ZAL_FI003 Non-Production - Cost to Profit by month ZF_FI_02 Filter to Intercompany Recharges ZPF_FI03_001 BPC: Intercompany Recharge
ZAL_FI099 BPC: Active/Deactive Data Slice ZF_FI_99 BPC: Active/Deactive DataSlice ZPF_FI99_002 BPC: Active DataSlice ZFI_R01
ZAL_FI099 BPC: Active/Deactive Data Slice ZF_FI_99 BPC: Active/Deactive DataSlice ZPF_FI99_001 BPC: Deactive DataSlice ZFI_R01
ZAL_FI003 Non-Production - Cost to Profit by month ZF_FI_03 Filter to Copy Actual to 9* accounts ZPF_FI03_002 BPC: Copy Actual to 9* accounts
ZAL_FI003 Non-Production - Cost to Profit by month ZF_FI_38 Filter to Copy Actual to 9* accounts (Accounts 900000000*) ZPF_FI03_011 BPC: Copy Actual to 9* accounts (Accounts 900000000*)
ZAL_FI099 BPC: Active/Deactive Data Slice ZF_FI_99 BPC: Active/Deactive DataSlice ZPF_FI99_002 BPC: Active DataSlice ZFI_R01
ZAL_FI099 BPC: Active/Deactive Data Slice ZF_FI_99 BPC: Active/Deactive DataSlice ZPF_FI99_001 BPC: Deactive DataSlice ZFI_R01
ZAL_FI003 Non-Production - Cost to Profit by month ZF_FI_05 BPC: Monthly Distribution - Actual Data - CostCenter ZPF_FI03_006 BPC: Monthly Distribution - Actual Data
ZAL_FI003 Non-Production - Cost to Profit by month ZF_FI_04 BPC: Monthly Distribution - CostCenter ZPF_FI03_003 BPC: Monthly Distribution
ZAL_FI099 BPC: Active/Deactive Data Slice ZF_FI_99 BPC: Active/Deactive DataSlice ZPF_FI99_002 BPC: Active DataSlice ZFI_R01
ZAL_FI099 BPC: Active/Deactive Data Slice ZF_FI_99 BPC: Active/Deactive DataSlice ZPF_FI99_001 BPC: Deactive DataSlice ZFI_R01
ZAL_FI003 Non-Production - Cost to Profit by month ZF_FI_04 BPC: Monthly Distribution - CostCenter ZPF_FI03_007 BPC: Year Aggregation
ZAL_FI099 BPC: Active/Deactive Data Slice ZF_FI_99 BPC: Active/Deactive DataSlice ZPF_FI99_002 BPC: Active DataSlice ZFI_R01
ZAL_FI099 BPC: Active/Deactive Data Slice ZF_FI_99 BPC: Active/Deactive DataSlice ZPF_FI99_001 BPC: Deactive DataSlice ZFI_R01
ZAL_FI003 Non-Production - Cost to Profit by month ZF_FI_06 BPC: Monthly Distribution Year+1 - CostCenter ZPF_FI03_003 BPC: Monthly Distribution
ZAL_FI099 BPC: Active/Deactive Data Slice ZF_FI_99 BPC: Active/Deactive DataSlice ZPF_FI99_002 BPC: Active DataSlice ZFI_R01
ZAL_FI099 BPC: Active/Deactive Data Slice ZF_FI_99 BPC: Active/Deactive DataSlice ZPF_FI99_001 BPC: Deactive DataSlice ZFI_R01
ZAL_FI003 Non-Production - Cost to Profit by month ZF_FI_06 BPC: Monthly Distribution Year+1 - CostCenter ZPF_FI03_007 BPC: Year Aggregation
ZAL_FI099 BPC: Active/Deactive Data Slice ZF_FI_99 BPC: Active/Deactive DataSlice ZPF_FI99_002 BPC: Active DataSlice ZFI_R01
ZAL_FI099 BPC: Active/Deactive Data Slice ZF_FI_99 BPC: Active/Deactive DataSlice ZPF_FI99_001 BPC: Deactive DataSlice ZFI_R01
ZAL_FI003 Non-Production - Cost to Profit by month ZF_FI_08 BPC: Monthly Distribution - Actual Data - ProfitCenter ZPF_FI03_006 BPC: Monthly Distribution - Actual Data
ZAL_FI003 Non-Production - Cost to Profit by month ZF_FI_07 BPC: Monthly Distribution - ProfitCenter ZPF_FI03_003 BPC: Monthly Distribution
ZAL_FI099 BPC: Active/Deactive Data Slice ZF_FI_99 BPC: Active/Deactive DataSlice ZPF_FI99_002 BPC: Active DataSlice ZFI_R01
ZAL_FI099 BPC: Active/Deactive Data Slice ZF_FI_99 BPC: Active/Deactive DataSlice ZPF_FI99_001 BPC: Deactive DataSlice ZFI_R01
ZAL_FI003 Non-Production - Cost to Profit by month ZF_FI_07 BPC: Monthly Distribution - ProfitCenter ZPF_FI03_007 BPC: Year Aggregation
ZAL_FI099 BPC: Active/Deactive Data Slice ZF_FI_99 BPC: Active/Deactive DataSlice ZPF_FI99_002 BPC: Active DataSlice ZFI_R01
ZAL_FI099 BPC: Active/Deactive Data Slice ZF_FI_99 BPC: Active/Deactive DataSlice ZPF_FI99_001 BPC: Deactive DataSlice ZFI_R01
ZAL_FI003 Non-Production - Cost to Profit by month ZF_FI_09 BPC: Monthly Distribution Year+1 - ProfitCenter ZPF_FI03_003 BPC: Monthly Distribution
ZAL_FI099 BPC: Active/Deactive Data Slice ZF_FI_99 BPC: Active/Deactive DataSlice ZPF_FI99_002 BPC: Active DataSlice ZFI_R01
ZAL_FI099 BPC: Active/Deactive Data Slice ZF_FI_99 BPC: Active/Deactive DataSlice ZPF_FI99_001 BPC: Deactive DataSlice ZFI_R01
ZAL_FI003 Non-Production - Cost to Profit by month ZF_FI_09 BPC: Monthly Distribution Year+1 - ProfitCenter ZPF_FI03_007 BPC: Year Aggregation
ZAL_FI099 BPC: Active/Deactive Data Slice ZF_FI_99 BPC: Active/Deactive DataSlice ZPF_FI99_002 BPC: Active DataSlice ZFI_R01
ZAL_FI099 BPC: Active/Deactive Data Slice ZF_FI_99 BPC: Active/Deactive DataSlice ZPF_FI99_001 BPC: Deactive DataSlice ZFI_R01
ZAL_FI003 Non-Production - Cost to Profit by month ZF_FI_39 BPC: Monthly Distribution - Actual Data - Costcenter (All) ZPF_FI03_006 BPC: Monthly Distribution - Actual Data
ZAL_FI003 Non-Production - Cost to Profit by month ZF_FI_40 BPC: Monthly Distribution - Actual Data - ProfitCenter (All) ZPF_FI03_006 BPC: Monthly Distribution - Actual Data
ZAL_FI099 BPC: Active/Deactive Data Slice ZF_FI_99 BPC: Active/Deactive DataSlice ZPF_FI99_002 BPC: Active DataSlice ZFI_R01
ZAL_FI099 BPC: Active/Deactive Data Slice ZF_FI_99 BPC: Active/Deactive DataSlice ZPF_FI99_001 BPC: Deactive DataSlice ZFI_R01
ZAL_FI003 Non-Production - Cost to Profit by month ZF_FI_41 Filter to Copy Actual to 9* accounts (All Companies) ZPF_FI03_002 BPC: Copy Actual to 9* accounts
ZAL_FI003 Non-Production - Cost to Profit by month ZF_FI_42 Filter to Copy Actual to 9* (Accounts 900000000*)(All) ZPF_FI03_011 BPC: Copy Actual to 9* accounts (Accounts 900000000*)
ZAL_FI099 BPC: Active/Deactive Data Slice ZF_FI_99 BPC: Active/Deactive DataSlice ZPF_FI99_002 BPC: Active DataSlice ZFI_R01
ZAL_FI099 BPC: Active/Deactive Data Slice ZF_FI_99 BPC: Active/Deactive DataSlice ZPF_FI99_003 BPC: Deactive DataSlice ZFI_R02
ZAL_FI004 P&L - Integration BPC and ERP ZF_FI_10 BPC: P&L - WBS integration ZPF_FI04_001 BPC: P&L WBS Integration - Plan Data
ZAL_FI004 P&L - Integration BPC and ERP ZF_FI_11 BPC: P&L - WBS integration - Actual ZPF_FI04_002 BPC: P&L WBS Integration - Actual Data
ZAL_FI004 P&L - Integration BPC and ERP ZF_FI_12 BPC: P&L - Cost and Profit Center Integration ZPF_FI04_003 BPC: P&L Cost and Profit Center Integration
ZAL_FI004 P&L - Integration BPC and ERP ZF_FI_14 BPC: P&L - Cost and Profit Center Integration - Trend Years ZPF_FI04_003 BPC: P&L Cost and Profit Center Integration
ZAL_FI004 P&L - Integration BPC and ERP ZF_FI_15 BPC: P&L - Cost and Profit Center Integration - Actual ZPF_FI04_003 BPC: P&L Cost and Profit Center Integration
ZAL_FI004 P&L - Integration BPC and ERP ZF_FI_32 BPC: P&L - HR Integration Variable Year ZPF_FI04_004 BPC: P&L HR Integration Variable Year
ZAL_FI004 P&L - Integration BPC and ERP ZF_FI_31 BPC: P&L - HR Integration for Plan Years ZPF_FI04_007 BPC: P&L HR Integration Plan Years
ZAL_FI099 BPC: Active/Deactive Data Slice ZF_FI_99 BPC: Active/Deactive DataSlice ZPF_FI99_004 BPC: Active DataSlice ZFI_R02
ZAL_FI099 BPC: Active/Deactive Data Slice ZF_FI_99 BPC: Active/Deactive DataSlice ZPF_FI99_003 BPC: Deactive DataSlice ZFI_R02
ZAL_FI004 P&L - Integration BPC and ERP ZF_FI_10 BPC: P&L - WBS integration ZPF_FI04_001 BPC: P&L WBS Integration - Plan Data
ZAL_FI004 P&L - Integration BPC and ERP ZF_FI_11 BPC: P&L - WBS integration - Actual ZPF_FI04_002 BPC: P&L WBS Integration - Actual Data
ZAL_FI099 BPC: Active/Deactive Data Slice ZF_FI_99 BPC: Active/Deactive DataSlice ZPF_FI99_004 BPC: Active DataSlice ZFI_R02
ZAL_FI099 BPC: Active/Deactive Data Slice ZF_FI_99 BPC: Active/Deactive DataSlice ZPF_FI99_003 BPC: Deactive DataSlice ZFI_R02
ZAL_FI004 P&L - Integration BPC and ERP ZF_FI_12 BPC: P&L - Cost and Profit Center Integration ZPF_FI04_003 BPC: P&L Cost and Profit Center Integration
ZAL_FI004 P&L - Integration BPC and ERP ZF_FI_14 BPC: P&L - Cost and Profit Center Integration - Trend Years ZPF_FI04_003 BPC: P&L Cost and Profit Center Integration
ZAL_FI004 P&L - Integration BPC and ERP ZF_FI_15 BPC: P&L - Cost and Profit Center Integration - Actual ZPF_FI04_003 BPC: P&L Cost and Profit Center Integration
ZAL_FI099 BPC: Active/Deactive Data Slice ZF_FI_99 BPC: Active/Deactive DataSlice ZPF_FI99_004 BPC: Active DataSlice ZFI_R02
ZAL_FI099 BPC: Active/Deactive Data Slice ZF_FI_99 BPC: Active/Deactive DataSlice ZPF_FI99_003 BPC: Deactive DataSlice ZFI_R02
ZAL_FI004 P&L - Integration BPC and ERP ZF_FI_32 BPC: P&L - HR Integration Variable Year ZPF_FI04_004 BPC: P&L HR Integration Variable Year
ZAL_FI004 P&L - Integration BPC and ERP ZF_FI_31 BPC: P&L - HR Integration for Plan Years ZPF_FI04_007 BPC: P&L HR Integration Plan Years
ZAL_FI099 BPC: Active/Deactive Data Slice ZF_FI_99 BPC: Active/Deactive DataSlice ZPF_FI99_004 BPC: Active DataSlice ZFI_R02
ZAL_FI099 BPC: Active/Deactive Data Slice ZF_FI_99 BPC: Active/Deactive DataSlice ZPF_FI99_003 BPC: Deactive DataSlice ZFI_R02
ZAL_FI005 P&L Input Data ZF_FI_16 BPC: P&L - Cost and Profit Center Integration - Trend Years ZPF_FI04_006 BPC: P&L Copy to adjusted
ZAL_FI099 BPC: Active/Deactive Data Slice ZF_FI_99 BPC: Active/Deactive DataSlice ZPF_FI99_004 BPC: Active DataSlice ZFI_R02
ZAL_FI009 CF Report ZF_FI_25 BPC: Cashflow Actuals Transformation Filter TEST ZPF_FI09_002 BPC: P&L to CashFlow Actual Months Accumulated
ZAL_FI009 CF Report ZF_FI_18 BPC: Cashflow Tranformation Filter ZPF_FI09_001 BPC: P&L to CashFlow Planned
ZAL_FI013 Cashflow - Accumulated ZF_FI_19 BPC: Cashflow Accumulation Filter ZPF_FI09_005 BPC: CashFlow Accumulated Balance
ZAL_FI013 Cashflow - Accumulated ZF_FI_19 BPC: Cashflow Accumulation Filter ZPF_FI09_006 BPC: CashFlow Actual Months Accumulated Balance
ZAL_FI015 Cashfow - Calculation Assumptions ZF_FI_22 BPC: Cashflow Assumption Calculations ZPF_FI15_003 BPC: Installments Summation
ZAL_FI014 Cashflow - Final ZF_FI_21 BPC: Cashflow Final Calculations ZPF_FI14_002 BPC: Cashflow Final Calculations
ZAL_FI014 Cashflow - Final ZF_FI_27 BPC: CF Copy Final to Adjust ZPF_FI09_007 BPC: CashFlow Copy Final to Adjusted Balance
ZAL_FI011 Balance - PL->BS ZF_BS_01 BPC: PL->Balance ZPF_FI11_001 BPC: PL->BS
ZAL_FI009 CF Report ZF_FI_30 BPC: Balance SheetTransformation Filter ZPF_FI09_004 BPC: CF->BS
ZAL_FI012 Balance - Accumulated ZF_BS_02 BPC: BS Accumulated ZPF_FI12_001 BPC: Accumulated Balance
ZPS_FI09_002 BPC: Cash Flow Adjusted Calculations ZAL_FI014 Cashflow - Final ZF_FI_29 BPC: Cashflow Adjusted Final Calculations ZPF_FI14_003 BPC: Cashflow Adjusted Final Calculations
ZAL_HR099BPC: FTE Active/Deactivate Data Slice ZF_HR_99BPC: Active/Deactive FTE DataSlice ZPF_HR99_001BPC: Deactivate FTE DataSlice ZHR_R02
ZAL_HR004BPC: FTE Percentage Planning Input ZF_HR_03BPC: FTE Copy Filter ZPF_HR01_002BPC: HR FTE Input Year Copy
ZAL_HR003BPC: Salary by Month Planning Sequences ZF_HR_06BPC: HR Salary Month Distribution ZPF_HR01_003BPC: Salary Input Year to Month Distribution
ZAL_HR005BPC: Salary Percentage Increase Planning SequencesZF_HR_05BPC: HR Percentage Increase ZPF_HR01_004BPC: HR Salary Increase Function
ZAL_HR099BPC: FTE Active/Deactivate Data Slice ZF_HR_99BPC: Active/Deactive FTE DataSlice ZPF_HR99_001BPC: Deactivate FTE DataSlice ZHR_R02
ZAL_HR006BPC: FTE Percentage Planning Sequence 1 ZF_HR_07BPC: HR FTE Planning Sequence 1 ZPF_HR01_005BPC: FTE Distribution 1
ZAL_HR007BPC: FTE Percentage Planning Sequence 2 ZF_HR_08BPC: HR FTE Planning Sequence 2 ZPF_HR01_006BPC: FTE Distribution 2
ZAL_HR007BPC: FTE Percentage Planning Sequence 2 ZF_HR_08BPC: HR FTE Planning Sequence 2 ZPF_HR01_010BPC: FTE Distribution 3
ZAL_HR007BPC: FTE Percentage Planning Sequence 2 ZF_HR_09BPC: Currency Conversion Filter ZPF_HR01_007BPC: HR Currency conversion
ZAL_HR007BPC: FTE Percentage Planning Sequence 2 ZF_HR_10BPC: HR Trend Years Calculation Filter ZPF_HR01_008BPC: HR Trend Years Calculation
ZAL_HR099BPC: FTE Active/Deactivate Data Slice ZF_HR_99BPC: Active/Deactive FTE DataSlice ZPF_HR99_002BPC: Activate FTE DataSlice ZHR_R02
ZAL_HR099BPC: FTE Active/Deactivate Data Slice ZF_HR_99BPC: Active/Deactive FTE DataSlice ZPF_HR99_001BPC: Deactivate FTE DataSlice ZHR_R02
ZAL_HR004BPC: FTE Percentage Planning Input ZF_HR_11BPC: FTE Copy Filter All Years ZPF_HR01_009BPC: HR FTE Input Year Copy
ZPS_HR01_001 BPC: HR FTE Copy Actual
ZPS_HR01_002 BPC: HR Planning Sequence
ZPS_HR01_003 BPC: HR FTE Copy Actual All Years
ZPS_FI04_004 BPC: P&L - HR Integration
ZPS_FI04_005 BPC: P&L - Copy P&L to Adjusted P&L
ZPS_FI09_001 BPC: Cash Flow copy from P&L
ZPS_FI04_001 BPC: P&L - Full Integration
ZPS_FI04_002 BPC: P&L - WBS Integration
ZPS_FI04_003 BPC: P&L - Cost and Profit Integration
ZPS_FI01_010 BPC: Year Aggregation Year+1 - ProfitCenter
ZPS_FI01_011 BPC: Monthly Distribution - Actual Values
ZPS_FI01_012 BPC: Copy Actual (All Companies)
ZPS_FI01_007 BPC: Monthly Distribution - ProfitCenter
ZPS_FI01_008 BPC: Year Aggregation - ProfitCenter
ZPS_FI01_009 BPC: Monthly Distribution Year+1 - ProfitCenter
ZPS_FI01_004 BPC: Year Aggregation - CostCenter
ZPS_FI01_005 BPC: Monthly Distribution Year+1 - CostCenter
ZPS_FI01_006 BPC: Year Aggregation Year+1 - CostCenter
ZPS_FI01_001 BPC: Intercompany Recharge
ZPS_FI01_002 BPC: Copy Actual
ZPS_FI01_003 BPC: Monthly Distribution - CostCenter

122
DATA CF3000A TYPE F. DATA CF3001A TYPE F. DATA CF3002A TYPE F. DATA CF3003A TYPE F. DATA CF3004A TYPE F. DATA CF3005A TYPE F. DATA CF3006A TYPE F. DATA CF3007A TYPE F. DATA CF3008A TYPE F. DATA CF4000A TYPE F. DATA CF1000F TYPE F. DATA CF2001F TYPE F. DATA CF2002F TYPE F. DATA CF2003F TYPE F. DATA CF2004F TYPE F. DATA CF2005F TYPE F. DATA CF3000F TYPE F. DATA CF3001F TYPE F. DATA CF3002F TYPE F. DATA CF3003F TYPE F. DATA CF3004F TYPE F. DATA CF3005F TYPE F. DATA CF3006F TYPE F. DATA CF3007F TYPE F. DATA CF3008F TYPE F. DATA CF4000F TYPE F. DATA CF5000F TYPE F. DATA CF6000F TYPE F. DATA ACCPDAYS TYPE F. DATA ACCRDAYS TYPE F. DATA ASMONTHS TYPE F. DATA ASMONTHSTOTAL TYPE F. *BREAK-POINT. ********************************************************************************************* ********************************************************************************************* *CLEARING TARGET SOURCE TO AVOID DUPLICATION. ********************************************************************************************* *FOREACH CATEGORY, COMPCODE, CURRENCY, CASHFLOWACC, FISCPER, MONTH , YEAR, INFOPROV, DATASRC, CLIENT IN REFDATA. * { 'ZCASHTTL', CATEGORY, CCOA, COMPCODE, CURRENCY, FISCPER, MONTH, YEAR, ZFI_R05, 100, CASHFLOWACC, CF_ADJUST } = 0. *ENDFOR. *********************************************************************************************
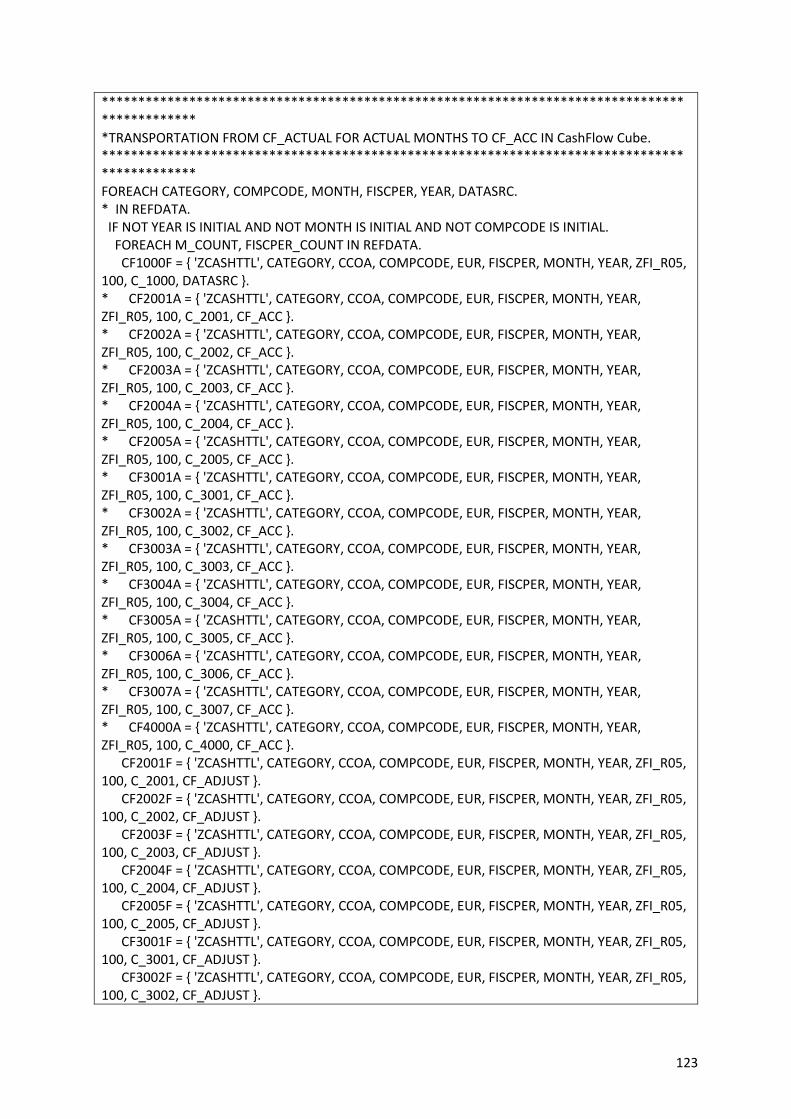
123
********************************************************************************************* *TRANSPORTATION FROM CF_ACTUAL FOR ACTUAL MONTHS TO CF_ACC IN CashFlow Cube. ********************************************************************************************* FOREACH CATEGORY, COMPCODE, MONTH, FISCPER, YEAR, DATASRC. * IN REFDATA. IF NOT YEAR IS INITIAL AND NOT MONTH IS INITIAL AND NOT COMPCODE IS INITIAL. FOREACH M_COUNT, FISCPER_COUNT IN REFDATA. CF1000F = { 'ZCASHTTL', CATEGORY, CCOA, COMPCODE, EUR, FISCPER, MONTH, YEAR, ZFI_R05, 100, C_1000, DATASRC }. * CF2001A = { 'ZCASHTTL', CATEGORY, CCOA, COMPCODE, EUR, FISCPER, MONTH, YEAR, ZFI_R05, 100, C_2001, CF_ACC }. * CF2002A = { 'ZCASHTTL', CATEGORY, CCOA, COMPCODE, EUR, FISCPER, MONTH, YEAR, ZFI_R05, 100, C_2002, CF_ACC }. * CF2003A = { 'ZCASHTTL', CATEGORY, CCOA, COMPCODE, EUR, FISCPER, MONTH, YEAR, ZFI_R05, 100, C_2003, CF_ACC }. * CF2004A = { 'ZCASHTTL', CATEGORY, CCOA, COMPCODE, EUR, FISCPER, MONTH, YEAR, ZFI_R05, 100, C_2004, CF_ACC }. * CF2005A = { 'ZCASHTTL', CATEGORY, CCOA, COMPCODE, EUR, FISCPER, MONTH, YEAR, ZFI_R05, 100, C_2005, CF_ACC }. * CF3001A = { 'ZCASHTTL', CATEGORY, CCOA, COMPCODE, EUR, FISCPER, MONTH, YEAR, ZFI_R05, 100, C_3001, CF_ACC }. * CF3002A = { 'ZCASHTTL', CATEGORY, CCOA, COMPCODE, EUR, FISCPER, MONTH, YEAR, ZFI_R05, 100, C_3002, CF_ACC }. * CF3003A = { 'ZCASHTTL', CATEGORY, CCOA, COMPCODE, EUR, FISCPER, MONTH, YEAR, ZFI_R05, 100, C_3003, CF_ACC }. * CF3004A = { 'ZCASHTTL', CATEGORY, CCOA, COMPCODE, EUR, FISCPER, MONTH, YEAR, ZFI_R05, 100, C_3004, CF_ACC }. * CF3005A = { 'ZCASHTTL', CATEGORY, CCOA, COMPCODE, EUR, FISCPER, MONTH, YEAR, ZFI_R05, 100, C_3005, CF_ACC }. * CF3006A = { 'ZCASHTTL', CATEGORY, CCOA, COMPCODE, EUR, FISCPER, MONTH, YEAR, ZFI_R05, 100, C_3006, CF_ACC }. * CF3007A = { 'ZCASHTTL', CATEGORY, CCOA, COMPCODE, EUR, FISCPER, MONTH, YEAR, ZFI_R05, 100, C_3007, CF_ACC }. * CF4000A = { 'ZCASHTTL', CATEGORY, CCOA, COMPCODE, EUR, FISCPER, MONTH, YEAR, ZFI_R05, 100, C_4000, CF_ACC }. CF2001F = { 'ZCASHTTL', CATEGORY, CCOA, COMPCODE, EUR, FISCPER, MONTH, YEAR, ZFI_R05, 100, C_2001, CF_ADJUST }. CF2002F = { 'ZCASHTTL', CATEGORY, CCOA, COMPCODE, EUR, FISCPER, MONTH, YEAR, ZFI_R05, 100, C_2002, CF_ADJUST }. CF2003F = { 'ZCASHTTL', CATEGORY, CCOA, COMPCODE, EUR, FISCPER, MONTH, YEAR, ZFI_R05, 100, C_2003, CF_ADJUST }. CF2004F = { 'ZCASHTTL', CATEGORY, CCOA, COMPCODE, EUR, FISCPER, MONTH, YEAR, ZFI_R05, 100, C_2004, CF_ADJUST }. CF2005F = { 'ZCASHTTL', CATEGORY, CCOA, COMPCODE, EUR, FISCPER, MONTH, YEAR, ZFI_R05, 100, C_2005, CF_ADJUST }. CF3001F = { 'ZCASHTTL', CATEGORY, CCOA, COMPCODE, EUR, FISCPER, MONTH, YEAR, ZFI_R05, 100, C_3001, CF_ADJUST }. CF3002F = { 'ZCASHTTL', CATEGORY, CCOA, COMPCODE, EUR, FISCPER, MONTH, YEAR, ZFI_R05, 100, C_3002, CF_ADJUST }.
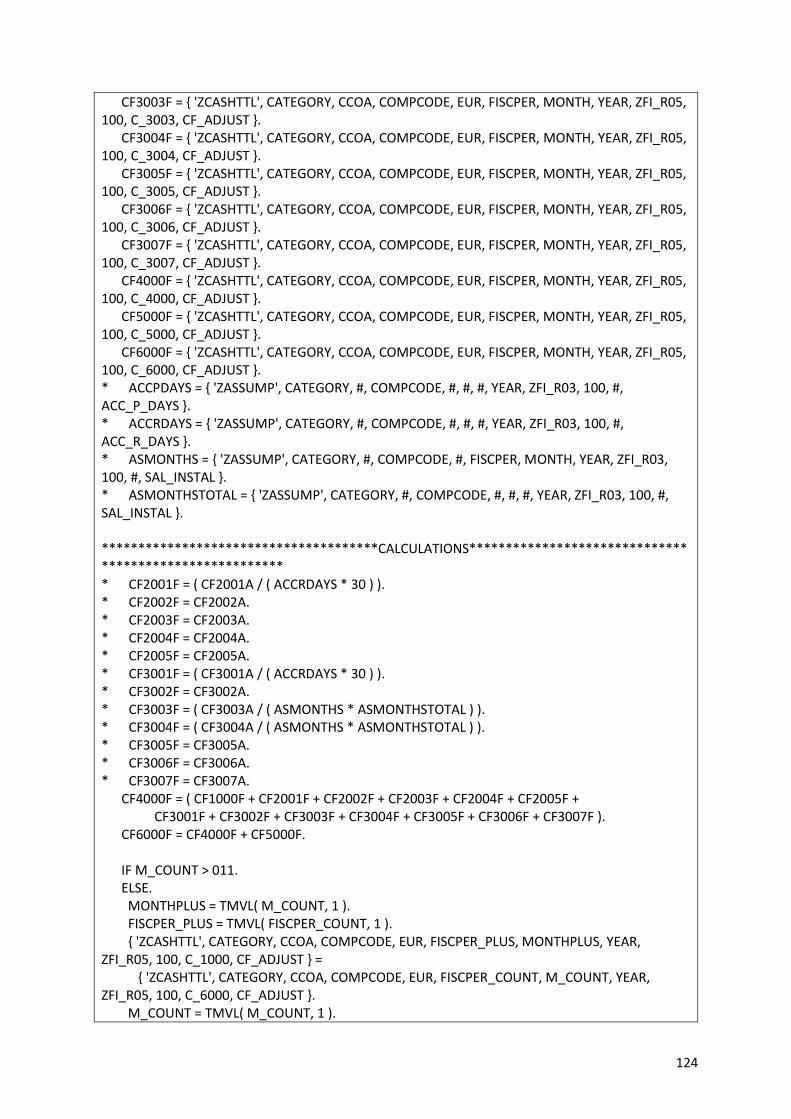
124
CF3003F = { 'ZCASHTTL', CATEGORY, CCOA, COMPCODE, EUR, FISCPER, MONTH, YEAR, ZFI_R05, 100, C_3003, CF_ADJUST }. CF3004F = { 'ZCASHTTL', CATEGORY, CCOA, COMPCODE, EUR, FISCPER, MONTH, YEAR, ZFI_R05, 100, C_3004, CF_ADJUST }. CF3005F = { 'ZCASHTTL', CATEGORY, CCOA, COMPCODE, EUR, FISCPER, MONTH, YEAR, ZFI_R05, 100, C_3005, CF_ADJUST }. CF3006F = { 'ZCASHTTL', CATEGORY, CCOA, COMPCODE, EUR, FISCPER, MONTH, YEAR, ZFI_R05, 100, C_3006, CF_ADJUST }. CF3007F = { 'ZCASHTTL', CATEGORY, CCOA, COMPCODE, EUR, FISCPER, MONTH, YEAR, ZFI_R05, 100, C_3007, CF_ADJUST }. CF4000F = { 'ZCASHTTL', CATEGORY, CCOA, COMPCODE, EUR, FISCPER, MONTH, YEAR, ZFI_R05, 100, C_4000, CF_ADJUST }. CF5000F = { 'ZCASHTTL', CATEGORY, CCOA, COMPCODE, EUR, FISCPER, MONTH, YEAR, ZFI_R05, 100, C_5000, CF_ADJUST }. CF6000F = { 'ZCASHTTL', CATEGORY, CCOA, COMPCODE, EUR, FISCPER, MONTH, YEAR, ZFI_R05, 100, C_6000, CF_ADJUST }. * ACCPDAYS = { 'ZASSUMP', CATEGORY, #, COMPCODE, #, #, #, YEAR, ZFI_R03, 100, #, ACC_P_DAYS }. * ACCRDAYS = { 'ZASSUMP', CATEGORY, #, COMPCODE, #, #, #, YEAR, ZFI_R03, 100, #, ACC_R_DAYS }. * ASMONTHS = { 'ZASSUMP', CATEGORY, #, COMPCODE, #, FISCPER, MONTH, YEAR, ZFI_R03, 100, #, SAL_INSTAL }. * ASMONTHSTOTAL = { 'ZASSUMP', CATEGORY, #, COMPCODE, #, #, #, YEAR, ZFI_R03, 100, #, SAL_INSTAL }. **************************************CALCULATIONS******************************************************* * CF2001F = ( CF2001A / ( ACCRDAYS * 30 ) ). * CF2002F = CF2002A. * CF2003F = CF2003A. * CF2004F = CF2004A. * CF2005F = CF2005A. * CF3001F = ( CF3001A / ( ACCRDAYS * 30 ) ). * CF3002F = CF3002A. * CF3003F = ( CF3003A / ( ASMONTHS * ASMONTHSTOTAL ) ). * CF3004F = ( CF3004A / ( ASMONTHS * ASMONTHSTOTAL ) ). * CF3005F = CF3005A. * CF3006F = CF3006A. * CF3007F = CF3007A. CF4000F = ( CF1000F + CF2001F + CF2002F + CF2003F + CF2004F + CF2005F + CF3001F + CF3002F + CF3003F + CF3004F + CF3005F + CF3006F + CF3007F ). CF6000F = CF4000F + CF5000F. IF M_COUNT > 011. ELSE. MONTHPLUS = TMVL( M_COUNT, 1 ). FISCPER_PLUS = TMVL( FISCPER_COUNT, 1 ). { 'ZCASHTTL', CATEGORY, CCOA, COMPCODE, EUR, FISCPER_PLUS, MONTHPLUS, YEAR, ZFI_R05, 100, C_1000, CF_ADJUST } = { 'ZCASHTTL', CATEGORY, CCOA, COMPCODE, EUR, FISCPER_COUNT, M_COUNT, YEAR, ZFI_R05, 100, C_6000, CF_ADJUST }. M_COUNT = TMVL( M_COUNT, 1 ).

125
ENDIF. **************************************CALCULATIONS******************************************************* * { 'ZCASHTTL', CATEGORY, CCOA, COMPCODE, EUR, FISCPER, MONTH, YEAR, ZFI_R05, 100, C_2001, CF_ADJUST } = CF2001F. * { 'ZCASHTTL', CATEGORY, CCOA, COMPCODE, EUR, FISCPER, MONTH, YEAR, ZFI_R05, 100, C_2002, CF_ADJUST } = CF2002F. * { 'ZCASHTTL', CATEGORY, CCOA, COMPCODE, EUR, FISCPER, MONTH, YEAR, ZFI_R05, 100, C_2003, CF_ADJUST } = CF2003F. * { 'ZCASHTTL', CATEGORY, CCOA, COMPCODE, EUR, FISCPER, MONTH, YEAR, ZFI_R05, 100, C_2004, CF_ADJUST } = CF2004F. * { 'ZCASHTTL', CATEGORY, CCOA, COMPCODE, EUR, FISCPER, MONTH, YEAR, ZFI_R05, 100, C_2005, CF_ADJUST } = CF2005F. * { 'ZCASHTTL', CATEGORY, CCOA, COMPCODE, EUR, FISCPER, MONTH, YEAR, ZFI_R05, 100, C_3001, CF_ADJUST } = CF3001F. * { 'ZCASHTTL', CATEGORY, CCOA, COMPCODE, EUR, FISCPER, MONTH, YEAR, ZFI_R05, 100, C_3002, CF_ADJUST } = CF3002F. * { 'ZCASHTTL', CATEGORY, CCOA, COMPCODE, EUR, FISCPER, MONTH, YEAR, ZFI_R05, 100, C_3003, CF_ADJUST } = CF3003F. * { 'ZCASHTTL', CATEGORY, CCOA, COMPCODE, EUR, FISCPER, MONTH, YEAR, ZFI_R05, 100, C_3004, CF_ADJUST } = CF3004F. * { 'ZCASHTTL', CATEGORY, CCOA, COMPCODE, EUR, FISCPER, MONTH, YEAR, ZFI_R05, 100, C_3005, CF_ADJUST } = CF3005F. * { 'ZCASHTTL', CATEGORY, CCOA, COMPCODE, EUR, FISCPER, MONTH, YEAR, ZFI_R05, 100, C_3006, CF_ADJUST } = CF3006F. * { 'ZCASHTTL', CATEGORY, CCOA, COMPCODE, EUR, FISCPER, MONTH, YEAR, ZFI_R05, 100, C_3007, CF_ADJUST } = CF3007F. { 'ZCASHTTL', CATEGORY, CCOA, COMPCODE, EUR, FISCPER, MONTH, YEAR, ZFI_R05, 100, C_4000, CF_ADJUST } = CF4000F. * { 'ZCASHTTL', CATEGORY, CCOA, COMPCODE, EUR, FISCPER, MONTH, YEAR, ZFI_R05, 100, C_5000, CF_ADJUST } = CF5000F. { 'ZCASHTTL', CATEGORY, CCOA, COMPCODE, EUR, FISCPER, MONTH, YEAR, ZFI_R05, 100, C_6000, CF_ADJUST } = CF6000F. ENDFOR. ENDIF. ENDFOR. *********************************************************************************************
Table 8.30: CashFlow Adjusted Calculations PF Fox Formula


![References - Springer978-3-642-17628... · 2017-08-29 · References 235 [33] Caglayan, A.K., Allen, S.M., Wehmuller, K.: Evaluation of a second generation re-configuration strategy](https://img.pdfslide.net/doc/110x75/5e31e60c0ac42067863e40a3/references-springer-978-3-642-17628-2017-08-29-references-235-33-caglayan.jpg)