Embed Size (px)
Citation preview
Building an Exploratory Visual Analysis Tool for Qualitative Researchers
Tanuka Bhowmick
GeoVISTA Center Department of Geography
302 Walker Building The Pennsylvania State University
University Park, PA 16802 tanuka@ psu.edu Ph: 814-865-7432 Fax: 814-863-7943
Abstract Qualitative research is an integral part of both academic and non-academic research in various disciplines, including sociology, anthropology, geography, education, health sciences and other social sciences. In order to facilitate the expanding use of qualitative research in various disciplines, newer and more sophisticated exploratory tools that assist qualitative researchers in the entire research process ranging from exploration, analysis, synthesis to presentation of data is required. Visualization presents exciting possibilities in this regard and building an exploratory visualization tool for this purpose would be ideal. Current computer assisted qualitative data analysis software (CAQDAS) have aided qualitative researchers in coding, searching, indexing and analyzing their data. However these software have several shortcomings in terms of supporting the entire research process including inability to deal with geographic and temporal analysis as well as limited exploratory capabilities. I posit that an exploratory visualization tool can overcome the limitations posed by current CAQDAS and expand many possibilities for qualitative researchers. For this purpose I draw upon tools and techniques from current geovisualization and information visualization literature to propose a visualization framework for qualitative researchers which can be later be extended into an exploratory tool. 1. Introduction
Qualitative research has always been an important mode of enquiry for social and human science exploration. There is also an increasing focus on qualitative methods of inquiry in multidisciplinary and cross disciplinary research areas in order to capture broader aspects of human and social behavior. Qualitative research also has a very broad range of enquiry methods, huge quantities of data, complex relationships between the researchers and participants, intricate theories and reflexive accounts. Exploring, analyzing, synthesizing these intricate maze of data requires understanding these complexities in detail and the multiple perspectives from which it evolves. To facilitate some of these complexities, certain computer assisted qualitative data analysis software (CAQDAS) have evolved from the early 1990s which enable qualitative researchers with certain tasks such as organization, coding, sorting, searching and analyzing data. However with the expanding use of qualitative research in various disciplines with multiple perspectives and complex data types, more robust and sophisticated computer assisted tools are needed that would assist qualitative researchers in the entire complexity of the research process beginning with exploration, analysis, synthesis and presentation. Developing an exploratory visualization tools can help in this regard. In this paper, I outline in detail how visualization techniques and tools are greatly increasing in demand among qualitative researchers and how they can help qualitative researchers in the entire research process. I also argue that current CAQDAS do not have the capabilities of supporting the entire research process for qualitative researchers and have some severe shortcomings in terms of becoming effective visualization and exploratory tools. Finally, I also briefly outline the methodology I use to build a visualization framework for qualitative researchers. This framework can later be used as a background for building an exploratory visualization tool for qualitative researchers.
2. Understanding Visualization and its Role in the Research Process
Visualization is a method to explore, analyze, synthesize and present different kinds of data to gather new insights from them. As MacEachren (1992) described: visualization is not a mere act of computation to create images but more importantly an act of cognition which helps humans develop mental representations and identify patterns and thereby create order from
2
randomness. It helps in better and faster retrieval of data thereby facilitating the cognitive process to concentrate on higher functions of synthesis and analysis of data.
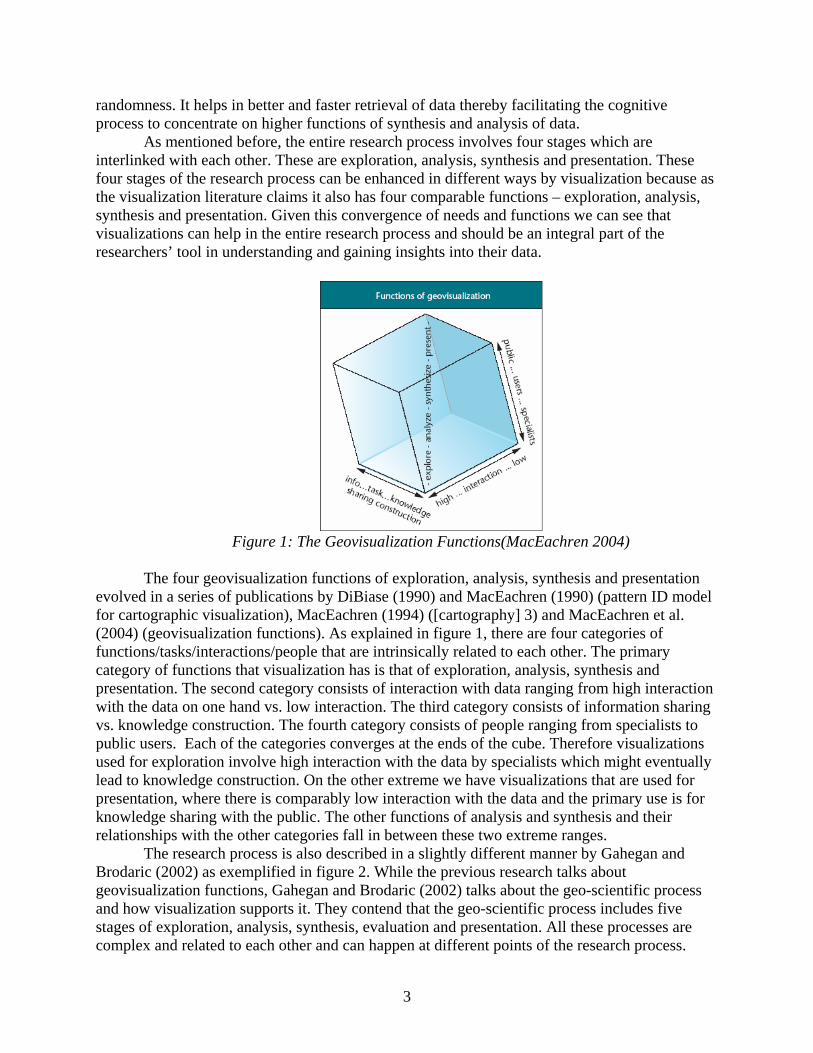
As mentioned before, the entire research process involves four stages which are interlinked with each other. These are exploration, analysis, synthesis and presentation. These four stages of the research process can be enhanced in different ways by visualization because as the visualization literature claims it also has four comparable functions – exploration, analysis, synthesis and presentation. Given this convergence of needs and functions we can see that visualizations can help in the entire research process and should be an integral part of the researchers’ tool in understanding and gaining insights into their data.
Figure 1: The Geovisualization Functions(MacEachren 2004)
The four geovisualization functions of exploration, analysis, synthesis and presentation
evolved in a series of publications by DiBiase (1990) and MacEachren (1990) (pattern ID model for cartographic visualization), MacEachren (1994) ([cartography] 3) and MacEachren et al. (2004) (geovisualization functions). As explained in figure 1, there are four categories of functions/tasks/interactions/people that are intrinsically related to each other. The primary category of functions that visualization has is that of exploration, analysis, synthesis and presentation. The second category consists of interaction with data ranging from high interaction with the data on one hand vs. low interaction. The third category consists of information sharing vs. knowledge construction. The fourth category consists of people ranging from specialists to public users. Each of the categories converges at the ends of the cube. Therefore visualizations used for exploration involve high interaction with the data by specialists which might eventually lead to knowledge construction. On the other extreme we have visualizations that are used for presentation, where there is comparably low interaction with the data and the primary use is for knowledge sharing with the public. The other functions of analysis and synthesis and their relationships with the other categories fall in between these two extreme ranges.
The research process is also described in a slightly different manner by Gahegan and Brodaric (2002) as exemplified in figure 2. While the previous research talks about geovisualization functions, Gahegan and Brodaric (2002) talks about the geo-scientific process and how visualization supports it. They contend that the geo-scientific process includes five stages of exploration, analysis, synthesis, evaluation and presentation. All these processes are complex and related to each other and can happen at different points of the research process.
3
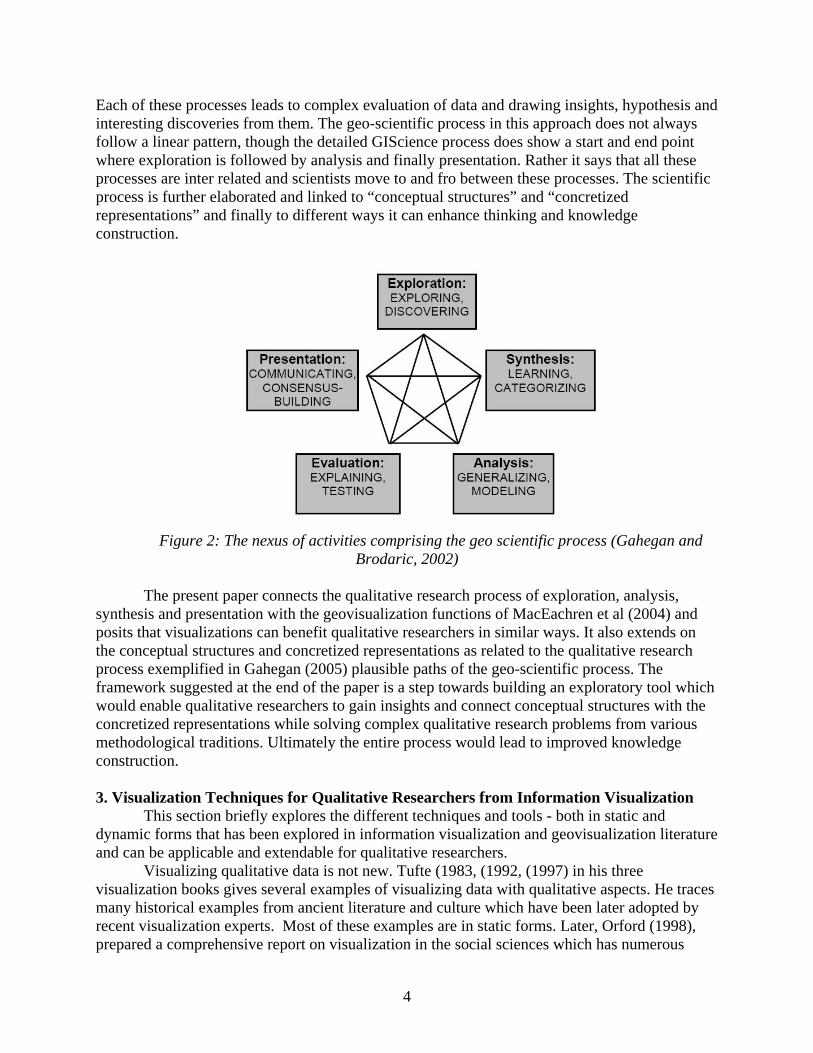
Each of these processes leads to complex evaluation of data and drawing insights, hypothesis and interesting discoveries from them. The geo-scientific process in this approach does not always follow a linear pattern, though the detailed GIScience process does show a start and end point where exploration is followed by analysis and finally presentation. Rather it says that all these processes are inter related and scientists move to and fro between these processes. The scientific process is further elaborated and linked to “conceptual structures” and “concretized representations” and finally to different ways it can enhance thinking and knowledge construction.
Figure 2: The nexus of activities comprising the geo scientific process (Gahegan and
Brodaric, 2002) The present paper connects the qualitative research process of exploration, analysis,
synthesis and presentation with the geovisualization functions of MacEachren et al (2004) and posits that visualizations can benefit qualitative researchers in similar ways. It also extends on the conceptual structures and concretized representations as related to the qualitative research process exemplified in Gahegan (2005) plausible paths of the geo-scientific process. The framework suggested at the end of the paper is a step towards building an exploratory tool which would enable qualitative researchers to gain insights and connect conceptual structures with the concretized representations while solving complex qualitative research problems from various methodological traditions. Ultimately the entire process would lead to improved knowledge construction. 3. Visualization Techniques for Qualitative Researchers from Information Visualization
This section briefly explores the different techniques and tools - both in static and dynamic forms that has been explored in information visualization and geovisualization literature and can be applicable and extendable for qualitative researchers.
Visualizing qualitative data is not new. Tufte (1983, (1992, (1997) in his three visualization books gives several examples of visualizing data with qualitative aspects. He traces many historical examples from ancient literature and culture which have been later adopted by recent visualization experts. Most of these examples are in static forms. Later, Orford (1998), prepared a comprehensive report on visualization in the social sciences which has numerous
4
examples of both static and dynamic visualizations. There have been many tools and techniques developed in areas of geovisualization and information visualization which can be specifically applied for qualitative researchers. This section briefly examines the different categories of research which need special mention in the context of qualitative data or research.
The first major area is text visualization. Text is visualized for two major purposes – a. for content analysis of the overall text and b. to built clusters and hierarchies of similar and dissimilar textual information. The primary research challenge in these cases is to parse out important information from large quantities of data such as newspaper clippings and video, large textual documents, and so on [Fekete and Dufournaud (2000); Greco and Gonzalez-Walker (24-25 June 1997)].
The second major categories of qualitative visualizations are concept maps, cognitive maps and mind maps. These visualizations connect major themes and phases in meaningful ways to understand the thinking process of humans for making ontological exchanges and so on. Network analysis and argumentation mapping is related to these visualizations which also establish relationships between categories or relate stories through arguments. These visualizations help in exploring and presenting relationships between categories and making reflexive arguments [Buzan (1993); Dodge M. (2000); Rinner (1999); ConceptVISTA (2005); Heer (2005)].
The third category identified are storyboards, multimedia visualizations, confections (text and image layout which tells a story) used mostly to convey important messages, tell stories about events, places etc. with visual imagery combined with normal text or hypertext. These visualizations are supposed to be effective in layering information, presenting the overall picture and assimilating information in a systematic manner [Gershon (2001); Monmonier (1992); Tufte (1997); Dykes (1997)].
A fourth category of visualizations is spatio temporal data visualizations or simply temporal visualizations. These visualizations include space time paths, event histories, timelines and so on. These visualizations are critical in exploring, analyzing and presenting qualitative data related to biographies, phenomenon and changing events over space [Francis and Pritchard (2000); Kwan (2002)].
The final category of visualization is related to spatial data representation though maps. Mental maps have made a very important contribution in this regard. Other maps drawn within present Geographic Information Systems (GIS) also significantly contribute in presenting qualitative information. Many such examples are available especially in the Public Participation GIS literature [Al-Kodmany (2001); Al-Kodmany (2002); Matthews (2001); Pavlovskaya (2002)].
As seen from the above discussion, there is a lot of interest in using visualizations and GIS in qualitative research. In spite of having had visualizations for different kinds of qualitative data for a long time, there has been no systematic attempt to categorize them in order to facilitate qualitative researchers in selecting, combining, developing and finally extending these techniques into computer tools for purposes of exploration, analysis, synthesis or presentation of their research data. The current research will direct attention towards that goal. 3. Computer Assisted Qualitative Research Analysis Software (CAQDAS)
In the previous paragraphs, I outline the possibilities that visualizations hold for qualitative researchers and how the current information and geovisualization literature hold immense possibilities for its development. In this section, I will outline a two step method that I
5
have used to prove why current computer assisted tools are not enough to support the visualization needs for qualitative researchers. At first, I will review some of the literature on CAQDAS along with the features of some of the CAQDAS. Second, I will supplement this information with a small survey to understand the features, advantages and shortcomings of current CAQDAS as reported by users. 3.1 Software
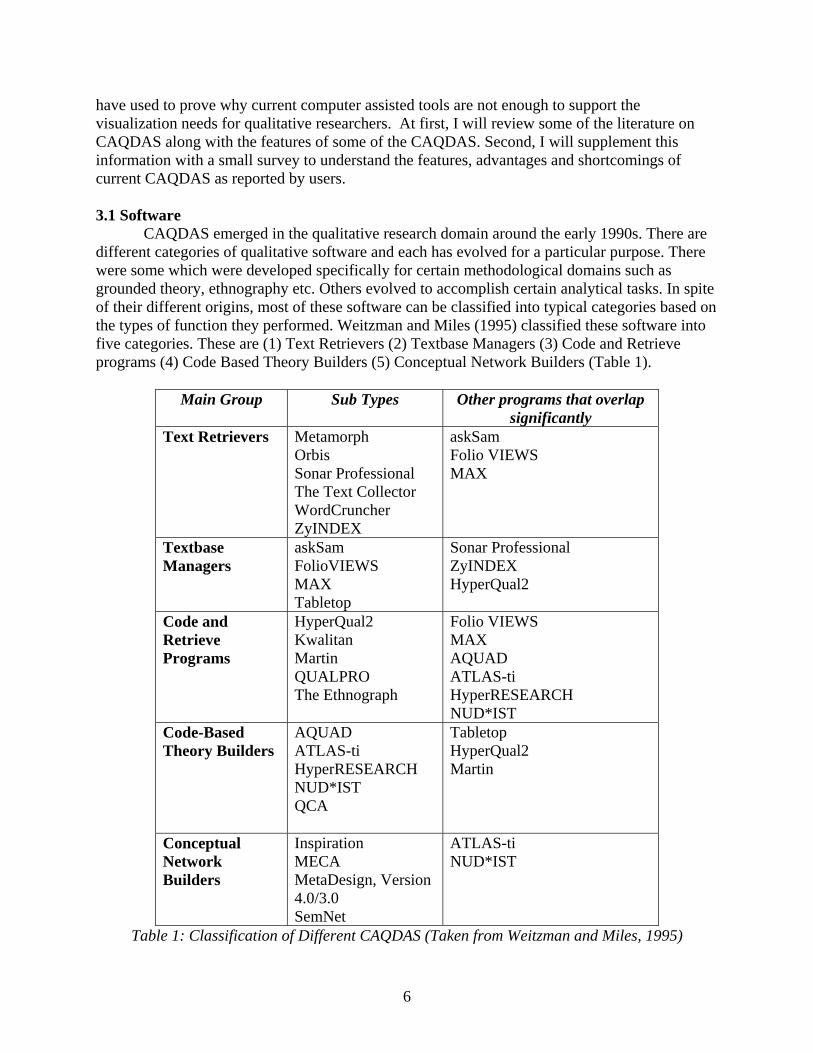
CAQDAS emerged in the qualitative research domain around the early 1990s. There are different categories of qualitative software and each has evolved for a particular purpose. There were some which were developed specifically for certain methodological domains such as grounded theory, ethnography etc. Others evolved to accomplish certain analytical tasks. In spite of their different origins, most of these software can be classified into typical categories based on the types of function they performed. Weitzman and Miles (1995) classified these software into five categories. These are (1) Text Retrievers (2) Textbase Managers (3) Code and Retrieve programs (4) Code Based Theory Builders (5) Conceptual Network Builders (Table 1).
Main Group Sub Types Other programs that overlap
significantly Text Retrievers
Metamorph Orbis Sonar Professional The Text Collector WordCruncher ZyINDEX
askSam Folio VIEWS MAX
Textbase Managers
askSam FolioVIEWS MAX Tabletop
Sonar Professional ZyINDEX HyperQual2
Code and Retrieve Programs
HyperQual2 Kwalitan Martin QUALPRO The Ethnograph
Folio VIEWS MAX AQUAD ATLAS-ti HyperRESEARCH NUD*IST
Code-Based Theory Builders
AQUAD ATLAS-ti HyperRESEARCH NUD*IST QCA
Tabletop HyperQual2 Martin
Conceptual Network Builders
Inspiration MECA MetaDesign, Version 4.0/3.0 SemNet
ATLAS-ti NUD*IST
Table 1: Classification of Different CAQDAS (Taken from Weitzman and Miles, 1995)
6
In the following paragraphs, I describe in some detail, the workings of two of the popular software programs – NUD*IST (Currently known as N6 or NVivo 7.0) and Atlas.ti. As seen from Table 1, both Atlas.ti and NUD*IST fall under the broad category of being conceptual network builders. Therefore they are considered to be more sophisticated in term of coding and retrieval as well as building networks of categories from the codes.
A first prototype of Atlas.ti was developed as part of the ATLAS (1989-1992) project at the Technical University of Berlin. The project was in an interdisciplinary group with interactions between computer scientists, psychologists, linguists, and future users. The 1.1 version was released in 1993-94 by Thomas Muhr. The latest version of ATLAS.ti 5.0 was released in 2004 with many new features. (ATLAS.ti - The Knowledge Workbench: A Brief History (2002-2006). Atlas.ti is ideal for making linkages between different elements of the data. It is also helpful for theory building and making different hierarchical connections between data elements.
QSR NUD*IST 3.0 (for Non-Numerical, Unstructured Data Indexing, Searching and Theorizing) was first released in 1993-1994 by Lyn and Tom Richards – a team of qualitative researcher and computer scientist. It was designed for the storage, coding, retrieval and analysis of text. The latest version is known as N6 and it helps in theory building through the mechanisms of coding and retrieval of data. It helps to build hierarchical networks of categories of different types of coding. It also allows people to visualize the codes and hierarchies graphically. It also allows for extensive search properties and help in analyzing large text based documents and extract codes from them. Few other features in N6 include automatic coding from user-defined keywords, and calculation of code frequencies. N6 has been merged recently in early 2006 with its sister software package NVvivo 6.0 to be released as NVivo 7.0. 3.2. The Survey
A survey was conducted with qualitative researchers from different disciplinary areas to understand the adoption/non-adoption, popular features, advantages and disadvantages of current CAQDAS. Though the survey is still underway, some preliminary results will be discussed here obtained from 12 participants. The survey was conducted in departments which are traditionally known to have qualitative researchers. Some departments could not be accessed but will be done in a couple of weeks. The primary users of these software were found in the departments of Education, Rural Sociology and Agricultural Economics. The department of Geography did not have any users who currently used these software though some respondents showed an interest in using them in the future. Surprisingly the department of history and psychology also did not have any respondents who currently use this software.
The survey was started off with questions about the use of CAQDAS and the motivation behind using it. The primary motivation of using these software were reported as easy data management – “ease of handling large quantities of data”, “managing the data”, and “reducing the amount of data”. One respondent mentioned the facility of video analysis of large quantities of data too. Followed by this, the survey asked about the main functions that the participants’ primary used. These were cited as indexing, coding, content analysis, sorting, searching and creating reports. The auto coding function and creating families of codes and networks seemed a feature which one participant used regularly.
When asked about the advantages and disadvantages of CAQDAS, the main advantages reported stemmed from a comparative advantage of using computers in general to automate tasks over traditional methods of coding. It helped in easier generation and manipulation of codes,
7
portability of having the data organized in one place, keeping track of the data without having to rely too much on memory, doing extensive content analysis etc. Among the disadvantages stated by users getting de-contextualized from the data seemed to be a major concern. This has also been echoed by some critiques of CAQDAS such as Fielding and Lee (1998) and Barry (1998). This feeling of de-contextualization is reflected by statements such as not feeling “close” to the data any more, the software having a “behaviorist orientation”, getting the feel of “garbage in-garbage-out” with the data and so on. One person mentioned not being able to “visualize the data as a whole” so as to make him feel losing links between the codes and the original data.
One of the important critiques of CAQDAS as seen from literature was that each of the software had a certain motivation - either methodological or analytical based on which it was originally built which made them unsuitable to be used by other methodological traditions. Kelle (1995) examines in detail the different software that has been developed to enable a certain kind of analysis. For example NUD*IST or N6 was designed to support coding typical to grounded theory. Likewise QCA and AQUAD were developed for qualitative comparative analysis and MAX for case-oriented quantification. For this purpose, I posed a question in the survey about the methodological tradition of the user to find out if there was any correlation between the kinds of software and methodological tradition a user belonged to. Results show that users belonged to almost all the traditions of inquiry and there is no specific correlation to the software used. For example, most of the users in the survey used N6 but they came from various traditions including case study, ethnography, grounded theory, mixed methodologies and discourse analysis.
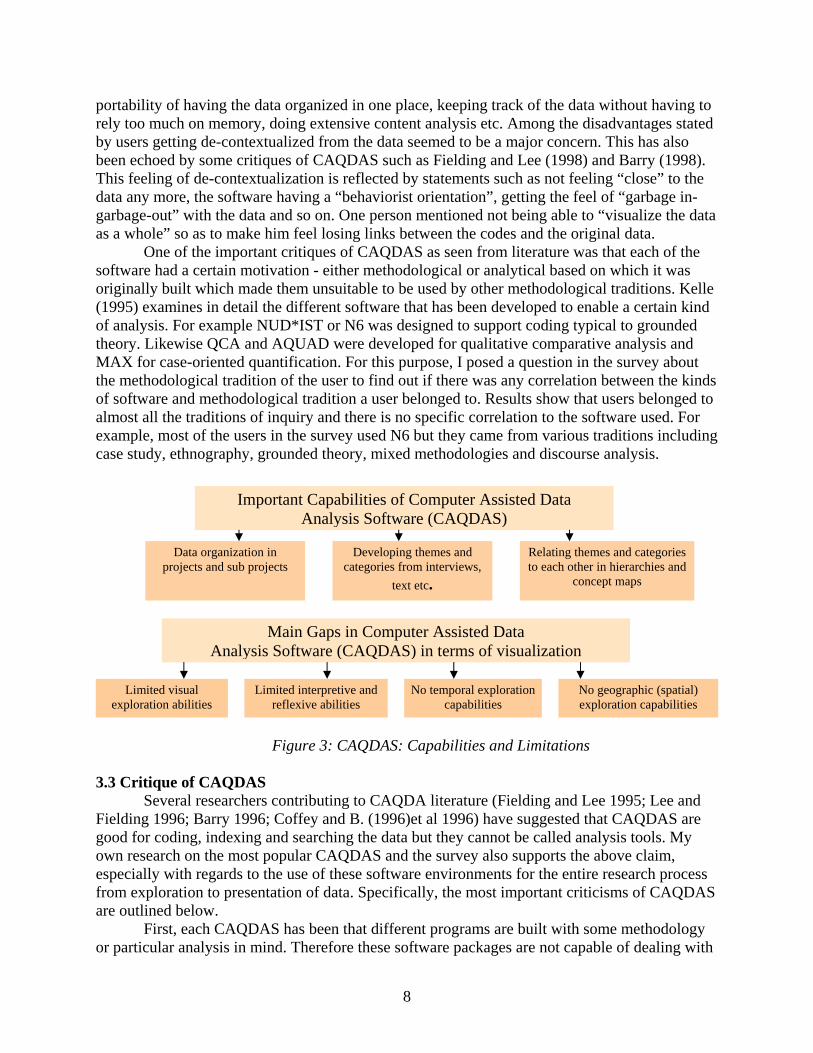
Important Capabilities of Computer Assisted Data Analysis Software (CAQDAS)
Data organization in Developing themes and categories from interviews,
text etc.
Relating themes and categories to each other in hierarchies and
concept maps projects and sub projects
Main Gaps in Computer Assisted Data
Analysis Software (CAQDAS) in terms of visualization
Limited visual exploration abilities
Limited interpretive and reflexive abilities
No temporal exploration capabilities
No geographic (spatial) exploration capabilities
Figure 3: CAQDAS: Capabilities and Limitations 3.3 Critique of CAQDAS
Several researchers contributing to CAQDA literature (Fielding and Lee 1995; Lee and Fielding 1996; Barry 1996; Coffey and B. (1996)et al 1996) have suggested that CAQDAS are good for coding, indexing and searching the data but they cannot be called analysis tools. My own research on the most popular CAQDAS and the survey also supports the above claim, especially with regards to the use of these software environments for the entire research process from exploration to presentation of data. Specifically, the most important criticisms of CAQDAS are outlined below.
First, each CAQDAS has been that different programs are built with some methodology or particular analysis in mind. Therefore these software packages are not capable of dealing with
8
qualitat
ted
te h as
t
ot
ation Framework In the above paragraphs, I have discussed in detail the need for building an exploratory
In this section I will present the methodology of buildin
y ng
.
c. used. in a particular tradition of inquiry. .
ed above. xploratory and analysis needs
of q uiry with al
collected and categorized in three different ways. This is done in to order to enable researchers and software developers to usefully assimilate the
ive research conducted in different methodological domains. This makes it difficult to beapplicable to a wide range of users. Sometimes this can lead to confusions and problems in data management and coding leading to wrong analysis. Second, one critical disadvantage of present CAQDAS which is clear from examination of both the current software as well as from the results of the survey is their inability to provide an option for handling geographic information. Qualitative research studies carries a lot of information about space and this can be incorporawithin present GIS to find interesting relationships. Another important disadvantage is the inability to deal with temporal data. Some tools such as N6 has time stamps which help in analyzing video data, but they are not versatile enough to incorporate temporal data and relathem to other attribute data. Qualitative research studies often have information on time sucdays, years, time of the day, minute, hour (Kwan 2002; Matthews et al 2002) which is importanin analyzing certain types of events. Likewise a combination of space and time data is often important in qualitative studies and CAQDAS do not have any abilities to handle them. This could perhaps be an important reason for the non adoption of CAQDAS by geographers and historians. Finally, CAQDAS has limited or almost no exploratory capabilities. Typical exploration elements such as linking, brushing and exploring multiple views of data are also navailable in CAQDAS. 4. Building the Visualiz
visualization tool for qualitative researchers. g a visualization framework for qualitative researchers which can be later extended to
develop a visualization tool. For t building the framework I have used a three step methodologwhich is elaborated in detail in Figure 4. The first step in the methodology deals with examinicurrent literature on qualitative research methodologies, and visualization techniques and tools from information and geovisualization and categorizing them systematically. To categorize qualitative research systematically, I adopted the five traditions of inquiry from Creswell (1998)These are ethnography, biography, grounded theory, phenomenology and case study. To understand the kinds of analysis methods that each of the traditions of inquiry deals with, I subdivided each tradition in the following manner:
a. The major sub-disciplines or methodologies from which each of these qualitative approaches have evolved.
b. The major questions that are asked within this tradition. The data collection methods
d. The major data preparation and analysis techniques used e. The visualization techniques available for each of the analysis identifi
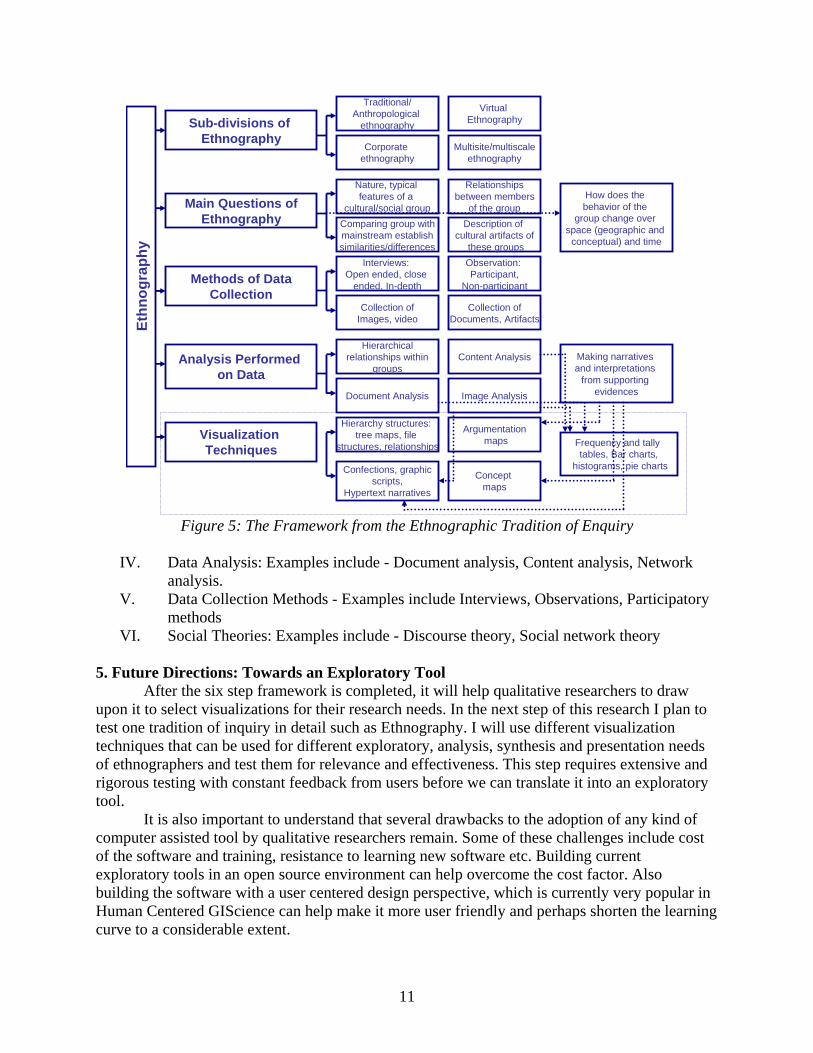
Each of these subdivisions will help in understanding the eualitative researchers. Figure 5 shows an example of the ethnographic tradition of inq
l these subdivisions. Finally the framework systematically parses out the visualization techniques that are important for each of the analysis methods within ethnography. The shadedsection at the bottom of the hierarchy in Figure 5 shows the visualization techniques that are applicable to the different analysis methods used in ethnography. This process is repeated with all the traditions of inquiry mentioned above.
Once all the traditions of inquiry have their own visualization techniques identified, the visualization solutions or techniques have been
9
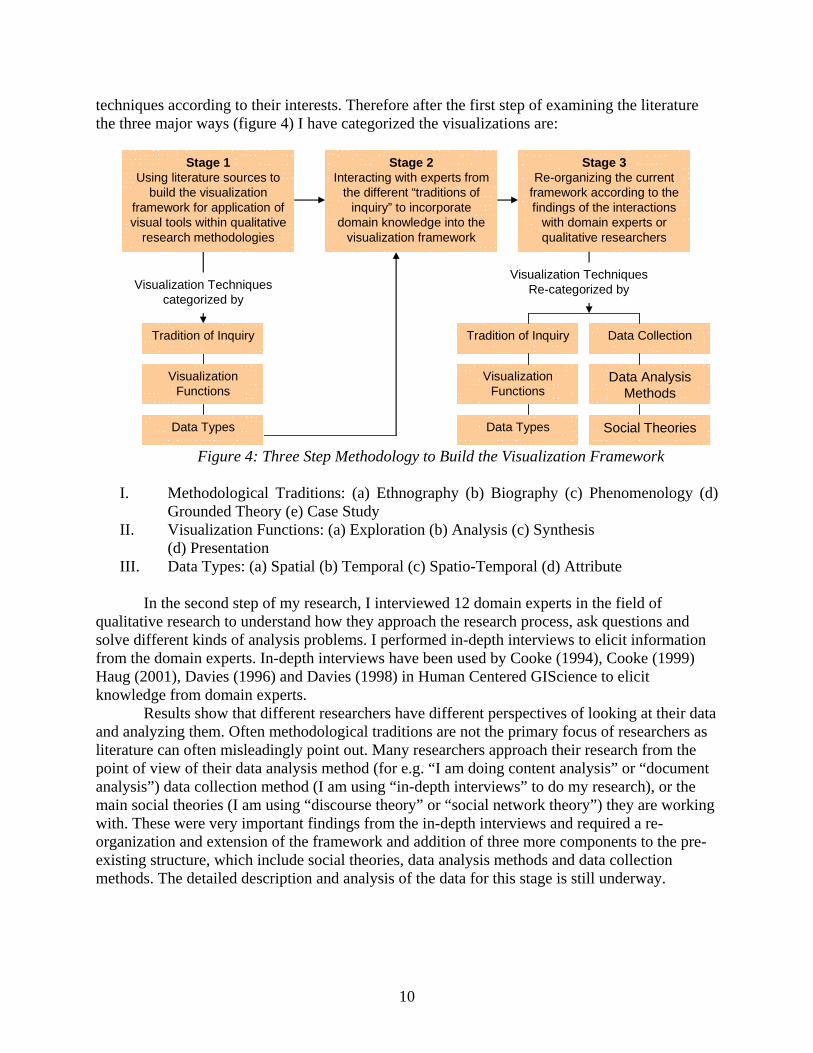
techniques according to their interests. Therefore after the first step of examining the literature the three major ways (figure 4) I have categorized the visualizations are:
Stage 1
Using literature sources to build the visualization
framework for application of visual tools within qualitative
research methodologies
Stage 2Interacting with experts from
the different “traditions of inquiry” to incorporate
domain knowledge into the visualization framework
Stage 3Re-organizing the current
framework according to the findings of the interactions
with domain experts or qualitative researchers
Tradition of Inquiry
Visualization Techniques categorized by
Visualization Functions
Data Types
Tradition of Inquiry
Visualization Functions
Data Types
Data Collection
Data AnalysisMethods
Social Theories
Visualization Techniques Re-categorized by
Figure 4: Three Step Methodology to Build the Visualization Framework
I. Methodological Traditions: (a) Ethnography (b) Biography (c) Phenomenology (d)
GrouII. Visualization Functions: (a) Exploration (b) Analysis (c) Synthesis
III. ral (c) Spatio-Temporal (d) Attribute In the second step of my research, I interviewed 12 domain experts in the field of
qua ve tions and solve different kinds of analysis problems. I performed in-depth interviews to elicit information from th 99)
ta chers as
int out. Many researchers approach their research from the point o
g
nded Theory (e) Case Study
(d) Presentation Data Types: (a) Spatial (b) Tempo
litati research to understand how they approach the research process, ask ques
e domain experts. In-depth interviews have been used by Cooke (1994), Cooke (19Haug (2001), Davies (1996) and Davies (1998) in Human Centered GIScience to elicit knowledge from domain experts.
Results show that different researchers have different perspectives of looking at their daand analyzing them. Often methodological traditions are not the primary focus of researliterature can often misleadingly po
f view of their data analysis method (for e.g. “I am doing content analysis” or “document analysis”) data collection method (I am using “in-depth interviews” to do my research), or the main social theories (I am using “discourse theory” or “social network theory”) they are workinwith. These were very important findings from the in-depth interviews and required a re-organization and extension of the framework and addition of three more components to the pre-existing structure, which include social theories, data analysis methods and data collection methods. The detailed description and analysis of the data for this stage is still underway.
10
Sub-divisions of Ethnography
Main Questions ofEthnography
Methods of DataCollection
Analysis Performed on Data
Visualization Techniques
Ethn
ogra
phy
Virtual Ethnography
Multisite/multiscaleethnography
How does the behavior of the
group change over space (geographic and
conceptual) and time
Description of cultural artifacts of
these groups
Relationshipsbetween members
of the group
Collection ofDocuments, Artifacts
Observation: Participant,
Non-participant
Content Analysis Making narratives and interpretations
from supporting evidences
Argumentationmaps Frequency and tally
tables, Bar charts,histograms, pie charts
Concept maps
Traditional/Anthropological
ethnography
Corporate ethnography
Nature, typical features of a
cultural/social groupComparing group withmainstream establishsimilarities/differences
Interviews: Open ended, close
ended, In-depth
Collection ofImages, video
Document Analysis
Hierarchy structures: tree maps, file
structures, relationships
Confections, graphicscripts,
Hypertext narratives
Image Analysis
Hierarchicalrelationships within
groups
Figure 5: The Framework from the Ethnographic Tradition of Enquiry
IV. Data Analysis: Examples include - Document analysis, Content analysis, Network
V. ction Methods - Examples include Interviews, Observations, Participatory
VI. eories: Examples include - Discourse theory, Social network theory
5. Future Directions: Towards an Exploratory Tool l help qualitative researchers to draw
upon it to
eds
It is also important to understand that several drawbacks to the adoption of any kind of compu
so ular in
analysis. Data Collemethods Social Th
After the six step framework is completed, it wil to select visualizations for their research needs. In the next step of this research I plan
test one tradition of inquiry in detail such as Ethnography. I will use different visualization techniques that can be used for different exploratory, analysis, synthesis and presentation neof ethnographers and test them for relevance and effectiveness. This step requires extensive and rigorous testing with constant feedback from users before we can translate it into an exploratory tool.
ter assisted tool by qualitative researchers remain. Some of these challenges include costof the software and training, resistance to learning new software etc. Building current exploratory tools in an open source environment can help overcome the cost factor. Albuilding the software with a user centered design perspective, which is currently very popHuman Centered GIScience can help make it more user friendly and perhaps shorten the learningcurve to a considerable extent.
11
Acknowledgements I would like to thank Dr. Alan MacEachren, my PhD advisor for sharing his knowledge and
ideas with me and helping me in every step of this research. References Al-Kodmany, K. 2001. Bridging the gap between technical and local knowledge: Tools for
promoting community-based planning and design. Journal of Architectural and Planning Research 18 (2):110-130.
———. 2002. Visualization tools and methods in community planning: From freehand sketches to virtual reality. Journal of Planning Literature 17 (2):189-211.
ATLAS.ti - The Knowledge Workbench: A Brief History 2006. 2002-2006 [cited Accessed on April 14 2006.]. Available from http://www.atlasti.com/history.html.
Barry, Christine, A. 1998. Choosing Qualitative Data Analysis Software: Atlas/ti and Nudist Compared. Sociological Research Online 3 (3).
Buzan, T. 1993. The Mind Map Book. London: BBC Books. Coffey, A. Holbrook , and Atkinson P. B. 1996. Qualitative data analysis: technologies and
representations. Sociological Research On-line 1 (1). Cooke, N. J. 1999. Knowledge elicitation. In Handbook of Applied Cognition, edited by F. T.
Durso. UK: Wiley. Cooke, NJ. 1994. Varieties of knowledge elicitation techniques. International Journal of
Human- Computer Studies 41:801-849. Creswell, John W. 1998. Qualitative inquiry and research design : choosing among five
traditions. Thousand Oaks, Calif.: Sage Publications. Davies, C. 1998. Analysing 'work' in complex system tasks: an exploratory study with GIS.
Behaviour & Information Technology 17 (4):218-230. Davies, C., Medyckyj-Scott, D. 1996. GIS users observed. International Journal of
Geographical Information Systems 10 (4):363-384. DiBiase, D. 1990. Visualization in the earth sciences. Earth and Mineral Sciences, Bulletin of the
College of Earth and Mineral Sciences, Penn State University 59 (2):13-18. Dodge M., Kitchin, Rob. 2000. An Atlas of Cyberspaces: Addison-Wesley. Dykes, J. A. 1997. Exploring spatial data representation with dynamic graphics. Computers &
Geosciences 23 (4):345-370. Fekete, J.-D., and N. Dufournaud. 2000. Compus: visualization and analysis of structured
documents for understanding social life in the 16th century. Paper read at Proceedings of the fifth ACM conference on Digital libraries, at San Antonio, Texas, June, pp. 47-55.
Fielding, Nigel, and Raymond M. Lee. 1998. Computer analysis and qualitative research, New technologies for social research. London ; Thousand Oaks, Calif.: Sage.
Francis, Brian, and John Pritchard. 2000. Lexis and the Graphical Representations of Event Histories. Cybergeo 152 (17).
Gahegan, M. 2005. Beyond tools: visual support for the entire process of GIScience. In Exploring Geovisualization, edited by J. D. A. M. M. M.-J. Kraak. Amsterdam: Elsevier Science.
Gahegan, M. , and B. Brodaric. 2002. Computational and visual support for geographical knowledge construction: filling in the gaps between exploration and explanation. Paper
12
read at Advances in Spatial Data Handling: 10th International Symposium on Spatial Data Handling.
Gershon, Nahum, Page, Ward. 2001. What storytelling can do for information visualization. In Communications of the ACM.
Greco, John, F., and Antonio Gonzalez-Walker. 24-25 June 1997. Toward a Unified Visual Representation of Documents and Concepts. Paper read at CODATA Euro-American Workshop Visualization of Information and Data: Where We Are and Where Do We Go From Here?
Haug, Dan, MacEachren, Hardisty. 2001. The Challenge of Analyzing Geovisulization Tool Use: Taking a Visual Approach. Paper read at International Cartographic Congress, at Beijing. China.
Heer, Jeffery, Boyd, Danah. 2005. Vizster: Visualizing Online Social Networks. Information Visualization.
Kelle, Udo, Prien, Gerald, Bird, Katherine, ed. 1995. Computer Aided Qualitative Data Analysis: Theory, Methods and Practice. London: SAGE Publications.
Kwan, M. P. 2002. Feminist visualization: Re-envisioning GIS as a method in feminist geographic research. Annals of the Association of American Geographers 92 (4):645-661.
MacEachren, A., B. Buttenfield, J. Campbell, D. DiBiase, and M. Monmonier. 1992. Visualization. In Geography's Inner Worlds: Pervasive Themes in Contemporary American Geography. New Jersey:: Rutgers University Press.
MacEachren, A. M. and Ganter, J. H. 1990. A pattern identification approach to cartographic visualization. Cartographica 27 (2):64-81.
MacEachren, A. M., M. Gahegan, W. Pike, I. Brewer, G. R. Cai, E. Lengerich, and F. Hardisty. 2004. Geovisualization for knowledge construction and decision support. Ieee Computer Graphics and Applications 24 (1):13-17.
MacEachren, Alan M. 1994. Some truth with maps : a primer on symbolization and design, Resource publications in geography. Washington, D.C.: Association of American Geographers.
Matthews, Stephen, Burton, Linda, Detwiler, Jim. 2001. Viewing people and places: Conceptual and methodological issues in coupling geographical information analysis and ethnographic research. Paper read at GIS and Critical Geographic Research, at Hunter College, New York, 25 February.
Monmonier, M. 1992. Authoring Graphic Scripts - Experiences and Principles. In Cartography and Geographic Information Systems.
Orford, Scott, Dorling, Daniel, Harris, Richard. 1998. Review of Visualization in the Social Sciences: A State of the Art Survey and Report: School of Geographical Sciences, University of Bristol.
Pavlovskaya, Marianna E. 2002. Mapping Urban Change And Changing GIS: Other Views Of Economic Restructuring. Gender, Place and Culture 9 (3).
Rinner, Claus. 1999. Argumentation Maps: GIS-based discussion support for online planning.: GMD Research Series.
Tufte, Edward R. 1983. The visual display of quantitative information. Cheshire, Conn. (Box 430, Cheshire 06410): Graphics Press.
———. 1992. Envisioning information. 3rd printing, with revisions. ed. Cheshire, Conn.: Graphics Press.
13

———. 1997. Visual explanations : images and quantities, evidence and narrative. Cheshire, Conn.: Graphics Press.
Weitzman, Eben A., and Matthew B. Miles. 1995. Computer programs for qualitative data analysis : a software sourcebook. Thousand Oaks, Calif.: Sage Publications.
14