Embed Size (px)
Citation preview
1
DOE/FIU SCIENCE & TECHNOLOGY WORKFORCE DEVELOPMENT PROGRAM
STUDENT SUMMER INTERNSHIP TECHNICAL REPORT For June 2, 2008 to August 8, 2008
Building and Employment of a GUI for a Stochastic Simulation and Optimization Tool Used to Study Cargo Inspection Protocols
Principal Investigators:
Henry Diaz (DOE Fellow Student) Florida International University
Dr. Glenn O. Allgood, Mentor Mohammed M. Olama, Research Associate Terri Rose, Campaign Program Manager
Oak Ridge National Laboratory
Florida International University Collaborator:
Leonel E. Lagos, Ph.D., PMP®
Prepared for:
U.S. Department of Energy Office of Environmental Management
Under Grant No. DE-FG01-05EW07033

ARC-2008-D2540-04-007
ii
DISCLAIMER
This report was prepared as an account of work sponsored by an agency of the United States government. Neither the United States government nor any agency thereof, nor any of their employees, nor any of its contractors, subcontractors, nor their employees makes any warranty, express or implied, or assumes any legal liability or responsibility for the accuracy, completeness, or usefulness of any information, apparatus, product, or process disclosed, or represents that its use would not infringe upon privately owned rights. Reference herein to any specific commercial product, process, or service by trade name, trademark, manufacturer, or otherwise does not necessarily constitute or imply its endorsement, recommendation, or favoring by the United States government or any other agency thereof. The views and opinions of authors expressed herein do not necessarily state or reflect those of the United States government or any agency thereof.
Some of the data analyzed in the internship is considered Sensitive Security Information controlled under 49 CFR (Code of Federal Regulations) parts 15 and 1520. No persons without a “need to know” clearance, as defined under 49 CFR parts 15 and 1520, can see the information without written permission from the Administrator of the TSA or the Secretary of Transportation. So, unfortunately, some of the data used in the research cannot be shown.
ARC-2008-D2540-04-007
iii
ABSTRACT
The Department of Homeland Security (DHS) created the Air Cargo Explosives Detection Pilot Program (ACEDPP) in order to provide critical knowledge to help the Transportation Security Administration (TSA) make future decisions on how to handle air cargo. The ACEDPP will do this by assisting in the technological research and development planning for the nation’s air cargo security infrastructure. Data has been gathered to determine the flow of air cargo and how quickly it must be screened. One of the interests of the DHS is data illustrating the economic and operational impacts of enhancing cargo screening levels in air carriers. At the Oak Ridge National Laboratory (ORNL) Computational Sciences and Engineering division, Dr. Glenn Allgood, with the help of his team, gathered air cargo flow data and later developed a model within Matlab (Simulink) to simulate and derive factors describing the dynamics of air cargo flow based on differing variables such as the number of Transportation Security Administrators (TSA), Airport Terminal Services (ATS) workers, and the percentage of distribution between the different Explosives Detection Systems (ETDs) such as the Explosives Trace Detector (ETD). During the summer of 2008, and under the mentoring of Dr. Allgood, a Florida International University (FIU) student supported and continued the research. The intern helped to develop different model analytics for making the model more realistic and also laid ground work for future developments of the system such as a GUI (graphical user interface) to control it, automatic optimization of the system to minimize time and cost factors, and the aggregation of other variables (along with bundling of the software into a single package) so that it can be provided to other airports. The ten-week student internship was supported by the Department of Energy (DOE)/FIU Science & Technology Workforce Initiative, a program developed by the U.S. DOE’s Environmental Management (DOE-EM) and FIU’s Applied Research Center (FIU-ARC).
ARC-2008-D2540-04-007
iv
TABLE OF CONTENTS
1 Introduction.................................................................................................................................. 1
2 The Model and its Variables ........................................................................................................ 2
2.1 The Simulink Model ......................................................................................................... 2
2.2 TSA Screeners .................................................................................................................. 2
2.3 ATS................................................................................................................................... 2
2.4 ETD................................................................................................................................... 3
2.5 EDS................................................................................................................................... 4
2.6 System Latency and Service Rate..................................................................................... 5
3 Statement of the Problem............................................................................................................. 6
3.1 Realistic Grouping of Parcels in a Queue ......................................................................... 6
3.2 Optimization ..................................................................................................................... 7
4 Solution........................................................................................................................................ 8
4.1 Realistic Grouping of Parcels in a Queue ......................................................................... 8
4.2 Genetic Programming ....................................................................................................... 8
5 Conclusions................................................................................................................................ 10
6 References.................................................................................................................................. 11

ARC-2008-D2540-04-007
v
LIST OF FIGURES
Figure 1. Matlab Simulink model simulating air cargo flow ......................................................... 2
Figure 2. An example of an Explosives Trace Detector (ETD) ..................................................... 3
Figure 3. An example of an Explosives Detection System (EDS) ................................................ 4
Figure 4. An illustration of System Latency and Service Rate....................................................... 5
Figure 5. Illustration of the need for more realistic grouping......................................................... 6
Figure 6. Flowchart for Genetic Programming............................................................................... 9
ARC-2008-D2540-04-007
1
1. INTRODUCTION
This research work has been supported by the DOE/FIU Science & Technology Workforce Initiative, an innovative program developed by the U.S. Department of Energy’s Environmental Management (DOE-EM) and Florida International University’s Applied Research Center (FIU-ARC). During the summer of 2008, a FIU intern spent ten weeks performing a summer internship at Oak Ridge National Laboratory’s (ORNL’s) Computational Sciences and Engineering Division under the supervision and mentoring of Dr. Glenn Allgood. This internship was organized and directed by the Higher Education Research Experience (HERE) and the Oak Ridge Institute for Science and Education (ORISE).
The Department of Homeland Security (DHS) launched the Air Cargo Explosives Detection Pilot Program (ACEDPP) in June 2006 to provide a better understanding of the technological and operational issues associated with detecting hidden persons or explosives, to assist in the technological research and development planning for the nation’s air cargo security infrastructure, and to determine the economic and operational impacts to air carriers from enhanced screening levels. As part of the ACEDPP collaboration between the DHS, the Transportation Administration (TSA) and different national laboratories, ORNL did its part. Data relating to air cargo flow within an airport (which will not be named) was collected to make a model within Matlab, using Simulink, that would accurately describe the nature of the cargo flow based on the number of workers (Transportation Security Administrators, Airport Terminal Services) and the percentage of cargo going to the different Explosives Detection Systems (EDSs). This data was gathered as accurately as possible; in some cases GPS was used to track the time it took for specific packages in the queue to reach their destination. After this model was created, the goal was to create software that could use the model, along with real world data, to optimize the distribution of workers and machines in order to minimize cost and time, while maximizing cargo screening levels.

ARC-2008-D2540-04-007
2
2. THE MODEL AND ITS VARIABLES
2.1 The Simulink Model
After gathering data from the airport, Dr. Glenn Allgood’s team created a Matlab Simulink model which could represent the desired information about the air cargo flow dynamics.
Figure 1. Matlab Simulink model simulating air cargo flow (details not shown for security reasons).
2.2 TSA Screeners
TSA screeners are the backbone of airport inspection. Any inspection device or protocol is their main responsibility as they are the security boundary that must be crossed in order to cause harm. They electronically screen millions of bags for explosives and other dangerous items each day at over 7,000 baggage screening locations and at over 450 airports nationwide. Together with local airports, the TSA constantly fields new equipment and protocols to ensure the latest available technology is used to both screen checked baggage and to maximize efficiency [1]. TSA screeners are very important and need to be well trained; they are, therefore, also more expensive then other workers who deal with cargo inspection.
2.3 ATS
The Airport Terminal Services (ATS) workers take care of everything the TSA screeners don’t. The ATS handle several different aspects of the airports functionality; they take care of passengers, including checking them in, boarding them, and helping them find their lost baggage. They even handle the VIP lounge staffing. They are also the workers handling the fueling of the plane, loading and unloading and marshalling. But the aspect that they handle which is important to this project is their cargo services. Short of inspection, ATS deals with the receiving and delivery of air cargo, along with its loading and unloading on the aircraft. They

ARC-2008-D2540-04-007
3
are extremely important but do not need to be as well trained as TSA screeners and, therefore, are less costly [2].
2.4 ETD
Explosives Trace Detectors (ETDs) are the most widely-available commercial explosives detectors. ETDs analyze wipe samples taken on package surfaces and alarm if the physical characteristics of the residue or particulates match the signature of known explosives material. A common chemical attribute of explosives is the ease with which it adheres to surfaces (i.e., “stickiness”). Even with rigorous cleaning procedures, explosives particulates can remain on surfaces and be easily transferred in small quantities. The presence of a small number of explosives particles can still yield a positive detection result. Advantages of this type of screening include low cost, portability and short training time. When the ETD goes off due to an actual or perceived explosive trace, it is considered an alarm. The alarm rates of the ETD and, later mentioned, EDS are additional variables considered for analysis. In the course of gathering data, all ETD alarms were operational/nuisance alarms. Positive results of the ETD analysis were not an indication of a bomb or other explosives material inside the package but rather an indication of surface characteristics. Another drawback of the ETD is that different particulates of similar size and weight can appear to be the same compound. For this reason, care in handling and cleanliness of work surfaces are important factors in limiting the number of false alarms when operating ETD machines.
Figure 2. An example of an Explosives Trace Detector (ETD) [4].
ARC-2008-D2540-04-007
4
2.5 EDS
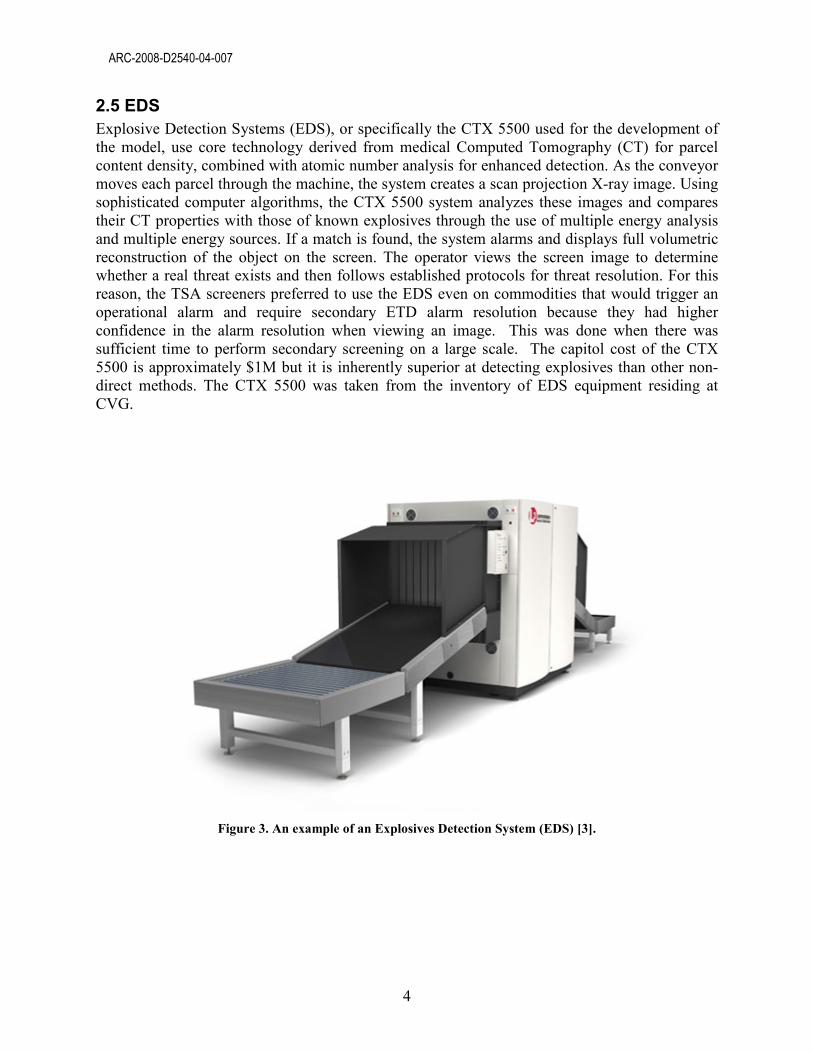
Explosive Detection Systems (EDS), or specifically the CTX 5500 used for the development of the model, use core technology derived from medical Computed Tomography (CT) for parcel content density, combined with atomic number analysis for enhanced detection. As the conveyor moves each parcel through the machine, the system creates a scan projection X-ray image. Using sophisticated computer algorithms, the CTX 5500 system analyzes these images and compares their CT properties with those of known explosives through the use of multiple energy analysis and multiple energy sources. If a match is found, the system alarms and displays full volumetric reconstruction of the object on the screen. The operator views the screen image to determine whether a real threat exists and then follows established protocols for threat resolution. For this reason, the TSA screeners preferred to use the EDS even on commodities that would trigger an operational alarm and require secondary ETD alarm resolution because they had higher confidence in the alarm resolution when viewing an image. This was done when there was sufficient time to perform secondary screening on a large scale. The capitol cost of the CTX 5500 is approximately $1M but it is inherently superior at detecting explosives than other non-direct methods. The CTX 5500 was taken from the inventory of EDS equipment residing at CVG.
Figure 3. An example of an Explosives Detection System (EDS) [3].

ARC-2008-D2540-04-007
5
2.6 System Latency and Service Rate
The model created by Dr. Allgood and his team took the previously mentioned main variables, along with some other parameters such as the adjustment of the alarm rate of the EDS machine, and did several different analysis to come up with a basic overview of the system. Several outputs come out of the system but two of the most important outputs are System Latency and Service Rate.
Figure 4. An illustration of System Latency and Service Rate.
The Matlab Simulink model took the different numbers of TSA screeners and ATS workers and the percentages of parcels going to each EDS machine and used this to analyze a database consisting of 16 days of air cargo flow data. Using this information, a general model of a parcel can be created (Figure 4). The system latency represents the amount of time before the packages are actually done being inspected and can start being taken to the aircraft to be loaded. The service rate represents the rate at which the parcel is actually loaded onto the plane once inspection is done. Using the data tabulated for the 16 days, a graph of this nature (Figure 4) can be created to represent the dynamics of the air cargo as it works its way through ingestion and inspection. Both of these outputs are a function of all the previously mentioned variables and, as such, are subject to change depending on any adjustment of the input.
Parcels
Time
System Latency
Average Slope gives the
Service Rate
ARC-2008-D2540-04-007
6
3. STATEMENT OF THE PROBLEM
3.1 Realistic Grouping of Parcels in a Queue
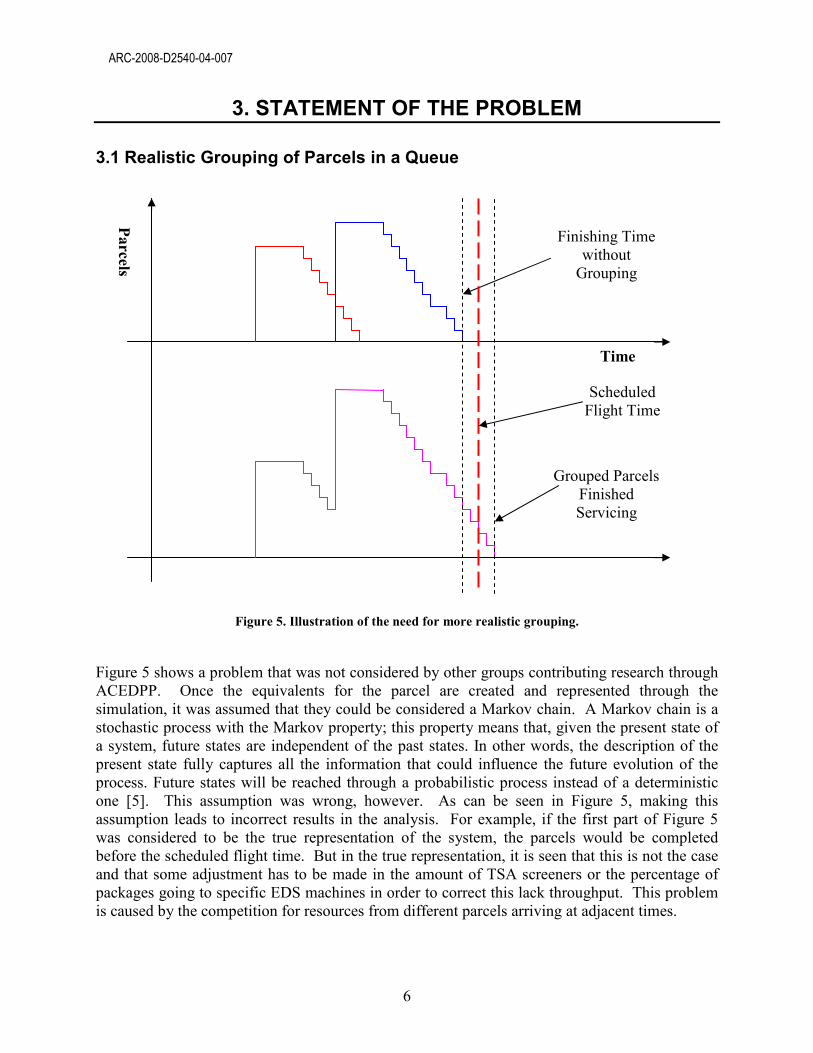
Figure 5. Illustration of the need for more realistic grouping.
Figure 5 shows a problem that was not considered by other groups contributing research through ACEDPP. Once the equivalents for the parcel are created and represented through the simulation, it was assumed that they could be considered a Markov chain. A Markov chain is a stochastic process with the Markov property; this property means that, given the present state of a system, future states are independent of the past states. In other words, the description of the present state fully captures all the information that could influence the future evolution of the process. Future states will be reached through a probabilistic process instead of a deterministic one [5]. This assumption was wrong, however. As can be seen in Figure 5, making this assumption leads to incorrect results in the analysis. For example, if the first part of Figure 5 was considered to be the true representation of the system, the parcels would be completed before the scheduled flight time. But in the true representation, it is seen that this is not the case and that some adjustment has to be made in the amount of TSA screeners or the percentage of packages going to specific EDS machines in order to correct this lack throughput. This problem is caused by the competition for resources from different parcels arriving at adjacent times.
Parcels
Time
Grouped Parcels Finished Servicing
Finishing Time without Grouping
Scheduled Flight Time
ARC-2008-D2540-04-007
7
Realistic modeling of overlapping parcels competing for resources in the queue is crucial for accurate simulation and prediction of necessary resources.
3.2 Optimization
One of the goals of the research performed at ORNL relating to this project was to create an automatic optimization of the system based on the adjustment of the input variables (number of TSA screeners, ATS workers, percentages to EDS and ETD machines, etc.). Because of the number of combinations of variables, not to mention the desire to add more variables in the future, along with the desire to generalize the system for use by several different airlines, a robust optimization technique would be required. The optimization would find the minimum cost solution vector which would give the minimum time for inspection to finish.
ARC-2008-D2540-04-007
8
4. SOLUTION
4.1 Realistic Grouping of Parcels in a Queue
In trying to group the parcels in a queue realistically, an interval was set (around 10 minutes) and all parcels arriving within that interval were considered as one single package at the start time. This improved the realism of the simulation some what but was still faulty in its implementation.
After discussing the issue, it was realized that an algorithm had to be made to automatically group the parcel times in a natural way so that any problems with limited inspection rates could be found and analyzed. This method would go through the system and adjust the parcel distribution correctly as any overlaps are found, and continue to do so if other overlaps where created from the original grouping. In this fashion, a realistic model of time and parcels at any moment could be created and used to compare to scheduled flight times.
4.2 Genetic Programming
Genetic programming is part of an idea for solving problems using the principles of evolution to find solutions. It uses the principles of Darwinian natural selection and biologically inspired operations to manipulate a population of possible solutions to a given problem. The operations include reproduction, crossover (sexual recombination), and mutation based on (or inspired by) the dynamics of actual chromosomes of DNA in living creatures in nature.

ARC-2008-D2540-04-007
9
Figure 6. Flowchart for Genetic Programming [6].
Figure 6 is a flow chart of a generic genetic program. At the beginning of the program, a random population of possible solutions is created, each carrying the “DNA” to their solution with them in an individual structure. After the creation, the population goes through one of several fitness tests done by a fitness function which is related to what you want your program to evolve into. Instead of determining survival by how much food a creature eats or how well it defends or finds a mate for sexual reproduction, the ideal creature in this world is your optimum solution. After each possible solution or “creature” is given a numerical value for their fitness, other genetic operators are performed on them. Reproduction in this situation really just means the keeping of the fittest individual to future generations. Crossover is performed, where the DNA of the possible solution is mixed and matched in a way inspired by the biological crossover of genes. Lastly, a small number of the population is mutated to provide variation. This is done by randomly selecting an individual and changing a randomly selected portion of their specific DNA. After all these things take place, the process is repeated and so as each fitness is evaluated in this manner, a solution evolves from the population.
It was discussed with Dr. Allgood that given the vast quantity of combinations that would arise in the solution vector of the optimization that genetic programming would be a viable selection.

ARC-2008-D2540-04-007
10
5. CONCLUSIONS
Several issues were brought up during the research internship of the FIU student. The issues were all for the creation of a realistic system that can simulate the dynamics of air cargo flow within an airline. Using this model, optimizations can be done which will lower costs (thereby increasing profit) and minimize the time necessary to inspect parcels in an efficient manner. The ramifications of this are serious, as optimizing this model will demonstrate what is necessary to get packages 100% inspected and this can increase security for all airliners if implemented. The benefits will not only be profit for the company but security for all of us. As research on this project is continued, more variables will be added into the optimization in order to make more aspects of flying safer, efficient and cost effective.

ARC-2008-D2540-04-007
11
6. REFERENCES
1. http://www.tsa.gov
2. http://www.atsstl.com/default.asp
3. http://www.dsxray.com/auto_explv_detect/vds108.htm
4. http://www.westafricanaviation.ndo.co.uk/tracedetection.htm
5. S. P. Meyn and R.L. Tweedie, 2005. Markov Chains and Stochastic Stability. Second edition to appear, Cambridge University Press, 2008.
6. http://www.geneticprogramming.com/