Embed Size (px)
Citation preview

Building and Testing a Wind Tunnel
Will Stark
1 Abstract
A wind tunnel has been built to measure drag and downforce of 1:18 scale model cars. The wind tunnel is composed of a contraction cone, test section, and diffuser with the necessary instrumentation to measure the drag and downforce acting on the vehicles. Wind speed can vary from 0 MPH to 20.1 MPH with the use of a variable transformer. Six various body styles have been tested for effectiveness. The highest drag was found when testing a Hummer H2, 0.095 lb., while the lowest drag was found when testing the Ferrari F50 with .021 lb. of drag.
Figure 1: The wind tunnel.
This paper was written for Dr. James Dann’s Applied Science Research class in the spring of 2010.
2 Big Idea
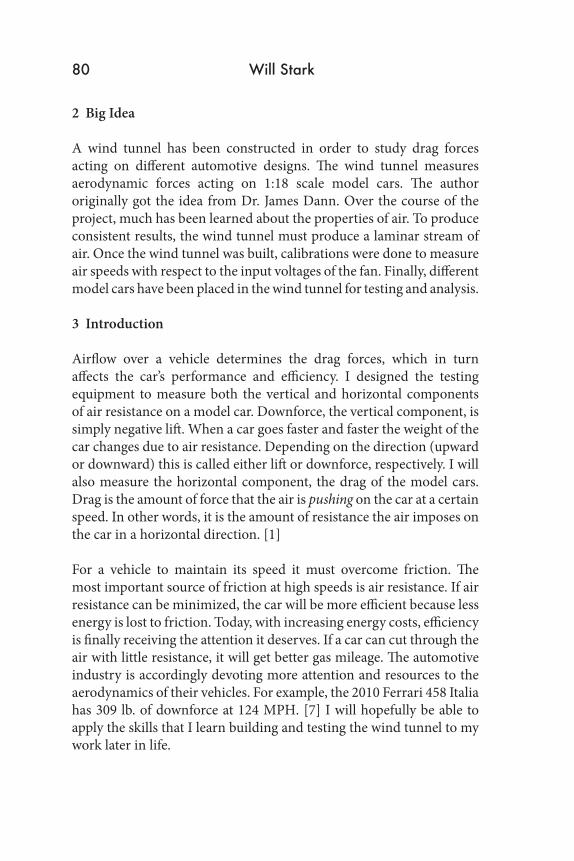
A wind tunnel has been constructed in order to study drag forces acting on different automotive designs. The wind tunnel measures aerodynamic forces acting on 1:18 scale model cars. The author originally got the idea from Dr. James Dann. Over the course of the project, much has been learned about the properties of air. To produce consistent results, the wind tunnel must produce a laminar stream of air. Once the wind tunnel was built, calibrations were done to measure air speeds with respect to the input voltages of the fan. Finally, different model cars have been placed in the wind tunnel for testing and analysis. 3 Introduction
Airflow over a vehicle determines the drag forces, which in turn affects the car’s performance and efficiency. I designed the testing equipment to measure both the vertical and horizontal components of air resistance on a model car. Downforce, the vertical component, is simply negative lift. When a car goes faster and faster the weight of the car changes due to air resistance. Depending on the direction (upward or downward) this is called either lift or downforce, respectively. I will also measure the horizontal component, the drag of the model cars. Drag is the amount of force that the air is pushing on the car at a certain speed. In other words, it is the amount of resistance the air imposes on the car in a horizontal direction. [1]
For a vehicle to maintain its speed it must overcome friction. The most important source of friction at high speeds is air resistance. If air resistance can be minimized, the car will be more efficient because less energy is lost to friction. Today, with increasing energy costs, efficiency is finally receiving the attention it deserves. If a car can cut through the air with little resistance, it will get better gas mileage. The automotive industry is accordingly devoting more attention and resources to the aerodynamics of their vehicles. For example, the 2010 Ferrari 458 Italia has 309 lb. of downforce at 124 MPH. [7] I will hopefully be able to apply the skills that I learn building and testing the wind tunnel to my work later in life.
80 Will Stark

4 Design
There are three components that make up any open system wind tunnel: the contraction cone, test section and diffuser.
The contraction cone is at the front of the wind tunnel; it is responsible for directing air into the test section. The contraction cone’s conical shape and screens help produce a laminar flow of air over the vehicle. The test section is the next component of the system. The clear acrylic construction allows the observer to see the vehicle. The test section also houses all of the testing equipment to measure the aerodynamic forces acting on the cars, notably a scale and force probe.
The diffuser is the last piece of the wind tunnel; it houses the fan. The fan must be placed at the end of the wind tunnel instead of the front to produce a laminar flow of air through the test section. Fans produce a turbulent flow of air just by their nature; the propellers create turbulence. Therefore, it is advantageous to place the fan at the end of the wind tunnel in order to create a vacuum. Pulling the air through the tunnel produces a laminar flow of air. The diffuser’s conical shape also increases the wind speed through the test section. Because the fan is 15” in diameter and the dimensions of the test section are only 8’’ by 8”, air is accelerated through the test section. With any liquid there is a relationship between cross-sectional area and velocity. This is evident in a derived form of Bernoulli’s Principle:
A1V1=A2V2
I can apply this equation to calculate the speeds at all three locations of the wind tunnel: at the diffuser, through the test section, and out the fan. See equations below:
ADiffuserVDiffuser = ATest SectionVTest Section = AFanVFan
(20” x 20”)(VDiffuser) = (8” x 8”)(20.1 MPH) = (7.52π)(VFan)
VDiffuser = 3.2 MPH and VFan = 7.2 MPH
THE MENLO ROUNDTABLE 81

All of the components of the wind tunnel can be seen in Figure 2 and Figure 3. For purposes of portability and storage I have decided to keep the contraction cone, test section and diffuser separate. However, when put together the components must fit together seamlessly. Therefore, I have used rubber gaskets along the contact points. [6] Figures 4-6 illustrate the contraction cone, test section and diffuser.
Figure 2: The wind tunnel (to scale).
Figure 3: The wind tunnel (to scale).
82 Will Stark
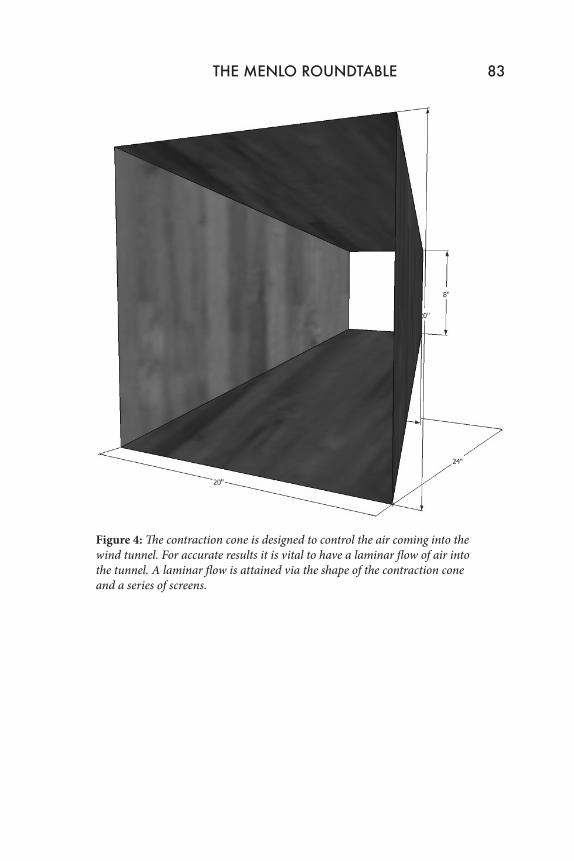
Figure 4: The contraction cone is designed to control the air coming into the wind tunnel. For accurate results it is vital to have a laminar flow of air into the tunnel. A laminar flow is attained via the shape of the contraction cone and a series of screens.
THE MENLO ROUNDTABLE 83

Figure 5: The test section houses the model car in a transparent enclosure. It also serves as the platform for all tests. A scale under the base of the car measures the vertical component of air resistance, downforce. The horizontal component, drag, is measured with a force probe located under the test section. The force probe is connected to the front of the car with a pulley and string.
84 Will Stark

Figure 6: The diffuser houses the fan. The smaller opening through the test section (8’’ x 8’’) makes the speed of the air much greater than it is through the fan (20’’ x 20’’). It is desirable to have high speeds through the test section to have more realistic wind speeds. See design section for more detail on Bernoulli’s Principle.
I designed and built the necessary circuitry to power the fan and measure the voltage going to the fan. I used a variable transformer to adjust the voltage going to the fan from 0-150 V and then correlated the fan voltage with wind speed. I did not use the wind speed probe during testing because it would have produced turbulence. The voltage-adjustment dial on the transformer was very inaccurate, so I decided to measure the voltage with a Vernier LabQuest (see Figure 7). The LabQuest maxes out at a mere 10 V, however. [2] I therefore had to design a circuit that would step down the voltage with a series of fifteen 2,000 Ω resistors (see Figure 8). I chose resistors with a high resistance to limit the current on this part of the circuit, allowing most of the power to go directly to the fan.
THE MENLO ROUNDTABLE 85

Variable Transformer Voltages
Transformer dial (V) Actual (V)0 0.510 13.120 26.630 38.740 50.750 62.060 74.170 84.980 96.590 109.4100 120.9110 131.3120 144.0130 150.0
Figure 7: The voltage difference between what the dial on the transformer showed and the actual output. Notice the increasing spread between the two until 150 V is reached.
Figure 8: Circuit Diagram. This circuit is used to power the fan and measures the voltage going to the fan. The fan and the 15 resistors are connected in parallel to allow their currents to be different. The fan draws much more current than the small 0.0005 A through the 15 resistors. See Ohm’s Law:
V=IR150V = I (2,000 • 15)
I = 0.005 A
86 Will Stark
r

5 Theory
The main objective for wind tunnels is to obtain a laminar flow of air through the test section, that is, a parallel steady flow with uniform speed throughout the section. [3] In the event, this did not prove possible. There will always be some background noise in the system no matter the design.
In a wind tunnel it is desirable to have the highest possible speed with the largest test section. This will reduce noise by giving the test subject more room to bend the air. But high speeds and a large area are competing demands. Therefore, I had to compromise with a test section 8” x 8” and a fan that can push 1,600 cubic feet per minute (CFM). I calculated the speed through the test section to be 51.1 MPH with those parameters. However, with frictional losses the maximum speed I achieved through the wind tunnel is 20.1 MPH.
Designing a wind tunnel for automotive purposes presented some challenges, starting with blockage based on the frontal area. The flow around automobiles is characteristic of “bluff bodies” as opposed to “streamlined bodies” such as an aircraft wing. These bluff bodies result in a sizable region of separated flow. [1] To achieve a smooth parallel flow these separated regions of air must “close” before they exit the diffuser. Otherwise there will be pressure problems inside the test section. This pressure imbalance will cause noise and a large amount of drag after the vehicle. [4] Therefore the test section has a large empty area after the car for the separated flow to join back together. Without this area behind the car, a large amount of turbulence would be produced.
THE MENLO ROUNDTABLE 87

Figure 9: A full-sized Porsche in a wind tunnel. In industry, colored air is used to identify areas of turbulence.
Controlling the stream of air is vital in assuring the accuracy of wind tunnels. Any source of turbulence after the test section will cause distorted results. Turbulences cause separation in the speed of the air. These different speeds then create pressure differences. The only source of turbulence in a wind tunnel should be the model car.
6 Calibration
The wind tunnel needed to be calibrated to ensure its accuracy. To do this I accounted for all error I could measure. The first procedure I performed was correlating the wind speed with the input voltages on the fan. I could then determine wind speed through the tunnel without the need for an anemometer.
88 Will Stark

Figure 10: Voltage to windspeed. Shows the correlation between input voltage for the fan and wind speed through the test section.
I also had to calibrate the scale. Aerodynamic forces were acting on the scale: as wind speed increases, so does the weight that the scale is reading. This is incorrect, so I adjusted all my data to show only the changes in weight due to the aerodynamic forces acting on the cars.
Figure 11: Scale error. Shows how the scale got “lighter” as the wind speed was increased. I adjusted my weights to account for this source of error.
THE MENLO ROUNDTABLE 89

7 Results
I tested six different model cars in the wind tunnel. The various body styles produced different results. I measured both the downforce and drag on each car. Different body styles gave different results. For instance, a bluff body like the Hummer H2 experienced a drag of 0.095 lb. while the sleeker Ferrari F50 only had 0.021 lb. of drag.
Figure 12: The six different cars I decided to test. Varying designs produced different results.
1963 Chevrolet Corvette
1995 Ferrari F50
2004 Porsche Carrera 2005 Hummer H2
2002 Dodge Viper
1964½ Ford Mustang
90 Will Stark

Car Drag (lb.)1963 Chevrolet Corvette 0.0341964½ Ford Mustang 0.0381995 Ferrari F50 0.0212002 Dodge Viper 0.0282004 Porsche Carerra GT 0.0232005 Hummer H2 0.095
Figure 13: Drag measurement for each car. The highest was the Hummer H2 with 0.095 lb.; the lowest was the Ferrari F50 with 0.021 lb.
Downforce/Lift (oz.)At 6 MPH At 8 MPH At 20 MPH
1963 Chevrolet Corvette 0 0 -0.11964½ Ford Mustang +0.2 +0.3 +1.91995 Ferrari F50 0 0 -0.72002 Dodge Viper -0.2 -0.2 -0.92004 Porsche Carerra GT 0 0 -0.82005 Hummer H2 0 +0.4 +0.8
Figure 14: Downforce and lift each vehicle experienced when exposed to 20.1 MPH winds. Note that the Hummer and Mustang got heavier and the other cars became lighter.
Figure 15: Example of some of the data I took. Notice the delay between the fan voltage and the ensuing drag from the increased windspeed.
THE MENLO ROUNDTABLE 91

8 Citations
[1] Low-speed Wind Tunnel Testing: by Jewel Barlow, William Rae, and Alan Pope
[2] Specifications of Vernier LabQuest device: http://www.vernier.com/labquest/techspecs.html
[3] NASA: Build Your Own Wind Tunnelhttp://www.grc.nasa.gov/WWW/K-12/WindTunnel/build.html
[4] Build a Wind Tunnel by Mike Fitzgeraldhttp://www.techdirections.com/BuildAWindTunnel.pdf
[5] TechShophttp://techshop.ws/
[6] Science Buddies: How to Build a Subsonic Wind Tunnelhttp://www.sciencebuddies.org/science-fair-projects/wind-tunnel-toc.shtml
[7] 2010 Ferrari 458 Italia by Jon Yankahttp://www.caranddriver.com/reviews/car/09q3/2010_ferrari_458_italia-official_photos_and_info
9 Acknowledgments
I would like to thank Dr. Dann for the idea of building a wind tunnel and his continued support. I would also like to thank Jordan Jadallah for letting me borrow his model car collection in the name of science.
92 Will Stark