Embed Size (px)
Citation preview

�
Building Applications with BLT
George A. HowlettCadence Design Systems, Inc.
Allentown, Pennsylvania
�
What is BLT? Set of widgets and new commands.
● Extends the Tcl interpreter, no patching required.
Features:● Graph, stripchart, barchart widgets.
● Table geometry manager
● Hierarchical listbox/table widgets.
● Tabbed notebook widget.
● Drag-and-drop facility.
● Container widget.
● Busy command.
● Bgexec command.
●● …things I need for my Tcl/Tk applications. …things I need for my Tcl/Tk applications.
Platforms:● Unix
● Windows 95/98/NT
● Macintosh soon

�
What is BLT?
�
Graphing widgets
Three plotting widgets available:●● graphgraph X-Y coordinate graph.
●● barchartbarchart Displays bars at X-Y coordinates.
●● stripchartstripchart Similar to X-Y graph, extra features.
Many features span across all three widgets.

�
How do I use BLT? Run special shell with statically linked BLT commands.
Dynamically load the BLT package into a vanilla wish.
$ $ bltwishbltwish
$ wish$ wish% package require BLT% package require BLT
�
Where are the BLT commands?
CommandsCommands live in bltblt namespace. ● Not automatically exported into global namespace.
Two ways to access the BLT commands.● Prefix BLT commands with bltblt::::
● Import all the BLT commands into the global namespace.
package require BLTblt::graph .gblt::graph .g
package require BLTnamespace import blt::*namespace import blt::*graph .g
&DQ·W�ILQG�´JUDSKµ�FRPPDQG�LQ�WKH�JOREDO
QDPHVSDFH�
�
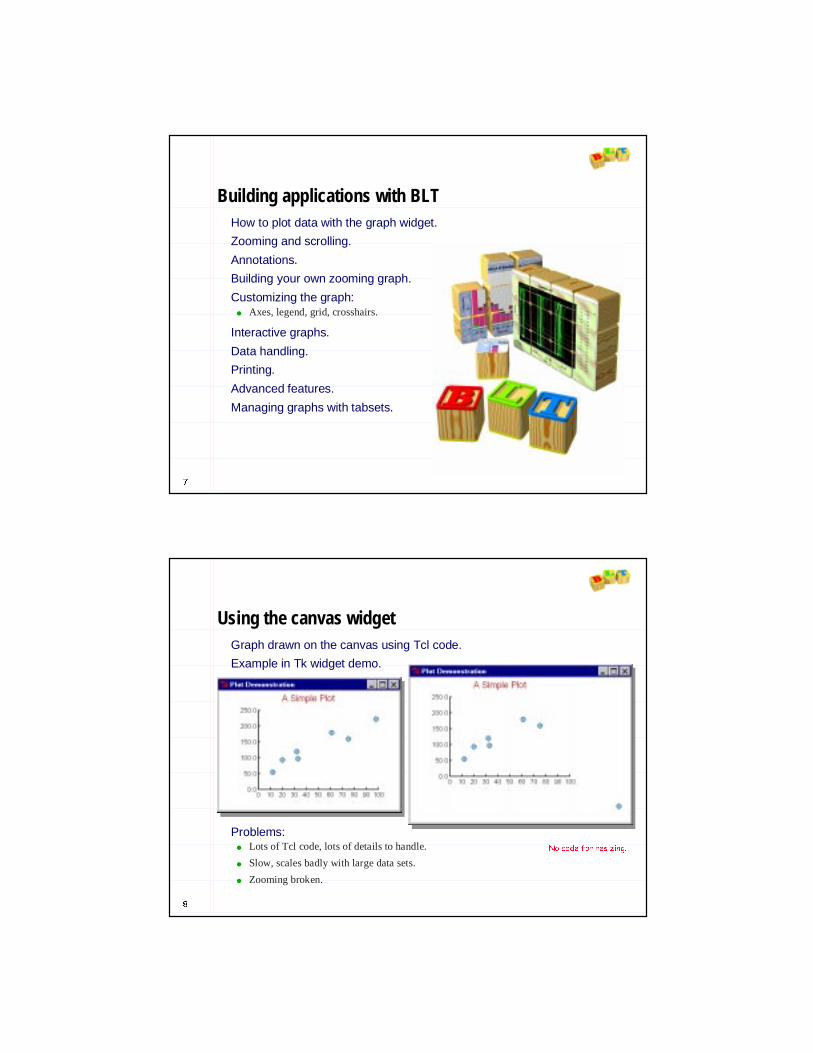
Building applications with BLT How to plot data with the graph widget.
Zooming and scrolling.
Annotations.
Building your own zooming graph.
Customizing the graph: ● Axes, legend, grid, crosshairs.
Interactive graphs.
Data handling.
Printing.
Advanced features.
Managing graphs with tabsets.
�
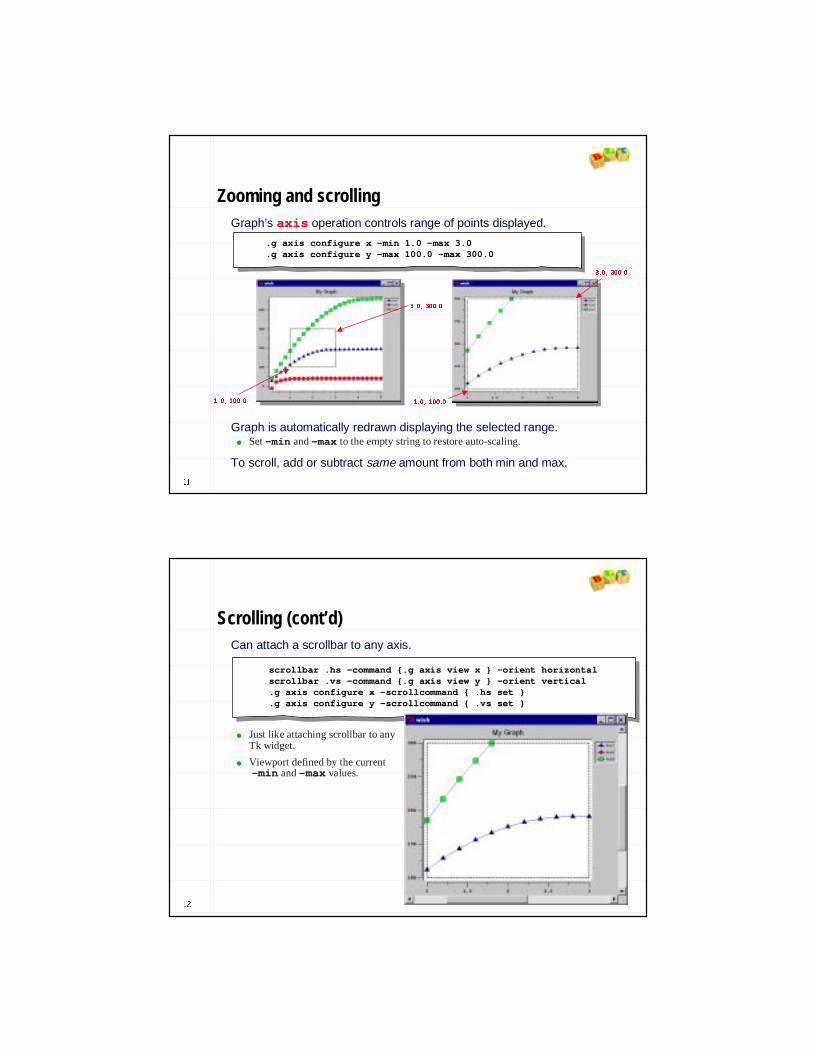
Using the canvas widget Graph drawn on the canvas using Tcl code.
Example in Tk widget demo.
Problems:● Lots of Tcl code, lots of details to handle.
● Slow, scales badly with large data sets.
● Zooming broken.
1R�FRGH�IRU�UHVL]LQJ�

�
Graph widget Create graph widget and add data elements with elementelement operation..
X-Y coordinates are lists of numbers.
Assorted configuration options control element’s appearance.
●● --symbolsymbol
●● --linewidthlinewidth
●● --fillfill
●● --outlineoutline
●● --smoothsmooth
package require BLTnamespace import blt::*graph .g -title ”My Graph”pack .g.g element create .g element create line1line1 -- symbol triangle symbol triangle \\
-- xdata {0.2 0.4 0.6 0.8 1.0 1.2 1.4 1.6 1.8 … } xdata {0.2 0.4 0.6 0.8 1.0 1.2 1.4 1.6 1.8 … } \\-- ydata {2.61825e+01 5.04696e+01 7.28517e+01 … }ydata {2.61825e+01 5.04696e+01 7.28517e+01 … }
Symbol types
��
Data elements Represents a set of data. Symbols are the data points.
Usually drawn as a single trace.
Each element has entry in legend.
Z-ordering● First elements created sit on top of later.
Axes auto-scale● Data determines range of axes.
…….g element create .g element create line2line2 -- symbol circle symbol circle -- fill red fill red \\
-- xdataxdata {0.2 0.4 0.6 0.8 1.0 1.2 1.4 1.6 1.8 … } {0.2 0.4 0.6 0.8 1.0 1.2 1.4 1.6 1.8 … } \\-- ydataydata {{ -- 1.14471e+01 2.09373e+01 2.84608e+01 … }1.14471e+01 2.09373e+01 2.84608e+01 … }
.g element create .g element create line3line3 -- symbol square symbol square -- fill green fill green \\-- xdata {0.2 0.4 0.6 0.8 1.0 1.2 1.4 1.6 1.8 … } xdata {0.2 0.4 0.6 0.8 1.0 1.2 1.4 1.6 1.8 … } \\-- ydata {4.07008e+01 7.95658e+01 1.16585e+02 … }ydata {4.07008e+01 7.95658e+01 1.16585e+02 … }
��
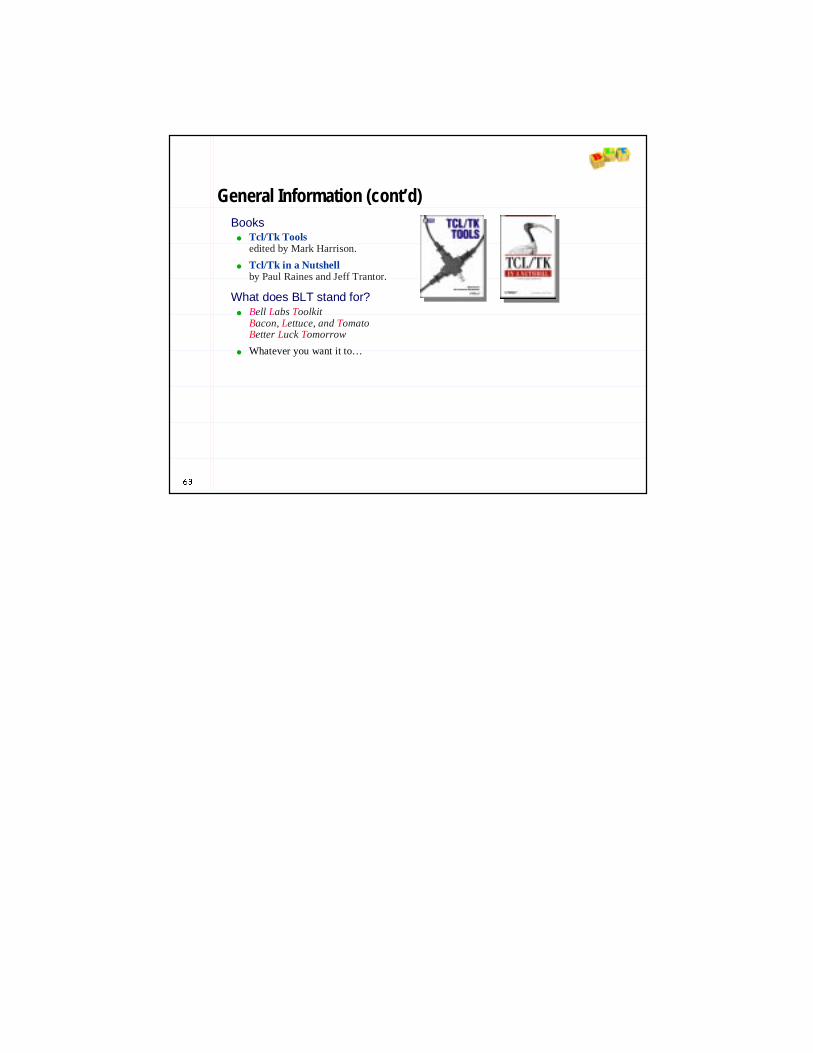
Zooming and scrolling Graph’s axisaxis operation controls range of points displayed.
Graph is automatically redrawn displaying the selected range.● Set --minmin and --maxmax to the empty string to restore auto-scaling.
To scroll, add or subtract same amount from both min and max.
.g axis configure x .g axis configure x --min 1.0 min 1.0 --max 3.0max 3.0
.g axis configure y .g axis configure y --max 100.0 max 100.0 --max 300.0max 300.0
��������������������
��������������������
��������������������
��������������������
��
Scrolling (cont’d) Can attach a scrollbar to any axis.
● Just like attaching scrollbar to anyTk widget.
● Viewport defined by the current--minmin and --maxmax values.
scrollbar .hs scrollbar .hs --command {.g axis view x } command {.g axis view x } --orient horizontalorient horizontalscrollbar .vs scrollbar .vs --command {.g axis view y } command {.g axis view y } --orient verticalorient vertical.g axis configure x .g axis configure x --scrollcommand { .hs set }scrollcommand { .hs set }.g axis configure y .g axis configure y --scrollcommand { .vs set }scrollcommand { .vs set }

��
Customizing axes Assorted options set appearance using axisaxis configureconfigure operation.
--descending yesdescending yes --rotate 90rotate 90 --title ”Y Axis”title ”Y Axis”
-- ticklength ticklength -- 55
-- loose yesloose yes
-- logscale yeslogscale yes -- showticks noshowticks no-- hide yeshide yes
&KDQJHVPDGH�RQ<�D[LVRQO\�
��
TickTick positions and labels also controlled by axis configuration options.
Labels customized by specifying callback proc.
Customizing axes (cont’d)
--subdivisions 5subdivisions 5 --majorticks {150 325}majorticks {150 325}--stepsize 50.0stepsize 50.0 --minorticks {.1 .5}minorticks {.1 .5}
proc FormatTick { widget x } {proc FormatTick { widget x } {if { $x != 0.0 } { return if { $x != 0.0 } { return \\$$x }$$x }return $xreturn $x
}}.g axis configure y .g axis configure y \\
--command FormatTickcommand FormatTick
'RQ·W�PRGLI\�JUDSK�ZLWKLQ�FDOOEDFN�SURF�

��
Annotations MarkersMarkers are used to highlight
or annotate areas.
Six types of markers:● text
● line
● polygon
● bitmap
● image
● window
.g marker create .g marker create texttext --text "Text Marker" text "Text Marker" --rotate 90 rotate 90 \\--coords { 0.5 300 } coords { 0.5 300 } --font { Helvetica 20 } font { Helvetica 20 }
.g marker create .g marker create lineline --coords { 0.7 coords { 0.7 --Inf 0.7 Inf } Inf 0.7 Inf } \\--dashes dash dashes dash --linewidth 2 linewidth 2 --outline red outline red
image create photo myImage -file images/qv100.t.gif.g marker create .g marker create imageimage --image myImage image myImage --coords {2.0 100.0}coords {2.0 100.0}button .g.button -text "Window Marker" -bg dodgerblue.g marker create .g marker create windowwindow --window .g.button window .g.button --coords {3 300}coords {3 300}
0DUNHU�SRVLWLRQV�LQ�JUDSKFRRUGLQDWHV��
��
Example: Zooming graph Already know how to zoom in/out of a graph.
Add test so we can pick corners in any direction.
proc Zoom { graph x1 y1 x2 y2 } {proc Zoom { graph x1 y1 x2 y2 } {if { $x1 > $x2 } { if { $x1 > $x2 } {
$graph axis configure x $graph axis configure x --min $x2 min $x2 --max $x1 max $x1 } elseif { $x1 < $x2 } {} elseif { $x1 < $x2 } {
$graph axis configure x $graph axis configure x --min $x1 min $x1 --max $x2max $x2} } if { $y1 > $y2 } { if { $y1 > $y2 } {
$graph axis configure y $graph axis configure y --min $y2 min $y2 --max $y1max $y1} elseif { $y1 < $y2 } {} elseif { $y1 < $y2 } {
$graph axis configure y $graph axis configure y --min $y1 min $y1 --max $y2max $y2} }
}}proc Unzoom { graph } {proc Unzoom { graph } {
$graph axis configure x y $graph axis configure x y --min {} min {} --max {} max {} }}
&DQ�FRQILJXUH�PRUH�WKDQ�RQH�D[LV�DW�D�WLPH�

��
Zooming graph (cont’d) Create user-selectable zoom region. Drawn with a line marker.
● ButtonPress-1 Selects first corner of zoom region.
● B1-Motion Draws outline. Position is opposite corner of region.
● ButtonRelease-1 Deletes outline, zooms to selected region.
bind .g <ButtonPressbind .g <ButtonPress--1> { 1> { RegionStartRegionStart %W %x %y }%W %x %y }bind .g <B1bind .g <B1--Motion> { Motion> { RegionMotionRegionMotion %W %x %y }%W %x %y }bind .g <ButtonReleasebind .g <ButtonRelease--1> { 1> { RegionEndRegionEnd %W %x %y }%W %x %y }bind .g <ButtonReleasebind .g <ButtonRelease--3> { Unzoom %W }3> { Unzoom %W }
ButtonPressButtonPress��6HOHFW��VW�FRUQHU�
ButtonReleaseButtonRelease��6HOHFW��QG�FRUQHU�
��
Zooming graph (cont’d)
● First corner of region saved in global variables x0x0 and y0y0.
● Line marker can be erased with redrawing graph with --xorxor option.
● Marker coordscoords operation changes line coordinates.
● Delete marker when done.
proc RegionStart { graph x y } {proc RegionStart { graph x y } {global x0 y0global x0 y0$graph marker create line $graph marker create line --coords { } coords { } --name name myLinemyLine \\
--dashes dash dashes dash --xor yes xor yes set x0 $x; set y0 $yset x0 $x; set y0 $y
}}proc RegionMotion { graph x y } {proc RegionMotion { graph x y } {
global x0 y0 global x0 y0 $graph marker coords $graph marker coords myLinemyLine \\
“$x0 $y0 $x0 $y $x $y $x $y0 $x0 $y0”“$x0 $y0 $x0 $y $x $y $x $y0 $x0 $y0”}}proc RegionEnd { graph x y } {proc RegionEnd { graph x y } {
global x0 y0global x0 y0$graph marker delete $graph marker delete myLinemyLineZoom $graph $x0 $y0 $x $yZoom $graph $x0 $y0 $x $y
}}
0DUNHUV�ZLWKRXW�FRRUGLQDWHV�DUHQ·W�GUDZQ�
1DPH�WKH�PDUNHU��VR�ZH�FDQ�UHIHU�WR�LW�
�[���\��[���\�
�[��\�[��\

��
Converting to/from graph coordinates Example doesn’t work. Need to translate screenscreen to graphgraph coordinates.
● Mouse location is in screen coordinates (relative to the widget).
● Markers are positioned in graph coordinates.
proc RegionStart { graph x y } {set x [$graph axis invtransform x $x]set x [$graph axis invtransform x $x]set y [$graph axis invtransform y $y]set y [$graph axis invtransform y $y]…
}proc RegionMotion { graph x y } {
set x [$graph axis invtransform x $x]set x [$graph axis invtransform x $x]set y [$graph axis invtransform y $y]set y [$graph axis invtransform y $y]…
}
# Screen to graph coordinatesset graphX [.g axis invtranform x $screenX]set graphX [.g axis invtranform x $screenX]
# Graph to screen coordinatesset screenX [.g axis transform x $graphX]set screenX [.g axis transform x $graphX]
��
Zooming graph (cont’d) Can recursively zoom further and further in.
Add feature: Stack zoom levels so user can pop back to previous zoom.
set zoomStack {}set zoomStack {}proc Zoom { graph x1 y1 x2 y2 } {
PushZoom $graphPushZoom $graph……busy hold $graph ; update ; busy release $graphbusy hold $graph ; update ; busy release $graph
}proc Unzoom { graph } {
if { ![EmptyZoom] } { eval [PopZoom] }if { ![EmptyZoom] } { eval [PopZoom] }busy hold $graph ; update ; busy release $graphbusy hold $graph ; update ; busy release $graph
}
8VH�7FO�OLVW�DV�]RRP�VWDFN�
%XV\�FRPPDQG�SUHYHQWV�DFFLGHQWDO�]RRP�XQ]RRP�

��
Zooming graph (cont’d) Create zoom stack. Push/pop graph commands to restore axis ranges.
proc PushZoom { graph } {proc PushZoom { graph } {global zoomStackglobal zoomStackset x1 [$graph axis cget x set x1 [$graph axis cget x --min]min]set x1 [$graph axis cget x set x1 [$graph axis cget x --max]max]set y1 [$graph axis cget y set y1 [$graph axis cget y --min]min]set y2 [$graph axis cget y set y2 [$graph axis cget y --max]max]set cmd ”set cmd ” $graph axis configure x $graph axis configure x -- min $x1 min $x1 -- max $x2 ;max $x2 ;
$graph axis configure y $graph axis configure y -- min $y1 min $y1 -- max $y2max $y2 ””lappend zoomStack $cmdlappend zoomStack $cmd
}}proc PopZoom {} {proc PopZoom {} {
global zoomStackglobal zoomStackset cmd [lindex $zoomStack end]set cmd [lindex $zoomStack end]set zoomStack [lreplace $zoomStack end end]set zoomStack [lreplace $zoomStack end end]return $cmdreturn $cmd
} } proc EmptyZoom {} {proc EmptyZoom {} {
global zoomStackglobal zoomStackexpr {[llength $zoomStack] == 0}expr {[llength $zoomStack] == 0}
}}
*HW�FXUUHQW�D[LV�UDQJHV�
6WDFN�FRPPDQGV�WR�UHVWRUHWR�FXUUHQW�]RRP�OHYHO�
3RS�ODVW�FRPPDQGRII�DQG�UHPRYH�LW�
��
Legend legendlegend component controls position/appearance of legend.
graphgraph legendlegend configureconfigure ??option value...option value...? ?
--position rightposition right --position leftposition left --position topposition top --position bottomposition bottom
--position plotarea position plotarea --hide yeshide yes--raised yesraised yes--position @450,100position @450,100

��
Grids gridgrid component controls appearance of built-in grid.
● Extensions of major/minor ticks of each axis running across the plotting area.
--hide nohide no --color lightbluecolor lightblue --dashes 0dashes 0
--mapy {}mapy {}--mapx {}mapx {} --minor nominor no
��
Crosshairs crosshairscrosshairs component controls position/appearance of crosshairs.
● Two intersecting lines (one vertical and one horizontal) running across plotting area.
● Used to finely position mouse in relation to coordinate axes.
--dashes dashdashes dash --position @450,100position @450,100--hide nohide no --color redcolor red
.g crosshairs on.g crosshairs on
.g crosshairs configure .g crosshairs configure --color red color red --dashes 2dashes 2
bind .g <Motion> {bind .g <Motion> {.g crosshairs configure .g crosshairs configure --position @%x,%yposition @%x,%y
}}

��
Interactive graphs Zooming graph example of interactive graph.
All graph widgets/plotting packages draw graphs.● Convert data points to screen pixels.
● Graphs better on paper. Higher resolution.
Two-way communication (back annotation) lets graph become powerful tool.● Convert screen coordinates back to data points.
● Examples: identify data points, compute slopes, area under curve, etc.
��
Identifying data points Elements have closestclosest operation to identify points/traces.
graphgraph elementelement closestclosest xx yy varNamevarName ??optionsoptions? ?? ?elemNameelemName…?…?
Writes information into a Tcl array variable.●● namename Name of closest element.
●● distdist Distance from element.
●● indexindex Index of closest data point.
●● xx and yy The X-Y graph coordinates of the closest point.
Options:●● --halohalo Selects cut-off radius from screen coordinate.
●● --interpolateinterpolate Search for closest point on trace, not just data points.
.g element closest 300 400 .g element closest 300 400 myInfomyInfo
.g element closest 200 400 .g element closest 200 400 myInfomyInfo --halo 1.0ihalo 1.0i
.g element closest 1 40 .g element closest 1 40 myInfomyInfo --interpolate yesinterpolate yes
.g element closest 20 10 .g element closest 20 10 myInfomyInfo line2 line1line2 line1
puts “puts “ $$myInfomyInfo (name)(name) is closest at is closest at $$myInfomyInfo (index)(index) ””
5HWXUQV�´�µ�LI�DFORVHVW�HOHPHQW
LV�IRXQG��RWKHUZLVH�´�µ�

��
Binding to graph components You can bindbind to elements, markers, and legend entries.
● Similar to binding to canvas items.
● Can bind to mouse and key events, create binding tags, etc.
Find currently selected item using getget operation.
.g .g elementelement bindbind line1line1 <Enter> { <Enter> { puts ”Touched element”puts ”Touched element”
}}.g .g markermarker bindbind myLinemyLine <Enter> { <Enter> {
puts ”Touched marker” puts ”Touched marker” }}.g .g legendlegend bindbind line1line1 <ButtonPress<ButtonPress -- 1> { 1> {
puts ”selected line1” puts ”selected line1” }}
set elem [.g element get current]set elem [.g element get current]set marker [.g marker get current]set marker [.g marker get current]set elem [.g legend get current]set elem [.g legend get current]
(DFK�FRPSRQHQW�KDV�LWVRZQ�bindbind RSHUDWLRQ�
��
Example: active legend How do you display many elements?
● Typical to have lots of elements.
● Rotating colors/line styles doesn’t help.
● Clutter hides behavior of data.
Let user interactively highlight elements.● Draw all elements the same style.
● Moving mouse over element highlights legend entry.
● Clicking on entry highlights its element.

��
Active legend (cont’d)
Binding tag allall is automatically set for elements, markers, legend entries.
Can include/exclude tags with --bindtagsbindtags configuration option.
● Element and marker tags reside in different tables.
● Legend uses element’s tags.
.g element bind .g element bind allall <Shift<Shift--Enter> { Enter> { HighlightHighlight %W [%W element get current] %W [%W element get current]
}}.g element bind .g element bind allall <Shift<Shift--Leave> { Leave> {
UnhighlightUnhighlight %W [%W element get current]%W [%W element get current]} } .g legend bind .g legend bind allall <ButtonPress<ButtonPress--1> { 1> {
HighlightHighlight %W [%W legend get current]%W [%W legend get current]}}.g legend bind .g legend bind allall <ButtonRelease<ButtonRelease--1> {1> {
UnhighlightUnhighlight %W [%W legend get current]%W [%W legend get current]}}
.g element configure line1 .g element configure line1 --bindtags { myTag bindtags { myTag allall }}
.g marker configure myLine .g marker configure myLine --bindtags { myTag bindtags { myTag allall }}
��
Active legend (cont’d) Both legend and elements have activateactivate and deactivatedeactivate operations.
When active:● Legend entry drawn with --activebackgroundactivebackground color.
● Element is drawn with active colors, on top of plot (regardless of Z-order).
proc Highlight { graph elem } {proc Highlight { graph elem } {$graph $graph elementelement activateactivate $elem$elem$graph $graph legendlegend activateactivate $elem$elem
}}proc Unhighlight { graph elem } {proc Unhighlight { graph elem } {
$graph $graph elementelement deactivatedeactivate $elem$elem$graph $graph legendlegend deactivatedeactivate $elem$elem
}}

��
Data handling Managing large sets of X-Y coordinate data as Tcl lists is slow, cumbersome.
● Doesn’t scale. Ok for demos, not for real life problems.
Problems:● Two representations of data.
á Tcl lists representing X and Y coordinate vectors.
á Internal binary format (doubles) stored in graph widget.
● String-to-binary conversions are expensive.
á Often, data starts in binary format. Converted to strings, just to be converted back to doubles.
● Widget doesn’t have data analysis operations.
á Data trapped inside of widget.
���HOHPHQWV����[�YDOXHV����\�YDOXHV���������������
�������6WULQJ�WR�GRXEOH�FRQYHUVLRQV
'RQ·W�WKH\�DOO�KDYH�WKH�VDPH�[�YDOXHV"
��
Vectors VectorVector is a data object.
● Represents array of doubles.
Access data via either Tcl command or array variable.● Creating vector automatically creates both new Tcl command and array.
Recognized by graph widgets.● Can be used instead of lists of numbers.
● Graph automatically redraws when vector is changed.
● Data is shared. More than one graph can use same vector.
vectorvector createcreate xxxx set { 0 1eset { 0 1e--10 2e10 2e--10 3e10 3e--10 4e10 4e--10 5e10 5e--10 6e10 6e--10 7e10 7e--10 8e10 8e--1010
9e9e--10 1e10 1e--09 1.1e09 1.1e--09 1.2e09 1.2e--09 1.3e09 1.3e--09 1.4e09 1.4e--09 1.5e09 1.5e--09 … }09 … }puts [puts [ xx length]length]puts puts $x(0)$x(0)
vector create vector create xxvector create vector create yyxx set {…}set {…}yy set {…}set {…}.g element configure .g element configure -- xdataxdata xx -- ydataydata yy
9DULDEOH�E\�WKH�VDPH�QDPH�DV�YHFWRU�LV�DOVR�FUHDWHG
1HZ�7FO�FRPPDQGE\�WKH�
VDPH�QDPHDV�YHFWRULV�FUHDWHG�

��
Vectors: array interface Can access vector data via Tcl array variable.
● Arrays indexed by integers, starting from 0.
● Special indices (user-defined ones can be added):
endend Returns the last value.
++end++end Automatically appends new slot to vector. Index of new slot.
minmin Returns the minimum value.
maxmax Returns the maximum value.
● Range of elements can be specified (with colons).
vector create vector create xx(50)(50)set set x(0)x(0) 20.020.0set set x(end)x(end) 30.030.0set set x(++end)x(++end) 31.031.0puts ”Range of values: puts ”Range of values: $x(min)$x(min) to to $x(max)$x(max) ””puts ”First twenty values are puts ”First twenty values are $x(0:19)$x(0:19) ””set set x(40:50)x(40:50) -- 11
&DQ�VSHFLI\�LQLWLDO�YHFWRU�VL]H�$OO�YDOXHV�GHIDXOW�WR�����
��
Vectors: command interface Tcl command associated with vector has several operations:
●● append append Appends the lists of values or other vectors.
●● binreadbinread Reads binary data into vector.
●● deletedelete Deletes elements by index.
●● dupdup Creates a copy of vector.
●● exprexpr Computes vector expressions.
●● lengthlength Queries or resets number of elements.
●● mergemerge Returns list of merged elements of two of more vectors.
●● rangerange Returns values of vector elements between two indices.
●● searchsearch Returns indices of a specified value or range of values.
●● seqseq Generates a sequence of values.
●● sortsort Sorts the vector. If other vectors are listed, rearranged in same manner.
●● variablevariable Maps a Tcl variable to vector.
proc myProc { vector } {$vector variable $vector variable xxset x(0) 20.0set x(end) 30.0
}
.LQG�RI�OLNH�´XSYDUµ���5HPDSV�WKH�YHFWRU·V�YDULDEOH�WR�WKH�ORFDO�YDULDEOH�´[µ�

��
Vectors: expressions Vector’s exprexpr operation does both scalar and vector math.
● Arithmetic operators ++-- * / * / ^̂ %%
● Logic operators == != ! && || < > <= >=== != ! && || < > <= >=
● Math functions absabs acos asin atanacos asin atan ceilceil cos coshcos cosh exp floorexp floorhypothypot log log10 sin log log10 sin sinh sqrt sinh sqrt tan tan tanhtanh
● Addition functions adevadev kurtosis length max mean median minkurtosis length max mean median minnorm prod q1 q3 random roundnorm prod q1 q3 random round srandom sdevsrandom sdevskew sort skew sort varvar
Can build data analysis routines from vector expressions.● Fast. Computes vector expressions in C, not Tcl.
xx exprexpr { { xx + 1 }+ 1 }xx exprexpr { { xx + + yy }}xx expr expr { { xx * (* (yy + 1)}+ 1)}xx expr expr { sin({ sin(xx) + ) + coscos((yy) + sin($number) }) + sin($number) }
set sum [vector set sum [vector expr expr sum(sum(xx)])]
��
Graphs and vectors Graph widgets accept vectors instead of Tcl lists for data.
● Two different graphs can share the same vectors.
Graphs automatically notified/redrawn when vector changes.
● No code needed to reconfigure the graph elements.
vector create vector create xxvector create vector create yygraph .g1graph .g1graph .g2graph .g2.g1 element create line1 .g1 element create line1 --xdataxdata xx --ydataydata yy.g2 element create line1 .g2 element create line1 --xdata xdata xx --ydata ydata yy
set set xx(0) 2.0(0) 2.0set set yy(0) 3.2(0) 3.2

��
Vectors: C API C API also exists for vectors.
● Read data from special file format.
● Custom data analysis routines.
● Fast graph updates.
Example: Load data from C.● Add new Tcl command LoadDataLoadData to call vector C API.
Use two vector C API functions:BltBlt__GetVectorGetVector Retrieves an existing vector.
BltBlt__ResetVectorResetVector Resets the vector data and notifies graphs.
vector create vector create xxvector create vector create yygraph .g.g element create line1 -xdata xx -ydata yy……LoadDataLoadData x yx y
��
Example: writing to vectors#include “#include “ tcltcl .h”.h”#include “#include “ bltblt .h”.h”static int static int LoadDataCmdLoadDataCmd (ClientData clientData, Tcl_Interp *interp, int argc, char **arg(ClientData clientData, Tcl_Interp *interp, int argc, char **arg v) v) {{
BltBlt _Vector *_Vector * xVecxVec , *, * yVecyVec ;;double *x, *y;double *x, *y;if (if ( BltBlt __GetVectorGetVector (interp, argv[1], &(interp, argv[1], & xVecxVec ) != TCL_OK) {) != TCL_OK) {
return TCL_ERROR;return TCL_ERROR;}}if (if ( BltBlt __GetVectorGetVector (interp, argv[2], &(interp, argv[2], & yVecyVec ) != TCL_OK) {) != TCL_OK) {
return TCL_ERROR;return TCL_ERROR;}}x = (double *)x = (double *) mallocmalloc (( sizeofsizeof (double) * 1000); (double) * 1000); y = (double *)y = (double *) mallocmalloc (( sizeofsizeof (double) * 1000); (double) * 1000); /* Fill the arrays *//* Fill the arrays */if (if ( BltBlt __ResetVectorResetVector (interp, (interp, xVecxVec , x, 100, 1000, TCL_DYNAMIC) != TCL_OK) {, x, 100, 1000, TCL_DYNAMIC) != TCL_OK) {
return TCL_ERROR;return TCL_ERROR;}}if (if ( BltBlt __ResetVectorResetVector (interp, (interp, yVecyVec , y, 100, 1000, TCL_DYNAMIC) != TCL_OK) {, y, 100, 1000, TCL_DYNAMIC) != TCL_OK) {
return TCL_ERROR;return TCL_ERROR;}}return TCL_OK;return TCL_OK;
}}
$UUD\V�RI�GRXEOHV�
��HOHPHQWV�XVHG� ��HOHPHQWV�LQ�DUUD\�
DUJY>�@��LV�´[µ
DUJY>�@�LV�´\µ

��
Example: reading from vector Vector token really pointer to actual vector, not a copy (so be careful).
Use macros to access vector fields: ●● BltBlt__VecDataVecData, , BltBlt__VecLengthVecLength,, BltBlt__VecSizeVecSize
#include “#include “ tcltcl .h”.h”#include “#include “ bltblt .h”.h”static intstatic intGetDataCmdGetDataCmd (ClientData clientData, Tcl_Interp *interp, int argc, char **arg(ClientData clientData, Tcl_Interp *interp, int argc, char **arg v) v) {{
BltBlt _Vector *_Vector * xVecxVec ;;double *x;double *x;int size, length, n;int size, length, n;if (if ( BltBlt __GetVectorGetVector (interp, argv[1], &(interp, argv[1], & xVecxVec ) != TCL_OK) {) != TCL_OK) {
return TCL_ERROR;return TCL_ERROR;}}x =x = BltBlt __VecDataVecData (( xVecxVec ););length =length = BltBlt __VecLengthVecLength (( xVecxVec ););size =size = BltBlt __VecSizeVecSize (( xVecxVec ););for (n = 0; n < length; n++) {for (n = 0; n < length; n++) {
/* Do something with data *//* Do something with data */printfprintf (“#%d is %f(“#%d is %f \\ n”, n, x[n]);n”, n, x[n]);
}}printfprintf (“There are %d free slots left(“There are %d free slots left \\ n”, size n”, size -- length);length);return TCL_OK;return TCL_OK;
}}
,I�\RX�FKDQJH�WKH�DUUD\��\RX�PXVW�FDOO�%OWB5HVHW9HFWRU�
��
Printing graphs Graph’s postscriptpostscript operation generates encapsulated PostScript.
● File name is optional. PostScript is returned as the result of outputoutput operation.
● Other options control graph, border, and paper size.
.g postscript configure .g postscript configure --landscape yes landscape yes --maxpectmaxpect yesyes
.g postscript output .g postscript output myFilemyFile..psps
--center yescenter yes --landscape yes landscape yes --maxpect maxpect yesyes --decorations nodecorations no

��
Printing under Windows 95/NT printerprinter command lets you send raw EPS to a PostScript printer.
Query printer settings with getattrgetattr operation. Written to array variable.
Adjust printer settings with setattrsetattr operation.
set output [.g postscript output]set output [.g postscript output]set set pidpid [printer open {QMS [printer open {QMS ColorScriptColorScript 100 v49.4}]100 v49.4}]printer write printer write $$pidpid $output$outputprinter close printer close $$pidpid
set pid [printer open {QMS ColorScript 100 v49.4}]printer printer getattrgetattr $$pidpid myArraymyArrayputs “Paper size is puts “Paper size is $$myArraymyArray (( PaperSizePaperSize )) ””puts “Page orientation is puts “Page orientation is $$myArraymyArray (Orientation)(Orientation) ””
set set myArraymyArray (( PaperSizePaperSize )) LetterLetterset set myArraymyArray (Orientation)(Orientation) LandscapeLandscapeprinter printer setattrsetattr $$pidpid myArraymyArrayprinter write $pid $outputprinter close $pid
��
Printing to non-PS printers Graph has two Windows-specific print operations (still experimental).
print1print1● Write bitmap image to printer.
● Usually works regardless of printer capabilities.
● Poorer quality. Jagged lines and fonts.
print2print2● Draws directly to print device.
● Might not work on all printers.
● Quality is much better.
set pid [printer open {QMS ColorScript 100 v49.4}].g print1 .g print1 $$pidpidprinter close $pid
set pid [printer open {QMS ColorScript 100 v49.4}].g print2 .g print2 $$pidpidprinter close $pid

��
Customized printing How do I tile graphs on a single a page?
● Graph outputs only a single plot.
New epseps canvas item places EPS files. ● Reads preview image format output by graph.
● Prints item using encapsulated PostScript, not screen image.
● EPS is scaled/translated accordingly to matchcanvas item.
● Use canvas code as template for tiling, etc.
● Regular canvas items for annotations.
canvas .c -width 6.75i -height 5.25i -bg white.c create .c create epseps 10 620 10 620 --filefile xyxy..psps --anchor anchor swsw.c create.c create epseps 500 10 500 10 --file g1.file g1.psps --width 300 width 300 --height 300height 300.c create.c create epseps 500 320 500 320 --file out.file out.psps --width 300 width 300 --height 300height 300.c create text 20 200 -text "This is a text item" \
-anchor w -font { Helvetica 24 bold }.c create rectangle 10 10 50 50 -fill blue.c create rectangle 50 50 150 150 -fill green -outline red
��
EPS item (cont’d) epseps item usually drawn as filled rectangle on canvas.
● Ok for tiling or page templates.
● Not very good for interactive layout.
But can also display EPSI preview image. ● Poorer quality: bitmap or grayscale (graph only).
● Must generate preview for EPS file.
Better: use Tk photo image.● Full color image.
● Must supply photo image for epseps item to display.
● Use graph’s snapsnap operation to get snapshot of graph.
set set imageimage [image create photo][image create photo]
.g snap .g snap $image$image
.g postscript output.g postscript output myFilemyFile..psps
.c create.c create epseps 500 10 500 10 --file file myFilemyFile..psps --image image $image$image
,PDJH�RI�JUDSK�GUDZQ�LQWR�SKRWR�
%HWWHU�WKDQ�VQDSSLQJ�JUDSK�ZLQGRZ�

��
Graph: advanced features Mirror axes.
Virtual axes.
Pens and weights.
Controlling graph margins.
��
Graph: advanced features Can display more than 2 axes.
● Axis names are xx, yy, x2x2, and y2y2.
●● x2x2 and y2y2 are hidden by default.
Elements, markers, and grids are mapped to specific axes.
● Mapped to xx and yy by default.
●● --mapxmapx and --mapymapy switch axes.
Mirror axes: Use axisaxis limitslimits operation to get current axis range.
.g axis configure .g axis configure x2 y2x2 y2 --hide nohide no
.g element configure line1 .g element configure line1 --mapxmapx x2x2 --mapymapy y2y2
.g marker configure .g marker configure myLinemyLine --mapxmapx x2x2 --mapymapy y2y2
.g grid configure .g grid configure --mapxmapx x2x2 --mapymapy y2y2
set lx [.g axis limits set lx [.g axis limits xx] ] set set lyly [.g axis limits [.g axis limits yy]].g axis configure .g axis configure x2x2 --min [min [lindexlindex $lx 0] $lx 0] --max [max [lindexlindex $lx 1]$lx 1].g axis configure .g axis configure y2y2 --min [min [lindex lindex $$lyly 0] 0] --max [max [lindex lindex $$lyly 1]1]
[�
\�
5HWXUQV�OLVW�RI�PLQ�DQG�PD[�OLPLWV�

��
Advanced features (cont’d) Graph also supports virtualvirtual axesaxes.
● Create any number of new axes.
● Axis minimum and maximum displayedin plotting area.
● Limits string is floating-point format descriptor.
● Can replace normal axes with xaxisxaxis, yaxisyaxis, x2axisx2axis, and y2axisy2axis operations.
●● useuse operation maps one or more axes.
.g axis create .g axis create axis1axis1 --title “My Axis #1” title “My Axis #1” -- limits “%g” limits “%g” \\-- limitscolorlimitscolor red red -- limitsshadowlimitsshadow red4red4
.g axis create .g axis create axis2axis2 -- limits “%4.2f” limits “%4.2f” -- limitscolorlimitscolor purple purple \\-- limitsshadowlimitsshadow purple4purple4
.g axis configure axis1 axis2 .g axis configure axis1 axis2 -- limitsfont limitsfont {Helvetica 12}{Helvetica 12}
.g element configure line1 .g element configure line1 -- mapymapy axis1axis1
.g element configure line2 .g element configure line2 -- mapy mapy axis2axis2
.g .g xaxisxaxis use use axis1axis1
��
Advanced features (cont’d) Each element has its own default penpen.
● Represents element’s symbol, color, line style, etc.
Can create new pens and swap them in/out of elements.
All elements use a standard “active” pen (activateactivate operation).●● activeLineactiveLine graph, stripchart widgets
●● activeBaractiveBar barchart
.g pen create .g pen create pen1pen1 --symbol circle symbol circle --color blue color blue --linewidthlinewidth 22
.g pen create .g pen create pen2pen2 --symbol cross symbol cross --color red color red
.g element configure line1 .g element configure line1 --pen pen pen1pen1
.g element configure line2 .g element configure line2 --pen pen pen2pen2
.g pen configure .g pen configure pen1pen1 --color yellowcolor yellow (OHPHQW�LV�UHGUDZQ�ZLWK�QHZ�FRORU�
.g pen configure .g pen configure activeLineactiveLine --linewidthlinewidth 0 0 --symbol squaresymbol square
.g element configure .g element configure --activepen activepen pen1pen1

��
Advanced features (cont’d) Data elements can use moremore than one pen at a time.
● Highlight outliers, unexpected values, etc.
Each element has a weightweight vector. ● Weight values correspond to a data points.
● Set --weightweight option. Like --xdataxdata or--ydataydata options, takes vector or Tcl list.
●● --stylesstyles option maps pens to data points according to weight value.
● Default pen used if weight doesn’t match anyrange.
.g pen create .g pen create pen1pen1 --color red color red --symbol circle symbol circle --outline blackoutline black
.g pen create .g pen create pen2pen2 --symbol none symbol none
.g element configure line1 .g element configure line1 --weight weight y y --stylesstyles { { {{pen1pen1 --5 50} {5 50} {pen2pen2 100 175} {100 175} {pen1pen1 175 500}175 500}
}}
SHQ�
SHQ�
'HIDXOW�SHQ�SHQ�
��
Advanced features (cont’d) MarginsMargins automatically calculated (based on axis values, etc.)
Sometimes want to override computed values:● You can reset margins with --leftmarginleftmargin, -rightmarginrightmargin, --topmargintopmargin, and
--bottommarginbottommargin graph configuration options.
● Useful when displaying graphs side-by-side.
To determine current margin:● Graph’s extentsextents operation reports margin sizes.
● Options --leftvariableleftvariable, --rightvariablerightvariable, --topvariabletopvariable, and --bottomvariable bottomvariable specify variables, set when margins are updated.
.g1 configure .g1 configure --leftvariableleftvariable leftlefttrace variable left w trace variable left w UpdateMarginsUpdateMarginsprocproc UpdateMargins UpdateMargins { p1 p2 how } {{ p1 p2 how } {
global leftglobal left.g2 configure .g2 configure --leftmargin leftmargin $left$left.g3 configure .g3 configure --leftmargin leftmargin $left$left.g4 configure .g4 configure --leftmargin leftmargin $left$left
}}

��
Managing graphs with tabsets Typical for applications to generate dozens of graphs.
● Clutters screen. Hard to manage.
● Tend to reduce size of graphs.
Put graphs in tabbed notebook.● Tear-off feature lets you compare plots side-by-side.
● Same graph can be shared by different pages.
&OLFNLQJ�RQ�´[µ�UHDWWDFKHV�SDJH�
��
Managing graphs with tabsets (cont’d) Idea: Create index for graphs.
● Table of buttons, each contains thumbnail image of a graph.
Thumbnails● Already know how to get snapshot of a graph.
Problem: How do you resize snapshot to arbitrary size?● Want thumbnails scaled the same.
● Tk image subsample reducesonly by integer values.
● Image quality poor. Detail lost.
set image [image create photo].g snap .g snap $image$imageset thumb [image create photo]$thumb copy $thumb copy $image$image --subsample subsample 4 44 4
�VXEVDPSOH ��WKURXJK�����

��
Managing graphs with tabsets (cont’d) winopwinop resampleresample operation does arbitrary resizing.
● 1-D image filters: boxbox, triangletriangle, sincsinc, etc.
● Eventually function will move to new image type.
proc Thumbnail { graph w h } {proc Thumbnail { graph w h } {set set imageimage [image create photo][image create photo]$graph snap $graph snap $image$imageset set thumbthumb [image create photo [image create photo --width $w width $w --height $h]height $h]winop winop resample resample $image$image $thumb$thumb box boxbox boximage delete image delete $image$imagereturn return $thumb$thumb
}}set set nTabs nTabs [.t size][.t size]for { set tab 0 } { $tab < $for { set tab 0 } { $tab < $nTabsnTabs } { } { incrincr tab } {tab } {
set graph [.t tabset graph [.t tab cgetcget $tab $tab --window]window]button .f.b$tab button .f.b$tab --image [Thumbnail $graph 200 200] image [Thumbnail $graph 200 200] \\
--command [list command [list .t invoke $tab .t invoke $tab ]]table .f .f.b$tab $row,$table .f .f.b$tab $row,$col col ……
}}
0DNHV�WDE�VHOHFWHG��
��
bgexec Executes programs while still handling events.
● Same syntax as exec: I/O redirection and pipes.
● Collects both stdout and stderr.
● Faster/simpler than fileeventfileevent.
Example:
● Variable myVarmyVar is set when program finishes.
● Setting myVarmyVar yourself terminates the program.
Callback proc invoked whenever data is available on stdout or stderr.
set info [set info [ bgexec myVarbgexec myVar du $dir] du $dir]
VHW�XVDJH�>H[HF�GX��GLU@
text .text .text tag configure outTag -foreground green2.text tag configure errTag -foreground red2procproc DrawStdoutDrawStdout {data} { .text insert end $data {data} { .text insert end $data outTagoutTag }}procproc DrawStderrDrawStderr {data} { .text insert end $data{data} { .text insert end $data errTagerrTag }}bgexec myVarbgexec myVar -- onoutput DrawStdout onoutput DrawStdout -- onerror DrawStderr onerror DrawStderr \\
myProgrammyProgram &&

��
busy Makes widgets busy. Widgets ignore user-interactions.
● Mouse, keyboard events etc.
● Creates invisible window. Shields widgets from receiving events.
Better than grabgrab for many situations.● Allow interactions in more than one widget.
● Stopping interactions in specific widgets.
● De-bouncing mouse clicks/key presses.
Configurable cursor.● Defaults to hourglass/watch.
busy hold .framebusy hold .frameupdatebusy release .framebusy release .frame
��
drag&drop Transfers data between widgets
and applications● Data transferred with sendsend command.
● Any widget can be registered as drag source, drop target, or both.
● Configurable drop token.
● Soon: interoperation with WindowsCDE drag-and-drop.
drag&drop source .sample drag&drop source .sample \\--packagecmdpackagecmd {{PackageColorPackageColor %t}%t}
drag&drop source .sample handler Colordrag&drop source .sample handler Colordrag&drop target .sample handler Color {drag&drop target .sample handler Color {ReceiveColorReceiveColor %v}%v}
'UDJ�VRXUFH
'URS�WDUJHWV
'URS WRNHQ

��
hierbox Hierarchical listbox widget.
● Displays tree of data.
● Incremental (lazy) insertions.
● Much faster than Tcl-based versions.
● Designed to work with companion widget.
á Canvas, listbox, etc.
á Example: --selectcommandselectcommand callback proc.
● Multi-mode selection: single, multiple, non-contiguous.
hierboxhierbox .h .h --opencommandopencommand {{AddEntriesAddEntries %P} %P} \\
--closecommandclosecommand {.h delete %n 0 end}{.h delete %n 0 end}procproc AddEntriesAddEntries { dir } {{ dir } {
if { [fileif { [file isdirectoryisdirectory $dir] } {$dir] } {evaleval .h insert end [.h insert end [lsortlsort [glob $dir/*]][glob $dir/*]]evaleval .h entry configure [.h entry configure [lsortlsort [glob $dir/*/*] [glob $dir/*/*] \\
--button yesbutton yes} }
}}
.h configure root .h configure root --label “C:”label “C:”
�3���3DWKQDPH�RI�HQWU\��Q���1RGH�LQGH[�RI�HQWU\�
��
hierbox (cont’d) Variety of styles supported.
● Read-only/editable entries.
● Bind to individual entries (e.g. tool tips).
● Font, color, icons, images configurable for single entries.
● Auxiliary text and/or images displayed for entries.
Built-in search and selection functions.● Search on name, data, entry attributes, etc.
●● hiertablehiertable widget uses new tree data object.
set nodes set nodes [.h find [.h find --glob glob --name *.c]name *.c]evaleval .h entry configure $nodes .h entry configure $nodes --labelcolorlabelcolor redred
.h find .h find --glob glob --name *.gif name *.gif --exec { exec { .h entry configure %n .h entry configure %n \\
--image [image create photo image [image create photo --file %P]file %P]}}
5HWXUQV�OLVW�RI�PDWFKLQJ�QRGHV�

��
table Grid-based geometry manager.
● Position widgets by row/column.
● Father of Tk grid.
● Can bound row/column sizes.
● Insert/delete rows and columns.
● Debugging mode.
table . table . \\
0,0 .label 0,0 .label --cspancspan 2 2 \\1,0 .text 1,0 .text --fill both fill both \\
1,1 .1,1 .vsvs --fill y fill y \\
2,0 .2,0 .hshs --fill xfill x
������
������
������
������
��
tabset Tabbed notebook widget.
● Single or multi-tiered tabs.
● Scrollable (with/without scrollbar).
● Bind to individual tabs (tool tips)
● Tear off and re-attach pages.
tabsettabset .t .t --bgbg red red --scrollcommandscrollcommand {.s set}{.s set}scrollbar .s -command {..tt viewview} -orient horizontal.t insert end First .t insert end First --window .t.graph window .t.graph \\
--selectcommandselectcommand {{ SelectTabSelectTab “First” } “First” } \\-- image [image create photo image [image create photo -- file book.gif]file book.gif]
.t bind First <Enter> {ToolTips “Graph of Interpolating .t bind First <Enter> {ToolTips “Graph of Interpolating SplinesSplines ”}”}
.t bind First <Leave> {ToolTips “”}.t bind First <Leave> {ToolTips “”}
&DQ�XVH�WDEVHWZLWKRXW�SDJHV�

��
tabset (cont’d) --slant noneslant none
--slant leftslant left
--slant rightslant right
--slant bothslant both
Variety of styles supported.● Controlled via tabset’s
configuration options.
--side topside top --side rightside right --side bottomside bottom --side leftside left --rotate 0rotate 0
--tiers 1tiers 1 --tiers 2tiers 2 --tiers 3tiers 3
$WWDFK�VFUROOEDU�WR�VLQJOH�RU�PXOWL�WLHUHG�WDEV�
��
What version of Tcl/Tk is required?● Tcl 7.5, Tk 4.1 through Tcl/Tk 8.3.0 (latest release) all work.
Can I use BLT in a commercial product?● Free to copy and use. No royalties.
Where do I get the latest version?●● http://www.tcltk.com/blthttp://www.tcltk.com/blt
● Sources for latest version.
● Windows binaries available.
Where do I send bug reports and requests? ● Send to both addresses. Put “BLT” in the subject line:
[email protected]@fast.net
[email protected]@cadence.com
General Information
��
General Information (cont’d) Books
● Tcl/Tk Toolsedited by Mark Harrison.
● Tcl/Tk in a Nutshellby Paul Raines and Jeff Trantor.
What does BLT stand for?● Bell Labs Toolkit
Bacon, Lettuce, and TomatoBetter Luck Tomorrow
● Whatever you want it to…


![[Blt] 2014년 정부지원사업11월](https://img.pdfslide.net/doc/110x75/5592e5c81a28ab33698b4637/blt-2014-11.jpg)
![[BLT] 창업과 지식재산](https://img.pdfslide.net/doc/110x75/5592e7321a28ab1f698b4701/blt-5592e7321a28ab1f698b4701.jpg)

![[Blt] 2014년 정부지원사업10월](https://img.pdfslide.net/doc/110x75/558e65901a28ab92218b458e/blt-2014-10.jpg)
![[BLT] 지식재산권 기초강의](https://img.pdfslide.net/doc/110x75/557ef825d8b42ad17d8b5064/blt-557ef825d8b42ad17d8b5064.jpg)


![[BLT] 특허권의내용과명세서의이해_김성현_20160824_v2](https://img.pdfslide.net/doc/110x75/58735df41a28abe7648b4f7b/blt-20160824v2-58bd808549376.jpg)
![[BLT] 브랜드 네이밍 사례 - BLT 브랜드 네이밍 연구소 (엄정한 변리사)](https://img.pdfslide.net/doc/110x75/58a3fc3b1a28ab64528b57fd/blt-blt-.jpg)

![[BLT] 특허제도소개_김성현_20160824_v2](https://img.pdfslide.net/doc/110x75/589e54581a28ab1c7f8b6b49/blt-20160824v2.jpg)
![[BLT] 특허문헌및선행기술조사_김성현_20160824_v2](https://img.pdfslide.net/doc/110x75/589e54581a28ab1c7f8b6b4b/blt-20160824v2-590f29da66f7b.jpg)

![[BLT] 인공지능, 딥러닝 특허 전략 v1.1 (170320 BLT 토크콘서트)](https://img.pdfslide.net/doc/110x75/58e648441a28ab1b438b4791/blt-v11-170320-blt-.jpg)
![[BLT] 6HA 발명기법](https://img.pdfslide.net/doc/110x75/559af70b1a28ab8c458b45cf/blt-6ha--559c094e2d7ea.jpg)