Embed Size (px)
Citation preview

Building Capacity and Meeting Demand with the West African Resource 2nd Annual EU Gas Forum, Vienna
Fortunato Costantino, CEO Sahara Energy International, Geneva

The Sahara Group
Vertically integrated in the Oil & Gas sector of Nigeria
Oil and gas fields, crude trading, shipping, refined product trading, storage, aviation refuelling and petrol stations
Recently moved into the power sector, supplying 40% of Nigeria’s electricity
Annual turnover is in excess of US$5 Billion
A revolving working capital base/trade credit line of US$2.4 Billion
Sahara Group
Sahara
Energy
Resource
Sahara Bulk
Storage
Sahara Sea
Support
Services
Sahara
Energy Int’l
Pte Ltd
Sahara
Trade West
Africa
Energy
Resource
Limited
MIDSTREAM
Casablanca
Ventures
Aviation Air
and Land
Services
P-Lyne
Energy
Sahara
Power
Resource
SO Energy
DOWNSTREAM
Sahara Energy E&P
Sahara Gas
UPSTREAM
P-Lyne
Energy
KERL
Sahara
Energy
Fields

Sahara have interests in a number of oil blocks, and continue to evaluate other potentially lucrative regional opportunities *
OPL 332 Potential: 300 MMbbl (4 leads) Acreage: 1,300 km2 Activity: 3D seismic acquired and processed Sahara interest: 35%
OPL 284 Potential: 270 MMbbl (35% of block) Acreage: 1,128 km2 Activity: Seismic interpretation Sahara interest: 45%
OPL 286 Potential: 200 MMbbl (40% of block) Acreage: 1,112km2 Activity: 2 wells drilled Sahara interest: 24%
OPL 288 Potential: N/A Acreage: 1,010 km2 Activity: data mining with NAPIMS/DPR Sahara interest: 100%
JDZ Block 5 Potential: N/A Activity: PSC negotiation Sahara interest: 10%
* Seismic agreement over Block B1 of the East Cape Three Points in Ghana also signed with GNPC in 2008. Sahara has the First Right of Refusal on concluding the acquisition of 1000 sq km of the 3D seismic. (Seismic survey completed in April 2009.)
OPL 274 Potential: Over 140 MMbbl Acreage: 1,000 km2 Activity: Appraisal well 2010 Sahara interest: 100%
Upstream activities as central part of our development strategy

Sahara Group harnesses its skills to excel in the Nigerian Gas Sector
Nigeria holds the 7th largest gas resources in the world (187 TCF of proven reserves)
Sahara is committed to developing the domestic gas market, and holds strategic stakes in the LNG sector
Brass LNG – Sahara, in partnership with Sempra LNG, has been awarded a 2%
equity stake in Brass LNG, a 10mtpa Liquefaction and an investment level of $15Billion USD
OKLNG – Sahara, in partnership with Sempra LNG holds a 2.5% Equity stake in the OLOKOLA LNG Project, a 22MTPA Liquefaction plant proposed to be built on the Ogun/Ondo state border
NGMP – Sahara are consortium leaders in a project to develop a Central Processing Unit – a gas gathering and treatment facility to provide gas for domestic use (power plants, petrochemicals and export facilitates)

BRASS LNG Sahara-Sempra-NNPC: A Partnership to Add Value to Nigeria’s LNG Sempra Energy is a Fortune 500 energy services company, which develop energy
infrastructure, operate utilities, and provide related products and services to more than 29 million consumers worldwide - United States, Europe, Canada, Mexico, South America and Asia
The Sahara Group serves oil majors, independent marketers, local & international oil & gas traders, the offshore oil industry and the aviation industry
Sempra LNG and Sahara (JV SemSah) will offer NNPC several options for downstream participation in the LNG and Natural Gas value chain:
Financing of NNPC Equity in BRASS
Joint Marketing of LNG to create value and develop capacity using also NNPC staff
Joint Shipping of LNG: owning and operating the LNG ships in assistance with a reputable LNG ship owner/operator
NNPC Access to Cameron LNG
Term agreement on lifting rights to LNG
Access to lift NNPC Equity LNG

ONNE - Provision of an Oil & Gas Terminal with the following sectors: Industrial Estate Oil & Gas Mega Storage Tank Farm Oil & Gas Logistics Terminal Base Non Oil & Gas Logistics Terminal Base Residential Estate – to serve the industrial estate Advantages
1. Free Trade Zone Status 2. Jetty Ports and Water way access to the South-South and South-East regions of Nigeria 3. Provision of Power to the facilities available from the current power plants being managed by Sahara 4. Easy access and connection to the Railway system to Greater Port Harcourt city and South-East of Nigeria 5. Mega Storage Tank Farm 6. Easy access to the Port Harcourt International Airport
OGOGORO - Provision of Mega Storage Tank Farm for Oil & Gas activities - Oil & Gas Logistics Terminal Base Advantages
1. Free Trade Zone Status 2. Strategic Storage Reserves for Nigeria and West African Sub region 3. Access to Alternative Water way and Oil & Gas Logistic 4. Access to pipeline distribution network for South West and Middle belt of Nigeria
Onne and Ogogoro Logistic Projects

1.The NGMP focuses on the establishment of this robust gas infrastructure which will constitute a network of gas transportation and Central Processing Facilities (CPF).
2.The CPFs will be located in 3 dedicated areas in the Niger Delta called franchise areas: Western, Central and South Eastern franchise areas.
Sahara Energy Resource Limited Consortium Leaders for a Franchise Area identified by the NGMP, to build own and operate central processing facilities (CPF) capable of processing a minimum of 300MMSCFd by December 2012.
Sahara and the Nigerian Gas Master Plan

Focus of Discussion
Developing Sub-Saharan Africa’s potential to diversify supply & security of supply: which model to apply?
Logistics for export & increasing captive demand: balancing interests in export opportunities & country needs?
Risk vs. Opportunity in W. Africa: How the current financial crunch can generate more reward & not more fear?
Domestic Power Production in Nigeria: a new way forward?
Capitalising on arbitrage opportunities through the price convergence of Atlantic Basin & APAC
Bringing more consistent processes and clarity on the rights and obligations of buyers
Investing in overseas resource development to secure energy supplies

Business Models - Our viewpoint
Challenges to Suppliers
Rising investment costs
Increased contractual flexibility
portfolio of supply contracts & trades
unsold capacity
project financing complexity
Increased project risks
forward/backward integration play
Minimising mismatch
production and shipping
multiple contracts with different seasonality requirements
capitalising arbitrage opportunities via cargo swapping & backhauling arrangements
Buyer’s Preferences Reliability and security of supply
Greater operational flexibility
Competitively priced LNG
Own and manage LNG ships
Equity along the entire LNG value chain

US LNG import terminals are turning around – full circle!
The US has exported LNG to Asia from Alaska for decades
Not very large volumes, but better profits than ”exports” to other US states
Last few years, LNG imports have grown –and forecasted import, too!
Falling domestic production and growing demand
Imports from Canada, Mexico, and global LNG
With unconventional gas at home:
Less LNG is needed
Pipelines from Canada now export
Still some spare gas possible
Demand may grow more...
Talk of exporting shale!
Sabine Pass is turning around
Already re-exporting cargoes (to UK)
Liquefaction planned from 2015

Large investments in unconventional gas
Many years of small scale by small companies
Lower investments and shorter lead times
Suddenly large scale and entry of majors
Reserves cheaper than oil
Possible hedge –against falling LNG income
Attracted by large reserves at low cost?
Good match with smaller players?
Competitive advantage?
Technology development moves quickly in oil companies
Especially majors, such as Shell, Exxon Mobil, Marathon
Also, smaller entrepreneurial companies active Creative, inventive, cost conscious and close to the ground
Often in cooperation with larger companies with financial strength
Much lower cost –possible to make a profit for many
Varying costs, but much around $4/mmbtu
Cash flow challenge for smaller players at depressed prices
Liquids (NGL, crude oil) help economics
Some flexible supplies could get higher prices

New gas impacts the market at several levels
Short term impact of unconventional gas
Perception of shortage gone –some confidence in secure supplies
More “loose” LNG globally –pressure on prices
Lowest gas demand in years does not help
New uncertainty for ”conventional” projects
Medium term impact
With perceived oversupply, worries of high prices and SoS wane
Politicians and boards more positive to gas as fuel?
Long term possible impact
Large production of gas in Europe, Asia and America + Australia
Large impact on power mix, demand and price!
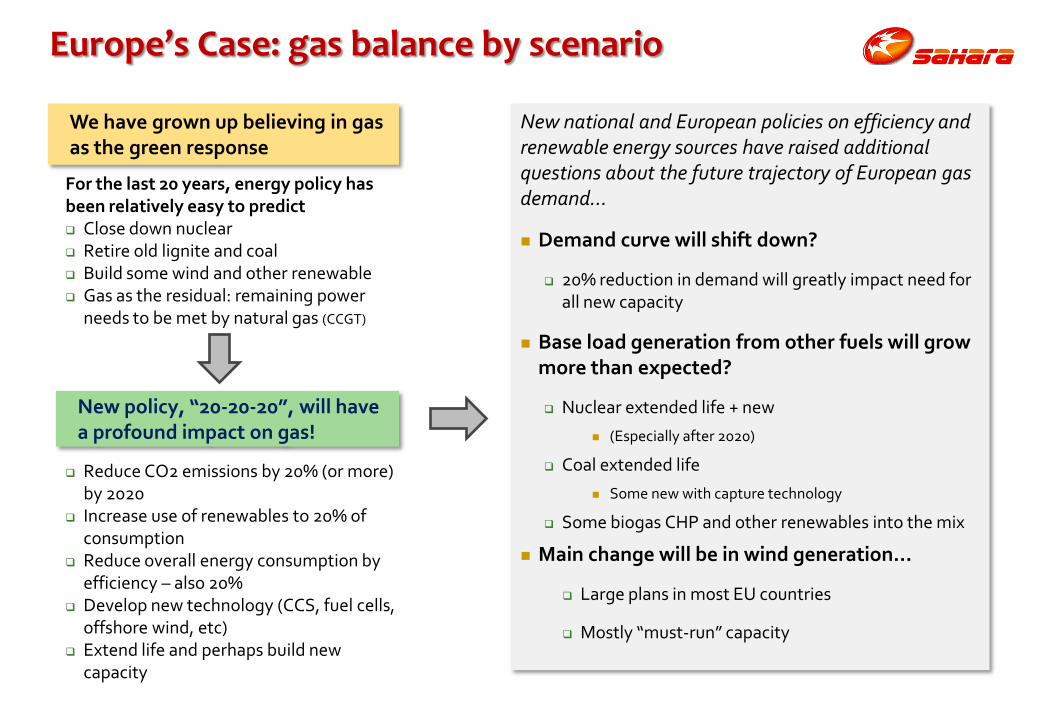
Europe’s Case: gas balance by scenario
We have grown up believing in gas as the green response
For the last 20 years, energy policy has been relatively easy to predict Close down nuclear Retire old lignite and coal Build some wind and other renewable Gas as the residual: remaining power
needs to be met by natural gas (CCGT)
New policy, “20-20-20”, will have a profound impact on gas!
Reduce CO2 emissions by 20% (or more) by 2020
Increase use of renewables to 20% of consumption
Reduce overall energy consumption by efficiency – also 20%
Develop new technology (CCS, fuel cells, offshore wind, etc)
Extend life and perhaps build new capacity
New national and European policies on efficiency and renewable energy sources have raised additional questions about the future trajectory of European gas demand…
Demand curve will shift down?
20% reduction in demand will greatly impact need for all new capacity
Base load generation from other fuels will grow more than expected?
Nuclear extended life + new
(Especially after 2020)
Coal extended life
Some new with capture technology
Some biogas CHP and other renewables into the mix
Main change will be in wind generation…
Large plans in most EU countries
Mostly “must-run” capacity

What will gas prices be?
Some gas prices linked to oil still
Forward oil prices currently up to $90/bbl
This indicates current gas prices and slightly rising
More gas available at spot prices
Depending on balance of supply and demand
Demand could fall if 20-20-20 is fulfilled
That would give lower price gas in Europe’s spot markets
Logically, floor at cost level (see next page), but not always so
Supply may rise – new projects + unconventional
This could also give surplus and lower prices
However, if 20-20-20 is abandoned, gas demand could rise
This would have a firming effect on prices

What is the advantage of ownership in LNG?
At peak periods – shortage of pipeline gas – premium
This upside is linked to being the marginal supplier
The marginal supplier is also the first to “fall off” the merit order
If there is a shortage of gas/LNG, ownership in chain may be an advantage
At base load either spot gas prices or oil link
Some oil link contracts still signed, especially in Asia
Good hedge for new comers, if much supply on oil link today
Increasingly spot prices are also valid for LNG
At over supplied markets, pipeline suppliers can normally go quite low in prices
If LNG still runs (for operational reasons), it may be at a loss

Gas prices differ in type and in the value chain
Wholesale prices most discussed
German border price
Quite stable due to oil link
Spot prices are more volatile
LNG prices – oil link or spot
But gas is transported and stored
Modulated, factory gate gas is therefore normally at a much higher price
Perhaps this is the most relevant price to compare with cost of unconventional?
Local gas may get high feed-in
Some countries are planning high entry prices for biogas into the gas system –even higher!

LNG Industry – Business Models
Portfolio Markets Resources
National Champions, Upstream driven IOC’s
Integrated players
Gas buyers and marketers
Examples:
Sonatrach, Petronas, Chevron
Examples:
British Gas, GDF Suez,
& aspirants
Examples:
Centrica, Kogas Tepco
New entrant strategy:
Integrated, equity gas driven, buyer, niche
player?

How to be a new and successful entrant?
Access to liquefaction growth driven by new concepts: Small, Mid-Scale Liquefaction Processes Conversion of off-shore gas flaring through
FPSO units
Partnership with producers: Market and Profit sharing Technology provision Cross-commodity offer
Commercial agility and innovation
Support from/to complementary business (Power, Storage)
Tailored shipping capabilities for flexible solutions:
FSRU‘s
EBRU‘s
Standard
Upstream:
Limited or constrained access to gas upstream reserves
Limited access to equity participation in new liquefaction assets
Downstream: No developed market on the targeted
downstream areas
Realistic scenario Possible strategy
Shipping: No proprietary assets No technology holder

Data: Infield
First issue: stranded gas reserves enough to justify interest?
Available fields to target Mid-Scale and FLNG represent >50% of the total currently discovered
Development costs look competitive but Liquefaction choices far from mature
Reserves depletion relevant to project’s economic performance
FLNG relocation not necessarily easy
4 fields 50-100 Tcf
5-50 Tcf
1-5 Tcf
~350 fields 0.5-1 Tcf
~700 fields 0.25-0.5 Tcf
~1000 fields 0.1-0.25 Tcf
~4000 fields <0.1 Tcf
LARGE
SCALE LNG
Mid-Scale
and
Floating
70 fields
~350 fields
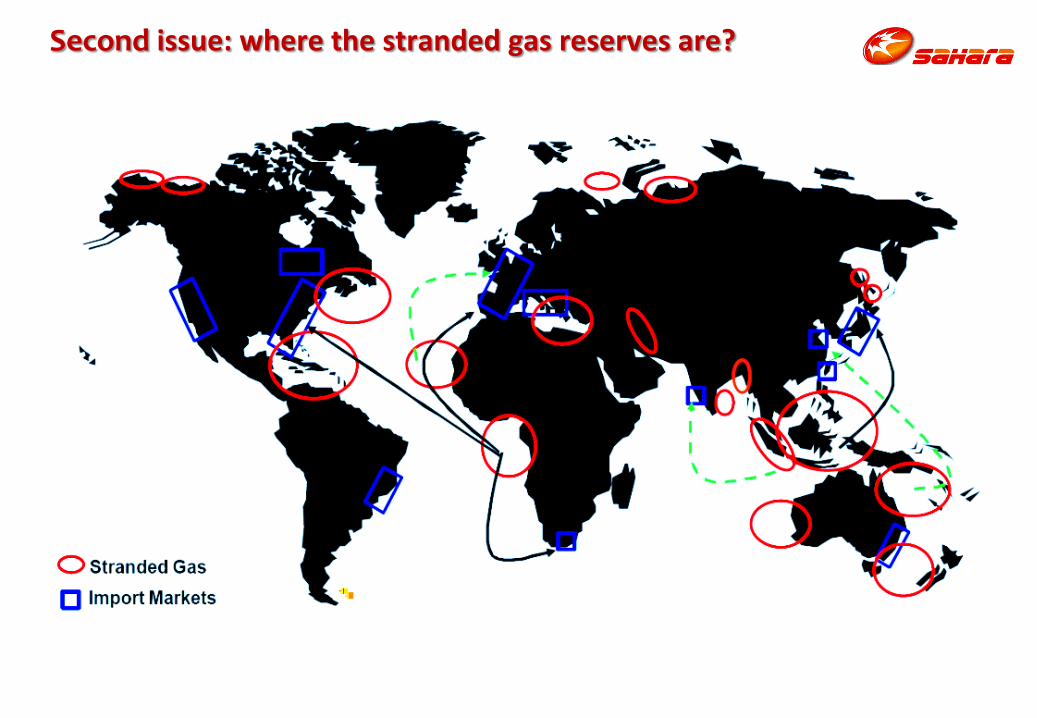
Second issue: where the stranded gas reserves are?

Third issue: where’s FPSO feasible? - Global Wave Statistics
Issues that need to be carefully examined when considering a floating LNG facility: Location & sea condition Type of vessel & containment Mooring of the facility Access for export / import vessels Method of transfer of cargo Type of plant, liquefaction / regasification Deck congestion

FLNG CASE: How to be a new and successful entrant?
Production:
RESOURCE OWNERSHIP: access to gas reserves
FACILITIES: ownership or participation
Liquefaction: Ownership of liquefaction assets
Realistic scenario for INTEGRATED PROJECT Relevant Issues
Marketing: Proprietary shipping Captive market or downstream customers
Marine settings present technical challenges Reserves depletion Vs economic performance Upstream fiscal terms Relationship with NOC’s:
Profit sharing, Technology provision Cross-investment: flaring gas conversion/recovery
Risk allocation between the shipbuilder, process vendor, and EPC contractor
Process efficiencies Scale-up performance
Tailored shipping capabilities for flexible solutions providing optionality:
• FSRU‘s
• EBRU‘s
• Standard

FLNG CASE: How to be a new and successful entrant?
Production:
RESOURCE OWNERSHIP different from FLNG Project
FACILITIES: resource owner different from FLNG Project
Liquefaction: PSC and/or GSA with producer in a FLNG
Project
Realistic scenario for MERCHANT PROJECT Relevant Issues
Marketing: Proprietary shipping or time charter Prop trading, arbitrage
Marine settings present technical challenges Reserves depletion Vs economic performance Upstream fiscal terms Relationship with NOC’s:
Profit sharing, Technology provision Cross-investment: flaring gas conversion/recovery
Risk allocation between the shipbuilder, process vendor, and EPC contractor
Process efficiencies Scale-up performance
Tailored shipping capabilities for flexible solutions providing optionality:
• FSRU‘s
• EBRU‘s
• Standard
Gas Supply Agreement

FLNG CASE: How to be a new and successful entrant?
Production:
RESOURCE OWNERSHIP different from FLNG Project
FACILITIES: resource owner different from FLNG Project
Liquefaction: Tolling Agreement between Resource
Owner and FLNG Project
Realistic scenario for TOLLING PROJECT Relevant Issues
Marketing: Proprietary shipping or time charter Prop trading, arbitrage
Marine settings present technical challenges Reserves depletion Vs economic performance Upstream fiscal terms Relationship with NOC’s:
Profit sharing, Technology provision Cross-investment: flaring gas conversion/recovery
Risk allocation between the shipbuilder, process vendor, and EPC contractor
Process efficiencies Scale-up performance
Tailored shipping capabilities for flexible solutions providing optionality:
• FSRU‘s
• EBRU‘s
• Standard
Tolling Agreement

Downstream
Choose entry points in markets with sufficient interconnection and cross-border access for structured deals among different hubs
Portfolio of:
Long-terms secured sinks in complementary business (>5y, proprietary or contracted generation, tolling agreements)
Market risk mitigated, margin moved to power business (spark spread driven), good risk management needed
Short/medium wholesale positions (>1y), e.g. via partnership with Municipalities
Market risk is higher, margins tent to be higher, price formulae normally back-to-back
Storage access for structured transaction on seasonal markets
Contractual terms and shipping capabilities to play arbitrage games and access highest priced markets globally
Get logistic “tradable” position in constraints areas to attract appetite of producers for downstream ventures

Floating Vs onshore projects
Floating facilities offer several advantages over conventional land-based facilities for offshore fields, such as:
elimination of both harbor facilities and of long pipelines from the production platform to shore;
ability to relocate the facilities from one field to another (which encourages more rapid depletion of small fields);
faster field development time, with little site development work;
Better control of construction schedules and costs;
The plant can be commissioned in transit to the operation site, thus reducing the time to start-up; and
Enhanced safety by isolating the facilities away from populated areas.

Comparison published unit cost Standard Vs FPSO mid-scale
0
200
400
600
800
1000
1200
1400
DA
MIE
TTA
TAN
GU
H
BO
NN
Y 4
/5
IDK
U
QA
TAR
GA
S I
YEM
EN L
NG
QA
LHA
T
BIO
KO
SAK
HA
LIN
DA
RW
IN
ILC
SKIK
DA
AN
GO
LA
MEL
KO
YA
PER
U L
NG
PLU
TO
Daz
ho
u L
NG
Sun
shin
e G
as
FLEX
LN
G A
ust
rala
sia
Arr
ow
En
ergy
LN
G
Afr
ican
LN
G
Do
ngg
i-Se
no
ro
Cen
tral
Su
law
esi
PN
G L
NG
Average unit costs = 565
Average unit costs = 650

Gas flaring overview situation
Associated gas is often produced in remote locations and sometimes in small volumes
Two options to reduce gas flaring – re-injection or market the gas
Investment necessary to market the gas may not be economic
Lack of infrastructure
Low domestic demand for gas and/or electricity
Re-injection of associated gas is not always economic due to high cost and low incremental oil reserves
A sudden call on spare oil production capacity may exceed capacities of existing gas handling facilities, resulting in gas flaring
The World Bank Gas Flaring Reduction Initiative was formed to support national governments’ efforts to reduce flaring by providing
Facilitation of local public-private partnerships and co-operation on gas infrastructure and markets
Links with existing World Bank instruments
Assistance on carbon credits

GLOBAL GAS FLARING MAP Stable Flaring
9 countries had largely stable gas flaring across the time series. This includes Australia, Ecuador, Gabon, Iran, Kuwait, Malaysia, Romania, and Trinidad.
Long Term Increasers
22 countries have an upward trend in gas flaring over the time series. This includes Azerbaijan, Chad, China, Equatorial Guinea, Ghana, Iraq, Kazakhstan, Kyrgyzstan, Mauritania, Myanmar, Oman, Philippines, Papua New Guinea, Qatar, Russia (excluding KM), Saudi Arabia, South Africa, Sudan, Thailand, Turkmenistan, Uzbekistan, and Yemen.
The largest increases were in Russia (+10 BCM), Kazakhstan (+5 BCM) and Iraq (+4 BCM).
Short Term Increasers
21 countries show an upward trend in gas flaring from 2002 through 2006: Azerbaijan, Brazil, Canada (offshore), Chad, China, Congo, Equatorial Guinea, Ghana, Iran, Kazakhstan, Kuwait, Libya, Malaysia, Mauritania, PNG, Russia (excluding KM ), Saudi Arabia, Sudan, Thailand, Trinidad, and Yemen. Gas flaring in Russia increased by six BCM and the increase in Iran was 3 BCM.

Example – Nigeria
The image was made using the night-time lights from 1992 as blue, 2000 as green, and 2006 as red. Flares active in 2007 – but not 2000 or 1992 are red. Those active in 2007 and 2000 are yellow. Those active in 2000 but not 1992 or 2007 are green. Those active in 1992 but not 2000 or 2007 are blue.
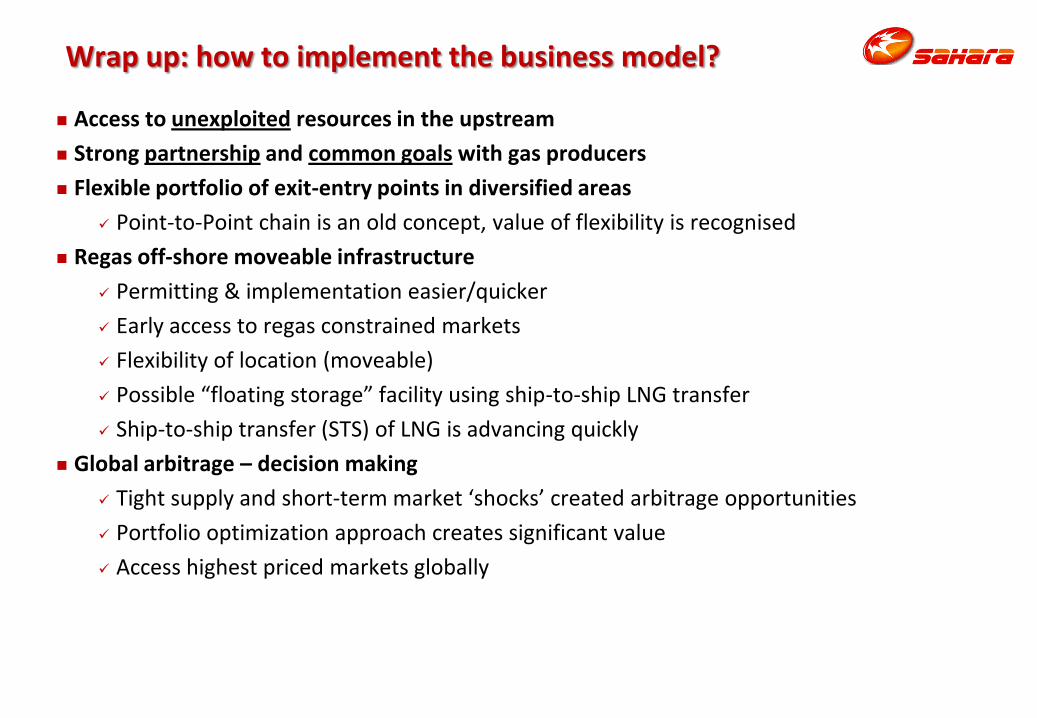
Wrap up: how to implement the business model?
Access to unexploited resources in the upstream
Strong partnership and common goals with gas producers
Flexible portfolio of exit-entry points in diversified areas
Point-to-Point chain is an old concept, value of flexibility is recognised
Regas off-shore moveable infrastructure
Permitting & implementation easier/quicker
Early access to regas constrained markets
Flexibility of location (moveable)
Possible “floating storage” facility using ship-to-ship LNG transfer
Ship-to-ship transfer (STS) of LNG is advancing quickly
Global arbitrage – decision making
Tight supply and short-term market ‘shocks’ created arbitrage opportunities
Portfolio optimization approach creates significant value
Access highest priced markets globally