Embed Size (px)
Citation preview
Building Emission Inventory for Regional Air Quality Modeling in China
K. He1, Q. Zhang1, L. Wang1, D. Streets2, J. Fu3, J.Woo4
1Tsinghua University, Beijing, China2Argonne National Laboratory, Chicago, USA
3Uinversity of Tennessee, Knoxville, USA4Northeast States for Coordinated Air Use Management, Boston, USA
2nd ICAP Workshop, 2nd ICAP Workshop, Friday Center of Chapel Hill, Friday Center of Chapel Hill, Oct. 21-22, 2004Oct. 21-22, 2004
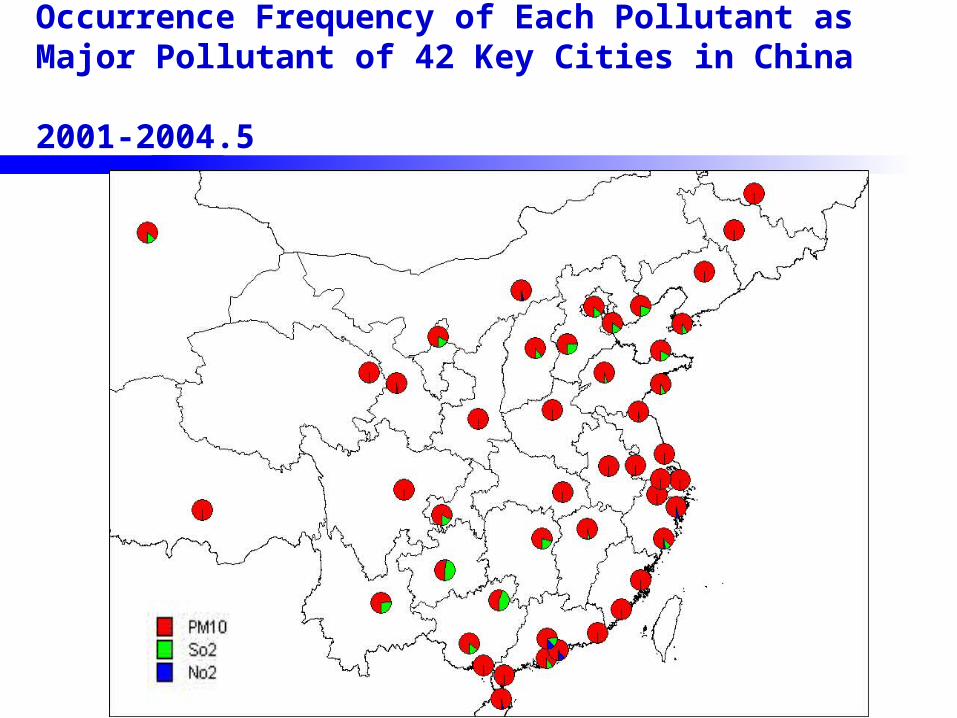
Occurrence Frequency of Each Pollutant as Major Pollutant of 42 Key Cities in China 2001-2004.5
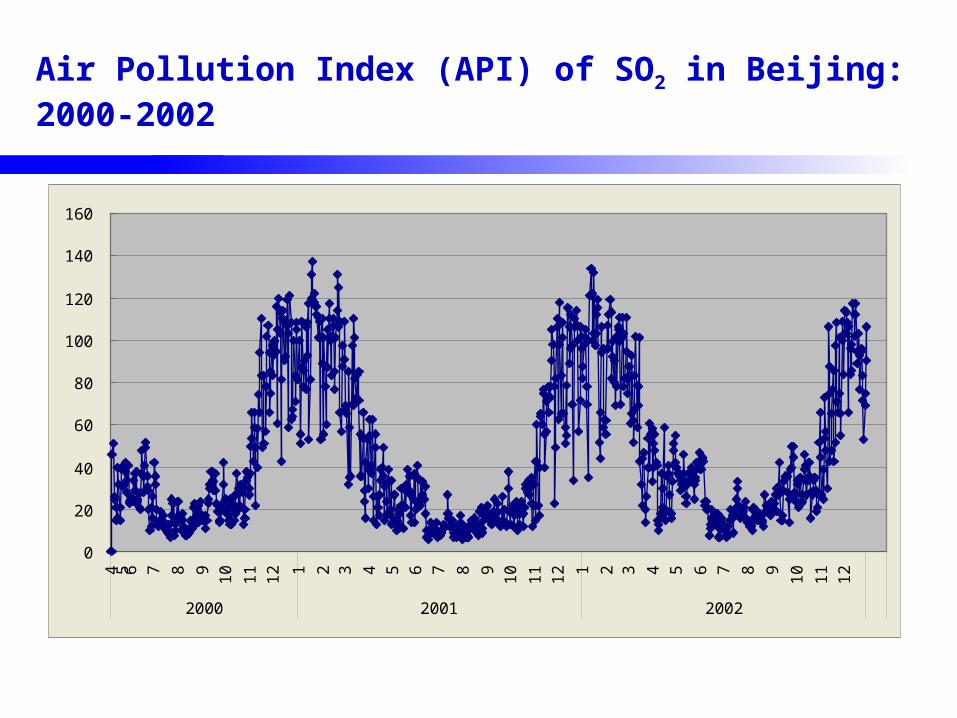
Air Pollution Index (API) of SO2 in Beijing: 2000-2002
0
20
40
60
80
100
120
140
160
4 5 6 7 8 9
10
11
12 1 2 3 4 5 6 7 8 9
10
11
12 1 2 3 4 5 6 7 8 9
10
11
12
2000 2001 2002
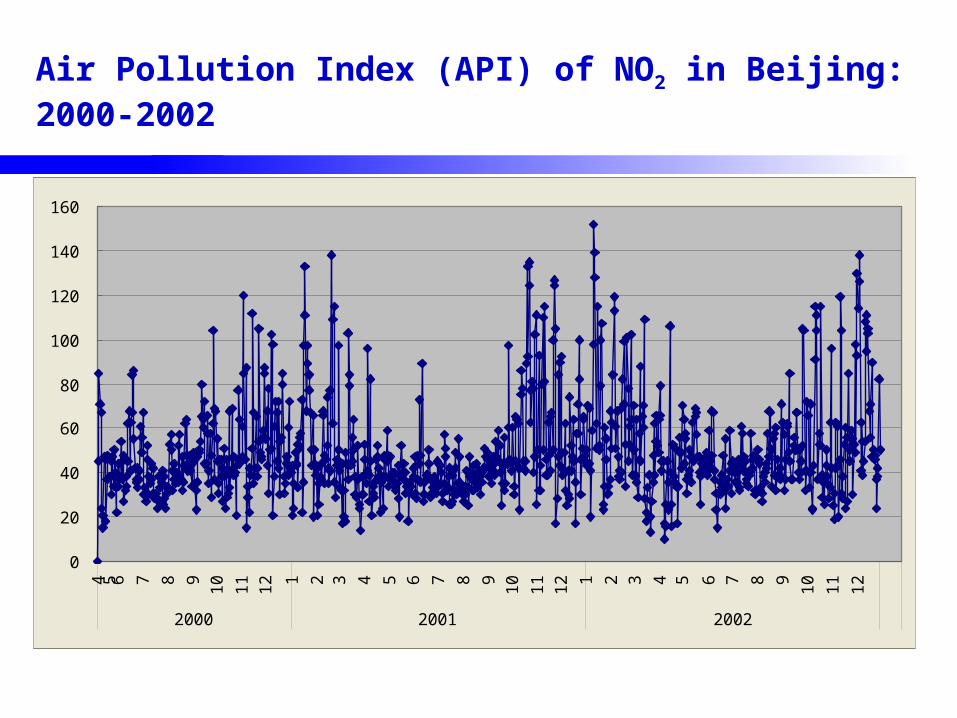
Air Pollution Index (API) of NO2 in Beijing: 2000-2002
0
20
40
60
80
100
120
140
160
4 5 6 7 8 9
10
11
12 1 2 3 4 5 6 7 8 9
10
11
12 1 2 3 4 5 6 7 8 9
10
11
12
2000 2001 2002
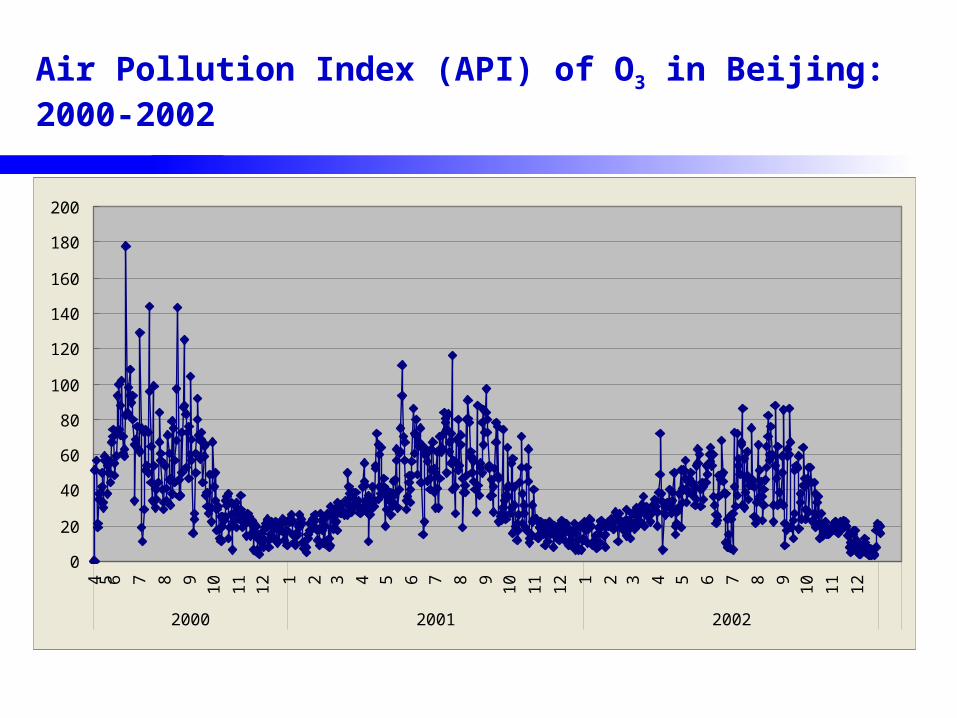
Air Pollution Index (API) of O3 in Beijing: 2000-2002
0
20
40
60
80
100
120
140
160
180
200
4 5 6 7 8 9
10
11
12 1 2 3 4 5 6 7 8 9
10
11
12 1 2 3 4 5 6 7 8 9
10
11
12
2000 2001 2002
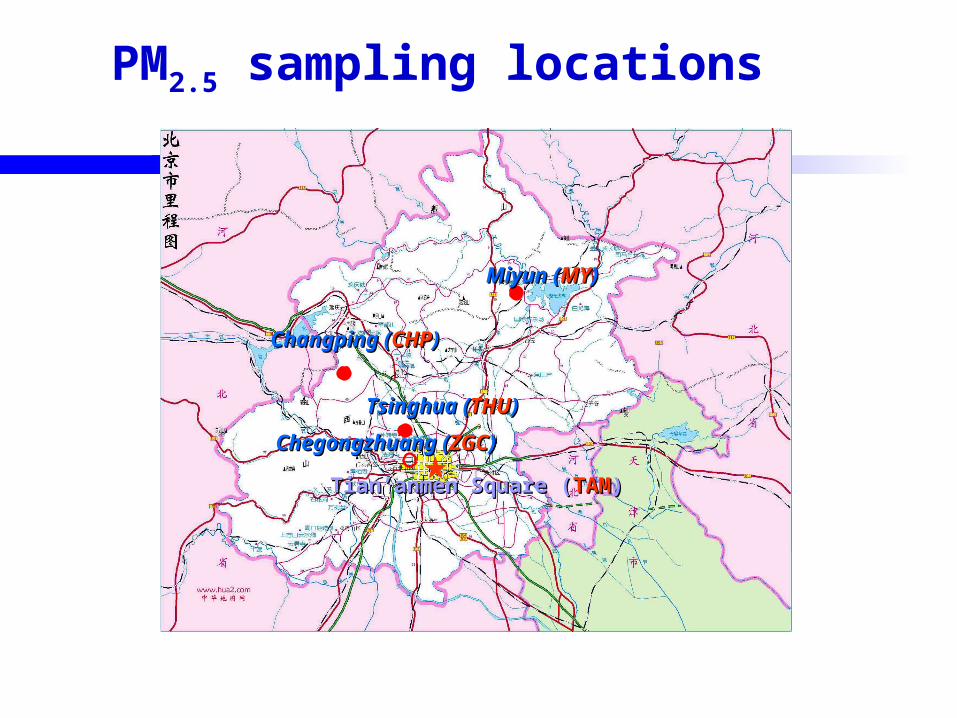
PM2.5 sampling locations
Tsinghua (Tsinghua (THUTHU))
Changping (Changping (CHPCHP))
Miyun (Miyun (MYMY))
Chegongzhuang (Chegongzhuang (ZGCZGC))
Tian’anmen Square (Tian’anmen Square (TAMTAM))
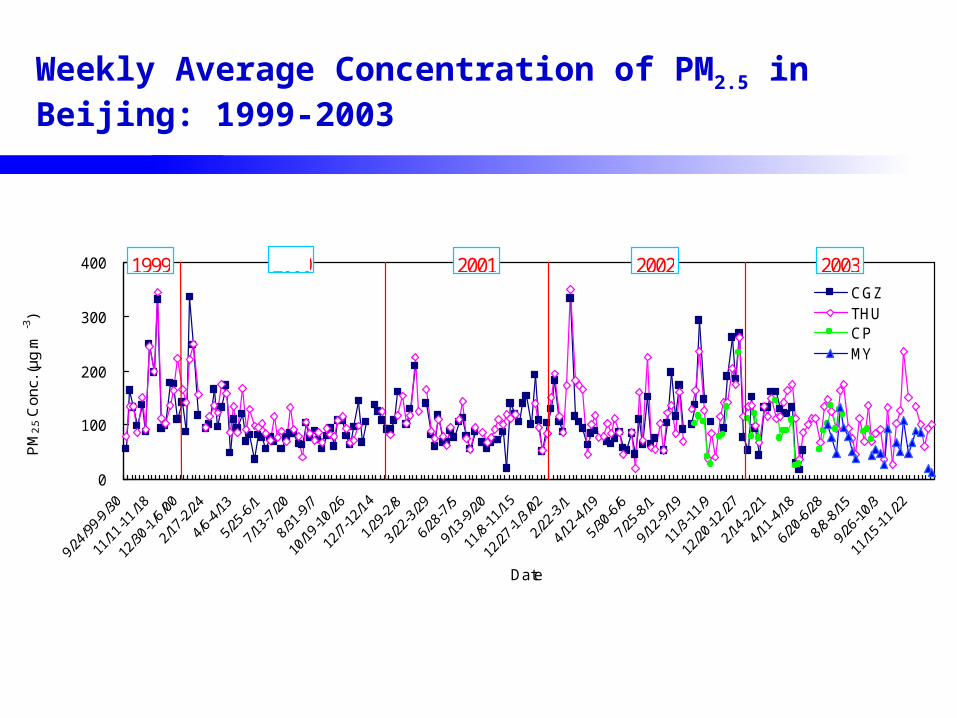
Weekly Average Concentration of PM2.5 in Beijing: 1999-2003
0
100
200
300
400
Date
PM
2.5
Con
c. (µ
g.m
-3)
CGZTHUCPMY
20001999 2001 2002 2003
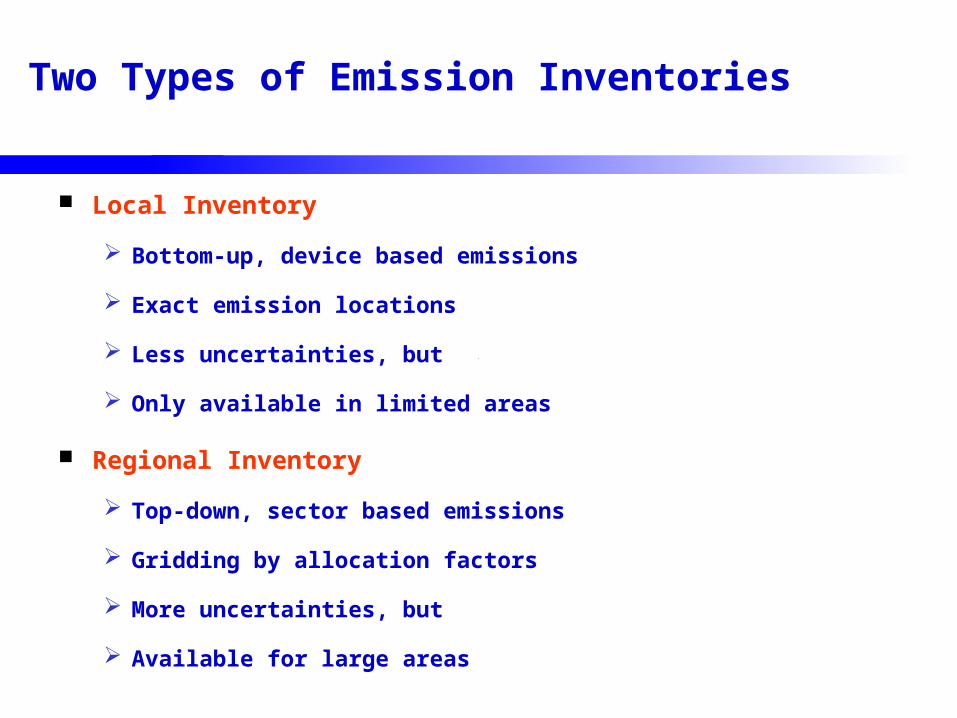
Two Types of Emission Inventories
Local Inventory
Bottom-up, device based emissions
Exact emission locations
Less uncertainties, but
Only available in limited areas
Regional Inventory
Top-down, sector based emissions
Gridding by allocation factors
More uncertainties, but
Available for large areas
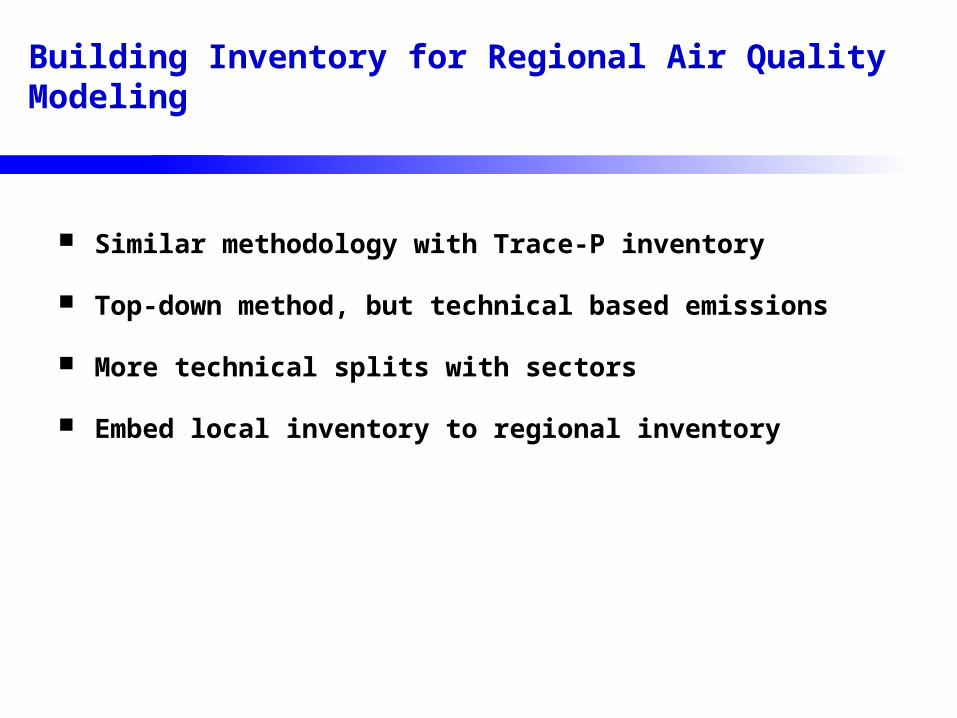
Building Inventory for Regional Air Quality Modeling
Similar methodology with Trace-P inventory
Top-down method, but technical based emissions
More technical splits with sectors
Embed local inventory to regional inventory
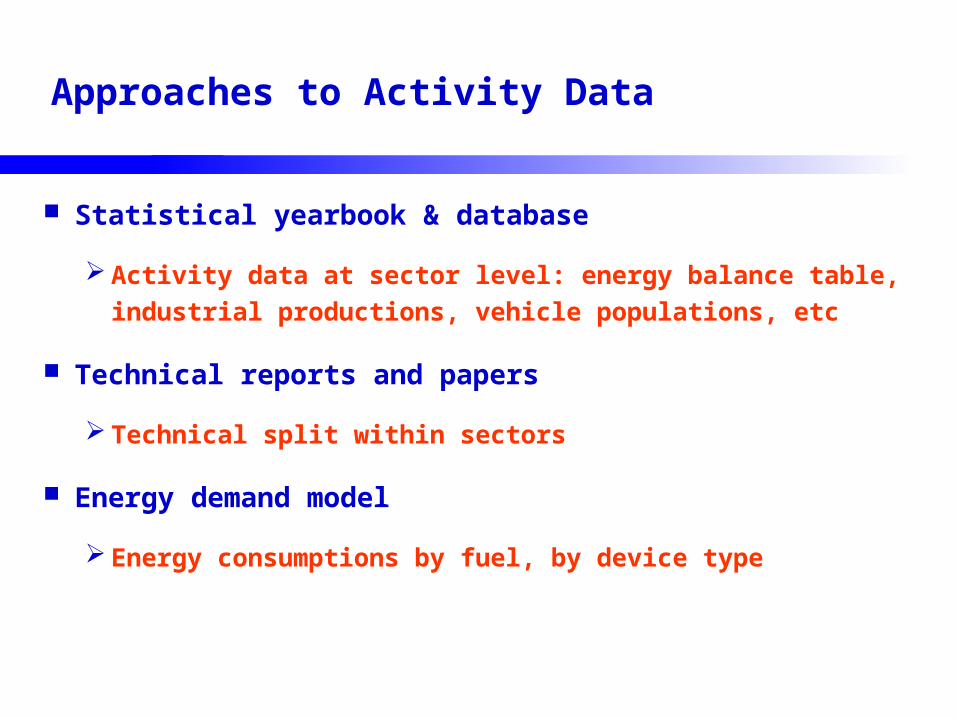
Approaches to Activity Data
Statistical yearbook & database
Activity data at sector level: energy balance table,
industrial productions, vehicle populations, etc
Technical reports and papers
Technical split within sectors
Energy demand model
Energy consumptions by fuel, by device type
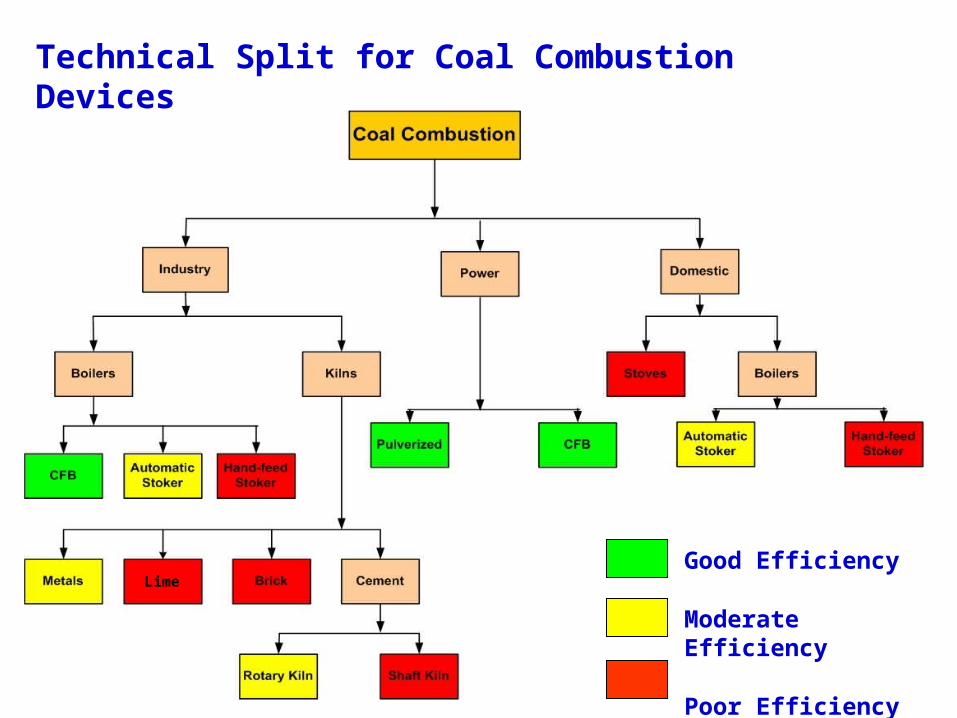
Technical Split for Coal Combustion Devices
Good Efficiency
Moderate Efficiency
Poor Efficiency
Lime
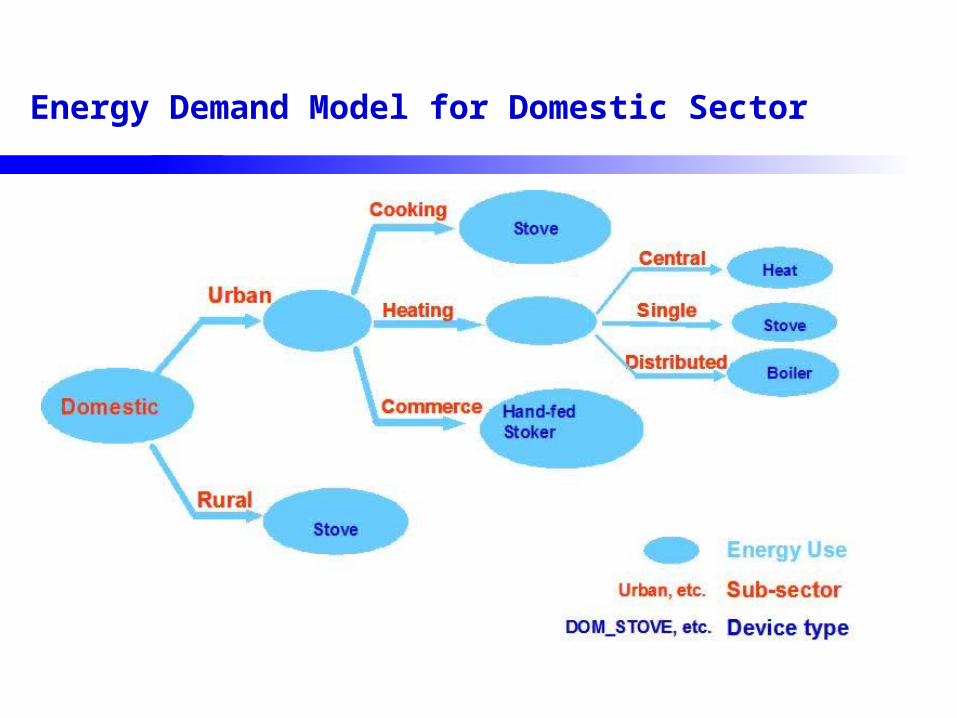
Energy Demand Model for Domestic Sector
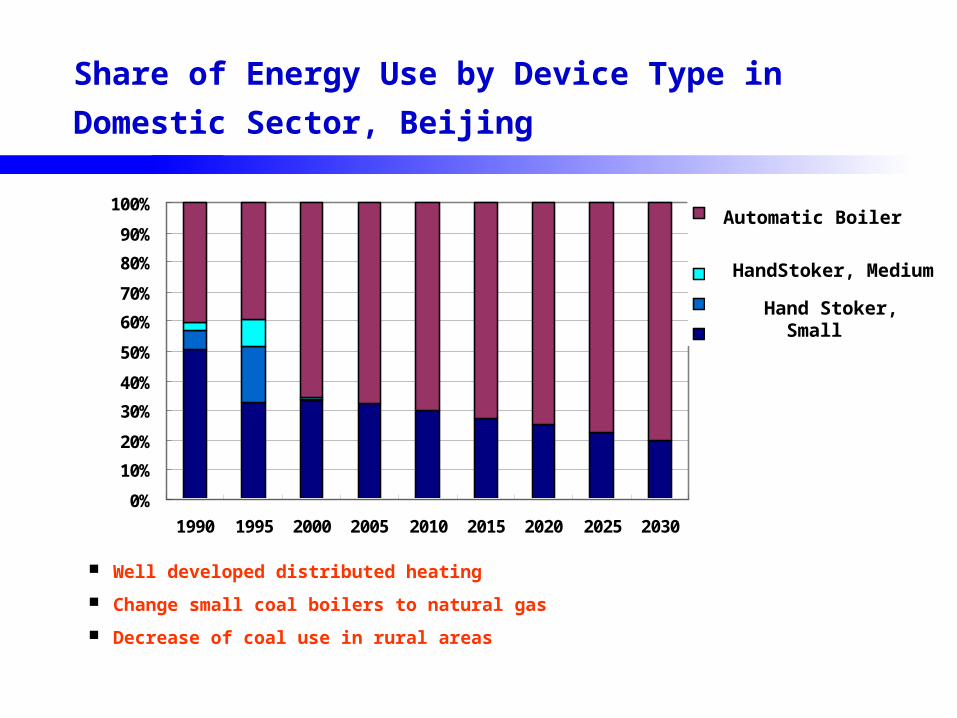
Share of Energy Use by Device Type in Domestic
Sector, Beijing
0%
10%
20%
30%
40%
50%
60%
70%
80%
90%
100%
1990 1995 2000 2005 2010 2015 2020 2025 2030
DOM_MB_A
DOM_SHB_A
DOM_MB_M
DOM_SHB_M
DOM_STOVE
Well developed distributed heating
Change small coal boilers to natural gas
Decrease of coal use in rural areas
Automatic Boiler
Stove
Hand Stoker, Small
HandStoker, Medium
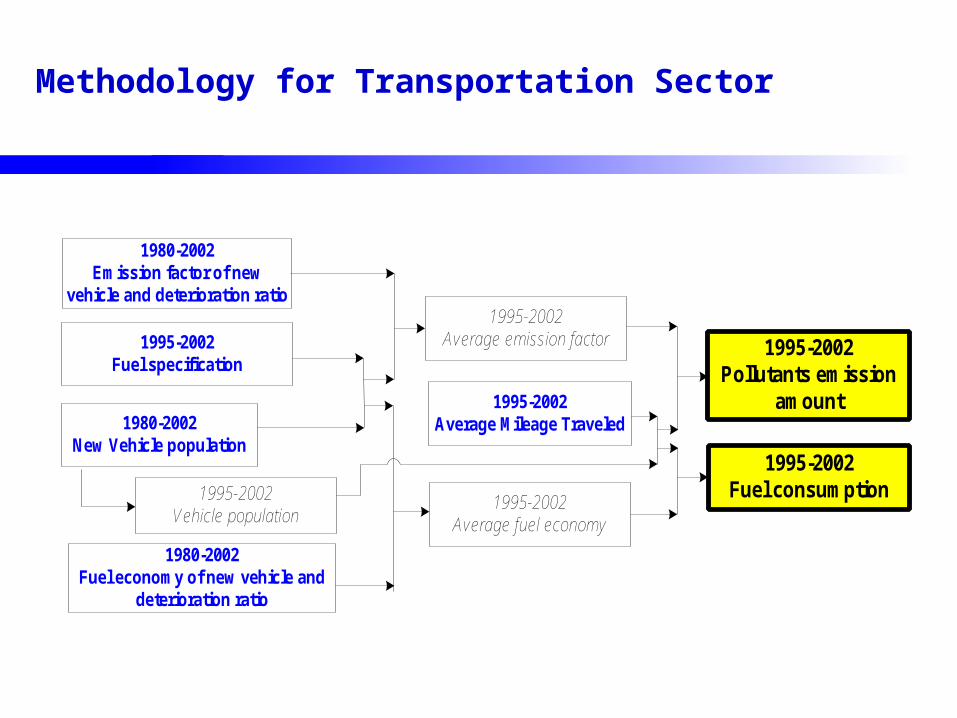
Methodology for Transportation Sector
1980-2002New Vehicle population
1995-2002Average Mileage Traveled
1980-2002Emission factor of new
vehicle and deterioration ratio
1980-2002Fuel economy of new vehicle and
deterioration ratio
1995-2002Fuel specification
1995-2002Average emission factor
1995-2002Average fuel economy
1995-2002Vehicle population
1995-2002Pollutants emission
amount
1995-2002Fuel consumption
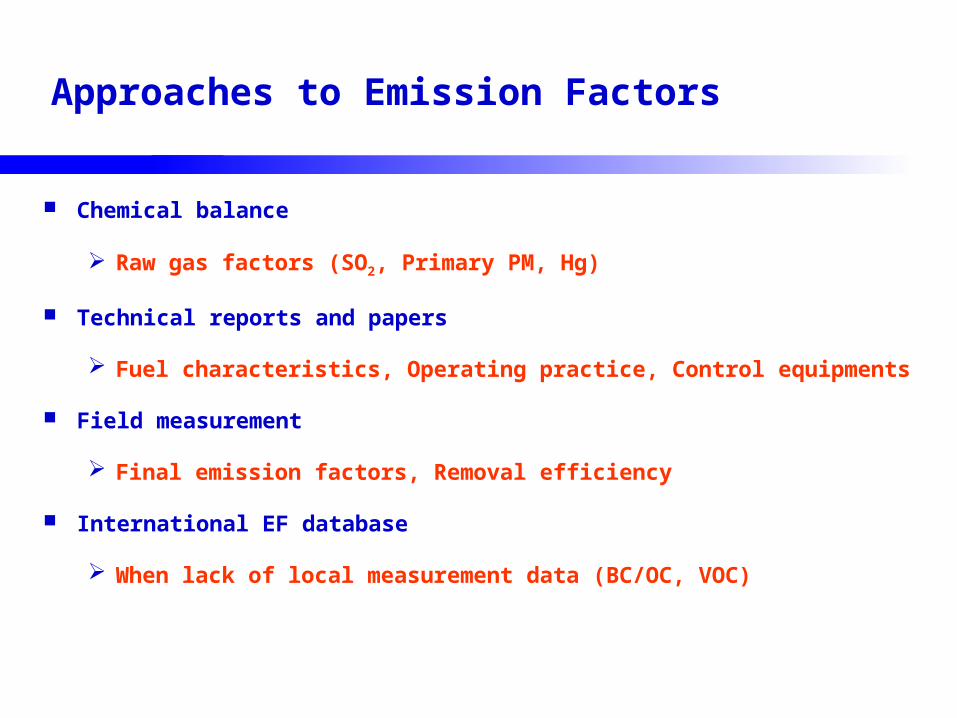
Approaches to Emission Factors
Chemical balance
Raw gas factors (SO2, Primary PM, Hg)
Technical reports and papers
Fuel characteristics, Operating practice, Control equipments
Field measurement
Final emission factors, Removal efficiency
International EF database
When lack of local measurement data (BC/OC, VOC)
0
20
40
60
80
100
120
140
160
180
1999 2001 Trace-P
Mill
ion
ton
s
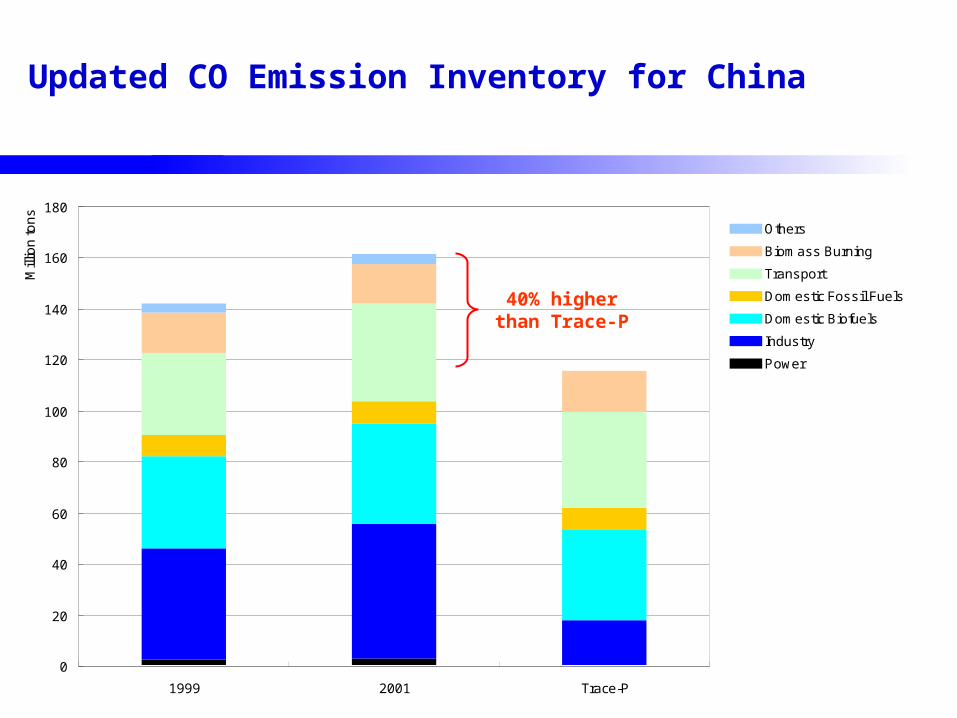
Others
Biomass Burning
Transport
Domestic Fossil Fuels
Domestic Biofuels
Industry
Power
Updated CO Emission Inventory for China
40% higher than Trace-P
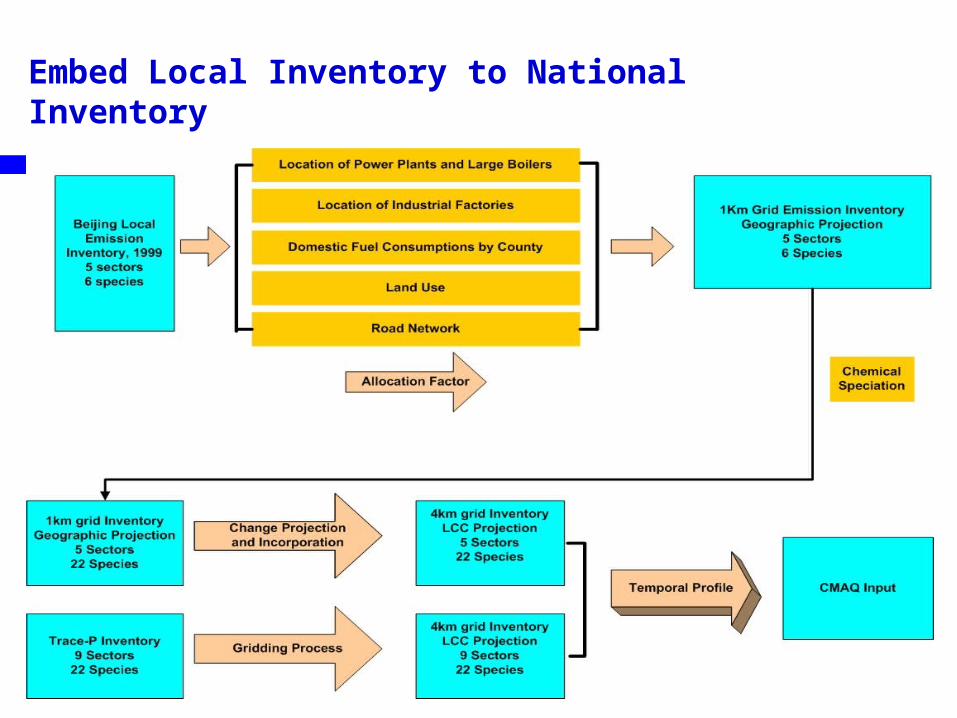
Embed Local Inventory to National Inventory
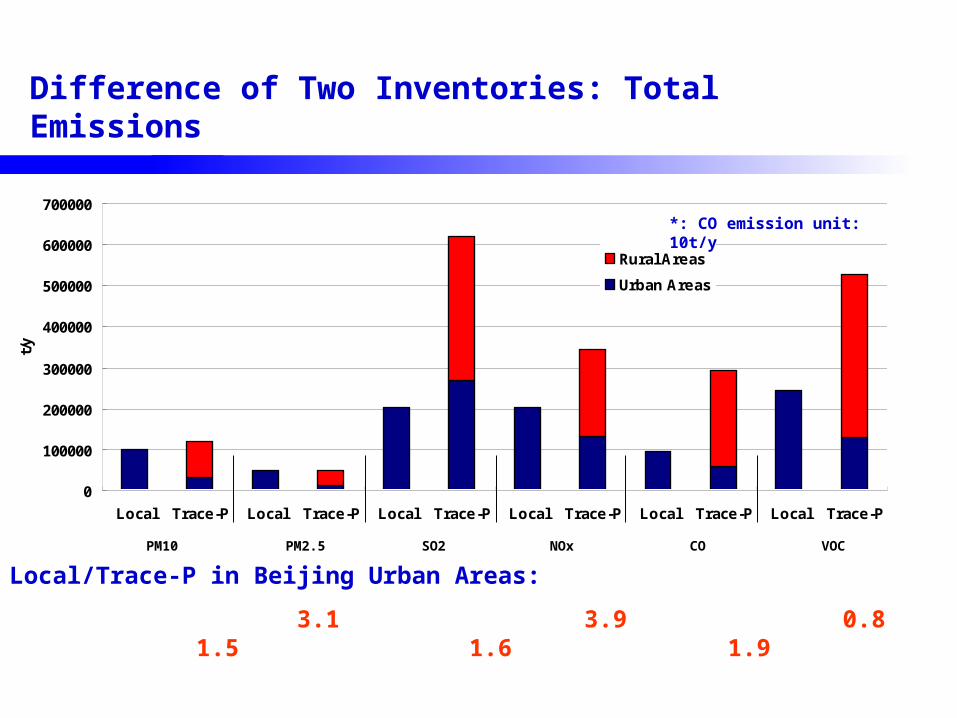
Difference of Two Inventories: Total Emissions
0
100000
200000
300000
400000
500000
600000
700000
Local Trace-P Local Trace-P Local Trace-P Local Trace-P Local Trace-P Local Trace-P
t/y
Rural Areas
Urban Areas
PM10 PM2.5 NOx VOCSO2 CO
*: CO emission unit: 10t/y
Local/Trace-P in Beijing Urban Areas:
3.1 3.9 0.8 1.5 1.6 1.9
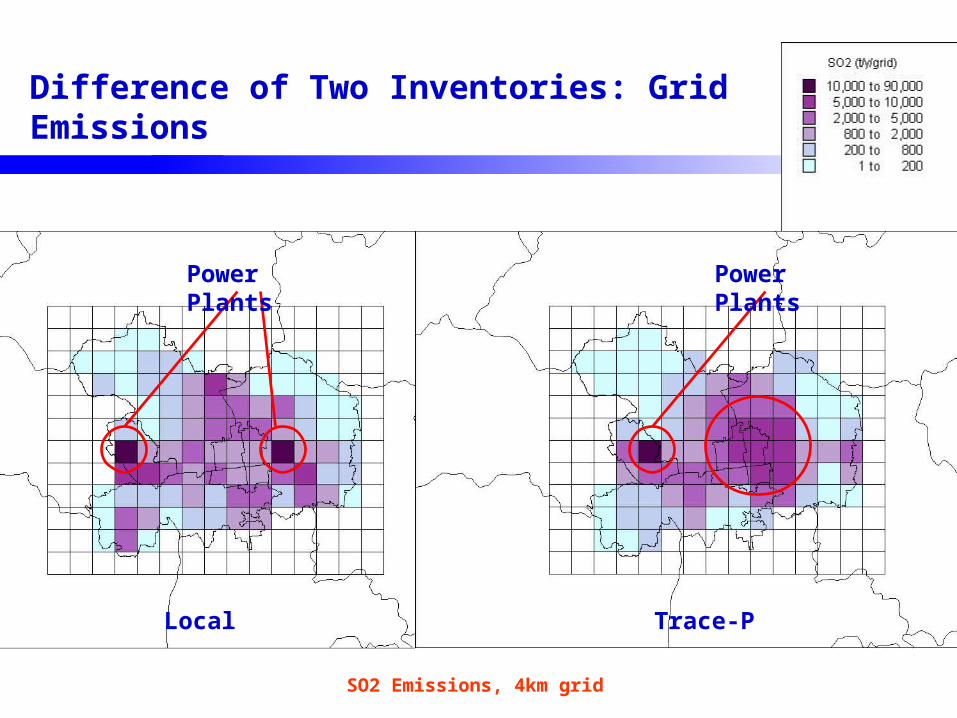
Difference of Two Inventories: Grid Emissions
Local Trace-P
Power Plants Power Plants
SO2 Emissions, 4km grid
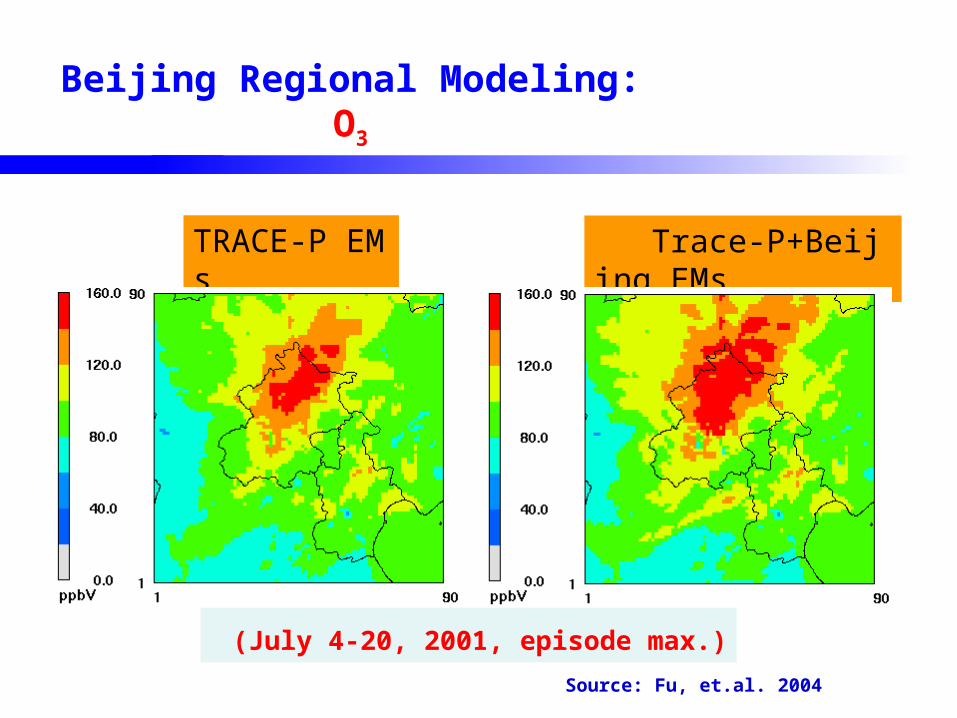
(July 4-20, 2001, episode max.)
TRACE-P EMs Trace-P+Beijing EMs
Beijing Regional Modeling: O3
Source: Fu, et.al. 2004
Progress and Future Work
CO
Primary PM: TSP, PM10, PM2.5
BC/OC
VOC
Field measurement for PM2.5/BC/OC emission factors
AcknowledgmentAcknowledgment
USEPA and USEPA and SEPASEPA IES ProjectIES Project GM and NSFCGM and NSFC Dr. Carey JiangDr. Carey Jiang Tsinghua UniversityTsinghua University

Thanks!Thanks!