Embed Size (px)
Citation preview

Jennifer S. Vey
fellow
The Brookings insTiTuTion | Metropolitan policy prograM | 2012
BuildingfromStrengthCreating opportunityin greater Baltimore’snext economy

2 BrookingS inStitution Metropolitan policy prograM
acknowledgments the Brookings institution Metropolitan policy program would like to thank the annie e. casey foundation for their generous
support of this report. the author is particularly grateful to patrice cromwell (Director of economic Development and integration
initiatives, center for community and economic opportunity), whose knowledge of and passion for the issues discussed in
these pages have been critical to the project. the Metro program also thanks the rockefeller foundation, John D. and catherine
t. Macarthur foundation, Heinz endowments, ford foundation, george gund foundation, f.B. Heron foundation, and the
Metropolitan leadership council for their ongoing support of the program.
the author also wishes to express her thanks and gratitude to the many people who provided important information, guidance,
and advice that helped build and improve the report. first, she wants to thank all those who provided personal or small group
interviews, or otherwise provided feedback on the project, including (in alphabetical order): tim armbruster (goldseker
foundation); Bill Barnes (university of Maryland, Manufacturing assistance program); Diane Bell-Mckoy (associated Black
charities); avonette Blanding (Maritime applied physics corporation); paul Brophy (Brophy and reilly, llc); Bill Burwell, Martin
Herbst, paul Matino, Janee pierre-louis, and Jeanne townsend (u.S. export assistance center); richard clinch (university of
Baltimore Jacob france institute); Martha connolly (Maryland industrial partnerships program); neil Davis (emerging technology
centers); Dennis faber (tiMe center at the community college of Baltimore county); Stuart fitzgibbon (Domino Sugar); kirby
fowler (Downtown partnership of Baltimore); andy frank (Johns Hopkins university); Mike galiazzo (the regional Manufacturing
institute of Maryland); Susan ganz (lion Brothers inc.); Bob giloth (annie e. casey foundation); elizabeth Hines (Baltimore
Development corporation); Seema iyer (university of Baltimore Jacob france institute); Bill king (roadmap); tom loveland (Mind
over Machines); Brad McDearman (Brookings institution); aris Melissaratos (Johns Hopkins university); tom Murphy (urban
land institute); katherine newman (Johns Hopkins university); Mary Jane norris (Maryland port authority); Brian o’Malley
(central Maryland transportation alliance); Jason perkins-cohen (Job opportunities task force); Mark rice (Maritime applied
physics corporation); Michael rosenbaum (catalyst it Services); larysa Salamacha (Baltimore Development corporation); Jane
Schaab (uMB Biopark); gloria Sandstrom and kipp Snow (anne arundel community college); Marsha Schachtel (Johns Hopkins
institute for policy Studies); eric Seleznow (national Skills coalition); karen Sitnick and Mary Sloat (Baltimore city Mayors office
of employment Development); Melanie Styles (abell foundation); Michael thomas (Baltimore city public Schools); David troy
(410labs); ken ulman, ira levy, laura neuman, and David nitkin (Howard county); robert wallace (BitHgroup technologies); and
Sharon webb (formerly of the greater Baltimore technology council).
She’d also like to thank alan Berube (Brookings institution); neil Davis (emerging technology centers); elizabeth kneebone
(Brookings institution); amy liu (Brookings institution); Jason perkins-cohen (Job opportunities task force); and Mark rice
(Maritime applied physics corporation) for their very helpful feedback on earlier drafts of this report.
finally, the author wishes to thank emilia istrate, Jonathan rothwell, and adie tomer at the Brookings institution for providing
advice, suggestions, and critical data and analysis, and David Jackson, John fairbanks, rachel Harvey, and rahsheeda ali for
polishing and disseminating the final report. She especially wants to express her deep appreciation to alan Berube for his always
sage guidance, and to carey nadeau for her tireless data collection, rigorous analysis, keen suggestions, and overall good spirit
throughout the duration of this project.
About the author: Jennifer S. Vey is a fellow with the Brookings institution Metropolitan policy program and a Baltimore resident.
contact her at [email protected].

3Building from sTrengTh: creating opportunity in greater Baltimore’s next economy | Contents
contentsAcknowledgments ....................................................................................................................................................................................2
executive summary .................................................................................................................................................................................4
i. introduction..........................................................................................................................................................................................11
ii. greater Baltimore’s opportunity Challenge....................................................................................................................................15
a wide opportunity gap.............................................................................................................................................................................................17a faulty opportunity Structure ................................................................................................................................................................................18a new economic order...............................................................................................................................................................................................20
iii. greater Baltimore’s next economy ................................................................................................................................................23
greater Baltimore’s next economy today..............................................................................................................................................................24opportunity in the next economy............................................................................................................................................................................25Manufacturing...............................................................................................................................................................................................................28information technology .............................................................................................................................................................................................32Bioscience ......................................................................................................................................................................................................................36the clean economy .....................................................................................................................................................................................................40transportation and logistics.....................................................................................................................................................................................44
iV. Barriers to opportunity ....................................................................................................................................................................50
Barriers to growing the next economy ..................................................................................................................................................................51Barriers to accessing the next economy ...............................................................................................................................................................52
V. A new framework for Change ...........................................................................................................................................................57
Vi. Conclusion .........................................................................................................................................................................................63
endnotes ..................................................................................................................................................................................................65

4 BrookingS inStitution Metropolitan policy prograM
executive Summary
according to many broad economic indicators, the Balti-
more metropolitan area is doing better than fine. in 2010,
the median household income for the region was nearly
$15,000 higher than for the country at large, and over the
10 years prior, real incomes rose in the metro, if slowly, even while incomes
nationally shrank by more than 7 percent. employment grew from 2000 to
2010 while declining nationwide, and during the economic downturn, the
area’s unemployment rate was consistently lower than the majority of its
metropolitan peers.
5Building from sTrengTh: creating opportunity in greater Baltimore’s next economy | executive summary
yet anyone who lives and works in greater Bal-
timore knows the region is also home to many
families and neighborhoods challenged by varying
levels of economic and social distress. although
only about 10 percent of the region’s residents are
considered poor, nearly a quarter are low-income,
meaning they are part of a family with a total
income that is below 200 percent of the federal
poverty line. yet the regional economy hums
along, baring the somewhat disquieting truth that
a good economy for most can be had even while
many aren’t reaping its benefits.
efforts and ideas to change this paradigm abound.
the public, non-profit, and philanthropic sec-
tors—in Baltimore and throughout the country—
spend billions each year trying to help fill the gap
between what a household can afford and what it
actually takes to pay for basic needs. as critical
as these interventions are, however, they are not
targeted at expanding opportunity—that is, mak-
ing greater numbers of middle-wage jobs available
and accessible to those who want to get ahead—as
much as trying to compensate for the fact that
there isn’t enough of it.
this report proposes a different approach, one
simultaneously focused on investing in efforts to
grow a more opportunity-rich “next economy” and
helping low-income residents gain the education,
skills, and other capacities needed to participate in
it. to this end, it advances three primary messages:
➊ greater Baltimore is not generating enough
quality jobs, and low-income people aren’t
accessing them. although Baltimore’s low-income
residents have higher rates of unemployment than
metro residents overall, 97 percent of them have a
job or have held one in the recent past.
Some of those workers may be only tenuously
attached to the labor force, either moving in and
out of employment or steadily working, but only
part-time. But the fact remains that many low-
income residents simply don’t earn very much. in
fact, about three-quarters of the region’s low-
income workers are employed in just a few indus-
tries, including healthcare, social, or educational
services, arts and entertainment, accommoda-
tion and food services, retail, construction, and
administrative services. these industries don’t
pay uniformly low wages, but they are big regional
employers, with large shares of low-wage occupa-
tions. for example, approximately 10 percent of
the total metro workforce is employed in retail,
an industry in which more than 76 percent of jobs
were in low-wage occupations. and while average
annual wages in the healthcare and social assis-
tance sector are approaching the average for all
industries in the metro, 47 percent of the nearly
182,000 workers in the sector are employed in
low-paying jobs.tpD
yet it is not just low wages themselves that explain
why greater Baltimore has so many low-income
residents. rather, the region has an economic
structure that for years has been producing too
few decent-paying jobs that too few low-income
workers are able to access.
though the Baltimore region saw somewhat
stronger job growth than the u.S. in the seven
years leading up to the recession and experienced
less job loss during it, its jobs engine over the past
few decades has been sputtering. an examina-
tion of job growth by industry reveals that during
the 27-year period prior to the great recession,
growth in the lowest-paying third of greater Balti-
more’s industries was 62.5 percent, closely mirror-
ing that of the nation as a whole. But the number
of jobs in the middle-paying third of industries
rose by less than 37 percent, compared to 40 per-
cent nationally, and growth in the highest-paying
third was just 9.6 percent, while the u.S. saw an
increase nearly three times that much.
economists have been working furiously to under-
stand these trends, and in so doing have revealed
several key factors that for years have conspired
to undermine the nation’s—and its metros’—ability
to create more and better-quality jobs. for one
thing, the pace of u.S. innovation—a key driver
6 BrookingS inStitution Metropolitan policy prograM
of productivity and ultimately wage growth—has
slowed over the past few decades. Meanwhile, the
vast majority of u.S. firms have not adequately
positioned themselves to take advantage of grow-
ing markets abroad, and few states and metros
have put adequate policies and resources in place
to help them. finally, the american workforce has
been losing some of its competitive edge, with
many workers lacking the skills and education
needed to successfully compete in a globalizing
economy.
given that the u.S. economy is largely driven by its
metropolitan areas, it makes sense that employ-
ment and wage trends in greater Baltimore have
been strongly influenced by these same forces.
➋ greater Baltimore has significant assets on
which to build a more opportunity-rich next
economy, but they aren’t being fully exploited.
if the past tells us anything about the future, it’s
clear that realizing a more productive, inclusive
economic future will require a new model for next
economy growth. Such a model demands that
we take advantage of growing talent, demand,
and investment from countries abroad by sup-
porting export-oriented firms and other kinds of
global engagement. it will require that we con-
tinually innovate in the products and processes
that improve how we live and work—including in
the low carbon technologies that will advance
global health and environmental sustainability,
strengthen our resource security, and boost u.S.
leadership in the clean energy revolution. and it
will compel us to provide better ways for work-
ers to get the skills and education they need to
produce, deploy, and ultimately share the rewards
from that which we invent.
greater Baltimore has a powerful set of assets and
advantages that should allow it to grow and excel
in such an economy, including a robust network
of colleges and universities, several world-class
hospital systems, close proximity to the nation’s
capital and, importantly, sophisticated firms,
skilled talent, and formidable research capacity.
But these assets haven’t been fully leveraged.
though the Baltimore metro produced $9.7 bil-
lion in total international exports in the 2010, the
export share of the metro’s total gMp is only 6.7
percent, ranking it 89th among its metro peers
nationwide. though the region excels on many
typical indicators of scientific discovery and tech-
nological advancement, it is weak when it comes
to translating its significant amount of life sci-
ences and other research into new products and
services, and the creation of new businesses is
slow. and though its green economy is relatively
large based on sheer size—its nearly 23,000 jobs
ranks the area 22nd among the top 100 metros—the
sector comprises a fairly small share (1.7 percent,
ranking it 51st) of its overall economy.
given its strengths—and weaknesses—it seems evi-
dent that efforts to move the region more firmly
into the next economy will require a particular
focus on industries that have the best potential to
drive economic growth:
● a healthy, globally-connected manufacturing
sector● a robust, market-oriented bioscience industry● an open, entrepreneurial information tech-
nology sector ● a large, diverse set of firms and jobs that con-
vey a “green” benefit, and● a transportation and logistics system that
can efficiently and effectively move goods
and people both within and outside the
region.
together, these five often intertwining industries
can help ease the way we do business, improve our
health, preserve natural resources, and allow us
to access goods, services, and information more
quickly than ever before. But perhaps the best
reason greater Baltimore should work to grow and
develop these industries is because doing so will
help build an economy characterized by greater
numbers of good-paying jobs that greater num-
bers of workers can access.

7Building from sTrengTh: creating opportunity in greater Baltimore’s next economy | executive summary
indeed, a detailed analysis of these five key next
economy industries reveals that the share of work-
ers earning a middle wage or better is higher in
each than it is for the Baltimore metro as a whole.
even better, these industries have a higher share
of workers who are earning a decent living without
having completed a 4-year college degree: though
only 31 percent of all Baltimore workers without
a bachelor’s degree are employed in well-paying
occupations, the same can be said for 51 percent
of transportation and logistics workers, 45 percent
of manufacturing workers, 42 percent of clean
economy workers, 39 percent of bioscience work-
ers, and 36 percent of it workers. it’s just these
“opportunity sweet spots” that the region should
be working to expand.
➌ greater Baltimore needs to focus both on
investing in the next economy and ensuring
low-income people are connected to it. the
Baltimore metro has strong seeds from which to
grow a more export-oriented, innovative, greener
region. But for the metro’s low-income residents,
the next economy is still too small, and too far
out of reach. in fact, only a small fraction of the
working poor were employed in the region’s five
next economy industries at some point during the
past 5 years, which is precisely the point: if they
were—at least somewhat steadily—they very likely
wouldn’t be low-income.
it is, in part, a matter of scale: as yet, these indus-
tries today simply aren’t large enough—nor grow-
ing enough—to absorb all the low-income workers
who might wish to join their ranks. Beyond this
is the fact that many of the region’s low-income
workers face a range of barriers to attaining next
economy jobs, possessing neither the education
and skills employers need, nor the robust social,
institutional, and physical connections needed to
access—or perhaps even know about—the opportu-
nities embedded in them.
as this report argues, it’s time to take a different
tack.
in the first place, greater Baltimore’s public,
private, and non-profit leaders—along with the
state—need to be far more visionary, far more
coordinated, and far more strategic about grow-
ing the next economy industries in which good
wage jobs are the norm rather than the excep-
tion. this means strengthening the next economy
attributes that makes these sectors so critical to
the region’s future:
➤ Build a stronger export economy. to succeed
in an increasingly competitive global economy,
Maryland and greater Baltimore must help
firms overcome their reticence to export, and
find new ways to tap growing markets abroad.
this will require a thorough assessment of the
major barriers to exporting that companies
face, and what they need to surmount them.
armed with that information, the state and
region should then work together to develop a
strategy for increasing regional exports, with
both quantifiable goals and clear measures for
evaluating progress.
➤ Provide greater support for innovation and
entrepreneurship. greater Baltimore needs to
covert more of its research into new products
and firms, while at the same time ensuring that
existing businesses—particularly manufactur-
ers—are able to embrace new innovations:
● help new ideas become new businesses. to
support the development and commercializa-
tion of early stage technologies, the public,
nonprofit, and private sector must continue
to work together to grow and organize the
metro’s angel community and mobilize it to
make the early investments that traditional
venture capitalists won’t. regional leaders
should also consider how universities, incu-
bators, educational and business coaching
services, housing, and other amenities can be
brought together in close geographic space—
as leaders in Barcelona, Spain did—to advance
innovation and entrepreneurship.

8 BrookingS inStitution Metropolitan policy prograM
● help manufacturers stay on the cutting
edge. to help small- and mid-sized manu-
facturers (SMMs) implement new technolo-
gies—as well as the changes in management
processes, work organization, and supply-
chain relationships that often must accom-
pany them—state and regional leaders could
in the short term encourage firms to form a
consortia focused on promoting manufactur-
ing innovation, and helping workforce provid-
ers design training programs that meet their
needs. over the longer term, the public and
private sectors should work with universi-
ties and other organizations to establish an
advanced manufacturing research center
in the region that would assist firms with
research commercialization, technology
transfer, and production innovation.
➤ Build on the region’s clean economy
strengths. to grow the clean economy, the
region, aided by the state, should rigorously
appraise the metro’s clean economy strengths,
opportunities, and the impediments to future
growth and development. leaders then need
to use this analysis to help break down existing
regulatory, financial, and other barriers to firm
and job growth. Such efforts might include, at
one end the spectrum, a revamping of govern-
ment procurement processes so as to stimulate
demand for local green products and services,
or at the other, marketing Maryland firms to
countries and companies abroad.

9Building from sTrengTh: creating opportunity in greater Baltimore’s next economy | executive summary
these and other strategies aimed at promoting
the growth of greater Baltimore’s next economy
industries are essential—but they are not enough.
growing an opportunity-rich next economy also
means ensuring that regional workers have the
information, skills, and connections needed to
participate in it, and that next economy employ-
ers thus have the labor force they need to expand
and succeed:
➤ Help young and incumbent workers get the
skills and education next economy employ-
ers need. to respond to a rapidly changing
economy, greater Baltimore’s education and
training providers must be able to nimbly adapt
their curricula around the specific skills next
economy firms require, while also employing
‘bridge’ and other programs that help more
of those who enter their programs—whether
straight from high school, or after years of
work—stay the course and earn a credential.
perhaps most importantly, the workforce
system needs to work much more closely with
employers to increase the availability of appren-
ticeships, mentoring programs, and on-the-job
training opportunities so that formal schooling
is accompanied by real world experience.
➤ Build a more coordinated workforce delivery
system. to create a more integrated, com-
prehensive, and ultimately successful educa-
tion and workforce structure, leaders need to
take an inventory of all the public, private, and
nonprofit providers in the delivery system,
the types of programs they offer, how suc-
cessful they are in helping residents secure a
good job, and the industries in which they are
landing. only by doing so can they begin to
identify gaps and then work with providers and
employers to help fill them. then all the players
in the system—businesses, community col-
leges, government, non-profits—must together
develop a common regional vision and a set
of goals against which to measure their joint
progress toward not simply serving residents,
but actually helping them access, maintain,
and ultimately help create quality employment
opportunities in growing sectors.
➤ Improve low-income workers’ ability to get
to next economy jobs. to broaden participa-
tion in the next economy, regional leaders must
target land use, transportation, and infrastruc-
ture investments so as to better align, and help
spur, residential and business development,
while also helping improve physical connectivity
between people and jobs. integrating existing
state and local efforts to foster transit-oriented
development (toD) in the metro into a next
economy economic development strategy will
be critical to this process, as will the continued
build out of transportation infrastructure like
the proposed red line.
greater Baltimore has the institutional and eco-
nomic strength necessary to bring about the kind
of transformational change suggested by these
strategies. regional leaders must now build on
that strength with a bold vision of the possible,
and the collective will to achieve it. n
greater Baltimore has the institutional and economic strength necessary to bring about the kind of transformational change suggested by these strategies.


11Building from sTrengTh: creating opportunity in greater Baltimore’s next economy | i. introduction
i. introduction
in 2010, the economic alliance
of greater Baltimore devel-
oped a presentation designed
to debunk the long-held myth
that Baltimore was a distressed,
post-industrial region still strug-
gling to gain a foothold in the 21st
century economy. “the new greater Baltimore,” which was presented
to groups around the metropolitan area, argued—quite rightly—that the
metro area outshined many of its peers on a wide range of indictors. the
presentation showed that by the late 2000s the region ranked in the top
10 of u.S. metropolitan areas in terms of per capita personal income (9th),
growth in per capita income (1st), employment growth (8th), concentration
of management occupations (8th), and bachelor’s degree attainment (9th),
to name just a few.1 Moreover, investments in downtown Baltimore city and
adjacent communities had grown substantially, and although the region
was hardly unscathed by the recession, it had weathered it far better than
many other regions had.2 the overall message of the presentation was
strong and positive: greater Baltimore is healthy and thriving and it
possesses a potent combination of talent and assets necessary
for a region to compete in the global economy.
greATer BAlTimore is defined
here as the Baltimore-Towson metropolitan
statistical Area (msA), which comprises
Baltimore City, and Anne Arundel,
Baltimore, Carroll, harford, howard, and
Queen Anne’s counties. The msA is also
referred to as the “metro area” or “region”
throughout the report.
BaltimoreCity
BaltimoreCounty
CarrollCounty
HowardCounty
Anne ArundelCounty
HarfordCounty

12 BrookingS inStitution Metropolitan policy prograM
But not everyone was buying it. although no
one could dispute the veracity of the numbers
as presented, the facts did not resonate so well
with those audience members who experienced
a very different side of Baltimore—the side where
the deep social and economic challenges, such as
those portrayed in The Wire, were being lived out
in the real world by thousands of city and, increas-
ingly, suburban families every day. Such feelings
were, perhaps, based less on outright disbelief of
the regional statistics and more on the convic-
tion that true economic success must be far more
inclusive of all of the region’s constituent parts.
Should a metropolitan area really tout its progress
and prosperity if so many of its residents are being
left so far behind?
it is a fair question, embedded in which is a messy
set of queries not just about issues of equity and
social justice but also about the goals of regional
economic development, the measures of economic
success, and the ability of a region
to sustain economic growth if not enough resi-
dents are fully participating in it. at its heart, it
is a question about economic opportunity: what
it means and what strategies public, private, and
philanthropic leaders should employ in order to
expand it.
this report takes a hard and somewhat unique
look at these issues. By citing findings from both
empirical analyses and dozens of interviews, it
strives to make the case that efforts to increase
economic opportunity must be rooted in efforts to
create a more opportunity-rich regional economy
and to help low-income residents gain the edu-
cation, skills, and other capacities necessary to
connect to it.
this idea, which focuses on re-shaping the struc-
ture of regional economic growth and the labor
market needed to fuel it, is generally accepted in
theory but is rarely adopted in actual practice,
in Baltimore or elsewhere. for their part, eco-
nomic development professionals tend to focus
on job creation and income growth in the main
and are less deeply concerned—particularly if the
numbers look good—with how the nature of that
growth impacts the status and success of all of the
households and neighborhoods in their purview.
the precise opposite is true of many nonprofit
and advocacy organizations, which tend to take
the economy as it is and then try to make up for
its opportunity gaps through poverty alleviation,
workforce, or neighborhood revitalization pro-
grams narrowly targeted to the people and com-
munities most in need. Meanwhile, neither of these
approaches has at its core a focus on expanding
what Michael porter and Mark kramer call “the
total pool of economic and social value,” which
in this case is the overall regional “pie” of better-
paying industries providing better-paying jobs that
span the skills spectrum.3
So, what is behind this disconnect? and how, then,
can it be bridged?
this report pres-ents a different way of thinking about opportunity and how efforts to increase it should be moved from the margins into the mainstream of regional eco-nomic planning and development.

13Building from sTrengTh: creating opportunity in greater Baltimore’s next economy | i. introduction
as these pages argue, it is not the theory itself
that is the problem: everyone wants a strong
regional economy. rather, the problem is an eco-
nomic development model that, positive statistics
notwithstanding, has not focused on advanc-
ing the sectors that could broaden Baltimore’s
economic prosperity, and on helping to increase
workers’ ability to access them. Summarizing the
work of several economists, this report discusses
the impact this has had on the type and quality
of job growth and how that informs where the
metro area, and the nation, should go from here.
ultimately, if greater Baltimore and its peers
truly want to increase economic opportunity, they
must embrace a different framework for the “next
economy,” one based not on greater domestic
consumption—of real estate, retail, government,
and health care, for example—but rather on export-
ing goods, services, and ideas to consumers both
outside the region and abroad; on developing and
sharing innovations in how things are made and
people are served; and on creating and implement-
ing low-carbon technologies and practices that
will improve and sustain environmental health and
security for future generations (while creating
good jobs in the process). and greater Baltimore
must ensure that it has a coordinated, cutting-
edge education and workforce delivery system
that can produce the labor force this growth
will require.
greater Baltimore has a powerful set of assets and
advantages that should allow it to grow and excel
in such an economy, including a robust network
of colleges and universities, several world-class
hospital systems, a close proximity to the nation’s
capital, and, importantly, the sophisticated firms,
skilled talent, and formidable research capacity
that have grown from and around these institu-
tions. However, these assets have not been fully
leveraged. indeed, although these institutional
anchors have helped to ensure economic stability
in the metro area, they have also weighed it down,
making it too comfortable and too complacent to
vigorously appraise the strengths and sectors that
drive real economic growth and develop a regional
vision and strategy to more aggressively exploit it.
the metro area thus plods along, content with the
“good-enough-for-most” economy it has rather
than the globally connected, and ultimately more
inclusive, economy it should have.
it is time to shake things up
this report presents a different way of thinking
about opportunity and how efforts to increase
it should be moved from the margins into the
mainstream of regional economic planning and
development. it begins by describing how, despite
greater Baltimore’s overall good health, low
incomes and limited mobility remain a steep chal-
lenge in the region. it then examines the extent to
which this is a function of how the region’s econ-
omy—like that of the nation—had been growing
prior to the great recession of 2007–2009. from
here it examines the metro area’s next-economy
assets, specifically focusing on the industries and
sectors—manufacturing, information technology,
bioscience, the “clean” economy, and transporta-
tion and logistics—that offer the most promise for
more and better quality employment opportunities
in the years to come. it then looks at the major
challenges to keeping and creating jobs in these
industries as well as the information, skills, and
spatial barriers that can keep individuals from
attaining these jobs. finally, the report urges
metro area leaders to develop and embrace a new
regional vision for a more opportunity-rich greater
Baltimore, and it suggests some of the key strate-
gies they must employ—concertedly and collec-
tively—to help realize it. n

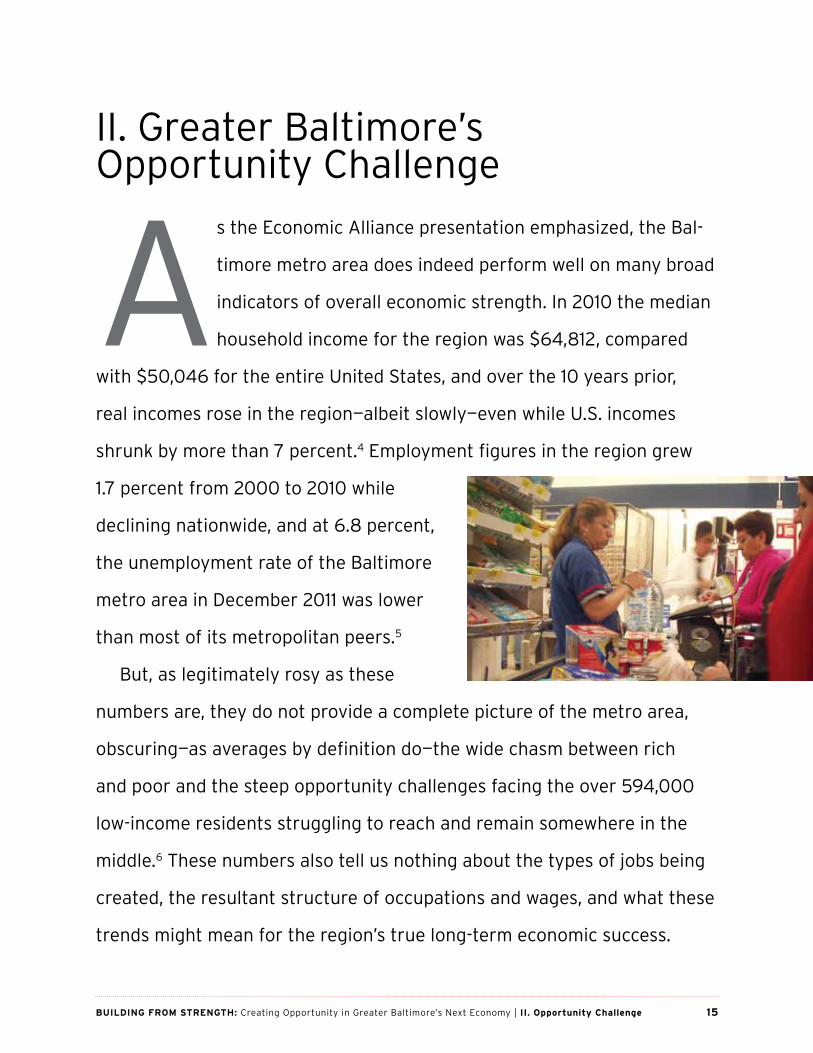
15Building from sTrengTh: creating opportunity in greater Baltimore’s next economy | ii. opportunity Challenge
ii. greater Baltimore’s opportunity challenge
as the economic alliance presentation emphasized, the Bal-
timore metro area does indeed perform well on many broad
indicators of overall economic strength. in 2010 the median
household income for the region was $64,812, compared
with $50,046 for the entire united States, and over the 10 years prior,
real incomes rose in the region—albeit slowly—even while u.S. incomes
shrunk by more than 7 percent.4 employment figures in the region grew
1.7 percent from 2000 to 2010 while
declining nationwide, and at 6.8 percent,
the unemployment rate of the Baltimore
metro area in December 2011 was lower
than most of its metropolitan peers.5
But, as legitimately rosy as these
numbers are, they do not provide a complete picture of the metro area,
obscuring—as averages by definition do—the wide chasm between rich
and poor and the steep opportunity challenges facing the over 594,000
low-income residents struggling to reach and remain somewhere in the
middle.6 these numbers also tell us nothing about the types of jobs being
created, the resultant structure of occupations and wages, and what these
trends might mean for the region’s true long-term economic success.
16 BrookingS inStitution Metropolitan policy prograM
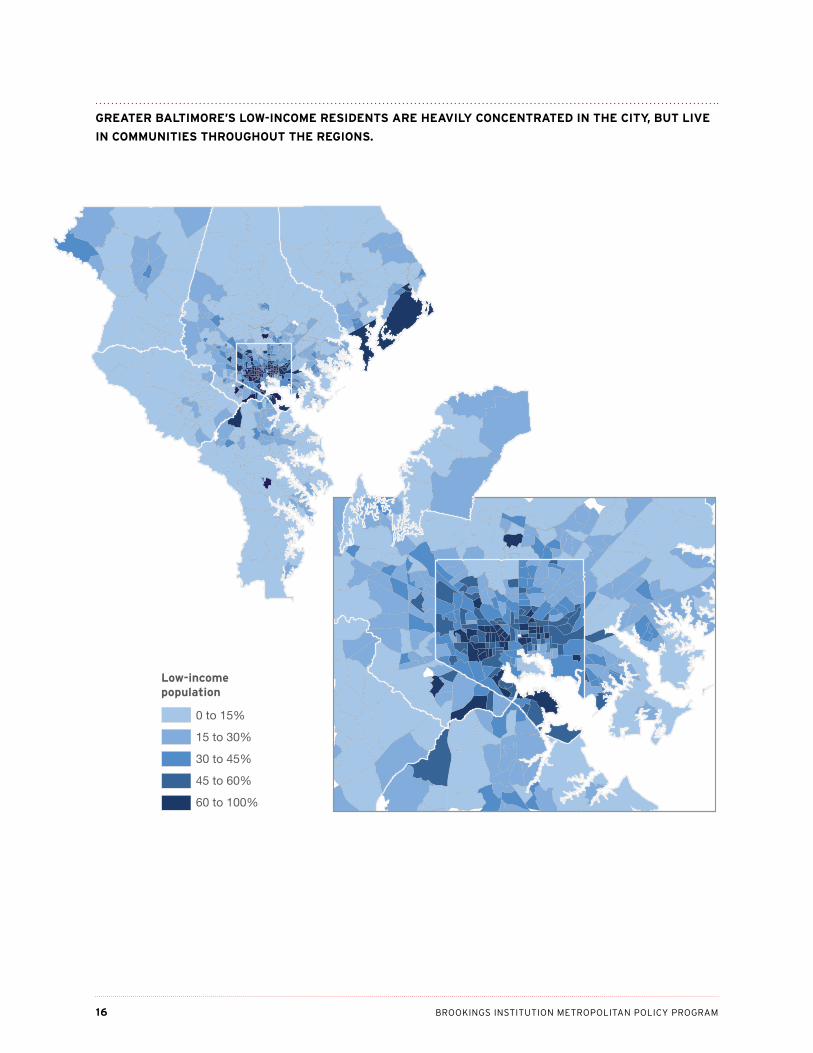
Low-incomepopulation
0 to 15%
15 to 30%
30 to 45%
45 to 60%
60 to 100%
greATer BAlTimore’s low-inCome residenTs Are heAVily ConCenTrATed in The CiTy, BuT liVe
in CommuniTies ThroughouT The regions.

17Building from sTrengTh: creating opportunity in greater Baltimore’s next economy | ii. opportunity Challenge
A wide opporTuniTy gApalthough official metropolitan poverty statistics
are an instructive measure of an area’s poor popu-
lation, they provide only a conservative estimate
of the true scope and scale of its opportunity gap.
in fact, although slightly more than 10 percent
of the residents of greater Baltimore are living
in poverty, a far larger 23 percent of the region’s
residents are low income, meaning that they are
part of a family with a total income that is less
than 200 percent of the federal poverty line, or
less than $46,630 for a family of four.7 and their
numbers have been growing. although the total
metro area population increased just 6.2 percent
over the period 2000 to 2010, the total number of
low-income residents rose by 7.6 percent.8
Having a low annual income is just one of things
that sets low-income metro area residents apart
from many of their wealthier counterparts. in the
first place, they are more densely clustered in
city and inner suburban neighborhoods, although
not exclusively so.9 they are most heavily con-
centrated in the now-famed areas of east and
west Baltimore, but many live in the southern and
northwestern parts of the city, towson, edgewood,
and catonsville, among other areas. (See map.)
the region’s low-income residents are also dispro-
portionately black—nearly one-half, in fact, despite
the fact that blacks make up only 29 percent
of the metro area population—and 45.5 percent
of low-income households are headed by single
parents, compared with 23 percent of all metro
area households. perhaps not surprisingly, low-
income Baltimoreans are also much more likely to
be unemployed: nearly 24 percent, compared with
8 percent of all metro area residents in 2009 (the
latest year for which data on employment status
for low-income residents are available).10
although being chronically out of work is one
explanation for why some Baltimoreans have low
incomes, it is only part of the problem. in fact,
nearly 97 percent of low-income people in the
metro area worked at some point during the last
five years of the 2000s, a statistic that begs the
region’s big opportunity question:11 if so many of
greater Baltimore’s low-income residents have or
have recently had a job, why aren’t they getting
further ahead?
the answer, of course, is complicated. Some por-
tion of the metro area’s low-income workers, for
instance, recurrently move in and out of work as a
result of myriad factors that might include job loss
associated with the economic downturn, substance
abuse or other health problems, child care or
transportation challenges, or a shaky work ethic,
among others. Some individuals may work only
part-time or only part of the year, and not always
by choice. and still others might have steady, full-
time work that pays well enough to be a middle
income single person but, because income status
is based in part on the number of family members,
not well enough to be a middle income single par-
ent of two.
60%
40%
20%
0%
Metro population Low-Income population
White Black Other Hispanic
neArly hAlf of The meTro’s low-inCome
populATion is AfriCAn-AmeriCAn

18 BrookingS inStitution Metropolitan policy prograM
But the fact remains that many low-income Bal-
timoreans simply do not earn very much. this is
partly because of the obvious truth that certain
jobs pay low wages, and those with low incomes
are concentrated in those jobs. as the the pie
chart above illustrates, about three-fourths of
the region’s working poor are employed in just a
handful of industries. for example, over 22 percent
of low-income workers are employed in health
care, social, or educational services; more than 14
percent work in arts, entertainment, recreation,
accommodations, and food services; and another
14 percent work in retail.12
these industries do not pay uniformly low wages,
but they are big regional employers that provide
large numbers of low-wage jobs. in 2009, for
example, about 133,500 Baltimoreans—approxi-
mately 10 percent of the total metro area work-
force—were employed in retail, where more than
76 percent of jobs are in low-wage occupations.
Similarly, nearly 95,450 metro area residents (7.3
percent) were working in accommodation and food
services, where more than 93 percent of jobs are
low wage. and although average wages in health
care and social assistance ($49,460) are higher
than those in retail ($30,040) or accommodation
and food services ($20,840), 47 percent of the
nearly 181,650 workers in the field are employed in
low-paying jobs.13
However, it is not just low wages that explain why
there are so many low-income residents, but an
economic structure that has been producing too
few better-paying jobs—jobs that, as this report
discusses later, too few low-income workers are
able to access.
A fAulTy opporTuniTy sTruCTurelong before the great recession swept the globe,
something went amiss with the u.S. jobs engine.
for one thing, the national economy simply had
not been generating many jobs. as documented in
a January 2011 National Journal article, between
the 2001 recession and the financial collapse
in 2008, the united States experienced strong
growth in gross national product, skyrocketing
corporate profits, and a low unemployment rate,
but job creation rates were slower than at any
time since world war ii.14 from 2000 to 2007, job
growth in the united States was just 3.8 percent,
following nearly 19 percent growth during each
from 2005 To 2009, oVer 97% of low-inCome residenTs were employed for some period,
lArgely in jusT A hAndful of indusTries.
7.6%
8.2%
8.9%
13.8%
14.3%
22.2%
24.9%
Other services (except public administration)
Administrative & support
Construction
Retail trade
Arts, entertainment, recreation, accommodations, & food services
Educational, health,& social services
Other*
*No one industry has more that 5 percent share of total employment.

19Building from sTrengTh: creating opportunity in greater Baltimore’s next economy | ii. opportunity Challenge
of the previous two decades. Job creation then
plummeted during the great recession, with the
4.7 percent rate of job loss from 2007 to 2009
wiping out every new job created since the new
century began, and then some.15
and so it went in greater Baltimore. indeed,
though the region saw somewhat stronger job
growth than the united States as a whole in the
seven years leading up to the recession (5.0
percent) and experienced less job loss during this
time, its own jobs engine has been sputtering. the
7.7 percent job growth rate that occurred in the
metro area during the 1990s was far lower than
the national average, and was a steep drop from
the 18.5 percent growth rate the region witnessed
during the 1980s.16
perhaps even more significant than the slow pace
of job creation over the past few decades is the
type of jobs that were being created. an examina-
tion of long-term job growth by industry reveals
the lopsided growth in lower-paying jobs. Dur-
ing the 27-year period prior to the great reces-
sion, industries that provided the lowest-paying
one-third of jobs in greater Baltimore grew 62.5
percent, a rate that closely mirrored that of the
nation as a whole. the number of jobs in the mid-
dle-paying one-third of industries, however, rose
by less than 37 percent, compared with 46 percent
nationally, and growth in the highest-paying one-
third of industries—such as utilities, management
of companies, and professional, scientific, and
technical services, among others—was just
9.6 percent in the metro area, while the united
States saw an increase of nearly three times that
rate.17 By 2007, the proportion of jobs that were in
what by then the metro area’s highest-paid indus-
tries was 28.5 percent, down from 34.8 in 1980,
and the share of jobs in the middle remained virtu-
ally flat, at around 40 percent. Meanwhile, jobs in
the bottom one-third increased during the period,
from 25.9 percent to 31.4 percent.18
although these comparative 2007 shares them-
selves may not look very bad—more than 68
percent of jobs in the region still paid a middle or
a high wage—the trajectory does not look so good.
this is even more apparent when one examines
changes in certain industries together with the
corresponding wage trends for these jobs.
to be sure, the growth rates in some still-low-wage
industries have been trending in a positive man-
ner. for example, the explosive 207 percent growth
in nursing and residential care facility jobs that
occurred in greater Baltimore from 1980 to 2007
(from 10,670 to 32,750 jobs) was accompanied by
a real average wage growth of 96 percent. Simi-
larly, jobs in the administrative and support ser-
vice industry jumped from just over 30,100
to more than 76,500, while wages increased by
94.5 percent.19
However, pay in other large, fast-growing low-wage
job sectors followed a very different pattern. By
2007, the number of jobs in food service and drink-
ing establishments, for instance, had grown by
more than 85 percent, to nearly 87,600. However,
real average wages had declined by almost 26
in The deCAdes leAding up To The greAT reCession, greATer BAlTimore’s joB growTh
Trends fAVored low-wAge indusTries.
job Change, real Average Total share Total share
1980–2007 wage, 2007 of jobs, 1980 of jobs, 2007
High-wage industries +9.6% $80,477 34.8% 28.5%
Mid-wage industries +35.9% $50,881 39.3% 40.1%
low-wage industries +62.5% $28,308 25.9% 31.4%

20 BrookingS inStitution Metropolitan policy prograM
percent. at the same time, the number of social
assistance jobs increased 242 percent, to almost
25,000, while wages in that industry dropped by 13
percent. Meanwhile, the number of jobs in some of
the highest-paying industries with the largest wage
gains declined. from 1980 to 2007, real wages in
nine high-paying manufacturing subsectors grew
anywhere from 16 to 301 percent, while every one
of those nine experienced steep job losses.20
with the economy for years churning out a higher
proportion of jobs in low-wage industries—some of
which have seen their real wages slip—it is no won-
der that nearly one-quarter of greater Baltimore’s
population has been finding it difficult to make a
decent income. But what has been driving these
trends? and how do we reverse them?
A new eConomiC orderthe persistent current economic crisis has shone
a bright, near-blinding light on america’s “jobs
problem,” and there is no shortage of research on
what has gone wrong. a recent paper by econo-
mists Michael Spence and Sandil Hlathshwayo
both summarizes the nature of challenge and
offers some explanation for how we got here.
from 1990 to 2008, they note, the united States’
strong growth in non-tradable employment— that
is, jobs in industries like government, health care,
retail, construction, and hotels and food services,
which more or less must be carried out or sold
locally—was accompanied by weaker increases
in output. Because workers earn less when they
produce less, this in turn has contributed to gener-
ally slower wage and benefits growth in many of
those types of jobs. Meanwhile, the opposite has
occurred in many globally oriented tradable sec-
tors like manufacturing and some business and
financial services. global competition has led to
the outsourcing of low- and middle-skilled work in
these sectors, driving domestic job numbers down
and pushing productivity up—while allowing the
(far fewer) high-skilled american workers remain-
ing in those firms to secure high and growing
wages as a result.21
as Jim tankersley contends in his 2011 National
Journal article, this is not how the shifting global
economy should be working. according to him, this
is how it should:
Mature economies with high living standards, such
as the united States, ship some of their lower-skill
jobs to developing countries, where wages are
lower. the costs of outsourced goods and services
go down, and the buying power of the develop-
ing countries goes up. american firms reap higher
profits, which they invest in developing higher-value
products that can’t be made elsewhere… american
workers find jobs in the innovative industries that
result.
part of the reason this has not occurred, tankers-
ley points out, is that the pace of u.S. innovation—a
key driver of productivity and ultimately of wage
growth—has slowed over the past few decades.22
companies in the united States are not invest-
ing enough in stateside innovation and hence in
the good jobs that this innovation should gener-
ate. in fact, american corporate spending on
nonresidential plant equipment—for example, on
factories and not shopping malls—has fallen to its
lowest proportion of the economy in four decades.
instead, american firms are returning the wealth
generated by globalization and technology to their
shareholders and/or spending it on new projects—
in other countries.23 Meanwhile, investment by
the united States in innovation is waning. federal
spending on research and development—criti-
cal to funding the kind of widely applicable basic
research that private firms have little incentive to
perform on their own—has declined from a high
of 2.2 percent of gross domestic product (gDp) in
1964 to just 1 percent today.24
at the same time, the majority of u.S. firms have
not positioned themselves to capitalize on the
escalating purchasing power of other countries.
with u.S. consumer spending down and the over-
all economy growing slowly, near-term growth
opportunities for many american companies will
most likely come from growing markets like those

21Building from sTrengTh: creating opportunity in greater Baltimore’s next economy | ii. opportunity Challenge
in asia and latin america. as well, in the years
to come, rapid urbanization and the rise of the
global middle class will continue to generate an
enormous base of global customers for u.S. busi-
nesses. yet, according to the u.S. Department of
commerce, only 1 percent of american firms sell
a product or service outside of the united States,
and as yet too few states and metro areas have
put adequate policies and resources in place for
them to take advantage of the trade economy.25
finally, many economists argue that the american
workforce has been losing some of its competi-
tive edge, with many workers lacking the skills
and education needed to successfully compete in
this new world order. according to recent analysis
by anthony carnavale and Stephen J. rose, the
united States has been underproducing work-
ers with a post-secondary education—that is,
those with at least some college experience—for
decades.26 as globalization and technology drive
down job creation in middle-skill, middle-wage
jobs, the workers who once held these jobs, who
lack the skills and education to move up the
jobs ladder, are thus pushed into the burgeoning
number of lower-skill, lower-paid occupations. as
Jacob funk kirkegaard, a fellow at the peter g.
peterson institution for international economics,
says: “it is the best educated and those with the
highest skills that derive the most benefits from a
globalizing economy.”27
the u.S. economy, of course, is largely driven by
its 366 metropolitan parts. as a group, these areas
contain 85 percent of jobs and generate 88 per-
cent of gDp.28 it follows that greater Baltimore’s
job and wage numbers over the past few decades
strongly reflect the patterns Spence, tankersley,
and their colleagues describe: employment in the
metro area’s non-tradable sectors has been rising
just as the number of jobs in some key high-value
tradable sectors—especially “middle-skill” sectors
like manufacturing—have been falling. Meanwhile,
the strong-wage, innovative sectors that are grow-
ing in the region—such as scientific research and
development services and some information sec-
tors—still make up a relatively small share of the
metro area’s economy, and barriers to entry for
low-skilled workers are comparatively high.
So what, then, is a nation—and metro areas like
Baltimore—to do? if the economists have it right,
realizing a more productive, inclusive economic
future “does not lie [solely] in further expanding
employment in healthcare, government, restau-
rants, and real estate,” given that this approach
has clearly not worked very well.29 rather, it
demands that we reorient the tradable, innova-
tive sectors of the economy to not only create
greater numbers of jobs but also produce higher-
quality jobs accessible by a far wider cadre of
citizens. creating a stronger, more prosperous
next economy, in other words, will demand that
we take advantage of growing demand, talent, and
investment from other countries by increasing
and supporting export-oriented firms and other
kinds of global engagement. it will demand that we
continually innovate in the products and processes
that improve how we live and work, including in
the low-carbon technologies that will advance
global health and environmental sustainability,
strengthen our resource security, and boost u.S.
leadership in the clean-energy revolution. and it
will compel us to provide better ways for workers
to obtain the skills and education necessary to
produce, deploy, and ultimately share the rewards
of what we invent. n


23Building from sTrengTh: creating opportunity in greater Baltimore’s next economy | iii. next economy
iii. greater Baltimore’s next economy
when people think about the Baltimore metro area, three
significant things likely come to mind: its waterfront, its
“eds and meds,” and its proximity to washington, Dc.
this is all for good reason, as each has been a draw for
out-of-town visitors and a major driver of the region’s growth and devel-
opment. together they have helped to attract and create a tremendous
asset-base—a strong industrial heri-
tage; an outsized research capac-
ity, particularly in the biosciences;
a large number of well-educated
workers; and sophisticated, techno-
logically savvy companies—that are
essential to growing the metro area’s
export base, developing the innova-
tions that will drive productivity and
wage growth, and helping to create a cleaner, more sustainable region,
nation, and world. yet, as vital as Baltimore’s assets are to its overall
economic health, they haven’t been fully exploited so as to spur and sus-
tain the level of next-economy growth needed to create a more inclusive
opportunity structure.
24 BrookingS inStitution Metropolitan policy prograM
greATer BAlTimore’s nexTeConomy TodAyconsider the region’s export economy. in 2010,
the Baltimore metro area produced $9.7 billion in
total international exports, a dollar amount that
directly supported approximately 40,000 employ-
ees in the region. these are significant numbers,
and they placed the region among the top one-
third of the largest 100 metro areas nationwide
on both measures. But, exports make up a com-
paratively small slice of the metro area’s overall
economy. the export share of the metro area’s
total gross metropolitan product (gMp) is in fact
a fairly paltry 6.7 percent, ranking Baltimore 89th
among its peers. Meanwhile, an annual growth in
exports from 2003 to 2008 of 6.5 percent was
1.5 percentage points below the average growth
rate for the top 100 metro areas, and Balti-
more’s growth from 2009 to 2010 of 9.9 percent,
although certainly a positive uptick, was still
comparatively modest.
greater Baltimore’s innovation story is also com-
plicated. on many typical indicators of scientific
discovery and technological advancement, the
region clearly excels. it ranks sixth among the
nation’s 100 largest metro areas on basis of its
share of workers in science, technology, engineer-
ing, and mathematics (SteM) jobs, for example.
and Maryland is third among states in terms of the
total amount of university research and develop-
ment expenditure in science and engineering
fields, a rank driven in large part by the fact that
Johns Hopkins university consistently tops the list
of educational institutions in the united States for
this indicator.30
However, the metro area is far weaker when it
comes to translating its significant amount of life
sciences and other research into new products
and services, and the creation of new businesses
is slow. the region ranks just 51st in terms of the
number of patents granted per 1,000 workers, for
instance, and, according to the kauffman index of
entrepreneurial activity, the overall rate of new
firm creation in Maryland over the past 15 years
has been middling when compared with that in
other states.31
greater Baltimore’s “clean” or low-carbon econ-
omy, finally, is solid yet sluggish. although it is
relatively large on the basis of sheer size—with
nearly 23,000 jobs in this sector, Baltimore ranks
22nd among the top 100 metro areas by this met-
ric—this industry makes up a fairly small share (1.7
percent, ranking it 51st nationwide) of the overall
metro economy. furthermore, the region added
only 3,700 clean economy jobs between 2003 and
2010, which represents an average of 2.6 percent
annual growth, putting it 76th among its peers.32
given what we know about the relationship
between employment, wages, and the structure
of economic growth, Baltimore’s performance in
these three pillars of the next economy does not
bode particularly well for its future prosperity,
however good it currently looks on many measures
of general economic health. therein lies the call to
action: getting serious about the growth of more
and better quality jobs will demand that the region
leverage its assets in ways that improve its capac-
ity to produce exportable goods and services, help
convert its scientific research into new companies
and jobs, and stimulate greater demand for clean
products and processes—and use its technology
prowess to invent new and better ways of doing
all of this. getting serious about growing a more
opportunity-rich greater Baltimore, in other words,
must include a focus on growing and sustain-
ing the industries and sectors that offer the best
promise for next-economy success.
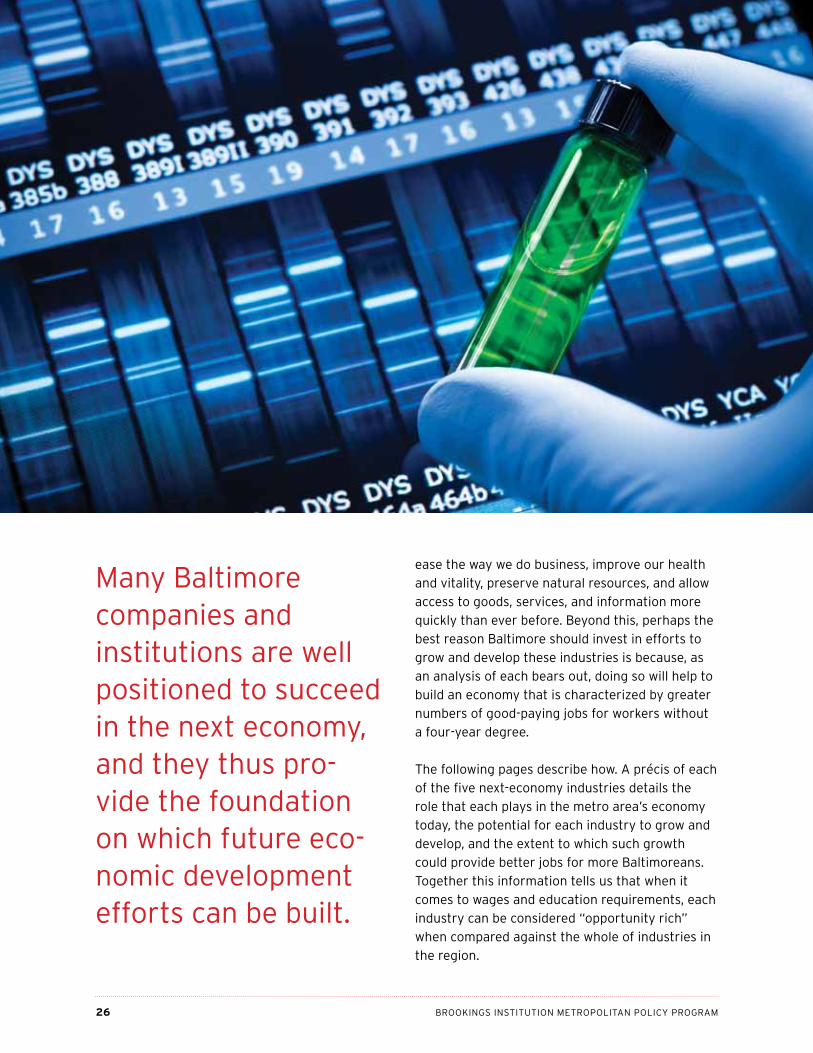
opporTuniTy in The nexTeConomyMany Baltimore companies and institutions are
well positioned to succeed in the next economy,
and they thus provide the foundation on which
future economic development efforts can be built.
for example, the region’s computer and electronic
products, chemical, and machinery manufacturers
are largely responsible for the metro area’s goods

25Building from sTrengTh: creating opportunity in greater Baltimore’s next economy | iii. next economy
exports. other types of manufacturing companies,
including but not limited to food manufacturers
such as Mccormick and phillips Seafood, metal
fabricators such as Marlin Steel wire, and motor
vehicle parts firms such as SaVer, also sell their
products abroad. the total volume of the region’s
service exports, moreover, is actually higher than
that of the average metro area, driven in large
part by clusters in research and development and
computer services.33 Many of these sectors are
also among the most innovative. a look at where
scientists and engineers are employed, along with
analyses of other measures of innovative activ-
ity such as productivity growth and patenting,
reveal that professional and scientific services—
a catch-all term for research and development
activities, architecture and engineering, computer
system design, and some other areas of regional
strength—and most major types of manufactur-
ing are consistently among the economic sectors
in which new products and processes are being
invented and/or implemented.34
this is certainly not a fully inclusive list of firms
and industries with next-economy attributes.
Businesses of all types and sizes can and do tap
global markets for their products and services.
furthermore, innovation is both broader and more
ubiquitous than common indicators suggest, as
both private firms and the public sector—ideally, at
least—are constantly finding new ways to improve
what they produce and how efficiently and,
increasingly, cleanly they produce it. But, given
greater Baltimore’s existing strengths and weak-
nesses, it seems evident that efforts to move the
region more firmly into the next economy require
a focus on the next-economy industries that are
best poised to drive real economic growth:
● a healthy, globally connected manufacturing
sector,● a robust, market-oriented bioscience industry,● an open, entrepreneurial information technology
sector, and ● a large, diverse set of firms and jobs that convey
a “green” benefit.
in addition, the metro area must continue to invest
in a transportation and logistics system that can
efficiently and effectively move goods and people
both within and outside of the region.
these five industries are not mutually exclusive. in
many ways they interact, intertwine, and in some
cases overlap with one another. expanding the
metro area’s biosciences sector should include
growing the volume of pharmaceutical and medi-
cal device manufacturing, for instance, just as the
development of a new software package could,
say, help to track energy efficiency at the port.
in fact, leveraging the connections among these
industries—as well as between them and other vital
economic sectors like health care, educational and
financial services, government, and even hospital-
ity—should be a key part of the region’s next-
economy strategy.
this leveraging is already happening, and for good
reason. together these five industries can help to
getting serious about growing a more opportunity-rich greater Baltimore must include a focus on growing and sus-taining the industries and sectors that offer the best promise for next- economy success.
26 BrookingS inStitution Metropolitan policy prograM
ease the way we do business, improve our health
and vitality, preserve natural resources, and allow
access to goods, services, and information more
quickly than ever before. Beyond this, perhaps the
best reason Baltimore should invest in efforts to
grow and develop these industries is because, as
an analysis of each bears out, doing so will help to
build an economy that is characterized by greater
numbers of good-paying jobs for workers without
a four-year degree.
the following pages describe how. a précis of each
of the five next-economy industries details the
role that each plays in the metro area’s economy
today, the potential for each industry to grow and
develop, and the extent to which such growth
could provide better jobs for more Baltimoreans.
together this information tells us that when it
comes to wages and education requirements, each
industry can be considered “opportunity rich”
when compared against the whole of industries in
the region.
Many Baltimore companies and institutions are well positioned to succeed in the next economy, and they thus pro-vide the foundation on which future eco-nomic development efforts can be built.

27Building from sTrengTh: creating opportunity in greater Baltimore’s next economy | iii. next economy
greATer BAlTimore’s nexT eConomy poTenTiAl lies in seVerAl key seCTors
jobs share of metro jobs* Average Annual wage
Manufacturing 63,600 4.9% $68,920
information technology 50,410 3.9% $85,810
Bioscience 15,980 1.2% $80,460
clean economy 22,620 1.7% $44,570
transportation and logistics 29,220 2.2% $49,730
*Some overlap of jobs exists across the five sectors
Source: Moody’s Analystics; Bureau of Labor Statistics Occupational Employment Statistics; Brookings/Battelle Clean Economy Database; Battelle
Technology Partnerships Practice and BIO
heAlTh CAre And The nexT eConomy? the health care sector is a huge and important driver of greater Baltimore’s economy. from 2000 to
2009, it added more jobs—over 34,000—than any other sector, and in 2009 it was the second-largest
employment sector in the region in terms of total employment (government was the first). this
alone does not make the metro area unique, however. Health care was the largest jobs generator in
75 of the other largest 99 metro areas in the united States, and it was the second largest in most of
the others. it was also the biggest employer in 14 metro areas and the second biggest in another 45.
Jobs in this sector, vast in their overall numbers, span the occupational and pay spectrum and can
thus provide good opportunities for low-income workers to advance along solid career pathways.
with nationally ranked hospitals such as Johns Hopkins, the university of Maryland, and union
Memorial, Baltimore is on the cutting edge of innovations in patient care and an “exporter” of health
care services to individuals living both outside the region and outside the united States.35 Despite
this, the vast majority of health care in the metro area, similar to that found in other regions of the
country, is local serving and thus unsustainable as the primary engine of economic growth. However,
the region’s exceptional health care industry is and should continue to be a “center of gravity” for
growth in several key next-economy sectors in the region, including biosciences and information
technology (it), as well as industries like hospitality and tourism.36 in fact, the use of new diagnostic
methods, therapies, devices, and it applications for managing health and health records are vital
to making more efficient and cost effective the treatment and care of the injured, sick, and elderly,
and thus to improving our nation’s overall well-being in the decades to come. given greater
Baltimore’s existing prowess in these areas, this region can and should help to lead the nation in
this transformation.

28 BrookingS inStitution Metropolitan policy prograM
mAnufACTuring37
over the past couple of decades, Baltimore has
reached a point where it no longer thinks of itself
as a manufacturing town—or, at any rate, not a
very successful one. this represents a major shift
since the mid-20th century, before the docks and
warehouses gave way to Harborplace, before the
mills were converted into hip urban housing and
restaurants, and before the deindustrialization of
Dundalk and other communities so dramatically
altered the ways of life of their residents.
and, yet, this change in perception is one that is
not wholly based on reality.
to be sure, Baltimore—like many metro areas—is
not the industrial powerhouse it once was. at
various points a center for steel processing, auto-
mobile manufacturing, canning, aircraft and ship
building, textiles and clothing, and other types of
goods production, from 1980 to 2009 the region
lost nearly 108,000 manufacturing jobs, and the
sector’s share of overall jobs dropped from 17 per-
cent to less than 5 percent. industrial employment
dropped by more than one-third during the 2000s
alone.38
But, as of 2009, more than 63,000 people still
worked at one of the region’s approximately 1,850
manufacturing firms—over 9,000 more than were
employed in the finance and insurance fields and
only about 3,000 fewer than the number working
in information technology and biosciences com-
bined.39 these manufacturing workers are today
part of a sector that is diverse and dominated by
small and mid-sized firms. although the metro
area still boasts a number of large manufactur-
ers such as northrop grumman, wl gore, and rg
Steel (formerly Severstal Sparrows point), more
than 93 percent of the region’s manufacturing
establishments have fewer than 100 employees.40
computer and electronic parts manufacturers—
which include a high concentration of employees
producing defense-related navigational, measur-
ing, and control devices—together employ the
greatest number of workers and are followed by
the food, chemical, fabricated metal, and machin-
ery producers. three-quarters of the metro area’s
manufacturing jobs are located in either Baltimore
county (33.5 percent), Baltimore city (21.6 per-
cent), or anne arundel county (20.6 percent).41
the smaller size of many of today’s manufactur-
ing firms is in large part due to the extent to which
they create, drive, and use new technologies to
improve efficiency. although global competition
has pushed labor-intensive, low-tech production
activities from Baltimore—and from the nation as a
whole—many of those firms that remain are highly
productive, meaning that they produce more with
fewer workers. in fact, manufacturing’s share of
the region’s gMp in 2010 was 7.2 percent, about
2.3 percentage points higher than its share of
employment. the opposite is true in most other
industries. the health care industry employees
nearly 14 percent of the region’s workers, for
example, yet it generates less than 9 percent of
gMp. for retail, those shares are 10 percent and
5.7 percent, respectively.42
although industrial jobs may be declining, those
that remain have an outsized economic impact.
the sector’s comparatively high productivity trans-
lates into far greater sales revenue per worker
than government, health care, retail, and other
sectors, which in turn generates far more direct
and indirect ripple-effect spending throughout
the broader economy.43 indeed, a recent Milken
institute report found that for every job created in
manufacturing, 2.5 jobs are created in other sec-
tors; research has found the multiplier to be even
greater for modern, high-tech factories.44

29Building from sTrengTh: creating opportunity in greater Baltimore’s next economy | iii. next economy
oVerView: mAnufACTuring
Change in jobs
jobs (annualized 2000 location Quotient
(2009) to 2009) (2009)
TOTAL 63,597 -4.4% 0.56
Industry subsector
computer and electronic product Manufacturing 11,387 -1.7% 1.05
food Manufacturing 8,473 -1.2% 0.61
chemical Manufacturing 6,966 -4.7% 0.91
fabricated Metal product Manufacturing 4,951 -4.4% 0.39
printing and related Support activities 4,265 -7.7% 0.85
transportation equipment Manufacturing 4,206 -3.5% 0.32
Machinery Manufacturing 3,798 -5.9% 0.39
primary Metal Manufacturing 2,958 -7.1% 0.85
plastics and rubber products Manufacturing 2,448 -5.7% 0.41
Miscellaneous Manufacturing 2,249 -2.5% 0.40
paper Manufacturing 2,040 -7.6% 0.53
nonmetallic Mineral product Manufacturing 2,013 -6.1% 0.54
Beverage and tobacco product Manufacturing 1,943 -4.8% 1.08
electrical equipment, appliance, and component Manufacturing 1,160 -1.0% 0.33
furniture and related product Manufacturing 1,102 -7.0% 0.30
apparel Manufacturing 1,074 -5.1% 0.67
wood product Manufacturing 1,051 -6.9% 0.30
textile product Mills 483 -8.1% 0.40
petroleum and coal products Manufacturing 464 -2.4% 0.42
textile Mills 397 -8.8% 0.33
leather and allied product Manufacturing 170 -4.8% 0.60
Source: Moody’s Analytics
exAmple oCCupATions: mAnufACTuring
share of all share of
number occupations median workers with
of jobs in industry wage less than
occupation (2009) (2009) (2009) a BA
first-line supervisors/managers of production and operating workers 2,321 3.7% $55,870 85.0%
Machinists 1,588 2.5% $46,760 96.3%
inspectors, testers, sorters, samplers, and weighers 1,564 2.5% $39,070 86.5%
welders, cutters, solderers, and brazers 1,224 1.9% $37,970 97.7%
Maintenance and repair workers, general 1,170 1.8% $37,840 93.3%
industrial machinery mechanics 858 1.3% $47,050 93.7%
Source: Brookings analysis of Bureau of Labor Statistics Occupational Employment Statistics and Moody’s Analytics data

30 BrookingS inStitution Metropolitan policy prograM
opporTuniTy sTruCTure
a strong manufacturing sector isn’t just important
to the metro area’s ability to create more jobs. the
fact that manufacturing firms are engines of inno-
vation and productivity is key to why the sector is
such a major producer of good paying jobs—and
hence a prime reason why supporting the sector
is vital to Baltimore’s and the nation’s economic
health. the retirement of aging employees alone
will provide thousands of job openings in the years
to come, demanding new workers who have the
skills needed to successfully fill them.45
in 2009, Baltimore manufacturers paid an aver-
age annual wage of $68,920—over $16,000 more
than the regional average wage for all industries.
within this sector, the high-tech producers pay
the best. computer and electronic products and
chemical manufacturers—two of the largest of the
metro area’s manufacturing subsectors—provide
the highest (and rising) average wages. low-tech
apparel producers and textile mills pay the least,
and wages in those firms have been falling over
the past few decades.46
as an added bonus, although good-paying manu-
facturing paying jobs generally require special-
ized skills, they are by no means limited to the
most educated individuals. forty-five percent of
Baltimore’s manufacturing workers do not have a
bachelor’s degree yet work in occupations where
the median wage is at least 80 percent of the area
median; 40 percent of these middle-wage manu-
facturing employees have only some college (i.e.,
not yet a two-year degree) or less. approximately
85 percent of the metro area’s 2,300 first-line
supervisors and production managers have earned
less than a bachelor’s degree, for example, but
are making a median wage of $55,870 a year, and
the 1,600 machinists working in this sector make
a median wage of almost $46,800, even though
fewer than 4 percent have a four-year degree.47
these wages do not include the substantial ben-
efits typically paid to manufacturing workers. in
Maryland, this amounted to about 21 percent of
wages, or about $1.6 billion, in 2006.48
31Building from sTrengTh: creating opportunity in greater Baltimore’s next economy | iii. next economy
poTenTiAl for growTh
given all of this, it is clear that efforts to create
more and better jobs in the Baltimore region must
include a more intense focus on strengthening and
sustaining its manufacturing sector. Declining job
rates notwithstanding, the sector still holds prom-
ise and potential, for several reasons.
first, the manufacturing sector has significant
room to grow in its capacity to export, which could
open opportunities for firm growth and expansion.
with rapid urbanization, population and economic
growth, and burgeoning numbers of middle-class
citizens, the world’s large emerging economies—
led by china, india, and Brazil—will dominate global
consumption increases in the decades to come.49
yet, in 2010, manufactured goods represented just
over 53 percent of the metro area’s total export
volume, compared with nearly 67 percent nation-
ally (service exports made up the balance).50 for
manufacturers in Baltimore to remain competitive,
the must overcome their reticence to export—as
found in a recent survey of local firms—and find
new global markets.51
Second, Baltimore possesses key assets that keep
existing manufacturers here and—if supported—
could help to strengthen the sector. the metro
area sits in the middle of a robust supply chain
that extends across the dense mid-atlantic region,
and its proximity to washington has been a key
driver of the defense-related manufacturing activi-
ties that, although declining, still support a solid
share of the sector’s employment. the region has
strong transportation and logistics networks of
roads, railways, and warehouses, as well as Balti-
more-washington international Marshall airport
(Bwi) and the port, and all of these are vital to
moving materials, supplies, and finished products
into and back out of the region. there exists a
strong “industrial commons” that includes heavy-
machine shops, rubber fabricators, and other spe-
cialized companies that many manufacturers need
for their operations. finally, it has access to a large
labor market of engineers and it workers who are
increasingly critical to ensuring that firms remain
on the forefront of innovation.52
finally, the region has a number of state and
regional organizations that already support the
sector and could be better aligned to respond to
the needs of small and middle-sized companies.
the Baltimore u.S. export assistance center (the
creator of the nationally implemented exportech
program), the state’s office of international invest-
ment and trade, towson global, and the world
trade center institute are among the organiza-
tions that provide various types of export assis-
tance to state and regional manufacturers. the
Maryland technology enterprise institute (Mtech)
at the university of Maryland houses the state’s
Manufacturing assistance program, which pro-
vides technical assistance to Maryland firms, as
well as several other programs that are focused
on product and business development. other
organizations such as the regional Manufactur-
ing institute, the Baltimore industrial group, and
the Manufacturer’s alliance of Maryland provide
support for the sector through events, networking,
advocacy, and other activities.
the necessary assets and resources are there.
the issue at hand is how they can be leveraged to
improve manufacturing’s competitiveness in the
region.

32 BrookingS inStitution Metropolitan policy prograM
informATion TeChnology53
with a bigger base and a higher concentration of
it workers than either the San francisco/San Jose
or Boston/worcester areas, the Baltimore-wash-
ington corridor is one of the strongest it markets
in the country.54 furthermore, it is an industry that
is poised for even greater growth.
although in Baltimore there exist dedicated it-
related firms, such as computer and electronic
parts manufacturers and computer service com-
panies, it—and thus those working in it fields—can
be found across nearly all sectors of the economy.
in the Baltimore metro area alone there were
approximately 50,410 workers employed in it
occupations in 2010, almost 17,000 more than in
2000. the region added nearly 6,500 software
engineers, for example, and nearly 3,000 com-
puter support specialists. these it-related jobs
together account for just under 4 percent of all
employment in the region.55
as discussed in a 2008 economic alliance report
on it, the it market in Baltimore comprises two
primary ecosystems.56 the federal government
market is driven by the huge base of federal
agencies in the Baltimore-washington area, which
include fort Meade, aberdeen proving ground,
the national Security agency, the Social Security
administration, and several others located within
the Baltimore metro area. these agencies are a
substantial consumer of it contracting services
provided by large firms such as northrop grum-
man, lockheed Martin, general Dynamics, and
aai, along with many smaller subcontracting
firms. Meanwhile, the area projects to add thou-
sands of new it jobs over the next several years as
a result of Defense Base realignment and closure
commission (Brac) moves. this growth, combined
with rising concerns over information security,
has compelled the state of Maryland to put up
new resources—all part of the new cyberMaryland
initiative—aimed at making Maryland the nation’s
“epicenter” for cybersecurity.57
the second ecosystem, the “business-to-business”
(B2B) it sector, comprises innovative firms serving
the private sector, including those focused on soft-
ware and other product development or provid-
ing in-house or outsourced it services. unlike the
more established government ecosystem, the B2B
market is an emerging strength for the region.
a small cluster of gaming and simulation com-
panies such as Breakaway, Big Huge games, and
firaxis games has grown up in northern Baltimore
county, for example, and several new ventures
like well Doc, Salar, and Vigilant Medical are on
the cutting edge of health service delivery, inpa-
tient documentation, and medical image sharing,
respectively. the region is reaching something of a
critical mass of individuals and companies devel-
oping open-source software and application plat-
forms, including Millenial Media, localup, Zenoss,
and Bizelo to name just a few. and with protection
of information a growing concern across all types
of industries, cybersecurity is quickly moving
beyond the government ecosystem to become a
major area for commercial growth.

33Building from sTrengTh: creating opportunity in greater Baltimore’s next economy | iii. next economy
oVerView: informATion TeChnology
Change in jobs
jobs (annualized 2000 location Quotient
(2009) to 2009) (2009)
TOTAL 50,410 4.2% 1.42
Occupation
computer support specialists 7,050 5.5% 1.27
computer software engineers, systems software 5,880 7.9% 1.62
all other computer specialists 5,750 * 3.29
computer systems analysts 5,280 -2.1% 1.11
computer software engineers, applications 5,190 10.8% 1.09
network and computer systems administrators 4,550 7.1% 1.43
computer and information systems managers 3,800 1.0% 1.38
network systems and data communications analysts 3,670 9.0% 1.58
computer programmers 3,220 -4.8% 1.01
Database administrators 1,690 4.3% 1.70
operations research analysts 1,240 7.5% 2.09
computer operators 1,030 -8.3% 1.31
computer hardware engineers 950 5.2% 1.48
computer and information scientists, research 520 2.4% 2.18
Statisticians 270 0.0% 1.24
actuaries 230 5.9% 1.31
Mathematicians 90 2.5% 3.32
Source: Bureau of Labor Statistics Occupational Employment Statistics
exAmple oCCupATions: informATion TeChnology
share of all share of
number occupations median workers with
of jobs in industry wage less than
occupation (2009) (2009) (2009) a BA
computer Support Specialists 7,050 14.0% $50,200 58.9%
computer occupations all other 5,750 11.4% $94,970 34.5%
network and computer Systems administrators 4,550 9.0% $78,440 49.8%
computer and information Systems Managers 3,800 7.5% $113,270 30.0%
computer programmers 3,220 6.4% $73,240 30.0%
computer operators 1,030 2.0% $41,450 74.7%
Source: Brookings analysis of Bureau of Labor Statistics Occupational Employment Statistics
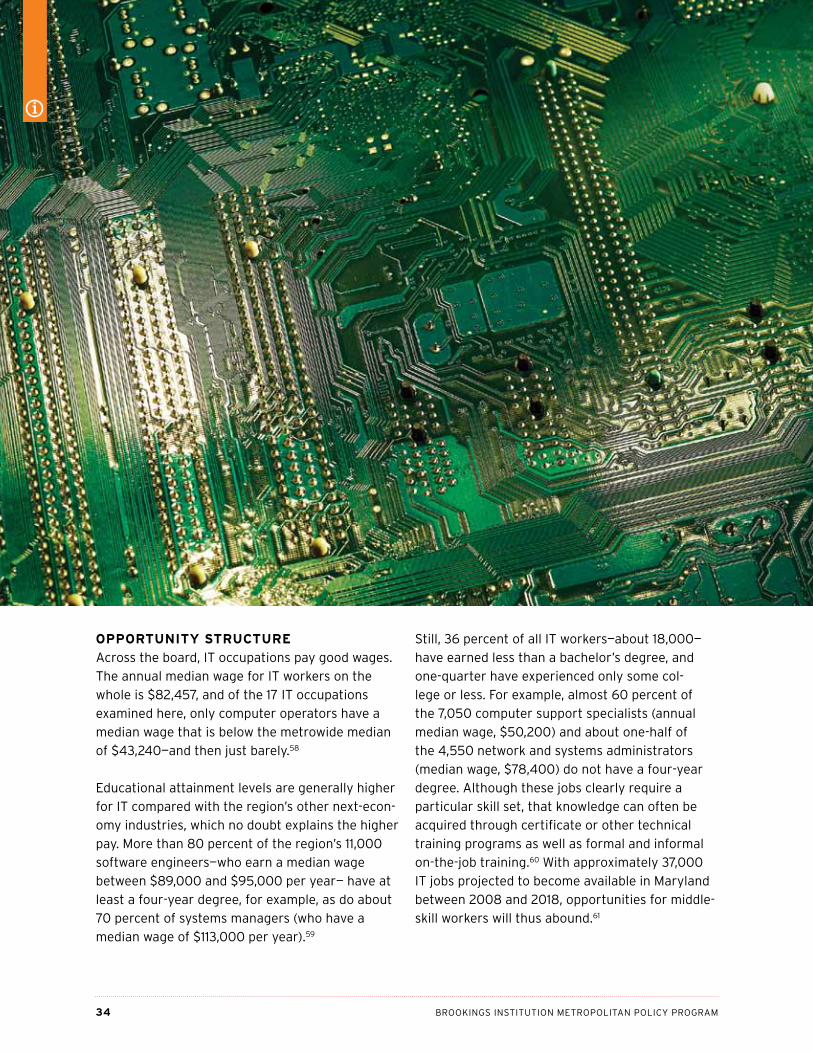
34 BrookingS inStitution Metropolitan policy prograM
opporTuniTy sTruCTure
across the board, it occupations pay good wages.
the annual median wage for it workers on the
whole is $82,457, and of the 17 it occupations
examined here, only computer operators have a
median wage that is below the metrowide median
of $43,240—and then just barely.58
educational attainment levels are generally higher
for it compared with the region’s other next-econ-
omy industries, which no doubt explains the higher
pay. More than 80 percent of the region’s 11,000
software engineers—who earn a median wage
between $89,000 and $95,000 per year— have at
least a four-year degree, for example, as do about
70 percent of systems managers (who have a
median wage of $113,000 per year).59
Still, 36 percent of all it workers—about 18,000—
have earned less than a bachelor’s degree, and
one-quarter have experienced only some col-
lege or less. for example, almost 60 percent of
the 7,050 computer support specialists (annual
median wage, $50,200) and about one-half of
the 4,550 network and systems administrators
(median wage, $78,400) do not have a four-year
degree. although these jobs clearly require a
particular skill set, that knowledge can often be
acquired through certificate or other technical
training programs as well as formal and informal
on-the-job training.60 with approximately 37,000
it jobs projected to become available in Maryland
between 2008 and 2018, opportunities for middle-
skill workers will thus abound.61

35Building from sTrengTh: creating opportunity in greater Baltimore’s next economy | iii. next economy
poTenTiAl for growTh
the Baltimore region, already a dominant player
in the government it sector, possesses a powerful
set of assets and resources that, if leveraged in the
right ways, could help push the region into the top-
tier of commercial markets. in the first place, the
region has a strong set of “basics” that undergird
the sector. the Baltimore-washington corridor
is home to a large concentration of it workers,
and the state’s colleges, universities, and training
centers confer about 3,560 new degrees or certifi-
cates in computer and information sciences each
year.62 its mid-atlantic location provides a huge,
accessible base of potential clients and investors.
and its thick it job market and overall quality of
life make it an attractive place for young workers
and entrepreneurs. that the it community is bur-
geoning is apparent in the growing number of ini-
tiatives and events, from ignite Baltimore to tech
crawls, aimed at drawing technologists, investors,
and others together in new and innovative ways.
Moreover, numerous organizations and resources
help to support entrepreneurship and it busi-
ness growth in the region. the state’s 25 business
incubators—most of which have a technology
focus—have provided hundreds of companies with
the space, resources, connections, and technical
assistance they need to get off the ground. Balti-
more city’s emerging technology centers (etc)
alone has 85 companies in its current portfolio.63
the greater Baltimore technology council (based
in Baltimore) and the chesapeake regional tech
council (based in annapolis) serve as hubs for the
sector and offer a range of resources aimed at
helping to grow and build technology businesses in
the greater region. and although access to capital
is a frequently cited concern among it firms, the
Baltimore-washington region ranks among the
top 10 u.S. regions on the basis of venture capital
dollars invested and the number of deals, with
entrepreneur.com ranking Maryland teDco as the
number one source in the nation for investment in
early-stage companies.64
finally, the region’s broadband infrastructure will
soon be state-of-the-art. the intergovernmental
one Maryland inter county Broadband network
(icBn) is using $115 million granted under the
american recovery and reinvestment act’s
(arra) Broadband technology opportunities
program to build a high-speed fiber-optic network
that will directly connect 715 anchor institutions in
central Maryland, including hundreds of k–12 public
schools, libraries, public safety agencies, commu-
nity colleges, and other government institutions.
the icBn will also make nearly 800 miles of fiber
optic cable available for low-cost lease by commer-
cial entities, at once improving quality and reduc-
ing costs for businesses.65
with mounting concerns about the contraction
of federal defense budgets and hence federal
contracting opportunities, members of the it
community are focusing more intently on how to
best align this rich set of it assets to exploit new
opportunities for B2B it growth in the region.
the growing market for open-source and mobile
technologies offers a wide field for new start-ups
and for early- and middle-stage companies look-
ing to take their businesses to the next level. the
region’s potential to grow commercially oriented
cyber-security firms, meanwhile, looms large.
finally, a unique opportunity exists in the metro
area to cross-fertilize it with other regionally
represented industries, particularly health care
and the life sciences. as health care nationally
continues to strive toward wellness and individual-
ized health management, improved diagnostics,
and advanced systems for maintaining and utiliz-
ing health information, the need for new software,
web-based applications, and computerized devices
and equipment will continue to rise.66 greater
Baltimore has a real chance to be at the forefront
of those innovations.
36 BrookingS inStitution Metropolitan policy prograM
BiosCienCe67
if the role of greater Baltimore’s manufacturing
sector in the regional economy is consistently
undervalued, the role of bioscience surely is not.
State, local, and regional leaders all recognize the
potential of this industry for the state and the
metro area, and there is no dearth of ideas for
growing the cluster.
Driven by its stand-out strength in research and
development, the Baltimore-washington corridor
has grown to be one of the nation’s largest biosci-
ence hubs. in 2008, nearly 16,000 people were
employed in the sector in the Baltimore metro
area alone. although it comprises just 1.2 percent
of all jobs in the region, between 2001 and 2008
the sector saw an increase of 4,600 jobs and
approximately 140 net new firms.68 Bioscience
companies are spread throughout the metro area
but are most concentrated in Baltimore city, Balti-
more county, and Howard county.69
Baltimore’s bioscience cluster is dominated by
research, testing, and medical laboratories, which
employ over 11,000 of its workers (70 percent of
the metro area total for the bioscience sector)
and account for most of the regional job growth
in the industry.70 these 11,000 jobs rank Baltimore
as 10th among metro areas and make it one of the
most concentrated areas for bioscience research
and development in the nation. the region’s drugs
and pharmaceuticals sector employs an additional
2,750 people, ranking the metro area 19th among
its peers, and another 1,800 individuals work in
the medical devices and equipment industry.71
Maryland as a whole has more than 200 busi-
nesses that are primarily involved in producing
surgical and medical instruments, appliances, and
supplies; almost one-half of these are located in
the Baltimore metro area.72
Baltimore’s bioscience strengths can in large part
be attributed to Johns Hopkins and the univer-
sity of Maryland, which have together served
as key anchors for the life sciences industry in
the metro area and the state. Because they are
major magnets for top researchers and federal
research dollars—Johns Hopkins alone received
nearly $1.6 billion in 2009—both are centers for
the life sciences in terms of research and develop-
ment.73 they have also helped to seed the growth
of private-sector firms throughout the state and
the region. a 2002 report on the state’s bioscience
companies revealed that a large share of com-
pany founders had ties to these two institutions,
the national institutes of Health, and/or walter
reed army institute or large companies such as
Baltimore-based BD Diagnostics, the state’s largest
bioscience firm.74
the best reason Baltimore should invest in efforts to grow and develop these industries is because doing so will help to build an economy that is char-acterized by greater numbers of good- paying jobs for workers without a four-year degree.
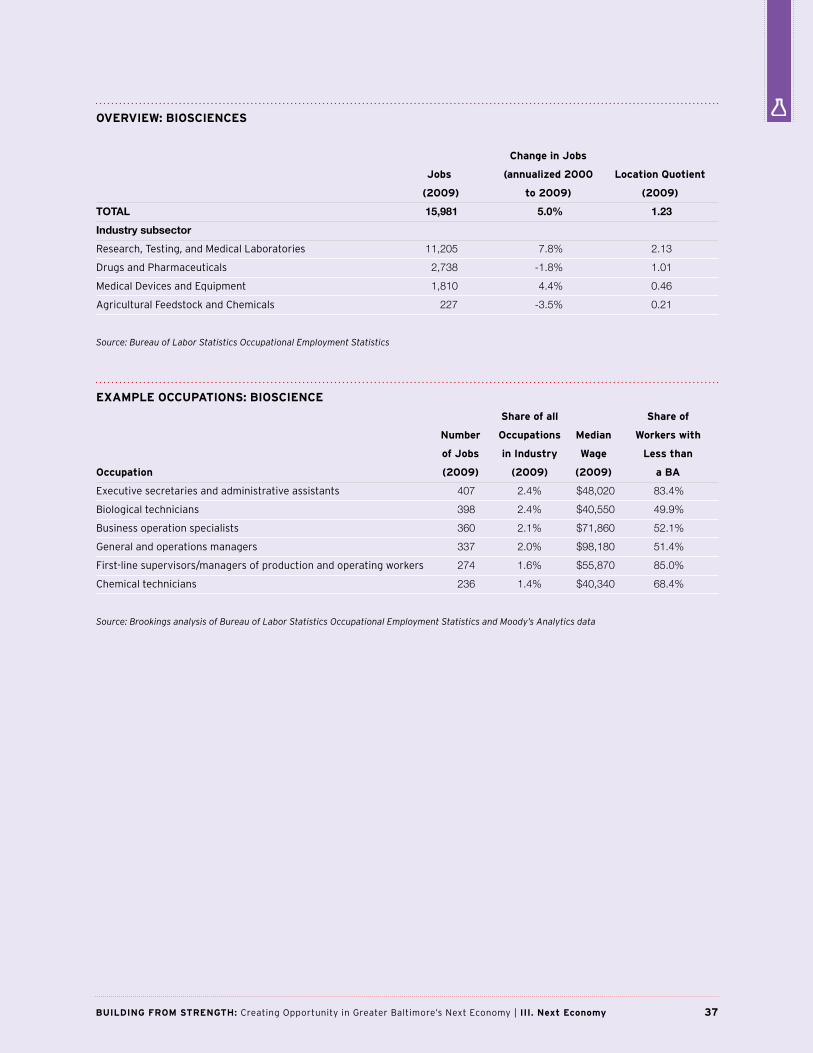
37Building from sTrengTh: creating opportunity in greater Baltimore’s next economy | iii. next economy
oVerView: BiosCienCes
Change in jobs
jobs (annualized 2000 location Quotient
(2009) to 2009) (2009)
TOTAL 15,981 5.0% 1.23
Industry subsector
research, testing, and Medical laboratories 11,205 7.8% 2.13
Drugs and pharmaceuticals 2,738 -1.8% 1.01
Medical Devices and equipment 1,810 4.4% 0.46
agricultural feedstock and chemicals 227 -3.5% 0.21
Source: Bureau of Labor Statistics Occupational Employment Statistics
exAmple oCCupATions: BiosCienCe
share of all share of
number occupations median workers with
of jobs in industry wage less than
occupation (2009) (2009) (2009) a BA
executive secretaries and administrative assistants 407 2.4% $48,020 83.4%
Biological technicians 398 2.4% $40,550 49.9%
Business operation specialists 360 2.1% $71,860 52.1%
general and operations managers 337 2.0% $98,180 51.4%
first-line supervisors/managers of production and operating workers 274 1.6% $55,870 85.0%
chemical technicians 236 1.4% $40,340 68.4%
Source: Brookings analysis of Bureau of Labor Statistics Occupational Employment Statistics and Moody’s Analytics data

38 BrookingS inStitution Metropolitan policy prograM
opporTuniTy sTruCTure
Baltimore’s bioscience industry might as yet be
relatively small, but with an average annual wage
of about $80,500 it boasts a strong concentration
of well-paying jobs. in fact, more than 80 percent
of employees in the sector are working in occupa-
tions that pay at least 80 percent of the area’s
median wage.75
the cluster’s high wages arise in large part from
the high educational levels of many of its workers.
in 2008, about 45 percent of Baltimore’s biosci-
ence employees possessed at least a bachelor’s
degree, and nearly 19 percent of these had a mas-
ter’s or a doctoral degree. nearly all of the sector’s
700-plus medical scientists—who earn a median
wage of about $85,800—have at least a bachelor’s
degree, as do 92 percent of the over 400 chem-
ists (median wage, $77,360) and 82 percent of
the nearly 300 software engineers (median wage,
$95,370).76
However, the college educated are a minority
among all bioscience employees; more than one-
half (55.2 percent) of those working in the sector—
some 9,000 employees—had a two-year degree or
less, and nearly one-half (46.7 percent) had some
college (no degree) or less. and although most of
these workers are not earning as much as their
more educated colleagues, a fair share are still
making a solid wage. in fact, almost 39 percent of
all bioscience workers have less than a bachelor’s
degree and earn at least 80 percent of the median
wage in the metro area. this includes about 340
executive secretaries and assistants (median wage,
$48,000), 200 biological technicians (median
wage, $40,550), and 160 chemical technicians
(median wage, $40,340).77
39Building from sTrengTh: creating opportunity in greater Baltimore’s next economy | iii. next economy
poTenTiAl for growTh
Despite the substantial amount of activity and tal-
ent in Maryland’s bioscience research and devel-
opment sector, the state has not accomplished a
high level of success in the transfer of technology
and the commercialization of research. in many
reports on the industry, the same admonition can
be found: if Maryland’s metro areas want to suc-
cessfully compete with their peers in california,
north carolina, and Massachusetts, they must
use their robust research capacity as a launching
pad for the development of more new products
and the creation of more new companies that can
bring these products to market.78
to be sure, the region has had some commercial
success with the start-up and growth of com-
panies such as Martek (a leading developer of
nutritional products that was recently acquired by
royal DSM), Hemagen Diagnostics, pharmaceu-
tics international, and others that are developing
and producing a range of new drugs, therapies,
and diagnostics. and although the metro area still
has an undersized employment concentration in
the development and manufacturing of medical
devices and equipment, between 2001 and 2008
Baltimore gained about 475 jobs in the subsector,
even while it lost about 400 jobs in drug and phar-
maceutical manufacturing.79 overall, however, the
industry is still just emerging. the gap between
research and commercialization is wide, and the
state and the region have been slow in their ability
to help to bridge it.
Baltimore has a huge and growing bioscience
infrastructure that will serve as a platform for the
sector’s continued development. it boasts about
3.5 million square feet of built or planned space in
three bioparks—located at the university of Mary-
land, Baltimore county, the university of Maryland,
Baltimore, and Johns Hopkins university—among
some of the nation’s best hospitals, a formidable
information technology sector, and a high-quality
environment in which to live and work.80 the
metro area also benefits from its proximity to
washington’s bioscience cluster. indeed, people
in the industry consider the two metro areas to
be part of the same overall market. finally, it has
the support of the state through the Maryland
Biotechnology center, teDco, and associated
initiatives and funding resources, including the
bioscience tax credits program.
all are key ingredients to promoting a thriving sec-
tor that, if matched with greater efforts to improve
the access to early-stage capital, stimulate prod-
uct development, support and recruit entrepre-
neurs, and encourage more collaboration between
academia and industry, can help to convert more
bioscience research into greater numbers of com-
mercial products, firms, and, ultimately, good-
paying jobs.81
Baltimore has a huge and growing bioscienceinfrastructure that will serve as a platform for the sector’s continued development.

40 BrookingS inStitution Metropolitan policy prograM
The CleAn eConomy82
as the global economy recovers, the united States
must continue to cut its energy usage, reduce
the amount of carbon and other pollutants in its
air and water, deepen its global integration, and
step up its reliance on innovation. these develop-
ments are integrally linked, whereby innovations
that advance sustainability not only improve the
environment but also help to drive firms’ global
competitiveness and enhance resource security
both here and abroad.
a new Brookings-Battelle study examines this
move toward a clean economy in the nation’s
largest metro areas, and in the process provides
a detailed, realistic assessment of what this much
ballyhooed but not-so-carefully examined field is
and isn’t.83 from this we have a sense of the rela-
tive size of Baltimore’s clean economy, as well as
its relative strengths.
as noted earlier, in 2010 greater Baltimore’s clean
economy employed about 22,600 workers in fields
ranging from cutting-edge solar photovoltaic cell
development and installation (only 44 jobs) to
the more mundane area of waste management
and treatment (4,600 jobs). this last category
represents the largest number of green jobs in
the metro area, followed by public mass transit,
conservation (mostly with the state’s Department
of natural resources), professional environmental
services, and regulation and compliance. these
latter four categories represent some of the larg-
est areas of raw clean economy job growth in the
region since 2003.84
Baltimore also boasts a few areas that have larger
concentrations of clean economy jobs than the
nation as a whole. the professional and environ-
mental services segment—which includes firms
like ea engineering, Science, and technology, in
Hunt Valley and kci in Sparks—hits the trifecta
of employment strength. it is large (2,360 jobs),
it is growing (by over 900 jobs since 2003), and
its share of metro area employment is about 74
percent larger than that in the nation as a whole.
the region also has something of a specialization
in areas like remediation (about 1,000 jobs total),
green architecture and construction (800 jobs),
and battery technologies (270 jobs).85
finally, although the $6,869 of exports produced
per clean economy job puts the Baltimore metro
area near the bottom (81st) of a list of its peers, a
number of the region’s clean economy firms are
successfully tapping into rising global demands for
green products and services. the highest overall
dollar volume of exported goods and services is
generated by the professional and environmental
services segment, which includes firms such as
Scitech Services and ea (among many others)
followed by battery technology companies such as
Saft america and HVac and building control sys-
tems firms such as Baltimore aircoil company.86
exAmple oCCupATions: CleAn eConomy
share of all share of
number occupations median workers with
of jobs in industry wage less than
occupation (2009) (2009) (2009) a BA
truck drivers, heavy and tractor-trailer 567 2.6% $39,120 94.9%
general and operations managers 395 1.8% $98,180 51.4%
Sales representatives, wholesale and manufacturing 387 1.8% $58,490 52.9%
executive secretaries and administrative assistants 324 1.5% $48,020 83.4%
water and liquid waste treatment plant and system operators 191 0.9% $39,740 90.4%
operating engineers and other construction equipment operators 169 0.8% $41,750 97.3%
Source: Brookings analysis of Bureau of Labor Statistics Occupational Employment Statistics and Brookings/Battelle Clean Economy Database

41Building from sTrengTh: creating opportunity in greater Baltimore’s next economy | iii. next economy
oVerView: CleAn eConomy
Change in jobs
jobs (annualized 2000 location Quotient
(2009) to 2009) (2009)
TOTAL 22619 2.6% 0.90
industry segment
waste Management and treatment 4,606 -1.2% 1.24
public Mass transit 2,898 4.1% 0.86
conservation 2,834 9.8% 0.94
professional environmental Services 2,360 7.2% 1.74
regulation and compliance 1,994 0.8% 1.46
recycling and reuse 1,417 2.4% 1.14
organic food and farming 1,019 3.7% 0.82
energy-saving Building Materials 1,000 1.8% 0.64
remediation 997 4.9% 1.85
green architecture and construction Services 799 -0.2% 1.48
HVac and Building control Systems 525 -1.3% 0.74
green Building Materials 456 -0.4% 0.62
Hydropower 315 -3.6% 0.59
Battery technologies 271 5.3% 1.75
green consumer products 238 0.0% 0.32
professional energy Services 215 5.4% 0.45
lighting 100 N/A 0.73
air and water purification technologies 75 4.0% 0.31
energy-saving consumer products 75 47.2% 0.41
pollution reduction 72 0.8% 0.75
waste-to-energy 66 0.0% 2.07
green chemical products 65 0.0% 0.30
recycled-content products 55 0.0% 0.10
Solar photovoltaic 44 36.4% 0.19
fuel cells 40 -15.0% 0.59
Sustainable forestry products 37 4.6% 0.06
nuclear energy 27 13.7% 0.04
Biofuels/Biomass 6 N/A 0.03
water efficient products 5 N/A 0.04
wind 5 -18.0% 0.02
training 3 N/A 1.17
Source: Bureau of Labor Statistics Occupational Employment Statistics

42 BrookingS inStitution Metropolitan policy prograM
opporTuniTy sTruCTure
nationwide, the clean economy provides more
opportunity and better pay for low- to moderately-
skilled workers than the economy as whole. the
same is true in Baltimore.
the median annual wage for all clean economy
jobs in the region is about $44,600, which is
slightly higher than that for the region as whole.
However, a closer look at who is getting paid what
in the sector reveals that more than 65 percent
of clean economy employees in the region work
in occupations that pay at least 80 percent of the
area’s median. Many of these occupations require
high-level technical skills, which accounts for some
of the good pay. Seven percent of clean economy
workers are in architectural and engineering occu-
pations, for example, compared with just over 2
percent for the metro area as a whole.87
But the clean economy also has a larger share of
middle-skill, middle-wage production workers than
the general economy (6.8 percent vs. 3.6 percent),
a sign of just how manufacturing-intensive the
sector is. as well, a comparatively large share of
clean economy workers is employed in construc-
tion (7.7 percent versus 4.4 percent), which pay a
median-wage of about $40,000 per year. all told,
42 percent of Baltimore’s “green” workers are in
these and other middle- to high-paying occupa-
tions but do not have a four-year degree.88

43Building from sTrengTh: creating opportunity in greater Baltimore’s next economy | iii. next economy
poTenTiAl for growTh
growing the clean economy is not just an envi-
ronmental proposition but an economic one. as
stated in the Brookings-Battelle report, “while the
emergence of the green or low-carbon economy
originally flowed from environmental concerns, a
market vision now prevails.”
the potential for growth stems from that vision,
whereby new industries, new firms, and new jobs
will emerge from the drive to create a healthier,
more secure planet. in 2010, approximately $154
billion in private capital was invested worldwide
in renewable energy alone, which represents an
increase of 650 percent since 2004. furthermore,
investments in the broader global low-carbon
energy market are expected to reach $2.2 tril-
lion by 2020.89 these amounts do not include the
billions of dollars that will be spent on everything
from home weatherization and green construc-
tion in our own cities and suburbs to ensuring the
availability of clean water in developing nations
worldwide.
Metro areas like Baltimore have an opportunity to
tap into growing u.S. and international demand
as well as to find ways to spur a greater desire
for green products and services in their own
backyards. federal and state policies and regula-
tions—vis-à-vis carbon pricing standards for clean
energy, and emission and other pollution limits, for
example—will be a huge factor in the extent to and
pace at which domestic demands (and the num-
ber of associated green jobs) increase. However,
even absent strong new federal and state policy
responses, state and local governments, universi-
ties, businesses, and other institutions and organi-
zations can fuel growth in the sector by changing
their own procurement and other practices. Such
market-making actions could include everything
from retrofitting buildings to purchasing more
environmentally friendly products, from buying
from local organic farms to improving the fuel
efficiency of aging auto fleets.
in fact, this is already happening. for their part,
local governments throughout the region are
employing a variety of efforts aimed at improving
the environmental health of their respective juris-
dictions, while also growing the number of green
jobs.90 the port of Baltimore is taking a range of
steps to make their operations more green, as
is the Baltimore convention center, while manu-
facturing firms like Domino Sugar have used new
technology to successfully drive down their energy
usage (and costs).91 in addition, numerous local
organizations and businesses have constructed
leeD (leadership in energy and environmental
Design)-certified buildings in recent years, includ-
ing the nation’s first leeD-platinum-certified
federally qualified health care center.92
Baltimore’s strong concentration of environmental
service, engineering, architecture, and construc-
tion firms are just some of those that could be
poised to respond to—and ultimately benefit from—
a rise in such efforts. this progress alone will not
fuel the jobs renaissance that some advocates
might have hoped for. However, expanding this
sector in Baltimore and other metro areas will be
critical to securing the investments and innova-
tions necessary to improve america’s global clean
economy leadership in the decades to come.
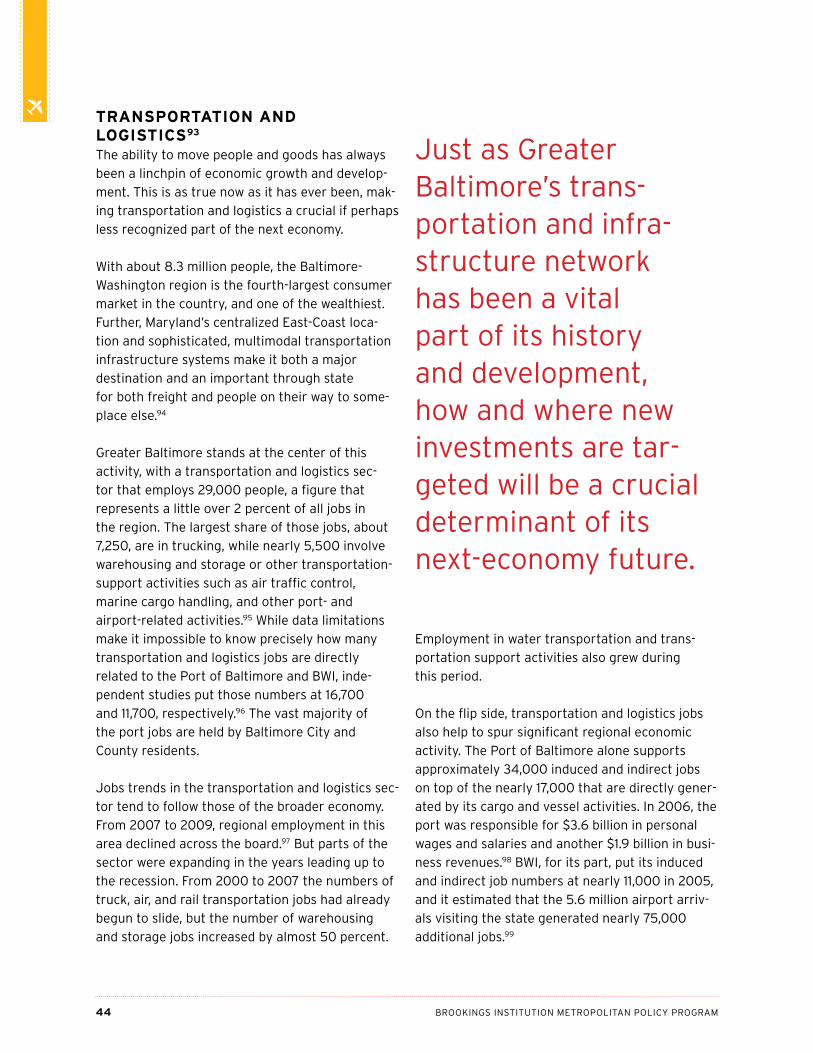
44 BrookingS inStitution Metropolitan policy prograM
TrAnsporTATion And logisTiCs93
the ability to move people and goods has always
been a linchpin of economic growth and develop-
ment. this is as true now as it has ever been, mak-
ing transportation and logistics a crucial if perhaps
less recognized part of the next economy.
with about 8.3 million people, the Baltimore-
washington region is the fourth-largest consumer
market in the country, and one of the wealthiest.
further, Maryland’s centralized east-coast loca-
tion and sophisticated, multimodal transportation
infrastructure systems make it both a major
destination and an important through state
for both freight and people on their way to some-
place else.94
greater Baltimore stands at the center of this
activity, with a transportation and logistics sec-
tor that employs 29,000 people, a figure that
represents a little over 2 percent of all jobs in
the region. the largest share of those jobs, about
7,250, are in trucking, while nearly 5,500 involve
warehousing and storage or other transportation-
support activities such as air traffic control,
marine cargo handling, and other port- and
airport-related activities.95 while data limitations
make it impossible to know precisely how many
transportation and logistics jobs are directly
related to the port of Baltimore and Bwi, inde-
pendent studies put those numbers at 16,700
and 11,700, respectively.96 the vast majority of
the port jobs are held by Baltimore city and
county residents.
Jobs trends in the transportation and logistics sec-
tor tend to follow those of the broader economy.
from 2007 to 2009, regional employment in this
area declined across the board.97 But parts of the
sector were expanding in the years leading up to
the recession. from 2000 to 2007 the numbers of
truck, air, and rail transportation jobs had already
begun to slide, but the number of warehousing
and storage jobs increased by almost 50 percent.
employment in water transportation and trans-
portation support activities also grew during
this period.
on the flip side, transportation and logistics jobs
also help to spur significant regional economic
activity. the port of Baltimore alone supports
approximately 34,000 induced and indirect jobs
on top of the nearly 17,000 that are directly gener-
ated by its cargo and vessel activities. in 2006, the
port was responsible for $3.6 billion in personal
wages and salaries and another $1.9 billion in busi-
ness revenues.98 Bwi, for its part, put its induced
and indirect job numbers at nearly 11,000 in 2005,
and it estimated that the 5.6 million airport arriv-
als visiting the state generated nearly 75,000
additional jobs.99
Just as greater Baltimore’s trans-portation and infra-structure network has been a vital part of its history and development, how and where new investments are tar-geted will be a crucial determinant of its next-economy future.
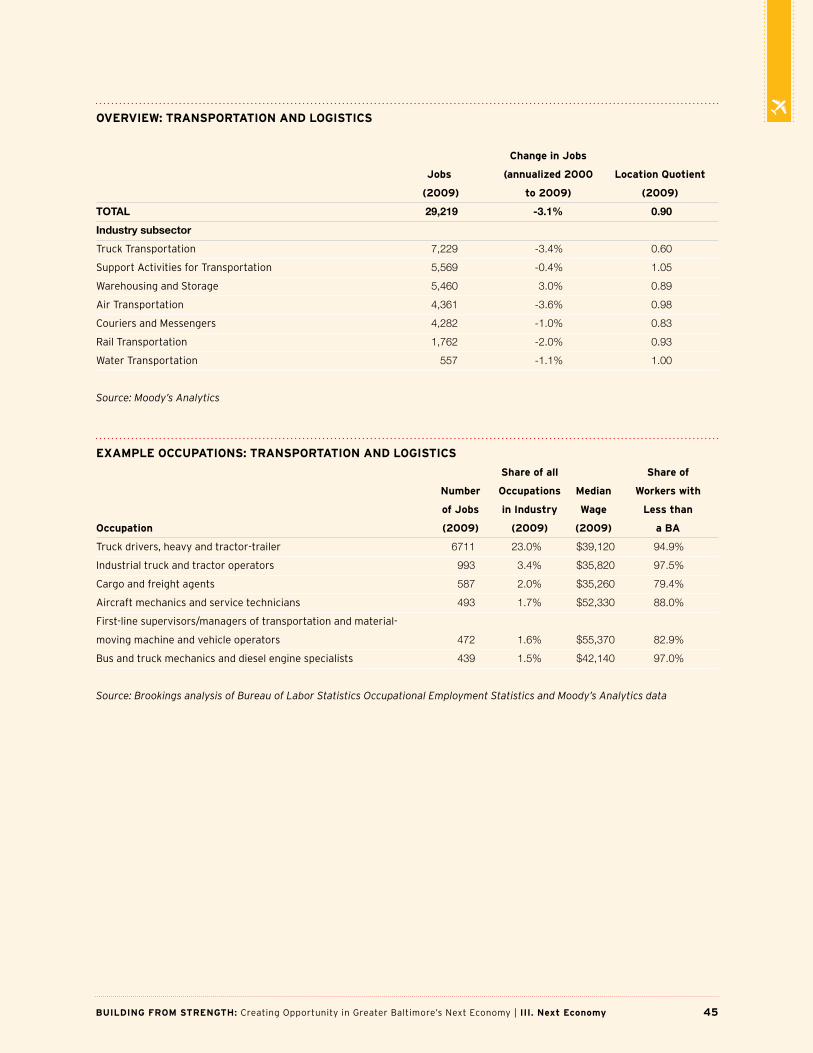
45Building from sTrengTh: creating opportunity in greater Baltimore’s next economy | iii. next economy
oVerView: TrAnsporTATion And logisTiCs
Change in jobs
jobs (annualized 2000 location Quotient
(2009) to 2009) (2009)
TOTAL 29,219 -3.1% 0.90
Industry subsector
truck transportation 7,229 -3.4% 0.60
Support activities for transportation 5,569 -0.4% 1.05
warehousing and Storage 5,460 3.0% 0.89
air transportation 4,361 -3.6% 0.98
couriers and Messengers 4,282 -1.0% 0.83
rail transportation 1,762 -2.0% 0.93
water transportation 557 -1.1% 1.00
Source: Moody’s Analytics
exAmple oCCupATions: TrAnsporTATion And logisTiCs
share of all share of
number occupations median workers with
of jobs in industry wage less than
occupation (2009) (2009) (2009) a BA
truck drivers, heavy and tractor-trailer 6711 23.0% $39,120 94.9%
industrial truck and tractor operators 993 3.4% $35,820 97.5%
cargo and freight agents 587 2.0% $35,260 79.4%
aircraft mechanics and service technicians 493 1.7% $52,330 88.0%
first-line supervisors/managers of transportation and material-
moving machine and vehicle operators 472 1.6% $55,370 82.9%
Bus and truck mechanics and diesel engine specialists 439 1.5% $42,140 97.0%
Source: Brookings analysis of Bureau of Labor Statistics Occupational Employment Statistics and Moody’s Analytics data

46 BrookingS inStitution Metropolitan policy prograM
opporTuniTy sTruCTure
with an average annual wage of just under
$50,000, the transportation and logistics sector
is a solid generator of middle-wage jobs, many of
which have relatively low barriers to entry.
in fact, about 46 percent of workers in this sec-
tor are in occupations with median wages within
20 percent of the area median, that is, between
$34,500 to $52,000 per year. another 14 per-
cent work in higher-wage occupations. More than
one-half of these well-paid workers do not have a
four-year college degree, and nearly one-half (46
percent) have completed only some college-level
coursework. ninety-five percent of the region’s
6,700 truck drivers do not have a bachelor’s
degree, for example—70 percent have no college
training at all—and following a moderate level of
on-the-job-training earn nearly $40,000 per year.
cargo and freight agents, as well as dispatchers,
earn more than $35,000 per year, typically with
on-the-job training.100
furthermore, the transportation and logistics
sector provides a fair amount of room to move up
the jobs ladder, often into supervisory positions.
related work experience can help a worker land
a job as a warehouse supervisor (median wage of
nearly $47,000 per year), an office or administra-
tive manager ($49,600 per year), a supervisor
of transportation or material-moving machine
operators ($55,400 per year), or a transporta-
tion, storage, and distribution manager ($59,700
per year). only about a one-fifth of the workers
in these occupations—which together employed
about 1,400 people in the region in 2009—have a
four-year college degree.101

47Building from sTrengTh: creating opportunity in greater Baltimore’s next economy | iii. next economy
poTenTiAl for growTh
as the national economy recovers and grows, with
more goods produced and more people to serve
and be served, the transportation and logistics
sector will follow. More than that, the move toward
a more innovative, globally connected economy—in
Baltimore and throughout the country—will cause
important shifts in the types and destinations of
people, goods, and services and thus the means by
which they will travel. the port of Baltimore and
Bwi and the trucking, railroad, warehousing, and
supply-chain companies that serve them stand to
grow as a result.
in 2010, the port of Baltimore alone handled 18
million tons of export cargo, a 72 percent increase
from 2009, and an amount that could rise sub-
stantially if more companies begin shipping
more goods to foreign locales.102 today the port’s
exports include everything from bulk materials
such as coal and coke to cars, food items, and
beyond. Some of these materials originate in the
greater Baltimore region and others come from
outside of it. the port is the number one roll-on/
roll-off port in the united States, for example, in
part because of the heavy volume of Midwest-
manufactured farm and construction equipment
that is shipped through its terminals.103 if the level
of these and other types of exports increase, the
amount of imported items that feed their respec-
tive supply chains—and the jobs needed to handle,
store, and transport them—will grow as well.
Meanwhile, continuous technological advance-
ments in how cargo is managed and handled at the
port allow it to load, unload, and move goods more
efficiently than ever before. Such innovations will
be increasingly vital in the years to come. ports
america chesapeake has entered into an agree-
ment with the Maryland ports administration to
construct a 50-foot container berth at the Seagirt
Marine terminal and to undertake over $460 mil-
lion worth of other improvements. the new berth,
which is scheduled to open in 2012, will make
Baltimore one of only two east coast ports able
to handle the mega-container ships that will soon
able to pass through an expanded panama canal.
the increased volume that is expected at the port
is estimated to generate approximately 2,700 new
permanent jobs.
growth in Baltimore’s next-economy industries
would also have substantial impacts on Bwi.
although less than 3 percent of the airport’s total
cargo is classified as “non-stop” international,
approximately one-third of it is destined to leave
the country via philadelphia, Dulles, Jfk, or other
international gateways. Machine parts, aircraft/
spacecraft components, seafood, chemicals, and
pharmaceutical products are some of the main
commodities that move through the airport, and
the volumes of these goods could increase as
these industries grow and expand their markets.104
the airport will also continue to be vitally impor-
tant for scientists, doctors, it specialists, archi-
tects, and others who provide services to clients
abroad, as well as foreign clients seeking medical
treatment, tourists, and others coming into the
region for business purposes. in 2011, passenger
travel at the airport set new records, and officials
expect international travel to increase in the years
to come.105
Just as greater Baltimore’s transportation and
infrastructure network has been a vital part of
its history and development, how and where new
investments are targeted will be a crucial determi-
nant of its next-economy future.
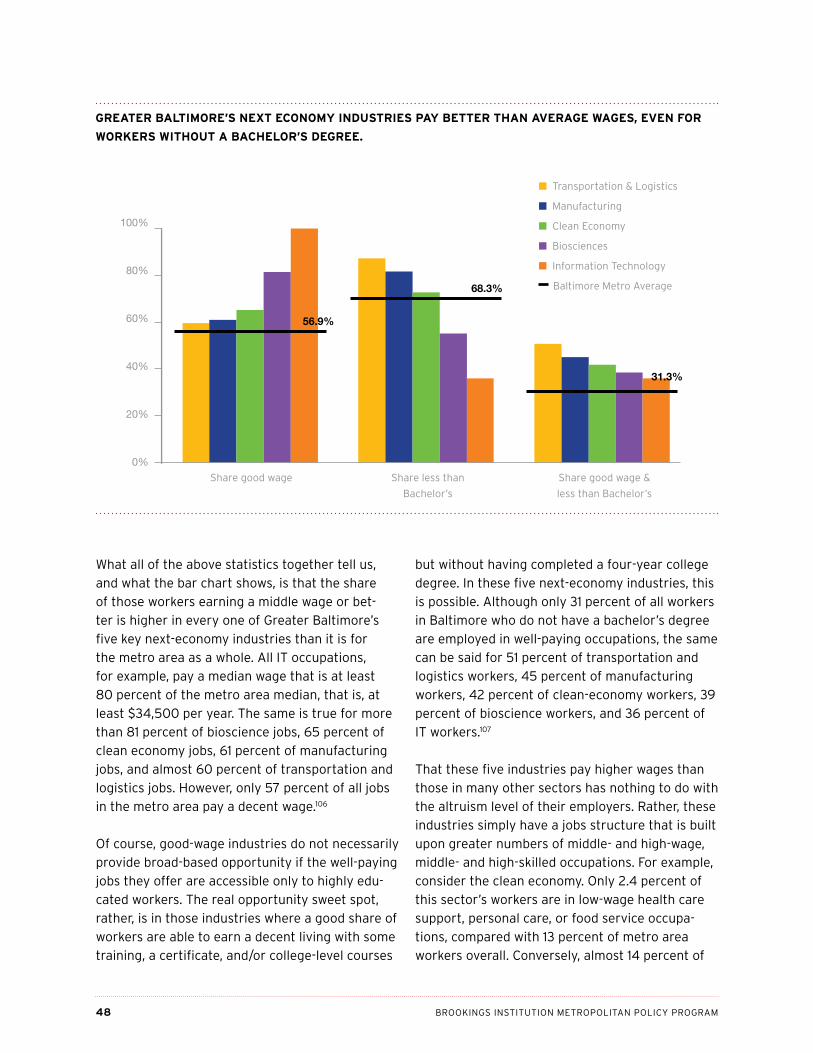
48 BrookingS inStitution Metropolitan policy prograM
what all of the above statistics together tell us,
and what the bar chart shows, is that the share
of those workers earning a middle wage or bet-
ter is higher in every one of greater Baltimore’s
five key next-economy industries than it is for
the metro area as a whole. all it occupations,
for example, pay a median wage that is at least
80 percent of the metro area median, that is, at
least $34,500 per year. the same is true for more
than 81 percent of bioscience jobs, 65 percent of
clean economy jobs, 61 percent of manufacturing
jobs, and almost 60 percent of transportation and
logistics jobs. However, only 57 percent of all jobs
in the metro area pay a decent wage.106
of course, good-wage industries do not necessarily
provide broad-based opportunity if the well-paying
jobs they offer are accessible only to highly edu-
cated workers. the real opportunity sweet spot,
rather, is in those industries where a good share of
workers are able to earn a decent living with some
training, a certificate, and/or college-level courses
but without having completed a four-year college
degree. in these five next-economy industries, this
is possible. although only 31 percent of all workers
in Baltimore who do not have a bachelor’s degree
are employed in well-paying occupations, the same
can be said for 51 percent of transportation and
logistics workers, 45 percent of manufacturing
workers, 42 percent of clean-economy workers, 39
percent of bioscience workers, and 36 percent of
it workers.107
that these five industries pay higher wages than
those in many other sectors has nothing to do with
the altruism level of their employers. rather, these
industries simply have a jobs structure that is built
upon greater numbers of middle- and high-wage,
middle- and high-skilled occupations. for example,
consider the clean economy. only 2.4 percent of
this sector’s workers are in low-wage health care
support, personal care, or food service occupa-
tions, compared with 13 percent of metro area
workers overall. conversely, almost 14 percent of
greATer BAlTimore’s nexT eConomy indusTries pAy BeTTer ThAn AVerAge wAges, eVen for
workers wiThouT A BAChelor’s degree.
100%
80%
60%
40%
20%
0%
Share good wage Share less than
Bachelor’s
Share good wage &
less than Bachelor’s
■ Transportation & Logistics
■ Manufacturing
■ Clean Economy
■ Biosciences
■ Information Technology
Baltimore Metro Average
56.9%
68.3%
31.3%

49Building from sTrengTh: creating opportunity in greater Baltimore’s next economy | iii. next economy
green industry workers are in either middle-wage
production jobs or even better-paying architecture
or engineering occupations, compared with fewer
than 6 percent of all metro area workers. the
story is similar in the other industries. More than
31 percent of bioscience workers and 55 percent
of manufacturing workers are in production or
engineering-related jobs, for instance, while fewer
than 1 percent of each work in health support,
personal care, or food services fields.108
all of this is not to say that jobs in these and other
low-wage occupations are not important or worthy
of investment. Such occupations—and the indus-
tries in which they are most prevalent—provide
essential services to businesses and residents
while offering workers a chance to get a foot on
the economic ladder, even if it is on a bottom
rung. But what this analysis does tell us is that if
the region wants to provide low-income residents
a better chance for upward movement, it must
invest in industries with a strong opportunity
structure while at the same time work to raze the
barriers—of skills, of information, and others—that
can stand in the way of their climb. n
if the region wants to provide low-income residents a better chance for upward movement, it must invest in industries with a strong oppor-tunity structure.

50 BrookingS inStitution Metropolitan policy prograM
iV. Barriers to opportunity
greater Baltimore has strong seeds from which to grow a
more export-oriented, more innovative, and greener region.
for the metro area’s low-income residents, however, the next
economy is as yet still too small and too far out of reach.
in fact, only a small fraction of the working poor were employed in the
region’s five next-economy industries at some point during the past five
years, which is precisely the point. if they were, at least somewhat steadily,
then they very likely would not be low income.109

51Building from sTrengTh: creating opportunity in greater Baltimore’s next economy | iV. Barriers to opportunity
this issue is, in part, a matter of scale. intersec-
tions among the five industries—for example,
manufacturing workers who make medical devices
or it specialists working in clean tech industries—
make it nearly impossible to obtain a perfect
count of the total jobs number. it is fairly safe to
say, however, that only around 170,000 Baltimore
workers, or about 13 percent of the regional total,
are employed by these industries. as such, these
industries are simply not large enough—nor are
they growing enough—to absorb all of the low-
income workers who might wish to join their ranks.
the sheer size of Baltimore’s next economy is not
the only barrier. Beyond this is the fact that many
of the region’s low-income workers are otherwise
detached from these jobs as they possess neither
the skills their employers need nor the robust
social, institutional, and physical connections
needed to access (or perhaps even know about)
them. if these barriers to better employment are
not torn down, they will not only keep residents
from accessing such opportunities as the next
economy grows, but to the extent that next-econ-
omy employers cannot find the workforce they
require, they could actually impede growth overall.
BArriers To growing The nexT eConomycreating an opportunity-rich greater Baltimore
first demands an approach to economic devel-
opment that is intentional about expanding
industries with an opportunity-rich occupational
structure. this is not a simple charge.
indeed, each of the five next-economy industries
discussed here faces its own challenges to growth,
not all of which are unique to Baltimore. the com-
mercialization of biotechnologies, for example, is a
complicated, expensive, long-term process that is
affected by federal funding, fDa regulations, and
the availability of venture capital, among other
things.110 for their part, american manufacturers
are undercut by competitor-nation’s cheap wages,
low environmental standards, and unfair prac-
tices such as currency manipulation while lacking
research funding and other coordinated forms of
federal support that are enjoyed by firms in peer
nations such as germany and Japan.111 further-
more, transportation infrastructure nationwide
is in need of some serious care, as well as the
targeted funding to provide it.
But Baltimore’s ability to grow the next economy
is also hampered by its own acute lack of regional
vision and coordination. in fact, nearly all of those
interviewed for this report expressed a similar
lament about what seems an inability (or disincli-
nation) of state and metro area leaders—from all
sectors—to unite around a set of regional goals.
Despite all Baltimore has going for it—and it has a
lot going for it—the region, as Dan rodricks noted
in the Sun last summer, “just snorts along, with a
post-industrial drip, hardly ever making a boast or
a brag.” one interviewee put an even finer point
on it, claiming that “Baltimore does less with
more” than any other region he had ever
worked in.
rodricks chalks up this apparent lack of “collec-
tive civic ambition” to “something endemic to the
region’s character and its ancestry.” Many others
finger plain-old complacency. the region has not
fully gotten its act together because it has not had
to. anchored by many federal government–induced
jobs, a health care system that keeps growing, and
an enviable set of educational and other institu-
tions, the region has been able to maintain a fairly
impressive set of broad-based economic statistics
absent much strategizing to fully exploit its plen-
titude of assets. this appears to be true across
industries, from biosciences to manufacturing to
it. a robust set of resources and institutions sup-
port each, but for the most part they are not work-
ing in concert toward or benchmarking themselves
against a common set of aims or objectives.
the whole, in other words, is still less than the sum
of its parts.

52 BrookingS inStitution Metropolitan policy prograM
BArriers To ACCessing The nexT eConomyBeyond the economic development–related chal-
lenges to building a more opportunity-rich next
economy are a complex, interwoven set of barri-
ers surrounding access to information, skills, and
transport that are keeping many low-income Bal-
timoreans from participating in it—and thus from
moving into the middle class.
information Barriers the ability of low-income workers to connect to
next-economy jobs is compromised in part by a
lack of basic knowledge and information about and
links to the opportunities that are available, as well
as what it takes to be able to advantage of them.
for the middle-class worker, a rudimentary under-
standing of occupations and career paths comes
in large part from family and community and is
imparted from an early age. However, many low-
income residents are brought up in low-income,
poorly educated households and live in neighbor-
hoods where employment and wage levels are low.
for example, more than one-fifth of children living
in Baltimore city live in families in which neither
parent has a high school diploma, and nearly 11
percent grow up in neighborhoods with poverty
rates of 40 percent or higher.112 as such, low-
income job seekers tend to have fewer and smaller
networks of relatives, friends, and acquaintances
who work in well-paying, next-economy fields or
have direct information about training programs
and job opportunities. they also then have fewer
ties to people who might personally vouch for
their character or abilities or who have a vested
interest in helping them to secure a decent job.113
although these workers may turn to public or
nonprofit intermediaries to help them train for and
connect to good jobs, service providers them-
selves can also suffer from a lack of good informa-
tion about the skills demanded by employers in
tradable, next-economy sectors.
the challenge for greater Baltimore’s black resi-
dents is particularly steep. first, they make up the
vast majority of poor people living in poor city
neighborhoods, and their networks are generally
weaker than those for whites. research shows, for
example, that black business owners as a group
are more likely than white owners to employ black
workers, and yet census data show that fewer
than 4 percent of metro area businesses with paid
employees are black-owned businesses.114 in addi-
tion, low-income black residents are more likely
than their white counterparts to be disconnected
from work at an early age, making it all the harder
to engage as they get older. in fact, young black
youth are the least likely of the region’s residents
to be employed or even participate in the labor
force, which in turn means that they are not
exposed to different types of jobs and careers, nor
are they learning the soft skills needed to succeed
in the world of work.115
education and skills Barriersof course, while the right information about avail-
able opportunities is critical, it must be accompa-
nied by the right education and skills to be able
to pursue them. as discussed above, workers do
not necessarily need a bachelor’s degree to get
their foot in the door of the next economy. But
most middle-wage, next-economy occupations,
from computer operators to machinists, biologi-
cal technicians to aircraft mechanics, do demand
some level training or education that can then be
advanced through on-the-job training and work
experience. for low-income Baltimoreans, this can
be a second major roadblock to the next economy.

53Building from sTrengTh: creating opportunity in greater Baltimore’s next economy | iV. Barriers to opportunity
A Lack of Basic Skills
Many low-income residents simply do not have the
basic reading and math skills necessary for work
or additional training. almost 28 percent of these
residents do not have even a high school degree,
compared with fewer than 12 percent of metro
area residents overall. in addition, only about 15
percent of low-income residents have an associ-
ate’s degree or higher. educational attainment
rates are particularly low for blacks. Seventeen
percent of the metro area’s black residents do not
have a high school degree, while only about 26
percent have an associate’s degree or higher. this
compares with 10 percent and 45 percent of white
residents, respectively. given that nearly one-half
of greater Baltimore’s low-income population is
black, this raises serious questions about how
race-specific barriers to educational attainment
impact economic mobility.116
the challenge begins with a k-12 education sys-
tem—particularly in Baltimore city, and pockets of
anne arundel and Baltimore counties—that has
struggled to keep students in school while not
being able to provide those who do attend with the
skills they need to move forward after they gradu-
ate. although graduation rates in the city have
improved dramatically in recent years, as of 2009
there were approximately 83,450 adults in the city
who did not have a high school degree, and more
than 70 percent of these were black.117 continuing
to help more students complete high school while
Less thanhigh school
High schooldiploma
Some collegeor Associate’s
Bachelor’s& above
Metro population
Low-Income population
40%
20%
0%
greATer BAlTimore’s low-inCome residenTs hAVe low eduCATionAl ATTAinmenT leVels.

54 BrookingS inStitution Metropolitan policy prograM
they are still enrolled is vital to improving these
numbers over the long term. in the meantime,
though, low state funding is forcing older workers
wishing to attain a high school credential to com-
pete for a too-limited supply of adult education
and geD services.118 without that requisite piece of
paper, many training programs are inaccessible.
that said, interviewees for this report confirmed
that even many high school graduates lack the
basic reading and math skills necessary to suc-
cessfully complete community college or other
skill-based training courses that could help these
individuals to advance their career prospects. at
Baltimore city community college, for example,
fewer than 9 percent of entering students in
2005 were deemed college ready; the same is
true of only about one-quarter of all students at
both Baltimore county community college and
anne arundel county community college.119 when
students are forced to complete time-consuming
remedial coursework, they can lose sight of the
route forward and burn through the financial and
other resources needed to stay the full course.
only about 35 percent of Maryland’s community
college students—and only 21.5 percent of black
students—either transfer to a four-year college or
go on to receive an associate’s degree or certifi-
cate.120
A Flawed Workforce Delivery System
a lack of basic skills is not the only thing impeding
low-income workers from starting and completing
postsecondary education and training programs,
however. a number of those interviewed stressed
that weaknesses in the workforce delivery system
often frustrate the ability of workers to success-
fully negotiate available opportunities.
the type of training offered is part of the issue.
research by the Maryland life Sciences Board, for
example, revealed that, while the state has a high
concentration of highly skilled bioscience research
workers, many industry leaders are concerned
about the insufficient supply of production and
technician workers and concomitant deficien-
cies in bioscience workforce development across
the state.121 interviewees from the manufacturing
community in particular cited difficulties in finding
middle-skill workers with the necessary technical
prowess, and they noted that few local programs
exist to teach requisite skills (see sidebar). fur-
thermore, several recent reports cite an overall
shortage in Maryland of high-quality science, tech-
nology, and engineering education and workforce
programs despite projected growth in many of
these fields.122
for many low-income workers, however, it is not
necessarily the number and type of individual
offerings per se that is the biggest problem. the
choice of programs in the metro area is in fact
extensive. the region’s high schools, for instance,
are continually working to expand and improve
their career and technology education (cte)
curricula, and numerous next-economy-oriented
programs do exist, in areas ranging from it to
maritime studies to engineering. the area’s com-
munity colleges offer a vast array of credit and
non-credit educational and training programs.
and dozens more public, private, and non-profit
providers offer training and job placement services
in dozens of different fields, with some specifi-
cally focusing on the unique needs of low-income
or disenfranchised workers. Second chance, for
example, provides both “green collar” training
and employment in construction to hard-to-serve
Baltimore city residents, while the Biotechnical
institute of Maryland provides tuition-free training
in basic laboratory skills to the unemployed and
under-employed.123
However, several interviewees noted that although
multitudes of educational and training programs
and services exist, not all are high quality, and
even those that are are not well-coordinated with
one another. guided by different funding streams
and different performance measures, the current
players in the system—the public workforce devel-
opment agencies, community colleges, private and
non-profit providers, and industry groups—do not

55Building from sTrengTh: creating opportunity in greater Baltimore’s next economy | iV. Barriers to opportunity
share a unified set of concrete goals against which
they can determine their collective effectiveness.
the fractured nature of the system in turn makes
it difficult for both workers and employers to suc-
cessfully use it, and many job seekers can end up
slipping through the cracks.
this is particularly true for low-income, middle-
career workers. although they might aspire to
a better job, many are grappling with numerous
and varied issues—such as criminal records, single
parenthood, a scattered work history, and multiple
part-time jobs—that challenge their ability to set
and stay on a straight course to a good career.
these barriers are compounded by a disjointed
workforce development system, which leaves
career pathways in most industries not readily
apparent, accessible, or easily navigable. Just
knowing about the range of training opportuni-
ties, for example, does not help someone decide
which one might mesh best with his or her skills,
interests, or existing work and family schedule.
nor does having a credential automatically lead
to employment in a firm where new knowledge is
valued, rewarded, and built upon. without sturdy
links from education and training to job-placement
services to desired employment, workers can get
lost along the way and end up either stagnating
in low-end jobs or dropping out of the workforce
altogether.124
spatial Barriersan inability to physically access education, train-
ing, and jobs, finally, can be another big obstacle
for many low-income residents. although Mary-
land was early at the forefront of the smart
growth movement, the state still lacks a mecha-
nism to require local governments to better plan
residential development in proximity to jobs or
vice versa. this could help to explain why only just
over one-quarter of metro area residents live in a
jobs-rich census tract, that is, one where the ratio
of jobs to people exceeds that of the metro area
as a whole.127 low-income Baltimoreans are only
slightly more likely to live in such a tract, leaving
mAnufACTuring’s workforCe ChAllengesthe workforce challenges cited by Baltimore-area manufacturers and related organizations mirror
those of manufacturers nationally. a recent report of the Manufacturing institute (Mi) noted that at
the peak of the recession, nearly one-third of manufacturers surveyed said they had jobs that were
unfilled because they could not find workers who had the right skills. all of those interviewed for this
report that are in some way involved in manufacturing expressed fear that this would get worse in
the next decade, as many older workers retired. according to those interviewed, at the heart of the
problem is the widespread—if erroneous—perception that manufacturing is a dirty, dying industry
made up of either boring or backbreaking jobs. this over time has limited the interest in these
jobs and ultimately the number of education and training programs in high schools, community
colleges, or through other providers that teach the high-tech skills that are needed. although the
tiMe center collaborates with several community colleges and other stakeholders in the region to
educate current and future manufacturing workers, such programs remain few and far between.125
Some seeds of change are being sown, however. the Baltimore city school system, for example,
has a growing interest in a collaborative program to develop the next generation of high-tech
manufacturing employees, and several regional groups and the mayor’s office have voiced their
support for this effort.126

56 BrookingS inStitution Metropolitan policy prograM
more than 72 percent in neighborhoods with a
relatively low density of jobs. Moreover, even those
who do live nearer to jobs may not easily be able
get to any given next-economy job that they want,
that is available, and for which they are qualified,
nor do they necessarily have access to the educa-
tion and training programs that they might need
to earn the right qualifications in the first place.
Having a car helps. the vast majority of Baltimor-
eans—77 percent, in fact—drive alone to work each
day, an option that affords the most flexible range
of movement throughout the region and beyond.128
But for the more than 114,000 households without
a vehicle in the metro area (71 percent of which
are low-income), mobility can be far more con-
strained.129 for these residents, the expense of buy-
ing and maintaining a reliable car combined with
what have been some of the strictest state driver’s
license requirements in the nation can be a major
impediment to getting and keeping just the type of
good-paying job that could make purchasing a car
possible.130
for workers who do not have their own vehicle,
public transportation is a crucial but less reliable
alternative. although the region’s low-income resi-
dents can reach a greater share of metro area jobs
using transit than can their higher-income coun-
terparts, getting to work, school, or training on the
bus or rail can still be a struggle.131 for example,
while every low-income Baltimore city resident is
close to at least one transit stop, public transpor-
tation allows them to connect to only about one-
half of all jobs in the metro area—and just under
one-half of all middle-skill jobs—within a 90-minute
time frame. low-income suburban residents have
it far worse, as they can reach less than 28 percent
of all metro area jobs within 90 minutes via public
transit, and only about 23 percent of middle-skill
jobs.132 what is more, these numbers represent the
best-case rush hour scenario.133 taking transit at
off-peak hours—to, say, a nighttime community col-
lege class or an early morning shift at the airport—
could take far longer, if services are available at all.
as these statistics make clear, without more care-
ful attention to where jobs are located and how
they are served by the region’s public transporta-
tion system, many training and job opportunities
will simply remain geographically off limits to a
wide segment of the metro area’s low-income
population. n
Most middle-wage, next-economy occupa-tions demand some level of training or education that can then be advanced through on-the-job training and work experience.

57Building from sTrengTh: creating opportunity in greater Baltimore’s next economy | V. new framework for Change
V. a new framework for change
perhaps one of the reasons the presentation by the economic
alliance of greater Baltimore did not sit quite right with
some was that hidden within it were some uncomfortable
truths. the first is that a good economy for most does not
inevitably create a better economy for all. indeed, by so many measures,
greater Baltimore has been beating the averages, yet the numbers of low-
income people have actually gone up. the second, and most significant, is
that a good economy for most can be had even without the participation
of many, providing little motivation for regional leaders to seriously evalu-
ate how economic growth impacts regional opportunity.
58 BrookingS inStitution Metropolitan policy prograM
this certainly does not mean that the plight of
low-income residents has been ignored. the public,
nonprofit, and philanthropic sectors in Baltimore
and throughout the country in fact spend billions
of dollars each year trying to plug the holes that
the current economy is leaving behind. Many
social programs by their very design are intended
to help fill the breach between what a person’s
wage—or lack thereof—allows them to afford and
what is actually needed to pay for basic needs.
neighborhood revitalization programs, for their
part, focus on bridging the difference between
where and in what the private sector will invest
and the housing, services, and jobs a healthy com-
munity requires. and a range of other programs
provide child care or other sources of support that
simply stretch workers’ resources such that they
are able to go to a job each day, even one that
does not pay enough to cover all of the expenses
associated with having it.
these are vital interventions that have become
even more critical during the past several years.
and they will always be needed to provide a
temporary safety net for individuals and families
that fall on hard times, as well as a longer-term
catch for those who do not have the intellectual
aptitude, emotional stability, good health, or other
capacities necessary to move up and out of low-
wage work or to hold a job at all. But they are not
targeted at expanding opportunity—that is, making
greater numbers of middle-wage jobs available
and accessible to those who want to get ahead—as
much as they try to compensate for that fact that
there isn’t enough of it.
creating a better opportunity structure requires a
different approach, one focused on investing in the
region’s next economy and building a workforce
that both drives and benefits from its growth.
in the first place, greater Baltimore’s public,
private, and non-profit leaders—along with those
of the state—must be be far more visionary, far
more coordinated, and far more strategic about
growing the next-economy industries in which
good wage jobs are the norm rather than the
exception. as discussed above, the manufactur-
ing, it, bioscience, transportation and logistics,
and “clean” sectors each hold their own promise
for and face their own challenges to growth. But,
efforts to strengthen the very next-economy attri-
butes that make these sectors so critical to the
region’s future will redound to the benefit of them
all. to this end, regional leaders, in collaboration
with the state, must:
➊ Build a stronger export economy. in an
increasingly competitive global economy, Maryland
and greater Baltimore must together invest in the
assets that give their companies an edge in the
marketplace, and which may in fact be essential to
their long term survival. Helping firms to establish
the relationships and internal and external infra-
structures necessary to export their products or
services abroad is one key way to do this.
to increase the region’s exports, state and metro
area leaders must undertake a rigorous assess-
ment of who is exporting what and to whom, the
extent to which existing export promotion activi-
ties and organizations are aiding in that process,
the major barriers to exporting that companies
face, and the kind of additional efforts—from
regional infrastructure improvements to targeted
technical assistance—that could help to overcome
them. armed with that information, the state
and region should then work together to develop
a strategy for increasing regional exports, with
quantifiable goals and clear measures to evaluate
progress. Such a strategy should focus in part on
leveraging the resources of existing organizations—
of which there are several, as discussed above—
such that their impact can be better maximized.
for example, through its new Metropolitan export
initiative, the Brookings institution Metropolitan
policy program is working with representatives
of several regions around the country, including
los angeles, portland, Minneapolis/St. paul, and
Syracuse, to develop metropolitan export plans,
the primary goal of which is to improve regional
economic performance through strategies aimed

59Building from sTrengTh: creating opportunity in greater Baltimore’s next economy | V. new framework for Change
at spurring export growth.134 the u.S. conference
of Mayors, meanwhile, is building on this effort by
challenging mayors across the country to develop
strategies aimed at expanding their cities’ export
capacity.135 greater Baltimore should try to learn
from and build on such efforts.
➋ Provide greater support for innovation and
entrepreneurship. it is a well-worn fact that that
Baltimore must get more ideas out of the labora-
tory and into the marketplace. at the same time,
existing firms—particularly small and middle-sized
manufacturers—must constantly be working to har-
ness technologies and innovations that will expand
their business opportunities here and abroad.
● help new ideas become new businesses. for
budding entrepreneurs, converting research
into an innovation requires both a good inven-
tion and a good model for ensuring that it
reaches the hands of real consumers.
first, greater Baltimore needs more capital
for early-stage technologies that might still
be years away from being commercialized.
according to several people interviewed for
this report, angel investors in the region are
very risk averse and not well coordinated, par-
ticularly when compared with their california
peers. to change this, the public, non-profit,
and private sectors must continue to work
together to grow and organize the metro
area’s angel community and then mobilize
it to make the small but crucial early invest-
ments that traditional venture capitalists will
not. in the meantime, Maryland should look
for ways to increase the support for teDco
and other similar state programs, includ-
ing new initiatives such as investMaryland,
which can help to fill funding gaps along the
research-to-commercialization continuum.
Sometimes even relatively small amounts of
funding, when combined with customized sup-
port and coaching, can be essential in helping
fledgling firms develop a workable business
model and then traverse the rocky terrain
that exists between developing a proof-of-
principal, having a sellable product, growing
a customer base, and ultimately, turning a
profit.136
Second, regional leaders should consider
how financial and organizational support
for innovation and entrepreneurship can be
brought together in one geographic space.
Spain’s 22@Barcelona innovation district,
for instance, focuses on three mutually
reinforcing efforts: dedication to advancing
innovation-driven clusters in areas such as
medical technologies and information and
communication technology, entrepreneur-
ship development, and a strong physical plan
for creating a high-quality, walkable space
to entice businesses and families to locate
there. the intentional connections between
anchor institutions like universities, incuba-
tors, educational and entrepreneurial coach-
ing services, housing, and other amenities are
key to the district’s success, and they provide
a model that Baltimore is well positioned to
emulate.137
creating a better opportunity structure requires a different approach, one focused on investing in the region’s next economy and building a work-force that both drives and benefits from its growth.

60 BrookingS inStitution Metropolitan policy prograM
● help manufacturers stay on the cutting
edge. to remain competitive, small and
middle-sized manufacturers (SMMs) must
implement new technologies and the changes
in management processes, work organiza-
tion, and supply-chain relationships that often
accompany them. yet, these firms typically
have weak in-house innovation capacity and
limited ability to connect to innovations in
universities and elsewhere.138
to help to fill these gaps, state and regional
leaders must better understand and engage
with the sector. to this end, they could in the
short term incent SMMs to form a consortium
focused on promoting manufacturing innova-
tion and helping workforce providers design
training programs that meet their needs. over
the longer term, leaders should work with uni-
versities—and programs within them such as
Mtech—the regional Manufacturing institute,
the Baltimore industrial group, and the Manu-
facturer’s alliance of Maryland to establish an
advanced manufacturing research center in
the region. Such a center would assist manu-
facturers with research commercialization,
technology transfer, incubation services, and
production innovation and thus help to bridge
the gaps between innovation and application
that now limit SMMs’ abilities to embrace the
latest technological advances.139 the cen-
ter for integrated Manufacturing Studies at
rochester institute of technology and the
connecticut center for advanced technology
are two of several domestic institutions that
employ elements of such a model, although
the 59 fraunhofer institutes in germany are
perhaps the best current example of how the
combination of such efforts can help to retain
high-wage manufacturing jobs.140
➌ Build on the region’s clean economy
strengths. to compete in the next economy,
finally, regional leaders should engage in efforts to
advance stronger, faster growth in greater Balti-
more’s emerging clean economy.
the region, aided by the state, should use the
data presented here as a platform for more rigor-
ously assessing the metro area’s clean economy
strengths and opportunities and any impediments
to future growth and development. for example,
what is driving the region’s specialization in
professional and environmental services? what
are the segment’s major markets, and what policy
reforms or investments would help to strengthen
these? in the Seattle region, for instance, this
type of analysis was performed to reveal and then
devise a strategy to exploit the strengths of its
energy efficiency technologies cluster.141
State and local leaders should then use the
answers to these types of questions to better
target efforts to grow green firms and jobs and
to help break down existing regulatory, financial,
and other barriers. Such efforts might include, at
one end the spectrum, a revamping of govern-
ment procurement processes to stimulate demand
for local green products and services, and at the
other, marketing Maryland firms to countries and
companies abroad. over the long term, more
fine-grained information about the state’s and the
region’s own green assets and challenges could
also give Maryland a louder voice in advocating for
stronger, more coherent federal policies regard-
ing carbon pricing, renewable energy standards,
and other areas that affect local clean economy
growth.
these and other strategies aimed at promoting
the growth of greater Baltimore’s next-economy
industries are of course only part of the solution.
growing an opportunity-rich next economy also
means ensuring that regional workers have the
information, skills, and connections needed to
participate in it and that next-economy employ-
ers thus have the labor force they need to
expand and succeed. to this end, regional leaders
must:
➍ Help young and incumbent workers get the
skills and education next-economy employ-
ers require. in a rapidly changing economy with
61Building from sTrengTh: creating opportunity in greater Baltimore’s next economy | V. new framework for Change
rapidly changing technologies, greater Baltimore’s
education and training providers must constantly
stay abreast of the specific skills next-economy
employers require in their workers, and they must
be able to nimbly adapt their curricula to accom-
modate these needs. More low-income workers
then must be able to access these programs and
will require support to successfully complete them.
first, the state, together with local school districts,
community colleges, and other providers, must
continue to develop career and technical educa-
tion programs in next-economy fields as well as
establish strong links between high school and
post-secondary schools so that students can seam-
lessly continue to advance their skills. research
has shown that successful programs provide
personalized attention and opportunities for inter-
personal collaboration as well as combine a strong
academic curriculum with coherent sequences of
career-related courses.142 perhaps most important,
successful programs ensure that formal school-
ing is accompanied by real-world experience. as
several of those who were interviewed for this
report emphasized, the public schools, commu-
nity colleges, and training providers in the area
must work much more closely with employers to
increase the availability of internships, apprentice-
ships, mentoring programs, and on-the-job train-
ing opportunities. Doing so would provide youth
and adults a greater chance to broaden their work
horizons, hone their skills, build their resumes, and
make connections that could lead to permanent
employment.
Second, leaders must also work to ensure that
more of those entering community college or
other post-secondary training programs—whether
straight from high school or after years of work—
actually earn a credential. to this end, regional
leaders should expand the number of bridge
programs, such as the pilot Maryland integrated
Basic education and Skills training (Mi BeSt)
program, which allow community college and
technical college students to undertake vocational
training alongside basic education classes, rather
than requiring that such classes be a prerequisite
for any sort of advanced learning. a 2010 analysis
of washington State’s i-BeSt program, after which
Mi Best was modeled, found that students who
attended community or technical colleges with
i-BeSt were 7.5 percentage points more likely to
earn a certificate within three years and almost
10 percentage points more likely to earn some col-
lege credits compared with students who were not
exposed to the program.143
➎ Build a more coordinated workforce delivery
system. for many low-income workers, the path-
way from education and training to a satisfying
career is not linear but rather zigs and zags over
time and across the various parts of the workforce
delivery system. to get more of these residents
to participate in the next economy demands that
Baltimore create a much more integrated, compre-
hensive structure to keep them moving forward.
the first step in the process must be to develop an
inventory of all the public, private, and nonprofit
providers in the workforce development system,
the types of programs they offer, the numbers
they serve, how successful they are in helping
residents secure a decent job, and the industries
in which they are landing. only by doing this can
regional leaders begin to identify gaps in the
delivery structure—for example, in education and
training programs, employer engagement, job-
matching services—and then work with providers
and employers to help fill them.
Second, and most important, all of the players
in the system—businesses, community colleges,
government, nonprofit agencies—together must
develop a common regional vision and a set of
goals against which to measure their joint prog-
ress toward not simply serving residents but actu-
ally helping them access, maintain, and ultimately
create quality employment opportunities in grow-
ing sectors.
although targeted at the “front” end of workforce
development spectrum, the Strive partnership of

62 BrookingS inStitution Metropolitan policy prograM
cincinnati and northern kentucky offers a good
example of how multiple organizations can orient
their work around common objectives. compris-
ing an extensive partnership involving more than
300 civic groups, philanthropies, colleges, public
agencies, nonprofits, and businesses, Strive’s
“cradle-to-career” approach to improving edu-
cational outcomes attempts to coordinate every
service and support that children and adolescents
need at every stage of their education and devel-
opment. what is unique about this effort is the set
of shared goals among the organizations and the
joint responsibility for meeting them.144
➏ Improve low-income workers’ ability to get
to next-economy jobs. to broaden participation
in the next economy, finally, regional leaders must
work to both bring low-income people to jobs
and bring jobs to low-income communities. to this
end, a regional vision and strategy for economic
growth as is outlined in this report must identify
not only the types of industries and jobs that
greater Baltimore must create, but also where in
the region that growth should occur.
this is not just about preserving environmental
and fiscal resources. Such planning is essential
to help determine how land use, transportation,
and infrastructure investments should be tar-
geted to better align and in some areas help spur
residential and business development while also
helping to improve physical connectivity between
people and jobs. integrating existing state and
local efforts to foster transit-oriented develop-
ment in the metro area into a next-economy
economic development strategy will be critical
to this process, as will the continued build-out of
transportation infrastructure such as the proposed
red line. in the meantime, state and local govern-
ment officials should work to make both existing
and planned public transportation systems better
connect people to locations where jobs are con-
centrated and growing.145 n
ChAnge And effeCTSo what might the potential outcome be if Maryland’s and Baltimore’s government, nonprofit,
business, university, and philanthropic leaders together stepped up to this challenge?
a 2010 report by anthony carnavale of the georgetown university center on education and the
workforce helps to put some numbers on it. according to his analysis, in 2018 Maryland will have
approximately 465,000 computer, engineering, life sciences, production, and transportation and
material moving jobs. about 290,000 (62 percent) of these will require an associate’s degree or
less.146 an additional 5 percent, 10 percent, or 15 percent of these low- to middle-skilled occupations
would mean an additional 14,500, 30,000, or 43,500 mostly decent-wage jobs in the region, in just
these few next-economy fields alone.
these are rough estimates, to be sure, but they do provide some sense of how efforts to improve
the region’s export capacity, invest in the growth of innovative firms, and expand the clean economy
could have a real impact on the state’s and region’s opportunity structures, provided that such
efforts are matched with those aimed at ensuring that low-income people have the ability to
connect to jobs in growing fields.
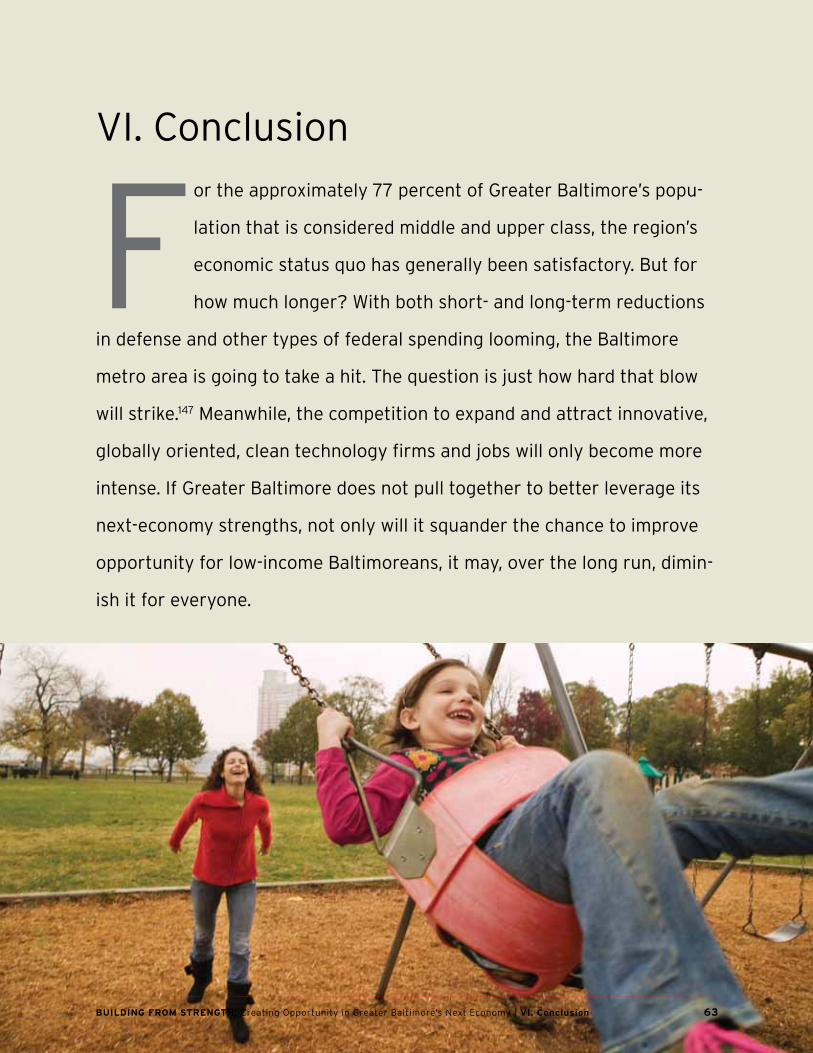
63Building from sTrengTh: creating opportunity in greater Baltimore’s next economy | Vi. Conclusion
Vi. conclusion
for the approximately 77 percent of greater Baltimore’s popu-
lation that is considered middle and upper class, the region’s
economic status quo has generally been satisfactory. But for
how much longer? with both short- and long-term reductions
in defense and other types of federal spending looming, the Baltimore
metro area is going to take a hit. the question is just how hard that blow
will strike.147 Meanwhile, the competition to expand and attract innovative,
globally oriented, clean technology firms and jobs will only become more
intense. if greater Baltimore does not pull together to better leverage its
next-economy strengths, not only will it squander the chance to improve
opportunity for low-income Baltimoreans, it may, over the long run, dimin-
ish it for everyone.

64 BrookingS inStitution Metropolitan policy prograM
However, it doesn’t have to be this way. when four-
term Baltimore mayor (and two-term Maryland
governor) william Donald Schaefer died last year,
the media’s retrospectives focused on his vision
for transforming what was at the time a city beset
with troubles and highlighted the intensity and
impatience he had when it came to implementing
it. His ideas for creating Harborplace, the national
aquarium, and, as governor, light rail, camden
yards, and M & t Bank Stadium were bold and ulti-
mately significant contributions to the city’s and
the region’s revitalization. as important as these
developments were, however, these projects were
discrete and generally well defined, and they were
able to come about in part through Schaefer’s own
authority and tenacity. improving the opportunity
structure of a regional economy, by contrast, is a
far bigger and more complicated proposition and
will not be realized as a result of isolated interven-
tions of individual people or organizations. rather,
as John kania and Mark kramer argue in a recent
paper in the Stanford Social innovation review,
“alleviating many of our most serious and complex
social problems” demands a “collective impact”
strategy—a long-term commitment by a group of
important actors from different sectors that have
a shared vision for change and a joint approach
for reaching it through agreed-upon actions.148
as kania and kramer point out, such efforts do
not often take hold, “not because they are impos-
sible, but because [they are] so rarely attempted.”
greater Baltimore has the institutional strength
and organizational capacity to bring about the
type of large-scale social and economic changes
suggested in these pages, if it has the will to do so.
will it try, then, to be an exception to the rule? n
improving the oppor-tunity structure of a regional economy will not be realized as a result of iso-lated interventions of individual people or organizations.

65Building from sTrengTh: creating opportunity in greater Baltimore’s next economy | endnotes
endnotes1. a revised version of the presentation is available at www.greater-
baltimore.org/
2. Howard wial and richard Shearer, “Metro Monitor: tracking
economic recession and recovery in america’s 100 largest Metro
areas” (washington: Brookings institution, 2011) ; MetroMonitor is a
quarterly publication analyzing economic statistics in the 100 larg-
est u.S. metro areas. it began in 2009.
3. Michael e. porter and Mark r. kramer, “creating Shared Value:
How to reinvent capitalism—and unleash a wave of innovation and
growth” (cambridge: Harvard Business Review, 2011).
4. american community Survey 2009, “1-year estimate” and
census 2000.
5. “MetroMonitor.” (Brookings).
6. american community Survey 2009, “1-year estimate.”
7. u.S. census Bureau. Some research has found that setting the defi-
nition of “low income” at twice the federal poverty line more accu-
rately reflects families’ ability to afford essentials, including food,
housing, transportation, and health care, than the more conserva-
tive poverty threshold. See, for example, Sylvia allegretto, “Basic
family Budgets: working families’ Budgets often fail to Meet living
expenses around the u.S.” (washington: economic policy institute,
2005); Jared Bernstein, chauna Brocht, and Maggie Spade-aguilar,
How Much Is Enough? Basic Family Budgets For Working Families
(washington: economic policy institute, 2000); the working poor
families project, “Still working Hard, Still falling Short: new find-
ings on the challenges confronting america’s working families”
(2008); gregory acs and pamela loprest, “who are low-income
working families?” (washington: urban institute, 2005).
8. american community Survey 2009, “1-year estimate” and
census 2000.
9. american community Survey 2009, “1-year estimate.” the metro
area’s six suburban counties are home to a larger overall share
of the region’s low-income residents (54.4 percent) than the city
(45.6 percent), but low-income residents make up a far smaller
share of the total suburban population (16.5 percent) than the city
population (43.9 percent).
10. american community Survey 2009, “1-year estimate.” includes low-
income residents aged 16 years or older that were in the labor force
but were not necessarily consistently working.
11. ibid. the remaining 3 percent of low-income residents were either
unemployed for the entirety of the past 5 years or had never been
employed.
12. ibid. these numbers are based on the industry in which a worker is
currently or was most recently employed during the 2005 to 2009
period.
13. Bureau of labor Statistics occupational employment Statistics
and Moody’s analytics. low-wage jobs are defined here as those
in which the median wage is below 80 percent of the metro area
median, or less than $34,600.
14. Jim tankersley, “the phantom 15 Million,” National Journal, Janu-
ary 21, 2011.
15. Brookings analysis of Moody’s analytics data.
16. ibid.
17. these numbers effectively mean that greater Baltimore’s relatively
sluggish overall job growth in the 1990s came at the expense of
jobs in the middle and especially at the higher end of the pay scale.
in fact, during the 1990s, the number of jobs in the region’s highest
wage industries actually declined by 3 percent.
18. Brookings analysis of Moody’s analytics data.
19. ibid.
20. ibid.
21. Michael Spence and Sandile Hlatshwayo, “the evolving Structure of
the american economy and the employment challenges.” working
paper. (council on foreign relations, 2011). See also Steven pearl-
stein, “key to job growth, equality is boosting tradable sector of the
economy” Washington Post, March 12, 2011, and Michael greenstone
and adam looney, “a Dozen economic facts about innovation”
(washington: Brookings institution and the Hamilton project, 2011).
22. tankersley, “the phantom 15 Million” and greenstone and looney,
“a Dozen economic facts about innovation.”

66 BrookingS inStitution Metropolitan policy prograM
23. tankersley, “the phantom 15 Million.”
24. greenstone and looney, “a Dozen economy facts about innova-
tion.”
25. emilia istrate and nicholas Marchio, “export nation 2012” (wash-
ington: Brookings institution, 2012).
26. anthony p. carnavale and Stephen J. rose, “the undereducated
american” (washington: georgetown university, 2011).
27. tankersley, “the phantom 15 Million.”
28. Bureau of economic analysis and Bureau of labor Statistics.
29. pearlstein, “key to Job growth, equality is Boosting tradable Sec-
tor of the economy.”
30. national Science foundation, “academic research and Develop-
ment expenditures: fiscal year 2009.” in 2009, colleges and
universities in Maryland expended over $3 billion on research and
development in science and engineering fields. expenditures at the
Johns Hopkins university, which includes the applied physics labo-
ratory, accounted for $1.86 billion of that amount, and expenditures
at the university of Maryland, Baltimore, accounted for $359.5
million (ranking it 52nd out of over 700 universities). the university
of Maryland, Baltimore county (uMBc), part of the university of
Maryland Biotechnology institute, the u.S. naval academy, Morgan
State university, the university of Baltimore, and towson university
accounted for the most of the additional university research and
development expenditures in the metro area.
31. kauffman index of entrepreneurial activity, 1996 to 2010.
32. Mark Muro, Jonathan rothwell, and Devashree Saha, “Sizing the
clean economy: a national and regional green Jobs assessment”
(washington: Brookings institution, 2011).
33. an export industry is clustered in a metro area if its total export
value represents a greater share of the metro economy than it
does for the u.S. economy as a whole. emilia istrate, Jonathan
rothwell, and Bruce katz, “export nation” (washington: Brookings
institution, 2010).
34. innovative industries were identified using a composite ranking of
indicators measuring the following: product innovations, research
and development, scientists and engineers, productivity, patents,
and royalties. industries at the three-digit north american industry
classification System (naicS) level with at least three sources
for measurement were ranked against other industries by each
indicator. these ranks were then compiled and averaged to develop
a composite ranking of the most innovative industries. Data on
process innovations were obtained from the national Science
foundation (nSf) Division of Science resources Statistics’ Business
research and Devleopment and innovation Survey, which measured
the number of companies with a product or process innovation
from 2006 to 2008 at the national level. the number employed in
science and engineering occupations were selected from BlS occu-
pational employment Statistics 2009, using the nSf definition of
high-tech occupations available at www.nsf.gov/statistics/seind10/
appendix.htm#c3 and allocated to industry. productivity was calcu-
lated as percent change in gross dompestic product per job, using
Bureau of economic analysis from 2001 to 2007. patent data were
obtained from the u.S. trade and patent office (uStpo). the total
number of royalties on intellectual property by industry was pulled
from u.S. internal revenue Service 2007 Data on research credits
and royalties. See also Susan Helper, timothy krueger, and Howard
wial, “why Does Manufacturing Matter? which Manufacturing
Matters? a policy framework” (washington: Brookings institution,
2012).
35. u.S. news Best Hospitals 2011-12, available at http://health.usnews.
com/best-hospitals/rankings Services rendered to patients who
come to Baltimore hospitals are measured as exports.
36. Such growth can occur not only from medical tourism -i.e., the
attraction of international patients to area hospitals - but also from
medical-related conventions and other meetings. the Baltimore
convention center, for example, hosted approximately 20 such
events in 2011. (personal communication from Joel Boerger, admin-
istrative assistant, Baltimore convention center, august 4, 2011.)
37. the manufacturing sector as defined here includes all industries in
north american industry classification System (naicS) codes 31-33.
38. Brookings analysis of Moody’s analytics data.
39. Brookings analysis of Moody’s analytics and Battelle technology
partnership practice and Biotechnology industry organization
(Bio) data.
40. u.S. census Bureau, county Business patterns, 2008.
41. Brookings analysis of Moody’s analytics data.

67Building from sTrengTh: creating opportunity in greater Baltimore’s next economy | endnotes
42. author’s analysis of u.S. Bureau of economic analysis data.
43. Hank robison, “why we can’t Shun Manufacturing for the Service
Sector,” www.newgeography.com, March 16, 2011.
44. ross DeVol and others, “Manufacturing 2.0: a More prosperous
california,” the Milken institute, June 2009, cited in ezell and
atkinson, “the case for a national Manufacturing Strategy.”
45. Maryland Department of labor, licensing, and regulation, occupa-
tional projections 2008-2018.
46. Brookings analysis of Moody’s analytics data.
47. Brookings analysis of Bureau of labor Statistics occupational
employment Statistics and Moody’s analytics data.
48. Manufacturers’ alliance of Maryland, “Manufacturing in Maryland:
the cornerstone of Shared prosperity” (2008).
49. istrate and Marchio, “export nation 2012”; Manufacturers’ alliance
of Maryland, “Manufacturing in Maryland: the cornerstone of
Shared prosperity–and update” (2011).
50. istrate and Marchio, “export nation 2012.”
51. personal communication from elizabeth Hines, Director of foreign
trade Zone, enterprise Zone administrator, Baltimore Development
corporation, July 13, 2011.
52. personal communication from Mark rice, president, Maritime
applied physics corporation, May 23, 2011; Maryland Department of
transportation, “Maryland Statewide freight plan” (2009); Baltimore
industrial group, available at www.baltimoreindustrialgroup.org.
53. the information technology (it) sector as defined here includes 14
occupations in Bureau of labor Statistics occupational employ-
ment Statistics job code 15 (computer and Mathematical occupa-
tions) and 1 occupation each in codes 11 (Management occupations),
17 (architecture and engineering occupations), and 43 (office
and administrative Support occupations). this definition follows
that used in economic alliance of greater Baltimore, “information
technology in greater Baltimore,” 2008.
54. economic alliance of greater Baltimore, it industry profile, avail-
able at www.greaterbaltimore.org/publications/industry-profiles.
aspx.
55. Bureau of labor Statistics occupational employment Statistics.
56. economic alliance of greater Baltimore, “information technology in
greater Baltimore.”
57. Jamie Smith Hopkins, “phase 1 is Done,” Baltimore Sun, September
11, 2011; Maryland Department of labor, licensing, and regulation,
“pathways to cyber consotrium celebrates first anniversary of
training Maryland workers for cyber economy,” July 20, 2011.
58. Brookings analysis of Bureau of labor Statistics occupational
employment Statistics.
59. ibid.
60. ibid.
61. Maryland Department of labor, licensing, and regulation, Mary-
land occupational projections 2008-2018, available at www.dllr.
state.md.us/lmi/iandoproj/
62. integrated postsecondary education Data System State Data cen-
ter, 2008-2009.
63. personal communication from neil Davis, Vice president for opera-
tions, emerging technology centers, July 5, 2011.
64. economic alliance of greater Baltimore, “information technology in
greater Baltimore.”
65. for more information, see the icBn website at http://onemaryland-
icbn.org/
66. See, for example, governor’s workforce investment Board, “Mary-
land’s Health information technology workforce task force report
and findings” (2010).
67. except where noted, the bioscience sector as defined here follows
the definition developed by Battelle and adopted by the Biotechnol-
ogy industry organization (Bio). it includes four major subsectors
that engage in core bioscience activity: agricultural feedstock and
chemicals (which represents a very small portion of Baltimore’s bio-
science industry); drugs and pharmaceuticals; medical devices and
equipment; and research, testing, and medical laboratories. each of
the four sectors comprises six-digit-level naicS industries.

68 BrookingS inStitution Metropolitan policy prograM
68. Data provided by Battelle technology partnership practice and the
Biotechnology industry organization (Bio).
69. See the Maryland BioStat Map, available at www.marylandbiocenter.
org/Bioscience%20of%20Maryland/pages/biostatmap.aspx, and
the Maryland Bio Directory, available at www.marylandbiocenter.
org/Bioscience%20of%20Maryland/pages/marylandbiodirectory.
aspx.
70. Battelle technology partnerships practice and the Biotechnology
industry organization (Bio).
71. Battelle/Biotechnology industry organization (Bio) “State Biosci-
ence initiatives” (2010).
72. Battelle technology partnership practice, “Maryland life Sciences
Strategic plan: the current competitive position of Maryland”
(2009); author’s analysis of Battelle data.
73. national Science foundation, “academic research and Develop-
ment expenditures: fiscal year 2009,” available at www.nsf.gov/
statistics/nsf11313/pdf/nsf11313.pdf.
74. economic alliance of greater Baltimore, “Biosciences in greater
Baltimore” (2007).
75. given data limitations, the definition of bioscience used to deter-
mine occupations and wages differs slightly from the Battelle
definition employed above. it includes all of those working in the
north american industry classification System (naicS) categories
3254 (pharmaceutical and medical manufacturing), 3391 (medi-
cal equipment and supplies manufacturing), and 5417 (scientific
research and development services); Brookings analysis of Bureau
of labor Statistics occupational employment Statistics and
Moody’s analytics data.
76. ibid.
77. ibid.
78. See, for example, Maryland life Sciences advisory Board, “BioM-
aryland 2020: a Strategic plan for the life Sciences in Maryland”
(2009); greater Baltimore committee, “the Biotech report” (2011);
Battelle technology partnership practice: “Maryland life Sciences
Strategic plan;” economic alliance of greater Baltimore, “Biosci-
ence in greater Baltimore.”
79. Battelle technology partnerships practice and the Biotechnology
industry organization (Bio).
80. greater Baltimore committee, “the Biotech report.”
81. ibid. See also Michael knapp, “turn life Sciences research into
Jobs” Baltimore Sun, october 5, 2011.
82. the clean economy is defined here by using the method devel-
oped by the Brookings institution with the Battelle technology
partnership practice. See See Mark Muro, Jonathan rothwell,
and Devashree Saha, “Sizing the clean economy: a national and
regional green Jobs assessment” (washington: Brookings institu-
tion, 2011).
83. Muro and others, “Sizing the clean economy: a national and
regional green Jobs assessment.”
84. Data derived from the Brookings/Battelle clean economy Database.
85. ibid.
86. ibid.
87. Brookings analysis of Bureau of labor Statistics occupational
employment Statistics and Brookings-Battelle clean economy
Database.
88. ibid. Mid- to high-paying jobs are defined here as paying at least 80
percent of the area median.
89. Bloomberg new energy finance, cited in Muro, rothwell, and Saha,
“Sizing the clean economy.”
90. See, for example, www.baltimoresustainability.org, www.howard-
countymd.gov/Departments.aspx?id=4294967856, and
www.harfordcountymd.gov/green/
91. www.mpa.maryland.gov/content/green-port.php; lorraine Mirabella,
“port of Baltimore goes green” Baltimore Sun, March 7, 2011;
www.bccenter.org/index.php?target=70; personal communication
from Stuart fitzgibbon, refinery Manager, Domino Sugar, and
chairman, Baltimore industrial group, July 11, 2011.

69Building from sTrengTh: creating opportunity in greater Baltimore’s next economy | endnotes
92. walaika Haskins, “Baltimore Medical Systems new Headquarters
receives leeD-platinum certification” BMore Media, august
3, 2010, available at http://bmoremedia.com/innovationnews/
bmsleedplatinumcertification080310.aspx
93. “transportation and logistics” is defined here as all of those indus-
tries included in north american industry classification System
(naicS) categories 48-49 (transportation and warehousing),
except pipeline transportation, scenic and sightseeing transporta-
tion, and transit and ground passenger transportation. Many work-
ers in these latter three subsectors are included in the category
“clean economy.”
94. for a detailed analysis of Maryland’s freight system, see the Mary-
land Department of transportation, “Maryland Statewide freight
plan” (2009).
95. Brookings analysis of Moodys analytics data.
96. Maryland port administration, “the economic impacts of the port
of Baltimore” (2008); Maryland aviation administration and Bwi,
“the regional and local economic impact of the Baltimore/wash-
ington international thurgood Marshall airport and the Statewide
general aviation Systems” (2007).
97. Brookings analysis of Moody’s analytics data. Documents produced
by the port of Baltimore, for example, show that general cargo
moving through the port declined nearly 20 percent between 2008
and 2009.
98. Maryland port administration, “the economic impacts of the port
of Baltimore” and “activity at the port Drives Maryland’s economy,”
available at http://port.thinkport.org/allabouttheport/jobs.asp.
99. Maryland aviation administration and Bwi, “the regional and
local economic impact of the Baltimore/washington international
thurgood Marshall airport and the Statewide general aviation
Systems.”
100. Brookings analysis of Bureau of labor Statistics occupational
employment Statistics and Moody’s analytics data; anne arundel
community college, “careers that are going Somewhere” fact
sheet.
101. ibid.
102. Donald c. fry, “port Surge: Seagirt improvements Spawn optimism
around Baltimore’s waterfront” CityBiz Real Estate, June 19, 2011;
the Maryland port administration, “governor o’Malley announces
port of Baltimore Bounces Back with Strong recovery in 2010,”
May 12, 2011.
103. Maryland port administration, available at http://mpa.maryland.
gov/.
104. Maryland Department of transportation, “Maryland Statewide
freight plan.”
105. Michael Dresser, “travel at Bwi Setting records” Baltimore Sun,
august 3, 2011.
106. Brookings analysis of Bureau of labor Statistics occupational
employment Statistics and Moody’s analytics data.
107. ibid.
108. ibid.
109. only 4.3 percent of low-income people were employed in manu-
facturing, for example, and only 4.1 percent were employed in
professional, scientific, and management jobs, which include (but
are not limited to) research and development and many information
technology jobs.
110. See, for example, Biotechnology industry organization (Bio),
“enhancing america’s competitive edge,” available at www.bio.org/
content/enhancing-americas-competitive-edge.
111. ezell and atkinson, “the case for a national Manufacturing Strat-
egy.”
112. claSp, “keeping youth connected: focus on Baltimore” (2011);
Brookings institution concentrated poverty data set, 2011.
113. See Shayne Spaulding, “getting connected: Strategies for expand-
ing the employment networks of low-income people” (philadel-
phia: public/private Ventures, 2005).
114. the Boston consulting group, “realizing the new agenda for
Minority Business Development” (2005); personal communication
from Diane Bell-Mckoy, president and ceo, associated Black chari-
ties, March 28, 2011; u.S. census Bureau, “2007 Survey of Business
owners.” racial data on the ownership of the region’s next-econ-
omy businesses are not readily available.

70 BrookingS inStitution Metropolitan policy prograM
115. claSp, “keeping youth connected.”
116. american community Survey 2009, “1-year estimate.”
117. liz Bowie and erica l. green, “State Sees Highest graduation rate
in past 15 years” Baltimore Sun, September 30, 2011; american
community Survey 2009, “1-year estimate.”
118. ibid.
119. Maryland Higher education commission, “retention, graduation,
and transfer rates at Maryland’s community colleges” (2011).
120. ibid.
121. Maryland life Sciences advisory Board, “BioMaryland 2020.”
122. See Donald fry, “Despite education acclaim, Maryland faces work-
force Development challenges” gBc news, July 22, 2011.
123. See www.biotechmd.org/ and www.secondchanceinc.org/index.
aspx.
124. personal communication from Diane Bell-Mckoy, president and
ceo, associated Black charities, March 28, 2011; Jason perkins-
cohen, executive Director, Job opportunities task force, May 3,
2011; eric Seleznow, State policy Director, national Skills coalition,
august 12, 2011; and others.
125. for more information, see the tiMe center website at
http://time-center.org/index.html.
126. personal communication from Mark rice, president, Maritime
applied physics corporation, December 1, 2011.
127. “Jobs rich” is defined as any tract in which the ratio of jobs to pop-
ulation exceeds that of the metro as a whole. tract-level employ-
ment and population data are derived from Brookings institution
analysis of nielsen Business-facts data from the 2nd quarter of 2010
and the american community Survey.
128. the Brookings institution, “State of Metropolitan america indicator
Map” (2011), available at www.brookings.edu/metro/StateofMe-
troamerica/Map.
129. adie tomer and robert puentes, “transit access and Zero Vehicle
Households” (washington: Brookings institution, 2011).
130. as of this writing, a bill to modify adult driver’s licensing require-
ments is awaiting the governor’s signature. until now, Maryland
was the only state that required all new drivers to complete the
same driver’s education and practice requirements, and all new
drivers had to complete 60 hours of supervised practice in addition
to 36 hours of driver’s education before being eligible for a license.
Michael Dresser, “Bill would ease Driver license rules for adults”
Baltimore Sun, March 7, 2011.
131. Baltimore ranks 59th out of the largest 100 metropolitan areas
based on the share of jobs accessible by transit within 90 minutes.
adie tomer and others, “Missed opportunity: transit and Jobs in
Metropolitan america” (washington: Brookings institution, 2011);
Brookings analysis of transit agency, nielsen pop-facts 2010, and
nielsen Business-facts data.
132. Brookings analysis of transit agency, nielsen pop-facts 2010, and
nielsen Business-facts data.
133. the analysis examined travel times from 6:00 am to 9:00 am.
134. for more information, see www.brookings.edu/projects/state-
metro-innovation/about_Mei.aspx.
135. Dave gatton, “Mayors launch Metro exports, port initiative” u.S.
Mayor, January 30, 2012.
136. Joseph patrick Bulko, “tech transfer: the next great Jobs gen-
erator?” Special Market report: the Biotech report (Baltimore:
greater Baltimore committee, 2010); newt fowler, “incubation:
a conversation with ann lansinger of the emerging technology
center” CityBiz Real Estate, May 8, 2011; gus g. Sentementes, “new
fund targets Baltimore tech Start-ups” Baltimore Sun, March 5,
2012.
137. for more information, see public Sector consultants and the
Brookings institution, “Michigan’s urban and Metropolitan Strat-
egy” (2012).
138. Susan Helper and Howard wial, “accelerating advanced Manufac-
turing with new research centers,” (washington: Brookings institu-
tion, 2011).
139. this idea draws directly from Helper and wial, “accelerating
advanced Manufacturing with new research centers.”

71Building from sTrengTh: creating opportunity in greater Baltimore’s next economy | endnotes
140. ibid. See also www.ccat.us/, www.rit.edu/gis/research-centers/cims/,
and www.fraunhofer.de/en/about-fraunhofer.html.
141. the Brookings institution, “innovation Meets Demonstration: a
prospectus for catalyzing growth in the puget Sound energy
efficiency technology cluster” (2011), available at www.brookings.
edu/~/media/files/rc/papers/2010/12_metro_business_muro/12_
metro_business_puget.pdf.
142. See, for example, James J. kemple, “career academies: long-term
impact on labor Market outcomes, educational attainment, and
transitions to adulthood” (new york: MDrc, 2008).
143. Matthew Zeidenberg, Sung-woo cho, and Davis Jenkins, “washing-
ton State’s integrated Basic education and Skills training program
(i-BeSt): new evidence of effectiveness” (new york: community
college research center, 2010).
144. See www.strivetogether.org/. See also kelly Bathgate, richard lee
colvin, and elena Shiva, “Striving for Student Success: a Model of
Shared accountability” (washington: eDucationSector, 2011).
145. personal communication from Brian o’Malley, Director of trans-
portation policy and research, central Maryland transportation
alliance, March 30, 2012.
146. anthony p. carnavale, “Help wanted: projections of Jobs and
education requirements through 2018” (washington: georgetown
university, 2010). See the State level analysis, available at
http://cew.georgetown.edu/jobs2018/states/.
147. Blueprint Maryland, “Maryland’s Business climate and Vulnerability
to federal Downsizing” (2011); Jay Hancock, “Budget Deal Marks
end of Maryland’s federal Spree” Baltimore Sun, august 1, 2011.
Jamie Smith Hopkins, “Defense Belt-tightening costing Maryland
Jobs” Baltimore Sun, May 18, 2011.
148. John kania and Mark kramer, “collective impact” Stanford Social
Innovation Review, winter 2011.


pHotograpHy: © corBiS; getty iMageS; iStockpHoto; Veer

telephone 202.797.6139
fax 202.797.2965
web site www.brookings.edu/metro