Embed Size (px)
Citation preview

Building Material Shortages: Joint
Results from Home Builder and
Lumber Dealer Surveys
June 2013
1
In May of 2013, the National Association of Home Builders (NAHB) and National Lumber and Building
Material Dealers Association (NLBMDA) undertook a joint effort to survey their respective members on
building material shortages and prices.
The NAHB survey took the form of special questions appended to the monthly survey that serves as
the basis for the NAHB/Wells Fargo Housing Market Index (HMI). The HMI survey is sent to a panel of
builders primarily to gauge the overall strength of the single-family housing market, but also often
includes a set of special questions on a topic of current interest to the housing industry. Since 1994 the
survey has periodically included special questions on the availability of building materials. In 2011
these material questions were expanded to cover price changes over the past six months, and the
expanded questions were the ones included on the May 2013 questionnaire.
In that same month, NLBMDA partnered with NAHB to conduct a similar survey of NLBMDA members.
To the extent possible given the nature of the businesses, the questions on the NLBMDA survey were
the same as those on the NAHB survey. NLBMDA’s members operate single or multiple lumber yards
and component plants serving the residential construction industry, so they deal in many of the same
products single-family builders purchase, but are one step upstream in the distribution channel.
Survey data were collected from both NAHB builders and NLBMDA dealers during the first half of May.
Over that approximately two-week span, 383 builders and 230 dealers provided responses.
Highlights of the results include the following:
Reflecting the modest recovery in the housing industry, lumber and building material dealers
reported an average 6.9 percent increase in the volume of their sales over the past six months
(Exhibit 1).
As a class, the lumber dealers handle all of the 24 products purchased by single family builders
that were covered in the two surveys.
Dealers are much more likely to handle some products than others. For example, 95 to 96
percent of them handle framing lumber, OSB and plywood; but only 12 percent handle HVAC
equipment (Exhibit 2).
Among builders, the highest incidence of shortages was for OSB (with 22 percent of builders
reporting shortages), followed by gypsum wall board (20 percent), framing lumber (18 percent)
and plywood (also 18 percent).
Except for wall board, the incidence of shortages for these products was higher among dealers,
with 27 to 28 percent reporting shortages of OSB and plywood, and 36 percent reporting a
shortage of framing lumber (Exhibit 3). Dealers are a step upstream in the distribution channel,
so this may reflect advance knowledge of shortages before they are experienced by home
builders.
For most of the 24 products and materials covered by the survey, the share of builders reporting
a shortage was much higher in May of 2013 than it was in 2011 or 2012. The only exceptions
were copper wire, vinyl siding, HVAC, insulation, and SIPs (Exhibit 8).

2
For example, the share of builders reporting a shortage of framing lumber jumped from 3 to 4
percent in 2011 and 2012 to 18 percent in May of 2013 (Exhibit 4). The share had been as high
as 24 percent in October of 2004, but starts at that time were over 2 million.
Similarly, the share of builders reporting a shortage of gypsum wall board increased from 6
percent in 2011 to 11 percent in 2012 and 20 percent in May of 2013 (Exhibit 5). The share had
been as high as 34 percent in May of 2006, but starts were near 2 million at that time.
The share of builders reporting a shortage of OSB jumped from 3 to 4 percent in 2011 and 2012
to 22 percent in May of 2013 (Exhibit 6). The share had been as high as 52 percent in October
of 2003, when starts were 1.9 million.
The share of builders reporting a shortage of plywood jumped from 2 to 3 percent in 2011 and
2012 to 18 percent in May of 2013 (Exhibit 7). The share had been as high as 39 percent in
October of 2003.
The increase in the incidence of shortages in May of 2013 is surprising at this early stage of
the housing recovery, with total housing starts just now edging up to a rate of million a year—
about the level of starts in the industry’s worst post-war recession before 2008.
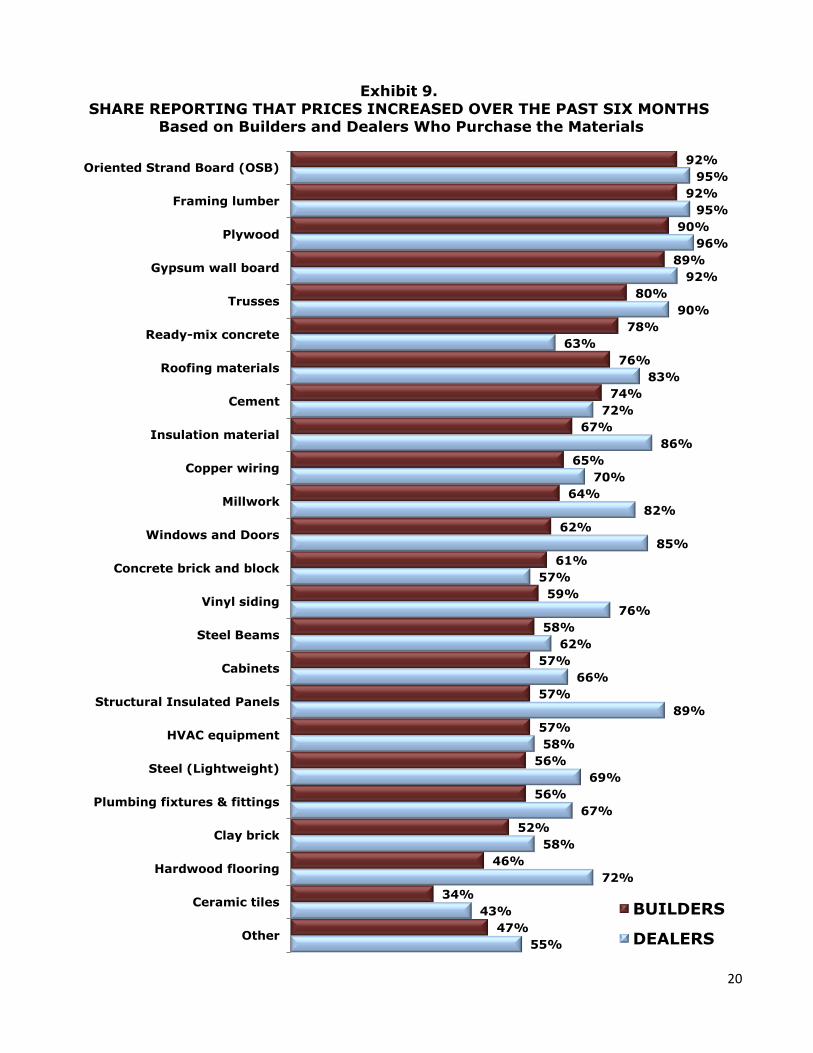
Ninety to 92 percent of single-family builders reported that prices of OSB, framing lumber and
plywood had increased. The percentages were even higher (95 to 96) among the lumber and
building material dealers.
With the exception of 3 concrete-related products, a larger share of lumber dealers than builders
reported price increases (Exhibit 9).
On average, builders reported a 5.17 percent increase in the materials that go into a house over
the past six months. For the lumber dealers, an average couldn’t be calculated, because most
of them checked the upper ended category “10 percent or more” (Exhibit 10).
The greater average price increase reported by the lumber dealers could in part reflect advance
knowledge by businesses upstream in the distribution channel, but it is also likely a result of the
product mix differences shown in Exhibit 2.
In May of 2013, the share of builders reporting that prices had increased over the past 6 months
was higher than in either 2011 or 2012 for every building product or material, except vinyl siding,
roofing, and cooper wiring (Exhibit 11).
These results are discussed in more detail in the subsequent section. Following that, Appendix IA
shows detailed tables for single-family builders who responded to NAHB’s May 2013 survey, with
results broken down by region of the country and number of units started. Appendix IB shows detailed
tables for the lumber and building material dealers who responded to NLBMDA’s May 2013 survey, with
results broken down by gross sales volume. Appendix II reproduces the questionnaires used in the two
surveys.

3
Increase in Market Activity
In response to questions about the total volume of their sales, 21 percent of NLBMDA members said
sales had stayed about the same of the past 6 months, 16 percent said sales had increased at least 10
but less than 15 percent, and 15 percent said sales had increased at least 5 but less than 10 percent
(Exhibit 1). On average across all lumber and building material dealers responding to the survey, sales
over the past six months increased 6.9 percent.
*Calculated assuming the midpoint of each category, with the highest and lowest values restricted to
stay within the top and bottom 15 percent of the observations, a procedure called “Winsorizing” that is
designed to limit the influence of extreme values. Because Winsorizing uses more of the information
available in the data, statisticians generally consider it preferable to the median for this purpose.
This reflects a general increase in home building activity over that same period, as the housing industry
is in the process of recovering from a historic trough. The monthly starts series has been volatile,
especially in the last months before the builder and lumber dealer surveys were conducted, but the
number of units under construction at any one time (which is probably a better indication of demand for
building materials than starts) has been rising consistently every month.
In October of 2012, the seasonally adjusted number of housing units under construction was 520,000.
In April of 2013 it was 605,000—a 16 percent increase. This is above the average increase in sales
reported by lumber dealers in general, although the larger dealers seem to have done somewhat better.
The average increase in sales over the past six months was 10.9 percent for dealers with $10 to $20
million in annual gross revenue and 12.8 percent for those with over $30 million (Appendix IB).
14%
21%
14%
15%
16%
6%
6%
8%
Declined
Stayed about the same
Increased by less than 5%
Increased 5% to 10%
Increased 10% to 15%
Increased 15% to 20%
Increased 20% to 30%
Increased 30% or more
Exhibit 1. CHANGE IN SALES VOLUME FOR LUMBER DEALERS PAST SIX MONTHS
Average=6.9%*

4
Evidence of Shortages
Before investigating shortages for particular building products and materials, it’s necessary to consider
the mix of products purchased by home builders and lumber dealers. Both the builder and dealer
surveys asked about the same 24 distinct categories of products. Three quarters of these products are
purchased by the vast majority (over 80 percent) of single-family builders. Not surprisingly, virtually all
builders reported buying products such as roofing materials, wall board, windows and doors, and
framing lumber (Exhibit 2).
Many of these products are bought and sold by the vast majority lumber dealers as well. For example,
95 to 96 percent of lumber dealers purchase framing lumber, OSB and plywood. Considered as a
class, lumber dealers sell all 24 building products covered in the survey, but some products are sold by
a relatively small share. The leading example is HVAC equipment—a product line for only 12 percent
of the dealers.
These results are consistent with a recent NAHB survey that asked builders about where they go to buy
various products. Over 80 percent of single-family builders said they usually buy sawn lumber, plywood
and OSB from lumber yards, but only 1 percent cited lumber yards as the main source for HVAC
equipment. (See the HousingEconomics.com Special Study for November 2012 “Buying Products for
Home Building & Remodeling: Who and Where” for the complete breakdown.)
Exhibit 3 shows the shares of home builders and lumber dealers who reported shortages of each of the
24 building products, based only on the builders and dealers who actually purchase these products.
The percentages in the exhibit are builders and dealers who reported either “some” or a “serious”
shortage for a particular product. Relatively few respondents classified any of the shortages as serious
(see Exhibit 8, Appendix IA and Appendix IB for separate some/serious percentages).
For the home builders’ perspective, shortages of OSB are the most widespread of any building material
(with 22 percent of builders reporting some or serious shortages), followed by gypsum wall board (20
percent), framing lumber (18 percent) and plywood (also 18 percent).
A smaller share of lumber dealers reported a shortage of wall board, but 27 to 28 percent of the dealers
reported shortages of OSB and plywood—and 36 percent reported a shortage of framing lumber.
These numbers are higher than the share of builders reporting shortages of any product or material.
Substantial numbers of lumber dealers also reported shortages of roofing material and millwork—29
and 21 percent, respectively, much higher than the share of home builders who were experiencing a
shortage of these items.
Shortage is a relative term, and we have no history on how the building material dealers reacted to past
cycles. So it’s unclear whether they are actually experiencing worse shortages than builders, reacting
to the shortages that do exist with greater concern, or witnessing trends earlier because they are
upstream in the distribution channel.

5
14%
24%
35%
30%
57%
25%
57%
82%
58%
95%
37%
96%
58%
50%
12%
56%
40%
25%
85%
95%
92%
90%
86%
80%
61%
32%
37%
62%
66%
74%
83%
87%
88%
89%
93%
95%
95%
96%
96%
97%
97%
97%
98%
99%
99%
99%
99%
99%
Other
Structural Insulated Panels
Steel (Lightweight)
Steel Beams
Vinyl siding
Clay brick
Concrete brick and block
Trusses
Cement
Plywood
Copper wiring
Orient Strand Board (OSB)
Ready-mix concrete
Hardwood flooring
HVAC equipment
Cabinets
Plumbing fixtures & fittings
Ceramic Tiles
Insulation material
Framing lumber
Windows and Doors
Millwork
Gypsum wall board
Roofing materials
BUILDERS
DEALERS
Exhibit 2. SHARE WHO PURCHASE VARIOUS MATERIALS

6
17%
0%
2%
2%
2%
2%
3%
4%
9%
1%
4%
4%
10%
21%
4%
9%
4%
29%
5%
10%
27%
36%
12%
28%
11%
3%
4%
5%
6%
6%
6%
6%
6%
7%
7%
8%
8%
8%
9%
9%
10%
12%
13%
14%
18%
18%
20%
22%
Other
HVAC equipment
Vinyl siding
Cement
Ceramic Tiles
Plumbing fixtures & fittings
Steel Beams
Copper wiring
Insulation material
Ready-mix concrete
Concrete brick and block
Steel (Lightweight)
Hardwood flooring
Millwork
Cabinets
Windows and Doors
Structural Insulated Panels
Roofing materials
Clay brick
Trusses
Plywood
Framing lumber
Gypsum wall board
Orient Strand Board (OSB)
BUILDERS
DEALERS
Exhibit 3. SHARE REPORTING A SHORTAGE (EITHER SERIOUS OR SOME)
Based on Builders and Dealers Who Purchase the Materials

7
The Shortages in Historical Perspective
As mentioned in the introduction, the HMI has included questions on building materials for over
a decade, so history is available on shortages reported by builders. Between May 2006 and
June of 2011, the home building industry was either in severe decline or lying near the bottom
of a historically low trough, so material shortages were not an issue that needed to be
addressed in the survey. In June 2011 the questions on building materials were revised
slightly, primarily by expanding the list to include 24 distinct products, and the revised versions
of the questions were repeated in April of 2012 and, most recently, in May of 2013.
In 2011 and 2012, the residential construction industry had not recovered very far yet, and,
where the data were comparable, the share of builders reporting shortages was near historic
lows. But in May of 2013 a modest housing recovery was under way, and the share of builders
reporting a shortage in most cases rose substantially above the 2001-2012 levels. The only
exceptions were copper wire and vinyl siding (availability of which improved modestly since
2011), HVAC and insulation materials (which stayed about the same), and structural insulated
panels (availability of which was worse in 2013 than in 2012, but about the same as in 2011).
The increase in the incidence of shortages reported by builders was strongest in gypsum wall
board and various lumber categories. Over the longer term, shortages of these materials have
at times been more widespread, but the current shortages are surprisingly at this early stage of
the housing recovery. Total housing starts are just now edging up to a rate of million a year,
about the level of starts in the industry’s worst post-war recession before 2008.
Exhibit 4 compares the percentage of builders reporting a shortage of framing lumber to the
seasonally adjusted annual rate of housing starts since 2001. The share reporting a shortage
jumped from 3 to 4 percent in 2011 and 2012 to 18 percent in May of 2013. The share had
been as high as 24 percent in October of 2004, when starts were over 2 million. So 18 percent
is a surprisingly high incidence of shortages given the current starts rate of under 1 million. In
comparison, 36 percent of lumber dealers reported a shortage of framing lumber in May of
2013.
Exhibit 5 compares the percentage of builders reporting a shortage of gypsum wall board to
the seasonally adjusted annual rate of housing starts since 2001. The share reporting a
shortage increased from 6 percent in 2011 to 11 percent in 2012 and 20 percent in May of
2013. The share had been as high as 34 percent in May of 2006, when starts were near 2
million. So 20 percent is a surprisingly high incidence of shortage given the current starts rate
of under 1 million. In comparison, only 12 of lumber dealers reported a shortage of wall board
in May of 2013.

8
0
0.05
0.1
0.15
0.2
0.25
0
500
1,000
1,500
2,000
20
01
20
02
20
03
20
04
20
05
20
06
20
07
20
08
20
09
20
10
20
11
20
12
20
13
Shortage Starts
Exhibit 4. HOUSING STARTS (AREA) AND
FRAMING LUMBER SHORTAGE (BARS)
0
0.05
0.1
0.15
0.2
0.25
0.3
0
500
1,000
1,500
2,000
20
01
20
02
20
03
20
04
20
05
20
06
20
07
20
08
20
09
20
10
20
11
20
12
20
13
Shortage Starts
Exhibit 5. HOUSING STARTS (AREA) AND
GYPSUM WALLBOARD SHORTAGE (BARS)

9
Exhibit 6 compares the percentage of builders reporting a shortage of OSB to the seasonally
adjusted annual rate of housing starts since 2001. The share reporting a shortage jumped
from 3 to 4 percent in 2011 and 2012 to 22 percent in May of 2013. The share had been as
high as 52 percent in October of 2003, when starts were 1.9 million. So a surge to 22 percent
is surprising given the current starts rate of under 1 million. In comparison, 28 of lumber
dealers reported a shortage of OSB in May of 2013.
Exhibit 7 compares the percentage of builders reporting a shortage of plywood to the
seasonally adjusted annual rate of housing starts since 2001. The share reporting a shortage
jumped from 2 to 3 percent in 2011 and 2012 to 18 percent in May of 2013. The share had
been as high as 39 percent in October of 2003, when starts were 1.9 million. So 18 percent is
a surprisingly high incidence of shortages given the current starts rate of under 1 million. In
comparison, 27 of lumber dealers reported a shortage of plywood in May of 2013.
Exhibit 8 shows the complete history of responses to the HMI question on shortages of
building materials.

10
0
0.1
0.2
0.3
0.4
0
500
1,000
1,500
2,000
20
01
20
02
20
03
20
04
20
05
20
06
20
07
20
08
20
09
20
10
20
11
20
12
20
13
Shortage Starts
Exhibit 7. HOUSING STARTS (AREA) AND
PLYWOOD SHORTAGE (BARS)
0
0.1
0.2
0.3
0.4
0.5
0
500
1,000
1,500
2,000
20
01
20
02
20
03
20
04
20
05
20
06
20
07
20
08
20
09
20
10
20
11
20
12
20
13
Shortage Starts
Exhibit 6. HOUSING STARTS (AREA) AND
OSB SHORTAGE (BARS)

11
Exhibit 8. Current Availability of Materials – HISTORY (Percent of Respondents)
No
Shortage
Some
Shortage
Serious
Shortage
Cement/Ready-mix concrete+
May-13 94% 6% 0%
Apr-12 98% 2% 0%
Jun-11 97% 3% 0%
May-06 75% 23% 1%
Nov-05 68% 28% 4%
Oct-05 64% 29% 7%
Jul-05 71% 25% 5%
Jan-05 71% 24% 4%
Oct-04 61% 34% 4%
Jul-04 59% 34% 7%
May-04 88% 8% 3%
Mar-04 96% 3% 0%
Oct-03 98% 2% 0%
Oct-02 98% 2% 0%
Jun-01 96% 4% 0%
Jul-00 89% 11% 0%
Jan-00 90% 10% 0%
Mar-99 87% 13% 0%
Jun-98 86% 10% 4%
Dec-96 90% 8% 2%
Sep-94 90% 8% 2%
Ready-mix concrete
May-13 93% 7% 0%
Apr-12 97% 3% 0%
Jun-11 98% 2% 0%
Jul-05 70% 26% 3%
Jan-05 73% 24% 3%

12
Exhibit 8. Current Availability of Materials – HISTORY (continued) (Percent of Respondents)
No
Shortage
Some
Shortage
Serious
Shortage
Concrete brick and block
May-13 94% 6% 0%
Apr-12 96% 4% 0%
Jun-11 96% 2% 0%
May-06 83% 16% 1%
Nov-05 75% 23% 2%
Oct-05 73% 24% 5%
Jul-05 80% 18% 2%
Jan-05 80% 15% 6%
Oct-04 73% 23% 6%
Jul-04 75% 20% 4%
May-04 88% 10% 2%
Mar-04 93% 7% 0%
Oct-03 96% 4% 0%
Oct-02 96% 4% 0%
Jun-01 88% 12% 0%
Jul-00 76% 20% 5%
Jan-00 80% 18% 2%
Mar-99 91% 8% 1%
Jun-98 92% 6% 2%
Clay brick
May-13 86% 14% 0%
Apr-12 95% 5% 0%
Jun-11 96% 4% 0%
May-06 74% 21% 5%
Nov-05 71% 25% 4%
Oct-05 72% 21% 6%
Jul-05 70% 27% 4%
Jan-05 70% 25% 5%
Oct-04 59% 33% 8%
Jul-04 63% 30% 7%
May-04 77% 20% 2%
Mar-04 77% 22% 1%
Oct-03 91% 9% 0%
Oct-02 88% 12% 0%
Jun-01 69% 27% 4%
Jul-00 50% 34% 16%
Jan-00 40% 39% 21%
Mar-99 77% 20% 3%
Jun-98 87% 12% 1%

13
Exhibit 8. Current Availability of Materials – HISTORY (continued) (Percent of Respondents)
No
Shortage
Some
Shortage
Serious
Shortage
Vinyl siding
May-13 97% 3% 0%
Apr-12 96% 3% 0%
Jun-11 94% 4% 0%
Insulation material
May-13 95% 6% 0%
Apr-12 95% 5% 0%
Jun-11 94% 5% 0%
May-06 80% 18% 2%
Nov-05 87% 12% 1%
Oct-05 86% 13% 1%
Jul-05 90% 10% 0%
Jan-05 86% 13% 0%
Oct-04 80% 19% 2%
Jul-04 80% 19% 1%
May-04 87% 12% 0%
Mar-04 89% 10% 0%
Oct-03 96% 3% 1%
Oct-02 94% 6% 0%
Jun-01 98% 2% 0%
Jul-00 80% 20% 0%
Jan-00 61% 37% 1%
Mar-99 58% 34% 7%
Jun-98 88% 10% 2%
Structural Insulated Panels (SIP)
May-13 91% 9% 0%
Apr-12 97% 3% 0%
Jun-11 91% 9% 0%
May-06 92% 8% 0%
Nov-05 94% 3% 0%
Oct-05 91% 9% 0%
Oct-04 87% 8% 5%
Jul-04 89% 8% 3%
May-04 88% 7% 5%
Mar-04 95% 5% 3%

14
Exhibit 8. Current Availability of Materials – HISTORY (continued) (Percent of Respondents)
No
Shortage
Some
Shortage
Serious
Shortage
Steel (Lightweight for framing)
May-13 92% 8% 0%
Apr-12 95% 7% 0%
Jun-11 93% 7% 2%
May-06 93% 5% 0%
Nov-05 79% 19% 2%
Oct-05 87% 10% 3%
Oct-04 71% 24% 5%
Jul-04 74% 19% 5%
May-04 68% 25% 8%
Mar-04 86% 13% 2%
Steel Beams
May-13 94% 6% 0%
Apr-12 96% 4% 0%
Jun-11 95% 5% 2%
May-06 91% 9% 0%
Nov-05 88% 10% 1%
Oct-05 90% 9% 1%
Oct-04 79% 16% 4%
Jul-04 81% 18% 1%
May-04 76% 20% 4%
Mar-04 86% 10% 4%
Trusses
May-13 86% 13% 1%
Apr-12 98% 2% 0%
Jun-11 97% 2% 0%
May-06 94% 6% 0%
Nov-05 93% 7% 0%
Oct-05 88% 11% 1%
Jul-05 95% 4% 0%
Jan-05 92% 7% 0%
Oct-04 86% 12% 2%
Jul-04 90% 9% 0%
May-04 92% 7% 0%
Mar-04 93% 5% 0%

15
Exhibit 8. Current Availability of Materials – HISTORY (continued) (Percent of Respondents)
No
Shortage Some
Shortage Serious
Shortage
Framing lumber
May-13 82% 16% 2% Apr-12 97% 3% 0% Jun-11 96% 4% 0%
May-06 95% 5% 0% Nov-05 88% 11% 1%
Oct-05 80% 18% 2% Jul-05 95% 5% 0% Jan-05 88% 12% 0%
Oct-04 76% 23% 1% Jul-04 84% 13% 2%
May-04 81% 17% 2% Mar-04 79% 20% 1% Oct-03 84% 14% 2%
Oct-02 99% 1% 0% Jun-01 96% 4% 0%
Jul-00 92% 8% 0% Jan-00 90% 9% 1% Mar-99 90% 9% 1%
Jun-98 93% 7% 0% Dec-96 78% 21% 1%
Sep-94 81% 18% 1%
Gypsum wall board
May-13 80% 18% 2% Apr-12 89% 11% 0%
Jun-11 94% 6% 0% May-06 66% 29% 5% Nov-05 71% 26% 3%
Oct-05 73% 23% 3% Jul-05 78% 21% 1%
Jan-05 83% 16% 1% Oct-04 73% 25% 1% Jul-04 75% 24% 1%
May-04 81% 17% 2% Mar-04 83% 16% 0%
Oct-03 89% 11% 0% Oct-02 92% 8% 0% Jun-01 91% 9% 0%
Jul-00 72% 26% 2% Jan-00 31% 61% 8%
Mar-99 40% 41% 18% Jun-98 84% 15% 1% Dec-96 73% 23% 3%
Sep-94 76% 23% 1%

16
Exhibit 8. Current Availability of Materials – HISTORY (continued) (Percent of Respondents)
No
Shortage
Some
Shortage
Serious
Shortage
Orient Strand Board (OSB)
May-13 78% 19% 3%
Apr-12 96% 4% 0%
Jun-11 97% 3% 0%
May-06 89% 11% 1%
Nov-05 73% 25% 2%
Oct-05 68% 26% 6%
Jul-05 91% 9% 0%
Jan-05 77% 22% 0%
Oct-04 63% 33% 3%
Jul-04 69% 26% 5%
May-04 70% 22% 7%
Mar-04 55% 40% 6%
Oct-03 47% 37% 15%
Oct-02 98% 2% 0%
Jun-01 97% 3% 0%
Plywood
May-13 81% 16% 2%
Apr-12 97% 3% 0%
Jun-11 98% 2% 0%
May-06 89% 10% 0%
Nov-05 76% 21% 2%
Oct-05 71% 23% 5%
Jul-05 90% 10% 0%
Jan-05 82% 16% 1%
Oct-04 69% 29% 2%
Jul-04 76% 22% 3%
May-04 72% 22% 7%
Mar-04 63% 33% 4%
Oct-03 61% 29% 10%
Oct-02 98% 2% 0%
Jun-01 96% 4% 0%
Jan-00# 90% 10% 0%
Cabinets
May-13 91% 7% 1%
Apr-12 97% 3% 0%
Jun-11 98% 2% 0%

17
Exhibit 8. Current Availability of Materials – HISTORY (continued) (Percent of Respondents)
No
Shortage Some
Shortage Serious
Shortage
Millwork
May-13 92% 8% 0% Apr-12 97% 3% 0% Jun-11 95% 4% 0%
Windows and Doors
May-13 91% 9% 0%
Apr-12 98% 2% 0% Jun-11 96% 4% 0%
May-06 93% 6% 1% Nov-05 94% 5% 1%
Oct-05 93% 5% 1% Jul-05 95% 4% 0% Jan-05 95% 6% 0%
Oct-04 93% 7% 0% Jul-04 96% 4% 0%
May-04 96% 3% 0% Mar-04 96% 3% 0% Oct-03 97% 2% 1%
Oct-02 98% 2% 0% Jun-01 96% 4% 0%
Jul-00 90% 10% 0%
Hardwood flooring
May-13 94% 6% 1% Apr-12 97% 3% 0%
Jun-11 99% 1% 0%
Ceramic Tiles
May-13 95% 5% 1% Apr-12 94% 5% 0% Jun-11 96% 3% 1%
Roofing materials
May-13 88% 11% 1% Apr-12 91% 8% 1% Jun-11 89% 10% 1%
May-06 81% 17% 2% Nov-05 78% 19% 2%
Oct-05 75% 18% 6% Jul-05 81% 14% 5% Jan-05 81% 14% 6%
Oct-04 79% 19% 3% Jul-04 88% 10% 1%
May-04 90% 9% 1% Mar-04 91% 9% 0% Oct-03 95% 4% 1%

18
Exhibit 8. Current Availability of Materials – HISTORY (continued) (Percent of Respondents)
No
Shortage Some
Shortage Serious
Shortage
Roofing materials - continued
Oct-02 96% 4% 0% Jun-01 95% 5% 0% Jul-00 89% 10% 0%
Jan-00 88% 12% 0% Mar-99 90% 9% 1%
Plumbing fixtures & fittings
May-13 94% 6% 0%
Apr-12 96% 3% 0%
Jun-11 97% 3% 0%
HVAC equipment
May-13 97% 3% 0%
Apr-12 98% 1% 0%
Jun-11 97% 2% 0%
Copper wiring
May-13 95% 4% 1%
Apr-12 93% 6% 0%
Jun-11 90% 9% 1%
Notes: (+) Prior to Jan. '05 Cement and ready-mix concrete were combined.
(#) Plywood/OSB.

19
Price Changes
For the same 24 categories of building products and materials, the two surveys also asked if prices
over the past 6 months had increased, declined, or remained unchanged. In May of 2013, very few
respondents reported that prices for any product or material had declined recently (Appendix IA and
IB).
Exhibit 9 shows the share who reported prices had increased (again, based on home builders and
lumber dealers who purchased the products). Ninety to 92 percent of single-family builders reported
that prices of OSB, framing lumber and plywood had increased. The percentages were even higher (95
to 96) among the lumber and building material dealers. With the exception of the 3 concrete-related
products (cement, ready-mix concrete and concrete brick and block), more lumber dealers than
builders reported price increases. The dealer-builder differences were particularly strong for insulation
materials, millwork, windows and doors, vinyl siding, SIPs, and hardwood flooring. Note that, in most of
these cases, the vast majority of lumber and building material dealers were reporting price increases
even though relatively few of them were reporting shortages for the same materials.
That still leaves the question of how quickly prices are rising. To get a rough idea, the two surveys
asked over the past six month how prices had changed overall, either for materials that go into a house
(for home builders) or for all products sold (for lumber and building material dealers). On average
builders reported a 5.17 percent increase in the materials that go into a house over the past six months.
For the lumber dealers, an average couldn’t be calculated, because most of them checked the upper
ended category “10 percent or more” (Exhibit 10).
The greater average price increase reported by the lumber dealers could in part reflect advance
knowledge by businesses in the distribution channel, but it is likely also a result of the product mix
differences shown in Exhibit 2. Lumber dealers tend to be engaged in selling products like OSB,
framing lumber, plywood and wallboard, where the incidence of shortages and price increases are
disproportionately high.
Limited history on price changes is available from the HMI survey of single-family builders (Exhibit 11).
The 24-item price question was asked in its current form in June of 2011 and April of 2012. In May of
2013, the share of builders reporting that prices had increased over the past 6 months was higher than
in either 2011 or 2012 for every building product or material, except vinyl siding, roofing, and cooper
wiring.
20
55%
43%
72%
58%
67%
69%
58%
89%
66%
62%
76%
57%
85%
82%
70%
86%
72%
83%
63%
90%
92%
96%
95%
95%
47%
34%
46%
52%
56%
56%
57%
57%
57%
58%
59%
61%
62%
64%
65%
67%
74%
76%
78%
80%
89%
90%
92%
92%
Other
Ceramic tiles
Hardwood flooring
Clay brick
Plumbing fixtures & fittings
Steel (Lightweight)
HVAC equipment
Structural Insulated Panels
Cabinets
Steel Beams
Vinyl siding
Concrete brick and block
Windows and Doors
Millwork
Copper wiring
Insulation material
Cement
Roofing materials
Ready-mix concrete
Trusses
Gypsum wall board
Plywood
Framing lumber
Oriented Strand Board (OSB)
BUILDERS
DEALERS
Exhibit 9.
SHARE REPORTING THAT PRICES INCREASED OVER THE PAST SIX MONTHS Based on Builders and Dealers Who Purchase the Materials

21
*Calculated assuming the midpoint of each category, with the highest and lowest values restricted to
stay within the top and bottom 18 percent of the observations, a procedure called “Winsorizing” (see
footnote to Exhibit 2).
0%
3%
10%
30%
26%
13%
5%
14%
0%
1%
1%
9%
15%
12%
7%
54%
Decreased
Stayed about the same
Increased less than 2%
Increased 2% to 4%
Increased 4% to 6%
Increased 6% to 8%
Increased 8% to 10%
Increased 10% or more
Exhibit 10.
OVERALL CHANGE IN MATERIAL PRICES PAST 6 MONTHS For Same House/Across All Products Sold
BUILDERS
DEALERS
Average Increase:
BUILDERS=5.17%*
DEALERS= Over 10%

22
Exhibit 11. Change in prices now vs. 6 months ago – HISTORY
(Percent of Respondents)
Based on builders who purchase the materials only
June 2011 April 2012 May 2013
Cement
Increased 60 67 74
Decreased 3 1 0
No change 37 33 26
Ready-mix concrete
Increased 64 70 78
Decreased 5 1 0
No change 31 29 22
Concrete brick and block
Increased 42 51 61 Decreased 2 1 0 No change 56 48 39
Clay brick
Increased 35 35 52 Decreased 2 3 0 No change 63 61 48
Vinyl siding
Increased 62 60 59 Decreased 2 1 0 No change 37 38 41
Insulation material
Increased 49 59 67 Decreased 3 1 1 No change 48 40 32
Structural Insulated Panels
Increased 42 40 57 Decreased 4 1 0 No change 54 59 43
Steel (Lightweight)
Increased 53 45 56 Decreased 1 2 0 No change 46 53 44
Steel Beams
Increased 56 55 58 Decreased 2 2 1 No change 42 43 41
Trusses
Increased 37 51 80 Decreased 8 5 1 No change 55 44 19

23
Exhibit 11. Change in prices now vs. 6 months ago – HISTORY (continued)
(Percent of Respondents)
June 2011 April 2012 May 2013
Framing lumber
Increased 43 58 92
Decreased 18 6 1
No change 39 36 8
Gypsum wall board
Increased 56 79 89
Decreased 5 3 1
No change 40 19 10
Oriented Strand Board (OSB)
Increased 41 61 92
Decreased 12 4 0
No change 47 35 8
Plywood
Increased 45 62 90
Decreased 10 3 1
No change 45 34 10
Cabinets
Increased 32 40 57
Decreased 5 4 2
No change 63 57 41
Millwork
Increased 35 43 64
Decreased 4 4 1
No change 61 53 35
Windows and Doors
Increased 47 51 62
Decreased 5 3 1
No change 48 46 37
Hardwood flooring
Increased 28 30 46
Decreased 6 6 3
No change 66 64 51
Ceramic tiles
Increased 24 26 34
Decreased 4 6 4
No change 71 68 62

24
Exhibit 11. Change in prices now vs. 6 months ago – HISTORY (continued)
(Percent of Respondents)
June 2011 April 2012 May 2013
Roofing materials
Increased 76 77 76 Decreased 3 4 2
No change 21 19 22
Plumbing fixtures & fittings
Increased 47 49 56
Decreased 2 4 2 No change 52 47 42
HVAC equipment
Increased 49 54 57
Decreased 3 4 3
No change 48 42 40
Copper wiring
Increased 72 69 65 Decreased 1 3 4
No change 26 28 32
Other
Increased 36 30 47
Decreased 5 0 5 No change 59 70 49

25
Appendix IA:
Detailed Tables from the Builders Survey

26
Q1. Current Availability of Materials : WITHOUT DO NOT PURCHASE
(Percent of Respondents)
Total Region
No. of For-Sale Units Started
in 2012
NE MW S W <25 25-99 100+
Cement
No shortage 95 100 99 92 94 95 97 80
Some shortage 5 1 8 6 5 3 20
Serious shortage
Responses 319 29 75 161 54 247 35 20
Ready-mix concrete
No shortage 93 100 97 89 92 93 95 80
Some shortage 7 3 11 8 7 5 20
Serious shortage
Responses 348 33 79 174 62 269 39 20
Concrete brick & block
No shortage 93 100 99 89 96 93 97 89
Some shortage 7 1 11 4 7 3 11
Serious shortage
Responses 303 26 68 160 49 239 32 18
Clay brick
No shortage 87 86 95 81 100 88 86 82
Some shortage 13 14 5 19 12 14 18
Serious shortage
Responses 265 21 64 152 28 205 29 17
Vinyl siding
No shortage 96 100 97 96 91 96 100 100
Some shortage 4 3 4 9 4
Serious shortage
Responses 239 31 68 118 22 189 24 12
Insulation material
No shortage 94 100 95 93 92 94 97 86
Some shortage 6 5 7 8 6 3 14
Serious shortage
Responses 355 34 80 178 63 273 39 22

27
Q1. Current Availability of Materials : WITHOUT DO NOT PURCHASE - continued
(Percent of Respondents)
Total Region
No. of For-Sale Units Started
in 2012
NE MW S W <25 25-99 100+
Structural Insulated
Panels (SIP)
No shortage 90 100 92 88 89 90 100 83
Some shortage 9 6 12 11 10 17
Serious shortage 1 3
Responses 115 10 36 50 19 88 14 6
Steel (Lightweight for
framing)
No shortage 92 100 94 93 85 92 100 100
Some shortage 8 6 7 15 8
Serious shortage
Responses 130 17 33 54 26 106 13 5
Steel Beams
No shortage 94 96 95 92 92 93 96 100
Some shortage 6 4 5 8 8 7 4
Serious shortage
Responses 219 28 63 92 36 172 26 12
Trusses
No shortage 86 90 91 85 83 89 75 85
Some shortage 13 10 9 13 17 10 25 15
Serious shortage 1 2 1
Responses 315 30 74 148 63 243 36 20
Framing lumber
No shortage 82 82 83 82 80 80 83 91
Some shortage 16 18 16 16 14 17 17 4
Serious shortage 2 1 2 6 3 4
Responses 362 34 82 182 64 276 42 23
Gypsum wall board
No shortage 80 81 82 76 87 79 90 83
Some shortage 18 19 17 21 10 18 10 13
Serious shortage 2 1 2 3 2 4
Responses 356 32 83 178 63 272 41 23

28
Q1. Current Availability of Materials : WITHOUT DO NOT PURCHASE - continued
(Percent of Respondents)
Total Region
No. of For-Sale Units
Started in 2012
NE MW S W <25 25-99 100+
Oriented Strand Board
(OSB)
No shortage 78 73 82 77 79 78 81 77
Some shortage 19 27 14 18 21 18 19 23
Serious shortage 3 4 5 4
Responses 346 33 78 173 62 263 42 22
Plywood
No shortage 82 76 86 83 75 82 78 84
Some shortage 16 24 11 13 25 15 22 16
Serious shortage 2 3 4 3
Responses 321 33 71 161 56 249 37 19
Cabinets
No shortage 91 97 96 87 94 93 93 74
Some shortage 8 3 4 11 6 6 8 22
Serious shortage 1 2 1 4
Responses 352 34 82 174 62 270 40 23
Millwork
No shortage 92 100 95 90 87 90 98 91
Some shortage 8 5 9 13 10 2 4
Serious shortage 0 1 4
Responses 359 33 83 182 61 275 41 23
Windows and Doors
No shortage 91 97 96 86 95 91 90 87
Some shortage 9 3 4 14 5 9 10 13
Serious shortage 0 1 0
Responses 361 34 82 183 62 276 42 23
Hardwood flooring
No shortage 93 97 94 93 90 93 95 91
Some shortage 7 3 6 7 8 7 5 5
Serious shortage 1 1 2 0 5
Responses 352 33 81 179 59 271 39 22

29
Q1. Current Availability of Materials : WITHOUT DO NOT PURCHASE - continued
(Percent of Respondents)
Total Region
No. of For-Sale Units Started in
2012
NE MW S W <25 25-99 100+
Ceramic tiles
No shortage 94 97 95 93 95 94 95 91
Some shortage 5 3 5 6 5 6 5 9
Serious shortage 1 1 1
Responses 350 33 77 179 61 269 39 23
Roofing materials
No shortage 88 97 88 84 94 87 95 83
Some shortage 11 3 12 14 5 12 5 13
Serious shortage 1 2 2 1 4
Responses 357 33 81 180 63 274 41 23
Plumbing fixtures &
fittings
No shortage 94 100 97 93 90 94 92 91
Some shortage 6 3 7 10 6 8 9
Serious shortage
Responses 349 33 78 175 63 271 39 22
HVAC equipment
No shortage 97 100 99 95 97 96 100 95
Some shortage 3 1 5 3 4 5
Serious shortage
Responses 349 33 79 177 60 270 39 22
Copper wiring
No shortage 95 100 96 93 93 95 95 95
Some shortage 5 4 5 7 4 5 5
Serious shortage 1 1 1
Responses 333 30 77 168 58 257 38 20
Other
No shortage 89 100 96 82 88 88 90 83
Some shortage 9 4 15 6 10 17
Serious shortage 2 3 6 1 10
Responses 89 6 27 39 17 68 10 6

30
Q1. Change in prices now vs. 6 months ago
(Percent of Respondents)
Total Region
No. of For-Sale Units Started
in 2012
NE MW S W <25 25-99 100+
Cement
Increased 74 69 71 76 76 74 76 84
Decreased
No change 26 31 29 24 24 26 24 16
Responses 301 26 70 156 49 232 34 19
Ready-mix concrete
Increased 78 77 74 79 78 76 76 100
Decreased
No change 22 23 26 21 22 24 24
Responses 327 31 73 165 58 252 37 20
Concrete brick and
block
Increased 61 59 54 61 69 61 53 65
Decreased 0 1 3
No change 39 41 46 38 31 39 43 35
Responses 272 22 59 149 42 214 30 17
Clay brick
Increased 52 65 44 54 48 54 33 44
Decreased 0 1 4
No change 48 35 56 45 52 46 63 56
Responses 236 17 57 137 25 180 27 16
Vinyl siding
Increased 59 79 65 55 35 60 48 50
Decreased 0 1 1
No change 41 21 35 45 65 39 52 50
Responses 221 28 63 110 20 174 23 12
Insulation material
Increased 67 67 64 65 75 67 57 73
Decreased 1 2 1
No change 32 33 36 33 25 32 43 27
Responses 327 30 76 164 57 250 37 22

31
Q1. Change in prices now vs. 6 months ago - continued
(Percent of Respondents)
Total Region
No. of For-Sale Units
Started in 2012
NE MW S W <25 25-99 100+
Structural Insulated
Panels (SIP)
Increased 57 50 52 68 44 57 30 83
Decreased
No change 43 50 48 33 56 43 70 17
Responses 93 6 31 40 16 72 10 6
Steel (Lightweight for
framing)
Increased 56 58 56 56 55 57 44 60
Decreased
No change 44 42 44 44 45 43 56 40
Responses 106 12 27 45 22 87 9 5
Steel Beams
Increased 58 60 60 54 66 61 46 64
Decreased 1 2 1 1 9
No change 41 40 38 45 34 38 54 27
Responses 195 25 58 80 32 151 24 11
Trusses
Increased 80 73 81 80 80 80 75 85
Decreased 1 1 1 0 3
No change 19 27 17 18 20 19 22 15
Responses 296 26 70 141 59 227 36 20
Framing lumber
Increased 92 91 91 91 95 91 93 96
Decreased 1 1 2 1 4
No change 8 9 9 8 3 8 7
Responses 346 32 77 177 60 262 42 23
Gypsum wall board
Increased 89 93 86 91 88 90 82 91
Decreased 1 2 1
No change 10 7 14 8 12 9 18 9
Responses 336 30 78 169 59 258 39 23

32
Q1. Change in prices now vs. 6 months ago – continued
(Percent of Respondents)
Total Region
No. of For-Sale Units Started in
2012
NE MW S W <25 25-99 100+
Oriented Strand Board
(OSB)
Increased 92 93 93 91 90 91 93 90
Decreased 0 2 5
No change 8 7 7 9 8 9 8 5
Responses 331 29 76 167 59 252 40 21
Plywood
Increased 90 93 91 88 92 90 91 94
Decreased 1 1 2 1
No change 9 7 9 11 6 10 9 6
Responses 298 28 67 153 50 231 35 18
Cabinets
Increased 57 67 54 58 55 59 49 45
Decreased 2 1 3 2
No change 41 33 45 39 45 39 51 55
Responses 328 27 76 165 60 251 39 22
Millwork
Increased 64 54 60 67 66 65 60 59
Decreased 1 1 1 1
No change 35 46 38 32 34 34 40 41
Responses 335 26 78 172 59 255 40 22
Windows and Doors
Increased 62 76 56 60 67 63 56 50
Decreased 1 1 2 2
No change 37 24 42 38 33 35 44 50
Responses 337 29 78 170 60 257 41 22
Hardwood flooring
Increased 46 45 47 46 47 50 36 25
Decreased 3 3 5 3 3
No change 51 55 50 49 53 47 61 75
Responses 322 29 74 166 53 249 36 20

33
Q1. Change in prices now vs. 6 months ago - continued
(Percent of Respondents)
Total Region
No. of For-Sale Units
Started in 2012
NE MW S W <25 25-99 100+
Ceramic tiles
Increased 34 36 35 33 37 36 22 27
Decreased 4 4 5 2 4 3
No change 62 64 61 62 61 60 76 73
Responses 324 28 72 167 57 248 37 22
Roofing materials
Increased 76 80 79 74 76 76 70 73
Decreased 2 1 3 2 3 9
No change 22 20 19 23 24 22 28 18
Responses 338 30 77 172 59 259 40 22
Plumbing fixtures &
fittings
Increased 56 48 56 54 65 57 54 43
Decreased 2 3 2 2 3
No change 42 52 41 43 35 42 43 57
Responses 325 29 73 166 57 252 37 21
HVAC equipment
Increased 57 55 56 59 52 58 47 48
Decreased 3 4 4 2 3 3
No change 40 45 40 37 46 38 50 52
Responses 323 29 72 166 56 250 36 21
Copper wiring
Increased 65 58 68 64 63 67 50 58
Decreased 4 4 5 2 4 6
No change 32 42 28 31 35 29 44 42
Responses 299 24 72 151 52 230 34 19
Other
Increased 47 0 46 50 40 43 50 50
Decreased 5 0 15 6
No change 49 0 38 50 60 51 50 50
Responses 43 0 13 20 10 35 2 4

34
Q2. Overall, how have total material costs for the same house changed over the past 6 months?
(Percent of respondents)
Total Region
No. of For-Sale Units Started
in 2012
NE MW S W <25 25-99 100+
Declined
Stayed about the same 2.67 2.86 1.18 4.28 3.15
Increased by less than 2% 9.60 20.00 14.12 5.88 8.82 9.79 6.82 8.70
Increased 2% to 3.99% 30.13 40.00 30.59 27.27 32.35 30.77 43.18 13.04
Increased 4% to 5.99% 25.87 28.57 23.53 27.27 23.53 24.83 22.73 47.83
Increased 6% to 7.99% 12.53 2.86 17.65 12.83 10.29 13.99 6.82 13.04
Increased 8% to 9.99% 5.07 4.71 5.35 7.35 4.20 11.36
Increased 10% or more 14.13 5.71 8.24 17.11 17.65 13.29 9.09 17.39
Average* 5.17 3.29 4.69 5.40 5.38 4.76 4.95 5.61
Responses 375 35 85 187 68 286 44 23
*Calculated assuming the midpoint of each category and Winsorizing 18 percent of the responses at the top and bottom.

35
Appendix IB:
Detailed Tables from the Lumber Dealers Survey

36
Q1. Current Availability of Materials : WITHOUT DO NOT PURCHASE
(Percent of Respondents)
Total Annual Gross Revenue
Under $10
million
$10 million to Over $30
million $30 million
Cement
No shortage 98 97 100 94
Some shortage 2 3 6
Responses 131 73 39 18
Ready-mix concrete
No shortage 99 100 97 100
Some shortage 1 3
Responses 131 78 34 18
Concrete brick and block
No shortage 96 95 100 94
Some shortage 4 5 6
Responses 127 73 37 16
Clay brick
No shortage 95 94 100 89
Some shortage 5 6 11
Responses 56 34 12 9
Vinyl siding
No shortage 98 96 100 100
Some shortage 2 4
Responses 128 69 37 20
Insulation material
No shortage 91 89 97 88
Some shortage 9 11 3 12
Responses 192 98 59 33
Structural Insulated Panels (SIP)
No shortage 96 96 95 100
Some shortage 4 4 5
Responses 53 26 19 8

37
Q1. Current Availability of Materials : WITHOUT DO NOT PURCHASE - continued
(Percent of Respondents)
Total Annual Gross Revenue
Under $10
million
$10 million to Over $30
million $30 million
Steel (Lightweight for framing)
No shortage 96 95 95 100
Some shortage 4 5 5
Responses 76 40 21 15
Steel Beams
No shortage 97 100 91 100
Some shortage 3 9
Responses 65 32 22 11
Trusses
No shortage 90 89 89 94
Some shortage 10 11 11 6
Responses 185 97 53 34
Framing lumber
No shortage 64 68 65 54
Some shortage 35 30 34 46
Serious shortage 1 2 2
Responses 217 110 65 41
Gypsum wall board
No shortage 88 91 90 76
Some shortage 12 9 10 24
Responses 197 102 60 34
Oriented Strand Board (OSB)
No shortage 71 72 65 83
Some shortage 27 27 32 18
Serious shortage 1 1 3
Responses 217 110 66 40

38
Q1. Current Availability of Materials : WITHOUT DO NOT PURCHASE - continued
(Percent of Respondents)
Total Annual Gross Revenue
Under $10
million
$10 million to Over $30
million $30 million
Plywood
No shortage 73 74 69 79
Some shortage 26 25 31 21
Serious shortage 1 2
Responses 217 110 68 38
Cabinets
No shortage 96 95 97 96
Some shortage 4 5 3 4
Responses 124 60 38 24
Millwork
No shortage 79 85 75 64
Some shortage 20 14 23 33
Serious shortage 1 1 2 3
Responses 206 107 61 36
Windows and Doors
No shortage 91 88 95 91
Some shortage 9 12 5 9
Responses 206 109 61 34
Hardwood flooring
No shortage 90 95 87 83
Some shortage 9 5 10 17
Serious shortage 1 3
Responses 112 58 30 23
Ceramic tiles
No shortage 98 100 100 91
Some shortage 2 9
Responses 54 28 15 11

39
Q1. Current Availability of Materials : WITHOUT DO NOT PURCHASE - continued
(Percent of Respondents)
Total Annual Gross Revenue
Under $10
million
$10 million to Over $30
million $30 million
Roofing materials
No shortage 70 68 75 66
Some shortage 28 30 25 31
Serious shortage 1 1 3
Responses 179 92 53 32
Plumbing fixtures & fittings
No shortage 98 98 95 100
Some shortage 2 2 5
Responses 87 53 20 14
HVAC equipment
No shortage 100 100 100 100
Responses 26 15 6 5
Copper wiring
No shortage 96 100 90 89
Some shortage 4 10 11
Responses 80 50 21 9
Other
No shortage 83 100 100 25
Some shortage 6 25
Serious shortage 11 50
Responses 18 10 4 4

40
Q1. Change in prices now vs. 6 months ago
(Percent of Respondents)
Total Annual Gross Revenue
Under $10
million
$10 million to Over $30
million $30 million
Cement
Increased 72 75 67 71
No change 28 25 33 29
Responses 125 71 36 17
Ready-mix concrete
Increased 63 70 48 65
Decreased 1 3
No change 36 30 48 35
Responses 120 69 33 17
Concrete brick and block
Increased 57 59 52 60
Decreased 1 3
No change 42 41 45 40
Responses 115 68 31 15
Clay brick
Increased 58 56 64 56
No change 42 44 36 44
Responses 53 32 11 9
Vinyl siding
Increased 76 75 74 82
Decreased 3 3 12
No change 20 22 26 6
Responses 118 65 34 17
Insulation material
Increased 86 87 85 83
Decreased 3 1 6 3
No change 11 12 9 13
Responses 175 91 53 30

41
Q1. Change in prices now vs. 6 months ago - continued
(Percent of Respondents)
Total Annual Gross Revenue
Under $10
million
$10 million to Over $30
million $30 million
Structural Insulated Panels (SIP)
Increased 89 91 88 86
No change 11 9 12 14
Responses 46 22 17 7
Steel (Lightweight for framing)
Increased 69 71 67 64
Decreased 6 14 7
No change 26 29 19 29
Responses 70 35 21 14
Steel Beams
Increased 62 58 63 70
Decreased 2 4
No change 37 38 38 30
Responses 52 26 16 10
Trusses
Increased 90 86 94 97
Decreased 1 2
No change 9 12 6 3
Responses 172 91 49 31
Framing lumber
Increased 95 92 98 95
Decreased 3 4 2 3
No change 2 4 3
Responses 205 104 61 39
Gypsum wall board
Increased 92 93 91 94
Decreased 1 2
No change 7 7 7 6
Responses 186 96 58 31

42
Q1. Change in prices now vs. 6 months ago - continued
(Percent of Respondents)
Total Annual Gross Revenue
Under $10
million
$10 million to Over $30
million $30 million
Oriented Strand Board (OSB)
Increased 95 93 97 97
Decreased 3 4 3 3
No change 1 3
Responses 208 105 63 39
Plywood
Increased 96 95 97 97
Decreased 3 3 3 3
No change 1 2
Responses 209 107 64 37
Cabinets
Increased 66 63 71 61
No change 34 37 29 39
Responses 116 57 34 23
Millwork
Increased 82 79 81 91
Decreased 2 2 2 3
No change 16 19 17 6
Responses 195 100 58 35
Windows and Doors
Increased 85 87 81 88
Decreased 2 3
No change 13 11 19 12
Responses 197 104 58 33
Hardwood flooring
Increased 72 66 69 89
No change 28 34 31 11
Responses 92 47 26 18

43
Q1. Change in prices now vs. 6 months ago - continued
(Percent of Respondents)
Total Annual Gross Revenue
Under $10
million
$10 million to Over $30
million $30 million
Ceramic tiles
Increased 43 36 54 50
Decreased 2 8
No change 54 64 38 50
Responses 46 25 13 8
Roofing materials
Increased 83 86 82 75
Decreased 2 1 4
No change 15 13 14 25
Responses 167 87 50 28
Plumbing fixtures & fittings
Increased 67 70 68 44
Decreased 1 5
No change 32 30 26 56
Responses 72 44 19 9
HVAC equipment
Increased 58 69 50 40
No change 42 31 50 60
Responses 24 13 6 5
Copper wiring
Increased 70 73 59 75
Decreased 4 2 12
No change 26 24 29 25
Responses 70 45 17 8
Other
Increased 55 60 33 67
No change 45 40 67 33
Responses 11 5 3 3

44
Q2. On average across all product lines, how have prices for the materials you sell changed over the
past 6 months?
(Percent of respondents)
Percent
Total Annual Gross Revenue
Under $10
million
$10 million to Over $30
million $30 million
Stayed about the same 0.88 0.89 0.00 2.22
Increased by less than 2% 1.32 1.79 1.47 0.00
Increased 2% to 3.99% 9.25 14.29 4.41 4.44
Increased 4% to 5.99% 14.98 16.96 10.29 15.56
Increased 6% to 7.99% 11.89 10.71 11.76 15.56
Increased 8% to 9.99% 7.49 7.14 5.88 8.89
Increased 10% or more 54.19 48.21 66.18 53.33
Responses 227 112 68 45
Q3. Over the past 6 months, how has the total volume of your sales changed?
(Percent of respondents)
Percent
Total Annual Gross Revenue
Under $10
million
$10 million to Over $30
million $30 million
Declined 14.47 25.44 5.97 0.00
Stayed about the same 21.05 28.95 13.43 11.11
Increased by less than 5% 13.6 14.04 13.43 13.33
Increased 5% to 9.99% 15.35 13.16 19.4 13.33
Increased 10% to 14.99% 16.23 10.53 20.9 24.44
Increased 15% to 19.99% 5.70 2.63 2.99 17.78
Increased 20% to 29.99% 5.70 1.75 8.96 11.11
Increased 30% or more 7.89 3.51 14.93 8.89
Average* 6.90 2.72 10.90 12.78
Responses 228 114 67 45
*Calculated assuming the midpoint of each category and Winsorizing 15 percent of the responses at the top and bottom (26 percent
for respondents with under $10 million in gross revenue)
Q4. Approximately how much is your annual gross revenue
(Percent of respondents)
Percent
Total Annual Gross Revenue
Under $10
million
$10 million to Over $30
million $30 million
Under $10 million 50.22 100
$10 million to $29.99 million 29.96 100
$30 million to $59.99 million 9.69 48.89
$60 million to $89.99 million 4.85 24.44
$90 million or more 5.29 26.67
Responses 227 114 68 45

45
Appendix II:
Questionnaires

46
NAHB: HMI Survey Special Questions for May 2013
1. How would you describe the current availability of the following materials, as well as changes in their prices now
vs. 6 months ago?
Current Availability Changes in Prices Now vs. 6
months ago
No
shortage
Some
shortage
Serious
shortage
Do not
Purchase Increased Decreased
No
change
Cement
Ready-mix concrete
Concrete brick and block
Clay brick
Vinyl siding
Insulation material
Structural Insulated Panels (SIP)
Steel (Lightweight for framing)
Steel Beams
Trusses
Framing lumber
Gypsum wall board
Oriented Strand Board (OSB)
Plywood
Cabinets
Millwork
Windows and Doors
Hardwood flooring
Ceramic tiles
Roofing materials
Plumbing fixtures & fittings
HVAC equipment
Copper wiring
Other(Specify) ____________________
2. Overall, how have total material costs for the same house changed over the past 6 months?
Declined Increased 4 to 5.99%
Stayed about the same Increased 6 to 7.99%
Increased by less than 2% Increased 8 to 9.99%
Increased 2 to 3.99% Increased 10% or more
THANK YOU

47
Survey of National Lumber and Building Material Dealers
1. How would you describe the current availability of the following materials, as well as changes in their prices now
vs. 6 months ago?
Current Availability Changes in Prices Now vs. 6
months ago
No
shortage
Some
shortage
Serious
shortage
Do not
Purchase Increased Decreased
No
change
Cement
Ready-mix concrete
Concrete brick and block
Clay brick
Vinyl siding
Insulation material
Structural Insulated Panels (SIP)
Steel (Lightweight for framing)
Steel Beams
Trusses
Framing lumber
Gypsum wall board
Oriented Strand Board (OSB)
Plywood
Cabinets
Millwork
Windows and Doors
Hardwood flooring
Ceramic tiles
Roofing materials
Plumbing fixtures & fittings
HVAC equipment
Copper wiring
Other(Specify) ________________
2. On average across all product lines, how have prices for the materials you sell changed over the past 6 months?
Declined Increased 4 to 5.99%
Stayed about the same Increased 6 to 7.99%
Increased by less than 2% Increased 8 to 9.99%
Increased 2 to 3.99% Increased 10% or more
3. Over the past 6 months, how has the total volume of your sales changed?
Declined Increased 10 to 14.9%
Stayed about the same Increased 15 to 19.9%
Increased by less than 5% Increased 20 to 29.9%
Increased 5 to 9.9% Increased 30% or more
4. Approximately how much is your annual gross revenue?
Under $10 million $60 million to $89.9 million
$10 million to $29.9 million $90 million or more
$30 million to $59.0 million
THANK YOU!