Embed Size (px)
Citation preview
1
Building on Growth in Uganda
Sarah Ssewanyana, John Mary Matovu, and Evarist Twimukye
During the decade following the end of political instability and civil war in 1986, Uganda’s
economy grew at an average annual rate of 7.7 percent. The pattern of growth has been
skewed, however, occurring largely in subsectors such as telecommunications and finance,
which employ highly skilled people, not the poor. As a result, growth has been
accompanied by rising inequality and very high unemployment levels, especially among
youth. More needs to be done to translate impressive performance at the macro level into
improvements in the welfare of the majority of Uganda’s people, especially the rural poor.
Over the past two decades, Uganda has seen a remarkable turnaround in economic performance,
with growth averaging about 7.7 percent a year over the 1997–2007 period. Equally impressive
has been the sharp decline in poverty rates, which fell about 15 percentage points over this
period. Improved macroeconomic management and economic reforms contributed to the
country‘s strong growth performance.
Although growth and poverty reduction have been impressive, Uganda has experienced
worsening income distribution; a decline in the relative importance of agriculture to overall gross
domestic product (GDP); a growing youth population, with increasing unemployment; and a low
rate of urbanization. There has also been limited structural transformation of the economy, a
reflection of the fact that growth has come largely from the services sector, which employs the
highly skilled, rather than from the agricultural sector, which still employs 70 percent of the
population. Notwithstanding the considerable progress in diversifying its export base away from
coffee, Uganda still remains a primary commodity exporter, with limited value addition to its
major exports.
Growth Experience
Uganda achieved impressive economic growth over the past two decades, with positive per
capita GDP growth since 1987 and stronger growth than the continent as a whole (figure 1 and

2
table 1). Despite this improvement, Uganda‘s per capita GDP at purchasing power parity remains
about half that of Sub-Saharan African as a whole.
Figure 1. Annual GDP Growth in Uganda, 1983–2007
-8%
-6%
-4%
-2%
0%
2%
4%
6%
8%
10%
12%
1983
1984
1985
1986
1987
1988
1989
1990
1991
1992
1993
1994
1995
1996
1997
1998
1999
2000
2001
2002
2003
2004
2005
2006
2007
$0
$500
$1,000
$1,500
$2,000
$2,500
GDP per capita, PPP (constant 2005 US$) GDP growth (annual %) GDP per capita growth (annual %)
Source: World Bank 2009.

3
Table 1. Annual GDP Growth in Selected Countries in Sub-Saharan Africa, 1997–2009
Year Ghana Kenya Mauritius Mozambique South Africa Tanzania Tunisia Uganda
Sub-
Saharan
Africa
1997
4.20
(1.59)
0.47
(-2.23)
5.69
(4.37)
10.24
(7.26)
2.65
(0.32)
3.53
(0.84)
5.44
(4.00)
5.10
(1.94)
3.58
(0.87)
1998
4.70
(2.15)
3.29
(0.59)
6.07
(4.96)
10.78
(7.96)
0.52
(-1.82)
3.71
(1.12)
4.78
(3.46)
4.91
(1.77)
2.42
(-0.24)
1999
4.40
(1.90)
2.31
(-0.33)
2.61
(1.31)
8.12
(5.39)
2.36
(-0.08)
3.53
(0.97)
6.05
(4.68)
8.05
(11.11)
2.46
(-0.19)
2000
3.70
(1.24)
0.60
(-1.98)
9.03
(7.96)
1.09
(-1.52)
4.15
(1.61)
5.10
(2.46)
4.70
(3.52)
3.14
(-0.01)
3.53
(0.87)
2001
4.00
(1.56)
3.78
(1.11)
2.57
(1.46)
11.9
(8.93)
2.74
(0.65)
6.24
(3.53)
4.92
(3.73)
5.18
(1.92)
3.62
(1.00)
2002
4.50
(2.07)
0.55
(-2.03)
2.11
(1.24)
8.82
(5.92)
3.67
(2.25)
7.24
(4.46)
1.65
(0.53)
8.73
(5.31)
3.45
(0.87)
2003
5.20
(2.79)
2.93
(0.29)
3.66
(2.59)
6.02
(3.21)
2.95
(1.65)
5.67
(2.84)
5.56
(4.94)
6.47
(3.09)
4.23
(1.67)
2004
5.60
(3.23)
5.10
(2.40)
5.75
(4.84)
7.88
(5.08)
4.55
(3.33)
6.73
(3.88)
6.04
(5.05)
6.81
(3.39)
6.19
(3.60)
2005
5.90
(3.58)
5.91
(3.17)
1.24
(0.44)
8.39
(5.66)
5.28
(4.09)
7.37
(4.46)
3.98
(2.98)
6.33
(2.92)
5.72
(3.15)
2006
6.40
(4.13)
6.32
(3.56)
3.95
(3.14)
8.68
(6.04)
5.60
(4.43)
6.74
(3.79)
5.66
(4.63)
10.78
(7.23)
6.17
(3.59)
2007
6.46
(4.24)
7.01
(4.22)
5.52
(4.87)
7.28
(4.75)
5.49
(4.34)
7.15
(4.15)
6.33
(5.32)
8.41
(4.92)
6.60
(4.02)
2008
8.43
(6.20)
1.55
(-1.09)
5.09
(4.41)
6.74
(4.29)
3.68
(2.54)
7.44
(4.39)
4.64
(3.60)
8.71
(5.21)
5.26
(2.72)
2009
4.66
(2.52)
2.59
(-0.08)
2.14
(1.62)
6.33
(3.96)
-1.78
(-2.83)
5.50
2.48)
3.13
(2.10)
7.06
(3.62)
1.65
(-0.80)
Note: Figures in parentheses are per capita growth rates.
Source: World Bank 2010.
During the decade following the end of political instability and civil war in 1986, Uganda‘s
economy grew at an average rate of 7.7 percent a year. (Economic growth declined by 1.4
percentage points between 2008/09 and 2009/10.) Initially, economic growth was driven by
postwar recovery and reconstruction. Since the early 1990s, it has been driven by comprehensive
macroeconomic and structural reforms (discussed in the second section of this chapter).
Investment growth also remained strong, with private investment rising by an estimated 17
percent and public investment rising 15 percent (table 2). Private investment growth was led by
construction (AfDB 2009).
Table 2. Components of GDP Growth in Uganda, 2001–09
(percent, in 2002 prices)
Component 2001 2002 2003 2004 2005 2006 2007 2008 2009
Consumption

4
Private 6.3 6.1 2.8 3.4 8.1 12.3 2.9 8.2 11.5
Public 2.9 5.2 5.2 3.7 4.5 3.7 –1.5 1.7 –1.9
Investment
Private 10 14.1 16.1 14.6 23.5 10.3 14.6 12.0 1.1
Public 0.3 –8.1 2.3 11.6 9.3 13.5 19.6 –15.3 28.8
Trade
Exports 17.2 7 6.6 20.9 21.5 –6.3 53.8 45.0 –12.0
Imports 12.8 7.5 6.2 9.6 16.8 17.2 15.7 17.6 4.6
Source: Uganda Bureau of Statistics 2010.
Economic growth has been export led, with the share of exports in GDP rising over the past two
decades (figure 2). The expanding regional market for Uganda‘s food and manufactured products
has partly boosted exports during the past five years, a reflection of the dividend enjoyed by
Uganda‘s neighbors, whose demand for Ugandan goods has increased.
Figure 2. Exports as Percentage of GDP in Uganda, 1998/99–2008/09
Source: Bank of Uganda 2009.
Growth has been driven by the services sector, which has accounted for almost half of GDP
since 2001/02 (table 3). Before the global financial crisis, the key subsectors driving growth in
the services sector included financial services, transport and communications, public
administration, and defense (see annex table A1). The agricultural sector grew more slowly than

5
the other sectors between 2001/02 and 2009/10, accounting for 23.1–23.9 percent of annual GDP
over the period.
Table 3. Sectoral Contributions to GDP and Growth Rates in Uganda, 2001/02–2008/09
(percent, in 2002 prices)
Item 2001/02 2002/03 2003/04 2004/05 2005/06 2006/07 2007/08 2008/09 2009/10
Sectoral contribution to GDD (in current prices)
Agriculture 23.1 22.1 21.1 20.2 24.1 22.3 21.4 23.1 23.9
Industry 22.0 22.6 22.8 24.0 22.8 25.1 25.8 24.7 24.6
Services 48.3 48.6 49.1 49.0 47.2 47.0 46.9 46.4 45.4
Growth rate
Total GDP 8.5 6.5 6.8 6.3 10.8 8.4 8.7 7.2 5.8
Per capita
GDP 5.1 3.1 3.4 3.0 7.3 5.0 5.3 3.8 2.4
Agriculture 7.1 2.1 1.6 2.0 0.5 0.1 1.3 2.5 2.1
Industry 7.4 9.5 8 11.6 14.7 9.6 8.8 5.8 8.9
Services 11.0 7.4 7.9 6.2 12.2 8.0 9.7 8.8 5.8
Source: Uganda Bureau of Statistics 2010a.
The contribution of industry to GDP—which ranged from 22.0 to 25.6 percent over the period—
is well below the 35 percent benchmark for countries graduating from low- to middle-income
status (Bevan and others 2003). Growth in the sector fell from 9.1 percent in 2007/08 to 3.8
percent in 2008/09, largely as a result of the global economic crisis, which reduced the
remittances that had fueled a construction boom in Uganda. The decline caused the share of the
construction subsector in GDP to fall from 10.8 percent in 2007/08 to 2.2 percent in 2008/09 (see
Annex
Table A1). The slowdown was also a result of the increase in imported inputs arising from the
depreciation of the Ugandan shilling. The contribution of the manufacturing subsector to overall
GDP was well below that of the construction subsector.
Structural Transformation of the Economy
Uganda‘s economy has been growing rapidly, but growth has failed to create enough jobs for the
ever-increasing labor force. Evidence from the Uganda National Household Surveys shows that
as a result of impressive economic growth during the 1990s, the population experienced
important broad-based welfare gains in terms of consumption increases. The gains were not

6
equally distributed across social groups and spatially. Overall, the pattern of growth has been
skewed, with growth taking place in subsectors such as telecommunications and finance, which
employ highly skilled people, not the poor.
The mismatch between the contribution of the different sectors to GDP and the proportion of the
population that derive their livelihood from the sectors has serious implications for the level of
unemployment and underemployment in Uganda. Although the contribution of agriculture to
overall GDP has remained low than that of services or industry, its share in employment remains
high. Services, which account for almost half of GDP, employ only about 24 percent of the
population. Employment in industry, which accounts for more than a quarter of GDP, is also
very minimal, at about 8 percent of the population (table 4).
Table 4. Distribution of Employment in Uganda, by Sector and Gender, 2003
(percent)
Sector Women Men Total
Agriculture 76 62 69
Industry 5 10 8
Services 19 28 24
Source: World Bank 2009.
Agricultural Performance
Because more than two-thirds of Ugandans work in agriculture, development of the Ugandan
economy is closely linked to transformation of the agricultural sector. Agriculture in Uganda is
still characterized by low productivity, mainly as a result of poor inputs, undeveloped value
chains, and low public and private investment in the sector. The lack of sustained agricultural
growth and the slow process of diversification in agriculture pose serious threats to poverty
reduction efforts.
The reforms of the early 1990s, especially the dismantling of the agricultural public enterprises
and liberalization of the economy, led to greater participation of the private sector in marketing
agricultural produce. The agricultural reforms implemented since the mid-1990s, however, have
largely benefited only a small fraction of farmers, particularly richer and better-educated farmers,
who have been able to diversify their agricultural production. Once these efficiency gains were

7
exploited, other innovations were needed to maintain growth in the sector (Okidi and others
2007).
Only 50 percent of agricultural production in Uganda is sold on markets; with the exception of
coffee farmers and farmers engaged in other tradables or niche markets (vanilla, fruit, tomatoes),
most smallholders in Uganda are still engaged in subsistence farming. For the most part,
Ugandan farmers remain poor and out of mainstream economic activity.
Export Performance
Exports as a share of GDP have increased over time in Uganda (see figure 2). Before the
liberalization of the economy and the emphasis on import substitution and export diversification
in the 1990s, Uganda depended mainly on coffee as its main export. This dependence on a single
commodity was a major constraint to terms of trade growth, especially when world coffee prices
dropped, as they did in the mid-1990s.
To insulate the economy from adverse terms of trade and instability in export earnings associated
with commodity concentration, the government adopted a policy shift in 1987 that sought to
diversify the exports base to include nontraditional (mainly agricultural) exports. Since then,
Uganda has diversified its exports base to include larger shares of flowers, fishing, and other
agricultural exports (see appendix Table A2). Revenue from noncoffee exports increased by
more than sixfold between 1997/98 and 2008/09, rising from $189.6 million to $1,199.6 million
(Figure 3).
Trade liberalization was designed to reverse and even eliminate the trade deficit by increasing
export earnings and curtailing the demand for imports. Incentives for export-oriented trade and
market-determined exchange rate policies were expected to encourage both traditional and
nontraditional exports. Nevertheless, merchandise exports continued to decline throughout the
liberalization period (1987–92), partly because the manufacturing sector had shrunk as a result of
the economic mismanagement of earlier regimes. Since then, the value of exports has improved
markedly.

8
Figure 3. Coffee, Noncoffee, and Total Exports by Uganda, 1997/98–2008/09
Source: Bank of Uganda 2008/09.
Alongside the increase in noncoffee exports has been the huge increase in the importance of
informal cross-border trade, which rose from 1.3 percent of total exports in 2002/03 to 50.2
percent by 2008/09—a significant development in the wake of the global financial crisis, which
was beginning to affect traditional exports, especially coffee. Including informal cross-border
trade, the share of industrial products in total exports increased from 43.8 percent in 2007/08 to
54.9 percent in 2008/09 (Figure 4). As new emerging export markets within the region stabilize,
it will be difficult for Uganda to sustain the recent rate of industrial product export growth.

9
Figure 4. Industrial Products as Percentage of Total Exports in Uganda, 1997/98–2008/09
Source: Bank of Uganda 2008/09.
Most primary commodities earn a fraction of what they would earn if they had been processed.
Consequently, although the shilling depreciated against the U.S dollar in real terms (from U Sh
558 per dollar in 1987 to U Sh 2,000 in 2008), implying higher domestic producer prices in
Uganda shillings, the trade deficit ballooned, from $446.7 million in 1997/98 to $936.3 million
in 2008/09. The increase in the trade deficit reflected the low returns from exports caused by the
deteriorating terms of trade and the large increase in the value of imports caused by the
depreciation of the shilling. Since 2005/06 the trade deficit as a share of GDP has declined
(Figure 5).

10
Figure 5. Trade Deficit as Percentage of GDP in Uganda, 1998/99–2008/09
Source: Bank of Uganda 2009.
Uganda will potentially benefit from the expanded East African Common Market, estimated at
120 million people, which allows unimpeded movement of labor, capital, and other services
across borders within Burundi, Kenya, Rwanda, Tanzania, and Uganda. However, trade with the
largest economies in the union (Kenya and Tanzania) has been one sided, with limited exports
from Uganda to the two countries. Uganda‘s trade has been boosted mainly by trading with
postconflict economies in the region, including Southern Sudan, the Democratic Republic of
Congo, and Rwanda. As these countries stabilize, the trade deficit of Uganda with its major East
African Community partners will have to be addressed by increasing exports to Kenya and
Tanzania.
Impact of Growth on Poverty Reduction and Other Millennium Development Goals
Uganda is one of the few Sub-Saharan African countries to achieve the first MDG of halving
extreme poverty before 2015. The proportion of the population living below the absolute poverty
line declined from 56.4 percent in 1992/93 to 31.1 percent in 2005/06 and to 24.5 percent in
2009/10 (table 5).1 Income poverty remains a key development challenge, however, with the
absolute number of poor people declining only marginally, from 9.8 million 1992 to 8.4 million
in 2005/06 and to 7.5 million in 2009/10, as a result of a population growth rate of 3.2 percent a
11
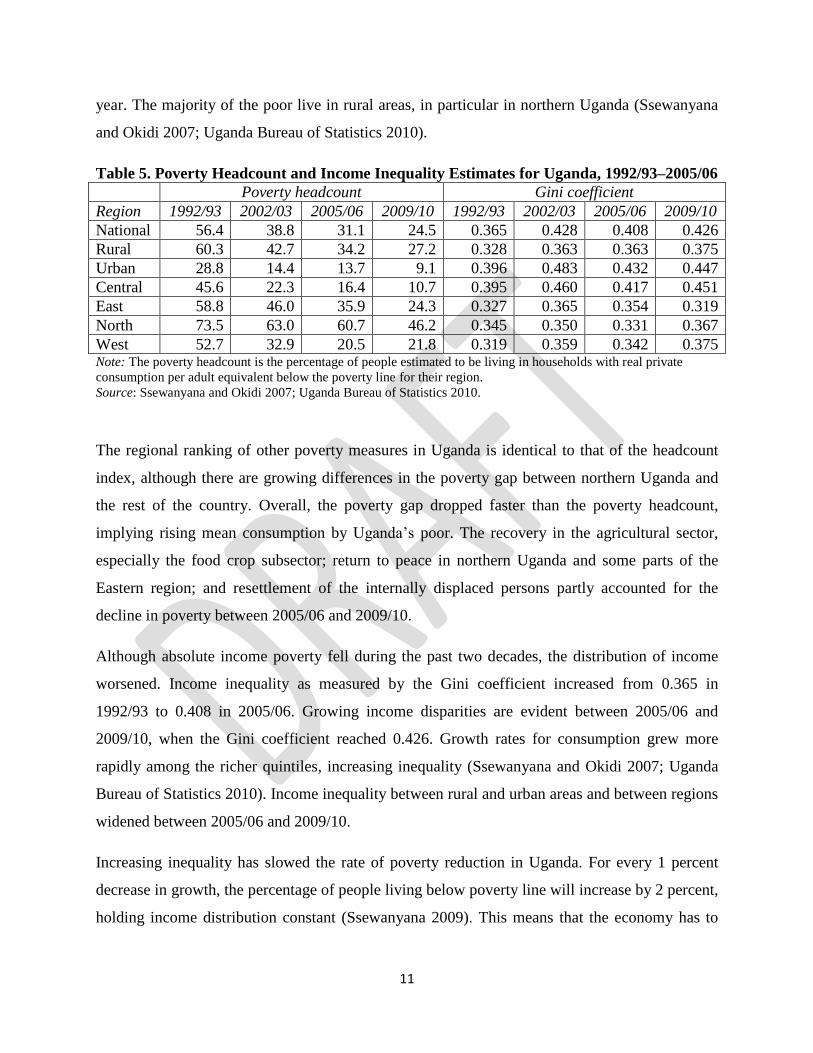
year. The majority of the poor live in rural areas, in particular in northern Uganda (Ssewanyana
and Okidi 2007; Uganda Bureau of Statistics 2010).
Table 5. Poverty Headcount and Income Inequality Estimates for Uganda, 1992/93–2005/06
Poverty headcount Gini coefficient
Region 1992/93 2002/03 2005/06 2009/10 1992/93 2002/03 2005/06 2009/10
National 56.4 38.8 31.1 24.5 0.365 0.428 0.408 0.426
Rural 60.3 42.7 34.2 27.2 0.328 0.363 0.363 0.375
Urban 28.8 14.4 13.7 9.1 0.396 0.483 0.432 0.447
Central 45.6 22.3 16.4 10.7 0.395 0.460 0.417 0.451
East 58.8 46.0 35.9 24.3 0.327 0.365 0.354 0.319
North 73.5 63.0 60.7 46.2 0.345 0.350 0.331 0.367
West 52.7 32.9 20.5 21.8 0.319 0.359 0.342 0.375 Note: The poverty headcount is the percentage of people estimated to be living in households with real private
consumption per adult equivalent below the poverty line for their region.
Source: Ssewanyana and Okidi 2007; Uganda Bureau of Statistics 2010.
The regional ranking of other poverty measures in Uganda is identical to that of the headcount
index, although there are growing differences in the poverty gap between northern Uganda and
the rest of the country. Overall, the poverty gap dropped faster than the poverty headcount,
implying rising mean consumption by Uganda‘s poor. The recovery in the agricultural sector,
especially the food crop subsector; return to peace in northern Uganda and some parts of the
Eastern region; and resettlement of the internally displaced persons partly accounted for the
decline in poverty between 2005/06 and 2009/10.
Although absolute income poverty fell during the past two decades, the distribution of income
worsened. Income inequality as measured by the Gini coefficient increased from 0.365 in
1992/93 to 0.408 in 2005/06. Growing income disparities are evident between 2005/06 and
2009/10, when the Gini coefficient reached 0.426. Growth rates for consumption grew more
rapidly among the richer quintiles, increasing inequality (Ssewanyana and Okidi 2007; Uganda
Bureau of Statistics 2010). Income inequality between rural and urban areas and between regions
widened between 2005/06 and 2009/10.
Increasing inequality has slowed the rate of poverty reduction in Uganda. For every 1 percent
decrease in growth, the percentage of people living below poverty line will increase by 2 percent,
holding income distribution constant (Ssewanyana 2009). This means that the economy has to

12
grow by at least 7 percent and household consumption has to rise at least 4 percent if Uganda is
to avoid reversals in its poverty reduction efforts.
Uganda is likely to attain MDG 3 (promoting gender equality and empowering women), MDG 6
(combating HIV/AIDS), MDG 7 (ensuring environmental sustainability), and MDG 8
(developing a global partnership for development). The stagnation in net primary school
enrollment since 2003 at about 85 percent is a clear indication that intensified efforts are required
if Uganda is to meet MDG 2, however, and attainment of MDG 4 (reducing child mortality) and
MDG 5 (improving maternal health) is unlikely even with improved policies, institutions, and
funding (UNDP 2010).
Reforms Driving Growth
The past two decades have seen tremendous economic transformation in Uganda, fuelled mainly
by good policies involving careful sequencing and determined implementation. The World Bank
has referred to Uganda‘s efforts as ―the most far-reaching stabilization and structural reform
program in Africa, and one of the most comprehensive reform efforts in the world‖ (World Bank
2007, p. 4).
The first reform was the Economic Recovery Program, introduced in 1987, with support from the
World Bank and International Monetary Fund (IMF), which focused on price stabilization and
liberalization. Policies under this program included currency reform, devaluation, liberalization
of domestic prices, and conversion to a floating exchange rate regime (in 1993).
The next set of reforms involved the adoption of the structural adjustment program that was
meant to free up markets and create price incentives, stimulate private investment, and encourage
competition. Reforms under this program included the abolition of marketing boards, the
privatization or abolition of parastatals, and the establishment of the Uganda Investment
Authority. This period was characterized by sustained macroeconomic stabilization, adjustment,
and structural reform efforts that affected almost all sectors of the economy. Policies mainly
involved macroeconomic stabilization process, price liberalization, financial sector liberalization,
public enterprises reform and civil service reform. In addition to stabilizing and changing the
structure of the economy, macroeconomic stabilization and reorientation of pricing and
marketing policies, restarting of economic growth, and strengthening institutional framework

13
constituted the major cornerstones of the program. To achieve these ends, the Economic
Recovery Program focused on ensuring macroeconomic stability; liberalizing the foreign
exchange system, trade, prices, and marketing systems; improving the incentive structure and
business climate to promote savings mobilization and investment; and rehabilitating the
economic, social, and institutional infrastructure.
With the economy back on its footing, in 1997 the government embarked on poverty eradication,
introducing the Poverty Eradication Action Plan (PEAP), a multisectoral program aimed at
reducing poverty. Policies in this program included the Plan for the Modernization of Agriculture
(PMA), which sought to address agricultural constraints to production and turning agriculture
commercial. The plan has not been as successful as envisaged, mainly because it was too broad
and in some cases ambiguous, with many programs with too many pillars when the focus should
have been on enhancing agriculture productivity. The National Agricultural Advisory Services
(NAADS), the flagship agricultural productivity enhancement program within PMA, was beset
by inefficiencies and other implementation problems that limited its impact on agriculture.2
Other sectoral reforms that contributed to the liberalization and stabilization of the economy
included the Medium-Term Competitive Strategy for the Private Sector (MTCS), the Strategic
Export Program (STRATEX), and the Strategic Export Intervention Program (SEIP). These
policies were accompanied by important institutional reforms, such as decentralization efforts,
the abolition of state-owned marketing boards, and the restructuring of the public administration.
The 1990s saw a substantial reversal in the decline of the economy that had characterized the
1970s and early 1980s, suggesting that reform worked. Confidence in the economy was restored,
spurring substantial aid and foreign direct investment inflows and a reversal of capital flight
(figure 6). Most economic indicators rebounded, and by 1996 the economy had recovered to its
nominal 1971 dollar per capita GDP (World Bank 2007).

14
Figure 6. Official Development Aid as Percentage of GDP in Uganda, 1998/99–2008/09
Source: Bank of Uganda 2009.
To sustain rapid economic growth, the government needed to reorient expenditures toward social
sectors and increase spending on infrastructure. Social policy spending was aimed at spurring
growth as well as the level of productivity of assets of poor people. Policies undertaken under the
framework of the PEAP included universal primary and secondary education, intended both to
raise education indicators and remove the financial burden of education from parents as a means
of reducing poverty. Efforts were also made to increase health coverage, by constructing health
centers in all subcounties and parishes.
Examination of the composition of the public budget for most of the 1990s and 2000s reveals
that total government expenditure steadily increased, from about 18.6 percent of GDP in 1992/93
to about 32.0 percent in 2008/09. There is evidence to suggest that increased funding to social
services has benefitted the poor, especially in rural areas (Kappel, Lay, and Steiner 2005).
With reasonable progress in the social sectors, in the late 2000s the government began
addressing the infrastructural constraints that have dogged the country since independence. Since
2007/08 substantial resources have been committed to the rehabilitation and construction of
roads and hydroelectric dams. The government has prioritized the building of roads in the

15
medium and long term, with more than 20 trunk roads planned or in the process of being built in
the next 20 years (MFPED 2009). The share of total central government budget allocated to
works and transport rose from 10.0 percent in 2005/06 to 18.4 percent in 2009/10, and the share
of the budget allocated to energy and mineral development rose from 3.5 to 10.3 percent. Taken
together, allocations for works, transport, and energy represented almost a third of the 2009/10
budget—a substantial figure given Uganda‘s historically low investments in infrastructure.
Although issues about absorption capacity and quality of infrastructure remain, there is a
perception that the government‘s tightened focus on improving infrastructure will help reduce
Uganda‘s perennial infrastructural shortages, giving the economy a major boost.
Challenges to Development
Policymakers need to address a variety of challenges in reducing poverty and spurring growth. In
addition to the challenges identified in this section, they need to ensure that growth is inclusive.
Failure to achieve equity is likely to exacerbate unemployment and lead to social unrest.
Slow Progress in Reducing Poverty and Slowing Population Growth
Although Uganda has already achieved MDG 1 (halving extreme poverty), poverty remains high,
especially in the northern region. Poverty reduction interventions, especially the Peace and
Reconciliation Development Plan (PRDP), in this part of the country need to be restructured to
ensure that they reach and benefit vulnerable groups.
Even at the average GDP growth rate of 6.9 percent attained during the 1990s, it would take
Uganda about 20 years to double average per capita income. With population growth rate at 3.2
percent a year, one of the highest population growth rates in the world, it is going to be very
difficult to reduce poverty (World Bank 2007).
Uganda‘s 3.2 percent annual population growth thwarts development, especially in social
services provision and social outcomes. Unless efforts at reducing the high population growth
rates are intensified, many of the MDGs will be difficult to achieve.

16
Inadequate Transformation of the Agriculture Sector
The critical factor for ensuring sustainable agricultural productivity is land reform that would
facilitate commercial agriculture. Reform would involve the government buying out landlords in
order to consolidate the small plots on which many rural farmers depend to enable commercial
agriculture. The government could also try to draw the rural population to urban centers through
more planned urban development.
Other factors explaining low agricultural productivity include poor inputs, undeveloped value
chains, and low public and private investment in the sector. The issue of low productivity in
agriculture will need to be addressed—by, for instance, accelerating the creation of on-farm and
off-farm processing zones to add value to agricultural commodities, financing of the whole value
chain activities as opposed to funding on-farm activities only, and land reforms that will allow
commercial agricultural production as articulated in the National Development Plan (Republic of
Uganda 2010).
Weak Infrastructure
Uganda‘s infrastructure is among the worst in the world (Republic of Uganda 2010; World Bank
2007). The National Development Plan identifies weak infrastructure as one of the key binding
constraint in Uganda. Roads, power, railways, and finance infrastructure are all below those of
Uganda‘s neighbors, with grave implications for the economy.3 The National Development Plan
identifies the most challenging infrastructural impediments as power, transport, and access to and
the high cost of finance, in that order. Efforts to address infrastructure constraints by increasing
sector funding represent a move in the right direction and should be followed by prudent use of
the resources by responsible agencies to check leakages, which have often derailed service
delivery. Regional infrastructure also remains a key challenge, especially for boosting regional
trade.
Lack of Sufficient Private Sector Development
Private sector growth has been impressive since liberalization, but Uganda‘s economy remains
dominated by small firms that usually employ less than five people, making it difficult to absorb
the growing number of graduates and exacerbating the youth unemployment problem. In

17
addition, although the private sector has played a significant role in areas such as education and
health services, it has not been prominent in other sectors that require significant investments,
such as energy, and even in sectors in which the private sector is active, the impact of its
activities on employment creation has been limited. Enlarging the role of the private sector calls
for more active participation of the government under private-public partnership arrangements
Government development programs and successive generations of Country Strategy Papers have
emphasized the development of the private sector as a major goal for the country. But progress
has been slow in this area, partly because of weak human and institutional capacity, which limits
private sector participation in execution of contracted or self-initiated projects. Another factor
limiting the growth of the private sector is the poor state of the financial sector, which limits
access to credit. Equity finance is also lacking, and small businesses have limited access to
commercial banking facilities. It is important that the government expedite the recapitalization of
the Uganda Development Corporation and the Uganda Development Bank to make private sector
access to credit easier.
Narrow Export Base and Terms of Trade Vulnerability
Despite the diversification of its export base, Uganda remains heavily dependent on primary
commodities. Diversification of the export base is of paramount importance. The factors that
continue to constrain export diversification include the primary and low value-added nature of
Uganda‘s exports, poor product quality, and poor regulation standards, which inhibit competition
in marketing and export of primary commodities.
Low Tax Revenue
Tax revenue in Uganda is low, the result mainly of untaxed sectors, especially informal
businesses and some agricultural activities, and tax evasion (Sennoga, Matovu, and Twimukye
2009). The lack of revenue has translated into an unending dependence on foreign aid, which
accounted for about 32 percent of the budget in 2008/09. In 2007/2008 tax revenue amounted to
about 12 percent of GDP. This figure is low relative to Uganda‘s neighbors (tax revenue was
about 17 percent of GDP in Tanzania and about 27 percent of GDP in Kenya for the same
period). Lack of adequate tax revenues constrains government operations and weakens economic

18
management. It also increases government reliance on foreign aid to finance development,
making economic management more difficult.
The recent discovery of oil in Uganda could significantly boost the resources mobilized
domestically widening resources available to finance Uganda‘s development agenda. The
government could also try to expand the tax base, by targeting sectors that are currently untaxed,
especially the informal sector, and setting up regulation to reduce tax evasion.4
Corruption and Weak Governance
The government has made numerous efforts to strengthen good governance, by allowing civil
society organizations to participate more in planning and budgeting and by setting up institutions
to strengthen accountability. Such initiatives included the creation, in 2008, of the anticorruption
court to handle corruption-related cases and the value for money audit unit in the Auditor
General‘s office to check on government spending at all levels. Uganda has also adopted a
national anticorruption strategy.
These efforts notwithstanding, the perception remains that corruption is rampant, and the
government has come under pressure from several quarters to show more political will to address
the problem. Uganda‘s ranking on the Ibrahim Index of African governance improved from 27th
in 2007 to 19th in 2008. But in May 2009, Transparency International ranked Uganda the third
most corrupt country in the world. And although there has been considerable progress in tax
administration with the formation of the Uganda Revenue Authority in 1991, tax policy and
administration remain issues as they relate to revenue mobilization, partly because of corruption
in the tax body. In 2010 Transparency International ranked Uganda‘s revenue authority the
second most corrupt tax body in East Africa (Transparence International 2010).
More needs to be done to improve governance in Uganda, where civil society organizations are
weak and the legislature often fails to rein in Uganda‘s powerful executive. Unless governance is
strengthened, even increased resources may fail to bring meaningful development to Uganda.
Weak Human and Institutional Capability
Uganda‘s Five-Year National Development Plan 2010–15 identifies weak human and
institutional development as one of the economy‘s key binding constraint. Most public sector

19
departments are characterized by coordination failures, corruption, endemic malaise, and weak
institutional linkages among relevant stakeholders, including the Ministry of Finance Planning
and Economic Development, sector line ministries, and the private sector. As a result, budgeting
processes are inefficient, and scarce investment resources are not allocated rationally. Problems
are particularly acute at the local government level. The central government needs to address this
problem as its shifts the planning, delivery, and management of basic services to local
governments (EPRC 2010). There is a need to increase human and institutional capacity to meet
the growing needs of local governments as the scope of their functions broadens.
Conclusion
Uganda has experienced relatively strong growth and poverty reduction since the 1990s. The
growth period was characterized by sustained macroeconomic stabilization, adjustment, and
structural reform efforts, which had a large impact on most sectors. Efforts included price
liberalization, financial sector liberalization, public enterprises reform, and reform of the civil
service.
Growth has been accompanied by rising inequality and very high unemployment levels,
however, especially among youth. Moreover, growth has been registered in sectors (particularly
services) whose contribution to employment is limited. More needs to be done to translate
impressive performance at the macro level into improvements in the welfare of the majority of
Uganda‘s people, especially the rural poor.
Looking forward, Uganda needs to address several issues in order to enjoy equitable growth.
First, policymakers need to increase the pace of transformation of the agricultural sector and
strengthen the sector‘s weak link to industry, where outputs from agriculture can be used as
inputs. Given that the sector employs 70 percent of the workforce, doing so would spur equitable
growth and reduce high unemployment. Second, policymakers have to find new ways to
mobilize domestic revenues to finance the budget. To address the growing trade deficit, Uganda
should continue diversifying its export base into higher value added products. Third,
policymakers need to address other key challenges, including weak human and institutional
capability, a weak private sector, poor infrastructure, poor governance, and high population
growth rates.

20
Annex
Table A1. GDP in Uganda, by Economic Activity, 2001/02–2008/09
(percent, at constant 2002 prices)
Item 2001/02 2002/03 2003/04 2004/05 2005/06 2006/07 2007/08 2008/09 2009/10
GDP at market prices 8.6 6.6 6.8 6.3 10.8 8.4 9.0 7.2 5.8
Agriculture, forestry, and fishing 7.1 2.1 1.6 2.0 0.5 0.1 1.3 2.5 2.1
Cash crops 12.5 3.2 7.3 -5.5 -10.6 5.4 9.0 5.6 -2.9
Food crops 5.7 2.2 -1.5 -0.2 -0.1 -0.9 2.4 2.6 2.7
Livestock 4.0 3.5 4.7 3.0 1.6 3.0 3.0 3.0 3.0
Forestry 6.8 5.2 3.1 6.5 4.1 2.0 2.8 6.3 2.4
Fishing 13.8 -4.3 9.6 13.5 5.6 -3.0 -11.8 -0.7 2.6
Industry 7.4 9.5 8.0 11.6 14.7 9.6 9.1 5.8 8.9
Mining and quarrying 12.2 12.8 1.7 27.2 6.1 19.4 3.0 4.3 12.8
Manufacturing 6.7 4.4 6.3 9.5 7.3 5.6 7.6 10.0 5.9
Formal 7.7 4.6 8.3 11.8 7.8 4.9 9.2 12.0 6.1
Informal 4.5 4.0 1.7 3.6 6.0 7.7 3.3 4.4 5.5
Electricity supply -1.7 3.7 7.7 2.1 -6.5 -4.0 5.4 10.6 8.9
Water supply 3.0 3.9 4.2 3.9 2.4 3.5 3.8 5.7 2.7
Construction 10.1 14.6 10.0 14.9 23.2 13.2 10.8 3.7 10.9
Services 11.0 7.4 7.9 6.2 12.2 8.0 10.2 8.8 5.8
Wholesale and retail trade;
repairs
7.4 5.1 6.3 7.2 12.3 10.4 14.7 9.7 -0.3
Hotels and restaurants 2.8 8.2 9.5 6.5 8.7 11.3 10.7 4.5 4.5
Transport and communications 17.8 14.9 15.8 9.8 17.1 17.7 21.3 14.3 15.1
Road, rail, and water transport 6.0 5.6 8.9 6.7 12.8 9.5 20.8 12.9 2.8
Air transport and support 0.5 5.8 13.8 19.4 6.9 13.8 17.8 -3.6 -1.2
Posts and telecommunication 76.5 40.4 28.6 11.8 26.2 29.1 22.6 19.8 30.3

21
Financial services 32.6 13.2 0.0 13.0 31.7 -11.9 17.1 25.4 21.1
Real estate activities 5.4 5.5 5.5 5.5 5.6 5.6 5.6 5.7 5.7
Other business services 11.6 7.6 7.0 9.2 12.5 8.0 10.8 12.4 10.4
Public administration and
defense
20.4 3.6 7.7 -5.4 15.8 -6.3 12.1 5.5 3.9
Education 14.2 7.2 9.1 4.4 9.4 10.6 -6.5 4.3 -0.5
Health 18.0 13.7 0.9 5.6 12.9 2.7 -4.8 -3.2 11.0
Other personal services 8.5 8.5 16.1 15.0 14.1 13.4 12.8 12.3 11.8
Source: Bank of Uganda 2008/09.

22
Table A2. Composition of Uganda’s Exports, 1997/98–2008/09
(percent)
Year Coffee
exports
Noncoffee
exports
Informal cross-border
exports
1997/98 58.7 41.3 0.0
1998/99 55.9 44.1 0.0
1999/2000 42.0 56.6 1.3
2000/01 24.5 75.5 0.0
2001/02 18.1 81.9 0.0
2002/03 20.8 77.9 1.3
2003/04 17.0 78.4 4.6
2004/05 16.3 71.4 12.3
2005/06 16.6 67.3 16.0
2006/07 15.2 67.4 17.4
2007/08 13.4 45.4 41.2
2008/09 10.9 38.9 50.2

23
Table A3. Poverty and Income Inequality Estimates, 1992/93–2005/06
Region
Poverty headcount Poverty gap Severity of poverty Gini coefficient
1992/93 2002/03 2005/06 2009/10 1992/93 2002/03 2005/06 2009/10 1992/93 2002/03 2005/06 2009/10 1992/93 2002/03 2005/06 2009/10
National 56.4 38.8 31.1 24.5
20.9 11.9 8.7 6.8
10.3 5.1 3.5 2.8
0.365 0.428 0.408 0.426
Rural 60.3 42.7 34.2 27.2
22.6 13.1 9.7 7.6
11.2 5.7 3.9 3.1
0.328 0.363 0.363 0.375
Urban 28.8 14.4 13.7 9.1
8.7 3.9 3.5 1.8
3.7 1.6 1.4 0.6
0.396 0.483 0.432 0.447
Central 45.6 22.3 16.4 10.7
15.3 5.5 3.6 2.4
7 1.9 1.3 0.8
0.395 0.46 0.417 0.451
East 58.8 46 35.9 24.3
22 14.1 9.1 5.8
10.9 6 3.4 2.1
0.327 0.365 0.354 0.319
North 73.5 63 60.7 46.2
30.3 23.4 20.7 15.5
15.8 11.5 9.2 7.3
0.345 0.35 0.331 0.367
West 52.7 32.9 20.5 21.8 18.7 8.5 5.1 5.4 9 3.3 1.8 2 0.319 0.359 0.342 0.375
Note: The poverty headcount is the percentage of people estimated to be living in households with real private consumption per adult equivalent below the poverty
line for their region. The poverty gap is the sum over all individuals of the shortfall of their real private consumption per adult equivalent and the poverty line
divided by the poverty line. Severity of poverty is the squared poverty gap (the sum over all individuals of the square of the shortfall of their real private
consumption per adult equivalent and the poverty line divided by the poverty line).
Source: Ssewanyana and Okidi 2007.

24
Table A4. Targets for and Status of Progress toward Millennium Development Goals and PEAP
MDG/target/indicator 1990
2005/06
available
at the
time
2009/10
latest
available
2007/08
PEAP
target
2013/14
PEAP
target
2015
MDG
target
Target
possible at
current
trend?
Target possible
with better
policies,
institutions,
and additional
funding?
1. Eradicate extreme hunger and poverty: Halve, between
1990 and 2015, the proportion of people whose income is
less than $1 a day
1.1 Poverty headcount ratio (percent) 56 31.1 24.5
28 28 Met Yes
1.2 Prevalence of child malnutrition (percent of
children under 5) 23 23
12 No Yes
2. Achieve universal primary education: Ensure that, by
2015, children everywhere, boys and girls alike, will be
able to complete a full course of primary schooling
2.1 Net primary enrollment ratio (percent of children
6-12)
Boys
58 84 82.4 90 100 100 Yes Yes
Girls 48 85 83.2 89 100 100 Yes Yes
2.2 Primary completion rate ( percent of boys and
girls)
56
69
100 No Yes
3. Promote gender equality and empower women:
Eliminate gender disparity in primary and secondary
education, preferably by 2005, and in all levels of
education no later than 2015
3.1 Ratio of girls to boys in primary education
(percent) 83 99
100 100 100 Met Yes
4. Reduce child mortality: Reduce by two-thirds, between
1990 and 2015, the under-five mortality rate
4.1. Under-five mortality rates (per 1,000) 177 152
53 No Uncertain
4.2 Infant mortality rate (per 1,000 live births) 98 88
68
32 No Uncertain
4.3. Immunization against DPT (percent of all
children) 45 83
90
n.a.
5. Improve maternal health: Reduce by two-thirds,
between 1990 and 2015, the under-five mortality rate
5.1 Maternal mortality ratio (modeled estimate, per
100,000 live births)
505
354
126 No Uncertain
5.2 Deliveries in health care centers (percent of all
deliveries)
24
50
n.a. Met Yes
6. Combat HIV/AIDS, malaria and other diseases: Have
halted by 2015 and begun to reverse the spread of
HIV/AIDS
6.1 Prevalence of HIV, total (percent of adult
population) 20 6.2
5
< 20 Met Yes
7. Ensure environmental sustainability: Integrate the
principles of sustainable development into country
policies and programs and reverse the loss of
environmental resources
7.1 Forest area (percent of total land area)
24
27 30 >24
7.2 Access to safe water (percent of population)
Urban 45
86.8 92.3 100
90
Yes
Yes
Yes
Rural 63.6 69.5 90

25
45
90
Yes
7.3 Access to improved sanitation (percent of
population)
Urban
65
100
R
Rural
55
80
7.4 Titled land (percent of land)
13
17 25
8. Develop a global partnership for development
8.1 Debt service (percent exports of goods and
services)
305
238 187
Yes Yes
Note: n.a. is not applicable. PEAP is Poverty Eradication Action Plan.
Source: 2004 PEAP; Uganda Bureau of Statistics various years.

26
<<A>>References
AfDB (African Development Bank). 2009. ―Uganda Economic Outlook 2009/10.‖ Africa
Economic Outlook 2009/10. Tunis.
Appleton, S., and S. Ssewanyana. 2004. ―Poverty Estimates from the Uganda National
Household Survey of 2002/03.‖ EPRC
Bank of Uganda. 2009. Annual Report 2008/09. Kampala.
Bevan, D., C. Adam, J. Okidi, and F. Muhumuza. 2003. ―Economic Growth, Investment and
Export Promotion.‖ Paper prepared for Uganda‘s Poverty Eradication Action Plan Revision,
2002/03.
Collier, P., and R. Reinikka. 2001. ―Reconstruction and Liberalization: An Overview.‖ In
Uganda’s Recovery, The Role of Farms, Firms and Government, ed. R. Reinikka and P.
Collier, 15–48. Washington, DC: World Bank.
Dijkstra, A. G., and J. K. Van Donge. 2001.―What Does the ‗Show Case‘ Show? Evidence of
and Lessons from Adjustment in Uganda.‖ World Development 29 (5): 841–63.
EPRC (Economic Policy Research Centre). 2010. Corruption Trends in Uganda: Using Data
Tracking Mechanism. Kampala.
Kappel, R., J. Lay, and S. Steiner. 2005. ―Uganda: No More Pro-poor Growth?‖ Development
Policy Review 23 (1): 27–53.
MFPED (Ministry of Finance Planning and Economic Development). 2009. ―Budget Speech for
Financial Year 2009/2010.‖ Delivered at the Fourth Session of the Eighth Parliament of
Uganda, June 11.
Okidi, J. A., S. Ssewanyana, L. Bategeka, and F. Muhumuza. 2007. ―Uganda‘s Experience with
Operationalising Pro-Poor Growth, 1992–2003.‖ In Delivering on the Promise of Pro-Poor
Growth: Insights and Lessons from Country Experiences, ed. T. Besley and L. J. Cord, 169–
98. Washington, DC: Palgrave Macmillan and World Bank.
Republic of Uganda. 2010. National Development Plan 2010/11–2014/15. Kampala.
Senoga, E., J. M. Matovu, and E. Twimukye. 2009. ―Tax Evasion and Widening the Tax Base in
Uganda.‖ EPRC Research Series 63, Economic Policy Research Centre, Kampala.
Ssewanyana, S. 2009. ―Growth, Inequality, Cash Transfers and Poverty in Uganda.‖ Country
Study 19, International Policy Centre for Inclusive Growth, United Nations Development
Programme, Brasilia. http://www.ipc-undp.org/pub/IPCCountryStudy19.pdf.
———. 2010. ―Combating Chronic Poverty in Uganda: Towards a New Strategy.‖ EPRC
Research Series 67, Economic Policy Research Centre, Kampala.
Ssewanyana, S., and J. A. Okidi. 2007. ―Poverty Estimates from the Uganda National Household
Survey of 2005/06.‖ EPRC Occasional Paper 34, Economic Policy Research Centre,
Kampala.
Uganda Bureau of Statistics. 2010. Uganda National Household Survey 2009/10: Socio-
Economic Module, Abridged Report. Kampala.
____________. 2009. Statistical Abstract. Kampala.

27
World Bank. 2007. ―Uganda, Moving Beyond Recovery: Investment & Behavior Change for
Growth.‖ Country Economic Memorandum Volume II: Overview, Report No. 39221-UG,
Africa Region, Poverty Reduction and Economic Management Unit, Washington, DC.
———. 2009. World Development Indicators 2009. Washington, DC.
———. 2010. World Development Indicators 2010. Washington, DC.
Notes
1. Some reversals in the decline occurred during this period: the share of poor people rose from 34
percent in 1999/200 to 38 percent in 2002/03 (Appleton and Ssewanyana 2004).
2. The program targeted relaxation of marketing infrastructure constraints, production and dissemination
of technology, removal of financial constraints, improvement of land tenure and policy, formation of
farmers organizations, improvement of human resources and information, promotion of on-farm and off-
farm storage, and efforts to reduce environmental degradation and mitigate the effects of HIV/AIDS.
3. Electricity coverage stood at 8 percent of the population in 2009, far below coverage in other low-
income countries, which stands at 35 percent. At 190 meters per square kilometer , the density of roads in
Uganda is much higher than in the average low-income country (where the average is 126 meters per
square kilometer), but the roads are of poor quality, with only 4 percent of the road network paved. Only
26 percent of the railway network in Uganda is functional. Access to improved water stands at 51 percent
of the population, far below the 64 percent for the average of low- income country (Republic of Uganda
2010).
4. Taxing the informal sector could be implemented by taxing small establishments based on
characteristics such as turnover, profits, and location of business.