Embed Size (px)
Citation preview

Building outstanding businessesIP Group plc Half-yearly Report 2013
_0_IPO_ir13.indd 28 9/9/2013 5:21:31 PM
IP Group plc Half-yearly Report 2013
Latest news, share price and other investor information can be found at www.ipgroupplc.com
IP Group plc develops intellectual property- based businesses.Our strategy is to systematically build outstanding businesses based on disruptive intellectual property.
We provide capital to portfolio companies from our balance sheet and also from funds that we manage on behalf of others.
We pioneered the concept of a long-term partnership model with UK universities and now have arrangements covering a number of the country’s leading research-intensive universities.
Half-yearly review
IFC About us
01 Highlights
02 Interim management report
02 Summary
03 Portfolio review
09 Financial and operational review
Financial statements
11 Condensed consolidated statement of comprehensive income
12 Condensed consolidated statement of financial position
13 Condensed consolidated statement of cash flows
14 Condensed consolidated statement of changes in equity
15 Notes to the half-yearly condensed set of financial statements
23 Statement of directors’ responsibilities
24 Independent review report
IBC Directors, secretary and advisers to the Group
Our aims — To identify compelling intellectual property-based opportunities in our key
target sectors
— To develop these opportunities into a diversified portfolio of robust businesses
— To grow our assets and those we manage on behalf of third parties
— To provide our shareholders with quoted access to potentially high growth technology companies
In this report
IP Group plc is referred to as “IP Group”, “the Group” or “the Company”.
Disclaimer: This Half-yearly Report may contain forward-looking statements. These statements reflect the Board’s current view, are subject to a number of material risks and uncertainties and could change in the future. Factors that could cause or contribute to such changes include, but are not limited to, the general economic climate and market conditions, as well as specific factors relating to the financial or commercial prospects or performance of individual companies within the Group’s portfolio of investments.
Throughout this Half-yearly Report the Group’s holdings in portfolio companies reflect the undiluted beneficial equity interest excluding debt, unless otherwise explicitly stated.
_0_IPO_ir13.indd 25 9/9/2013 5:21:31 PM

01IP Group plc Half-yearly Report 2013
Financial statementsHalf-yearly review
Highlights
Financial and operational highlights — Net assets at 30 June 2013: £261.6m (HY12: £250.7m; FY12: £263.1m) — Net cash and deposits at 30 June 2013: £38.1m (HY12: £43.2m;
FY12: £47.9m) — Adjusted profit before tax of £0.5m (HY12: £31.2m; FY12: £46.7m)
excluding £2.5m reduction in fair value of Oxford Equity Rights asset (HY12: £2.5m; FY12: £6.0m)
— Statutory loss before tax of £2.0m (HY12: £28.7m profit; FY12: £40.7m profit)
— New intellectual property commercialisation agreement signed with The University of Manchester
— Launch of £30m IP Venture Fund II in partnership with the European Investment Fund (the “EIF”)
Portfolio highlights — Fair value of investment portfolio: £191.9m (HY12: £171.5m;
FY12: £181.8m) — Value of ten largest holdings: £145.7m (HY12: £132.2m; FY12: £138.2m) — Investment in portfolio companies: £10.8m (HY12: £15.8m;
FY12: £26.3m) — Portfolio realisations: £2.8m (HY12: £0.5m; FY12: £16.7m) — The Group’s portfolio companies raised approximately £55m
of new capital during the period
Post-period-end highlights — Retroscreen Virology Group plc raised gross proceeds of £25.5m
in a July placing — Ceres Power Holdings plc entered a partnership agreement
with South Korea’s KD Navien and announced Philip Caldwell as incoming CEO
— Avacta Group plc completed a £4.7m placing (before expenses) in August
— Net unrealised fair value increase in the Group’s holdings in quoted companies of £13.4m between 30 June 2013 and 20 August 2013
Net assets
£261.6m(HY12: £250.7m)
Net cash and deposits
£38.1m(HY12: £43.2m)
Investment in portfolio
£10.8m(HY12: £15.8m)
Adjusted profit before tax
£0.5m(HY12: £31.2m)
Our partnerships
1
2
3
4
5
6
7
8
9
10
11
1
2
3
43 5
12
6 78 910
11
4
IP Group plc partnerships Glasgow York Leeds Manchester Bristol Bath Oxford King’s College London Queen Mary, London Surrey Southampton
Fusion IP plc partnerships* Sheffield Nottingham Swansea Cardiff
1
2
3
4
* IP Group plc has exposure to spin-outs from Fusion IP plc’s partnerships through its 20.1% holding and co-investment agreement.
_0_IPO_ir13.indd 1 9/9/2013 5:21:31 PM

02 IP Group plc Half-yearly Report 2013
Latest news, share price and other investor information can be found at www.ipgroupplc.com
Interim management report
SummaryIP Group’s core business is to build high-quality companies based on intellectual property, primarily developed at leading research institutions. We aim to take a significant minority equity stake in these companies and then grow the value of our equity by taking an active role in business building.
During the first half of 2013, the Group has continued to support its portfolio both strategically and financially. During the period the Group’s companies raised approximately £55m in total, with the Group providing a total of £10.8m of capital. The underlying performance of the Group’s companies during the period was encouraging and, at 30 June 2013, the value of the Group’s holdings in 70 technology businesses had increased to £191.9m (HY12: £171.5m; FY12: £181.8m).
The AIM market, where the shares of 15 of our companies are quoted, has seen some volatility during 2013. This has been true to a more significant extent for the Group’s holdings in quoted spin-out companies, which experienced a net fair value increase of £12.8m to the date of the Group’s Q1 Interim Management Statement (“IMS”), before decreasing to a net fair value increase of £2.7m at 30 June 2013. Factors that contributed to this reduction included the placings carried out by Retroscreen Virology Group plc and Avacta Group plc during the period, although these reversed during July and August, so contributing to a net fair value increase of £13.4m across the quoted portfolio between the period end and 20 August 2013.
The Group continues to seek to identify compelling IP-based opportunities arising from its current university partnerships. In addition, the Group may source further opportunities from other research-intensive institutions and may selectively explore the possibility of further partnerships or other collaborative arrangements with such institutions.
One such example of the Group selectively increasing its proprietary access to world-class intellectual property during the period was the announcement in February of a new commercialisation agreement with The University of Manchester (“UoM”). UoM is an institution with considerable research pedigree, having been ranked third in the UK in terms of “research power” in the most recent Research Assessment Exercise. The agreement includes a Proof of Principle fund of up to £5m for new projects intended for commercialisation as spin-out companies, with the Group receiving equity stakes in the companies on pre-agreed terms.
The Group’s ability to provide long-term “patient” capital for the purpose of intellectual property commercialisation was enhanced in May when a new £30m venture capital fund, IP Venture Fund II, was established in partnership with the EIF, one of the leading venture capital investors in Europe. The fund will invest alongside the Group in new spin-out companies from the Group’s university partnerships and other collaborations. The fund comprises £30m of capital with a £20m contribution from the EIF and a £10m contribution from the Group. The fund will co-invest with the Group so that the effective investment ratio between IP Group and the EIF will be 4:1 when considering that the Group will also directly provide capital to companies alongside IP Venture Fund II.
During the period Dr Alison Fielding and Professor Graham Richards stepped down from the Group’s Board, in the case of Dr Fielding for personal reasons and in the case of Professor Richards because the length of his tenure as a non-executive director meant that he was no longer regarded as independent from a governance perspective. Dr Fielding and Professor Richards will both remain with the Group on a part-time basis in roles that will enable the Group to continue to leverage their significant expertise.
_0_IPO_ir13.indd 2 9/9/2013 5:21:31 PM
03IP Group plc Half-yearly Report 2013
Financial statementsHalf-yearly review
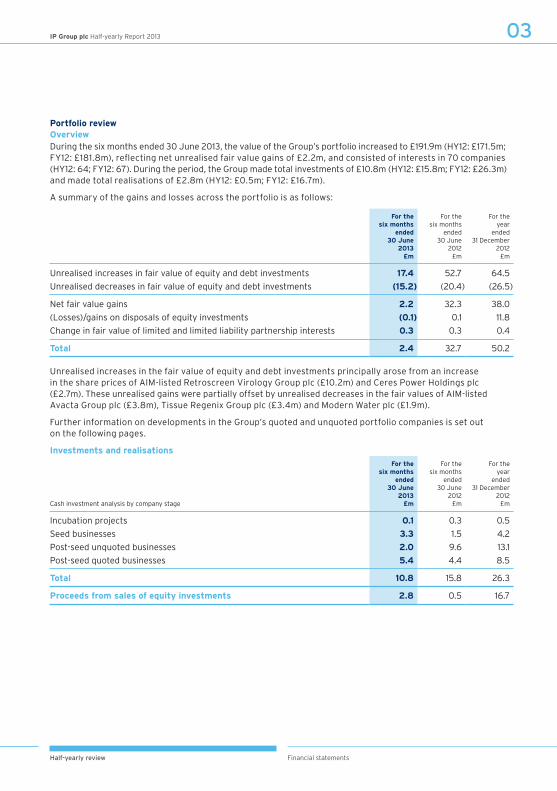
Portfolio reviewOverviewDuring the six months ended 30 June 2013, the value of the Group’s portfolio increased to £191.9m (HY12: £171.5m; FY12: £181.8m), reflecting net unrealised fair value gains of £2.2m, and consisted of interests in 70 companies (HY12: 64; FY12: 67). During the period, the Group made total investments of £10.8m (HY12: £15.8m; FY12: £26.3m) and made total realisations of £2.8m (HY12: £0.5m; FY12: £16.7m).
A summary of the gains and losses across the portfolio is as follows:
For thesix months
ended30 June
2013 £m
For thesix months
ended30 June
2012£m
For theyear
ended31 December
2012£m
Unrealised increases in fair value of equity and debt investments 17.4 52.7 64.5Unrealised decreases in fair value of equity and debt investments (15.2) (20.4) (26.5)
Net fair value gains 2.2 32.3 38.0 (Losses)/gains on disposals of equity investments (0.1) 0.1 11.8Change in fair value of limited and limited liability partnership interests 0.3 0.3 0.4
Total 2.4 32.7 50.2
Unrealised increases in the fair value of equity and debt investments principally arose from an increase in the share prices of AIM-listed Retroscreen Virology Group plc (£10.2m) and Ceres Power Holdings plc (£2.7m). These unrealised gains were partially offset by unrealised decreases in the fair values of AIM-listed Avacta Group plc (£3.8m), Tissue Regenix Group plc (£3.4m) and Modern Water plc (£1.9m).
Further information on developments in the Group’s quoted and unquoted portfolio companies is set out on the following pages.
Investments and realisations
Cash investment analysis by company stage
For thesix months
ended30 June
2013 £m
For thesix months
ended30 June
2012£m
For theyear
ended31 December
2012£m
Incubation projects 0.1 0.3 0.5Seed businesses 3.3 1.5 4.2Post-seed unquoted businesses 2.0 9.6 13.1Post-seed quoted businesses 5.4 4.4 8.5
Total 10.8 15.8 26.3
Proceeds from sales of equity investments 2.8 0.5 16.7
_0_IPO_ir13.indd 3 9/9/2013 5:21:32 PM

04 IP Group plc Half-yearly Report 2013
Latest news, share price and other investor information can be found at www.ipgroupplc.com
Interim management report continued
Portfolio review continuedInvestments and realisations continuedDuring the first half of 2013, the Group deployed £10.8m of capital into 28 distinct portfolio companies and projects (HY12: £15.8m, 25; FY12: £26.3m, 43). The Group provided seed or incubation capital to six opportunities (HY12: four; FY12: eight). The Group realised £2.8m proceeds during the period (HY12: £0.5m; FY12: £16.7m).
The Group continues to support its most promising companies and in doing so has deployed an average level of capital per company of £0.4m during the period. This is largely consistent with the equivalent period in 2012 after those figures are adjusted to exclude the Group’s participation in Oxford Nanopore’s 2012 financing round (HY12: £0.4m, or £0.6m when including that round).
Incubation opportunities comprise businesses or pre-incorporation projects that are generally at a very early stage of development and typically involve investments of less than £0.1m from the Group. Seed businesses are those that have typically received capital of up to £0.5m in total, primarily from the Group, in order to continue to progress towards agreed commercial and technology milestones and to enable the recruitment of management teams and early commercial engagement. Post-seed businesses are those that have received some level of further funding from co-investors external to the Group, with total funding received generally in excess of £0.5m. Of these, post-seed quoted businesses consist of those that are quoted on either AIM or PLUS Markets.
Portfolio analysis – by investment stageAt 30 June 2013, the Group’s portfolio fair value of £191.9m is distributed across investment stage as follows:
As at 30 June 2013 As at 31 December 2012
Fair value Number Fair value Number
Company stage £m % % £m % %
Incubation projects 0.7 — 9 13% 0.5 — 8 12%Seed businesses 14.6 8% 22 31% 9.9 5% 17 25%Post-seed unquoted businesses 86.7 45% 23 33% 86.8 48% 26 39%Post-seed quoted businesses 89.9 47% 16 23% 84.6 47% 16 24%
All portfolio businesses 191.9 100% 70 100% 181.8 100% 67 100%
_0_IPO_ir13.indd 4 9/9/2013 5:21:32 PM
05IP Group plc Half-yearly Report 2013
Financial statementsHalf-yearly review
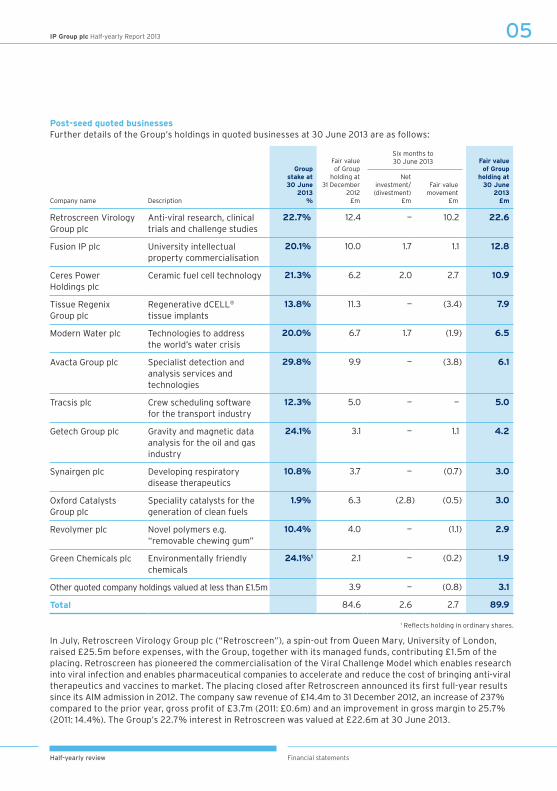
Post-seed quoted businessesFurther details of the Group’s holdings in quoted businesses at 30 June 2013 are as follows:
Company name Description
Groupstake at30 June
2013%
Fair valueof Group
holding at31 December
2012£m
Six months to 30 June 2013 Fair value
of Groupholding at
30 June2013
£m
Netinvestment/ (divestment)
£m
Fair valuemovement
£m
Retroscreen Virology Group plc
Anti-viral research, clinical trials and challenge studies
22.7% 12.4 — 10.2 22.6
Fusion IP plc University intellectual property commercialisation
20.1% 10.0 1.7 1.1 12.8
Ceres Power Holdings plc
Ceramic fuel cell technology 21.3% 6.2 2.0 2.7 10.9
Tissue Regenix Group plc
Regenerative dCELL® tissue implants
13.8% 11.3 — (3.4) 7.9
Modern Water plc Technologies to address the world’s water crisis
20.0% 6.7 1.7 (1.9) 6.5
Avacta Group plc Specialist detection and analysis services and technologies
29.8% 9.9 — (3.8) 6.1
Tracsis plc Crew scheduling software for the transport industry
12.3% 5.0 — — 5.0
Getech Group plc Gravity and magnetic data analysis for the oil and gas industry
24.1% 3.1 — 1.1 4.2
Synairgen plc Developing respiratory disease therapeutics
10.8% 3.7 — (0.7) 3.0
Oxford Catalysts Group plc
Speciality catalysts for the generation of clean fuels
1.9% 6.3 (2.8) (0.5) 3.0
Revolymer plc Novel polymers e.g. “removable chewing gum”
10.4% 4.0 — (1.1) 2.9
Green Chemicals plc Environmentally friendly chemicals
24.1%1 2.1 — (0.2) 1.9
Other quoted company holdings valued at less than £1.5m 3.9 — (0.8) 3.1
Total 84.6 2.6 2.7 89.9
1 Reflects holding in ordinary shares.
In July, Retroscreen Virology Group plc (“Retroscreen”), a spin-out from Queen Mary, University of London, raised £25.5m before expenses, with the Group, together with its managed funds, contributing £1.5m of the placing. Retroscreen has pioneered the commercialisation of the Viral Challenge Model which enables research into viral infection and enables pharmaceutical companies to accelerate and reduce the cost of bringing anti-viral therapeutics and vaccines to market. The placing closed after Retroscreen announced its first full-year results since its AIM admission in 2012. The company saw revenue of £14.4m to 31 December 2012, an increase of 237% compared to the prior year, gross profit of £3.7m (2011: £0.6m) and an improvement in gross margin to 25.7% (2011: 14.4%). The Group’s 22.7% interest in Retroscreen was valued at £22.6m at 30 June 2013.
_0_IPO_ir13.indd 5 9/9/2013 5:21:32 PM

06 IP Group plc Half-yearly Report 2013
Latest news, share price and other investor information can be found at www.ipgroupplc.com
Interim management report continued
Portfolio review continuedPost-seed quoted businesses continuedFusion IP plc (“Fusion IP”), a university IP commercialisation company in which IP Group has a 20.1% holding, raised gross proceeds of £20m through a placing in March. Fusion IP also announced that it signed Memorandum of Understanding (“MOU”) agreements with two additional universities – the University of Nottingham and Swansea University. Fusion IP’s directors believe that by expanding the company’s business model to new universities it will increase its access to additional IP and by raising additional funds it will ensure it has the financial strength to invest further in its key portfolio companies and to establish new companies out of its expanded pipeline. The new MOU agreements allow for co-investment by IP Group, in line with the Group’s existing co-investment agreement.
Ceres Power Holding plc (“Ceres”), an AIM-quoted company developing clean, efficient, cost-effective fuel cell technology for use in distributed generation and other applications, completed a placing and open offer raising gross proceeds of £9.5m in March, in which the Group provided further capital of £2m. The funds raised are intended to take Ceres through its next stage of Original Equipment Manufacturer (“OEM”) engagements and that, following the deployment of these funds, the Ceres core cell and fuel cell module technology platform will be proven to be suitable for product development programmes with several OEMs in multiple geographies. At 30 June 2013, the fair value of the Group’s 21.3% holding in Ceres was valued at £10.9m.
Modern Water plc (“MW”), a company that develops leading water technologies focused on addressing the scarcity of fresh water and the monitoring of water quality, announced in March that it had raised gross proceeds of £10.0m, including £1.7m from the Group. The net proceeds of the placing will enable the company to pursue opportunities to commercialise its forward osmosis technology, particularly across China and the Middle East, and also to grow its monitoring business by licensing and acquiring innovative, proven products to leverage its international distribution network. IP Group’s 20.0% beneficial holding in MW was valued at £6.5m at 30 June 2013.
A number of the Group’s other quoted portfolio businesses have announced positive results, trading updates, transactions and contract wins during the first half of the year:
— Tracsis plc, a leading provider of operational planning software to passenger transport industries, announced in March a recommended cash offer for the entire issued share capital of AIM-quoted Sky High plc, the largest provider of traffic analysis and surveys within the UK, and in April won Small Cap Company of the Year at the 2013 Small Cap Awards. The Group’s 12.3% holding in Tracsis was valued at £5.0m at 30 June 2013.
— In April, Getech Group plc, provider of gravity and magnetic data analysis for the oil and gas industry, announced revenue growth in its half-year results of 24% to £4.0m and a 290% increase in profit before tax to £1.4m. Following a number of significant contract wins, the company then also announced in July that it expected to exceed market expectations for its full-year results.
— In July, Avacta Group plc, which develops detection and analysis technology and services, announced that it had raised gross proceeds of £4.7m primarily to develop its Affimer technology, of which the Group, together with its managed funds, contributed £1.0m. Avacta also announced after the period end that it had extended its commercial collaboration with ForteBio, a division of Pall Life Sciences. Avacta entered into a distribution agreement with ForteBio for the sale of Optim, the company’s protein analysis product, in China, Hong Kong and Taiwan.
_0_IPO_ir13.indd 6 9/9/2013 5:21:32 PM

07IP Group plc Half-yearly Report 2013
Financial statementsHalf-yearly review
Five largest holdings in post-seed unquoted businesses
Company name Description
Groupstake at30 June
2013%
Fair valueof Group
holding at31 December
2012£m
Six months to 30 June 2013 Fair value
of Groupholding at
30 June2013
£m
Netinvestment/ (divestment)
£m
Fair valuemovement
£m
Oxford Nanopore Technologies Limited
Single molecule detection and analysis using nanopore technology
20.3% 66.5 — — 66.5
Xeros Limited “Virtually waterless” washing machines
14.8% 1.4 0.9 0.9 3.2
Crysalin Limited Identifying novel protein structures using crysalins
25.1% 2.5 — — 2.5
Surrey Nanosystems Limited
Silicon-friendly nanomaterials growth process
21.0% 2.3 — — 2.3
Arkivum Limited Digital preservation and management
45.8% 1.9 — — 1.9
Oxford Nanopore Technologies Limited (“Oxford Nanopore”), the Group’s most valuable spin-out company holding, has continued to develop its two novel DNA ”strand sequencing” products, the high-throughput GridION platform and the MinION, a sequencer the size of a USB memory stick. During the period the company announced a series of agreements with leading academic research institutions and Oxford Nanopore now has an intellectual property portfolio of more than 300 issued patents and patent applications in over 80 patent families. The Group is confident in the manner in which Oxford Nanopore is preparing and approaching the market and looks forward to future developments.
In March, Xeros Limited (“Xeros”), the environmentally friendly cleaning company, successfully completed a £10.0m fundraising from new and existing investors, including £0.9m of capital from the Group. The funding will be used to accelerate the roll-out of the Xeros commercial laundry cleaning system and finalise the development of a household system to replace conventional washing machines. In May, Xeros announced that it had partnered with the chemical company BASF to jointly develop polymer beads based on engineering plastics that will increase the cleaning power in laundry applications. This long-term agreement reflects the mutual commitment of the two companies to maximise the commercialisation of the Xeros cleaning system and protect the environment by conserving water and energy. The Group’s 14.8% beneficial holding in Xeros is currently valued at £3.2m.
_0_IPO_ir13.indd 7 9/9/2013 5:21:32 PM

08 IP Group plc Half-yearly Report 2013
Latest news, share price and other investor information can be found at www.ipgroupplc.com
Interim management report continued
Portfolio review continuedPortfolio analysis – by sectorThe Group’s portfolio consists of companies across five key sectors. An analysis of the portfolio by these sectors is as follows:
As at 30 June 2013 As at 31 December 2012
Fair value Number Fair value Number
Sector £m % % £m % %
Medical Equipment & Supplies 112.1 58% 18 26% 107.3 59% 17 25%Energy & Renewables 34.2 18% 15 21% 31.0 17% 14 21%Chemicals & Materials 16.7 8% 14 20% 18.0 10% 14 21%IT & Communications 11.0 6% 12 17% 9.7 5% 12 18%Pharma & Biotech 5.1 3% 9 13% 5.6 3% 8 12%Multiple sectors 12.8 7% 2 3% 10.2 6% 2 3%
191.9 100% 70 100% 181.8 100% 67 100%
A number of the Group’s smaller post-seed businesses have seen further technical and commercial progress during the period, with some completing further financings in which the Group, and/or funds managed by the Group, has participated. By way of example:
— Azuri Technologies Limited, a renewable energy company with award-winning Indigo home solar system technology, announced in July that it had received $1m award from the United States Agency for International Development’s Development Innovation Ventures to support the establishment of pay-as-you-go solar power in Rwanda;
— Anacail Limited, a University of Glasgow spin-out that has prototyped a system to rapidly, safely and temporarily turn some of the oxygen inside sealed food packaging into ozone, a very effective germicide, received milestoned seed funding of £0.75m from the Group and Scottish Enterprise. The system’s effectiveness as a germ-killer can extend food’s shelf-life by at least one extra day, which could help to cut down on the seven million tonnes of food discarded in the UK each year; and
— Perpetuum Limited (“Perpetuum”) announced that it had received an order from Southeastern Railways to supply wireless sensor systems for all 148 of its Electrostar train stock (618 cars). Perpetuum’s world-leading Energy Harvesters enable the self-powered maintenance-free wireless sensors to be fitted in a few minutes without the need for complex retrofit wiring. This new agreement follows the successful installation of Perpetuum sensor systems on a number of Southeastern trains in 2012.
_0_IPO_ir13.indd 8 9/9/2013 5:21:32 PM
09IP Group plc Half-yearly Report 2013
Financial statementsHalf-yearly review
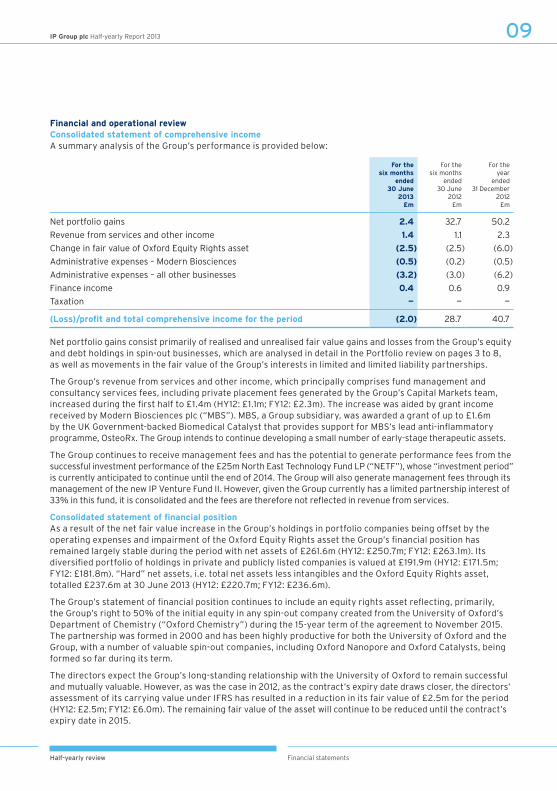
Financial and operational reviewConsolidated statement of comprehensive incomeA summary analysis of the Group’s performance is provided below:
For thesix months
ended30 June
2013 £m
For thesix months
ended30 June
2012£m
For theyear
ended31 December
2012£m
Net portfolio gains 2.4 32.7 50.2Revenue from services and other income 1.4 1.1 2.3Change in fair value of Oxford Equity Rights asset (2.5) (2.5) (6.0)Administrative expenses – Modern Biosciences (0.5) (0.2) (0.5)Administrative expenses – all other businesses (3.2) (3.0) (6.2)Finance income 0.4 0.6 0.9Taxation — — —
(Loss)/profit and total comprehensive income for the period (2.0) 28.7 40.7
Net portfolio gains consist primarily of realised and unrealised fair value gains and losses from the Group’s equity and debt holdings in spin-out businesses, which are analysed in detail in the Portfolio review on pages 3 to 8, as well as movements in the fair value of the Group’s interests in limited and limited liability partnerships.
The Group’s revenue from services and other income, which principally comprises fund management and consultancy services fees, including private placement fees generated by the Group’s Capital Markets team, increased during the first half to £1.4m (HY12: £1.1m; FY12: £2.3m). The increase was aided by grant income received by Modern Biosciences plc (“MBS”). MBS, a Group subsidiary, was awarded a grant of up to £1.6m by the UK Government-backed Biomedical Catalyst that provides support for MBS’s lead anti-inflammatory programme, OsteoRx. The Group intends to continue developing a small number of early-stage therapeutic assets.
The Group continues to receive management fees and has the potential to generate performance fees from the successful investment performance of the £25m North East Technology Fund LP (“NETF”), whose “investment period” is currently anticipated to continue until the end of 2014. The Group will also generate management fees through its management of the new IP Venture Fund II. However, given the Group currently has a limited partnership interest of 33% in this fund, it is consolidated and the fees are therefore not reflected in revenue from services.
Consolidated statement of financial positionAs a result of the net fair value increase in the Group’s holdings in portfolio companies being offset by the operating expenses and impairment of the Oxford Equity Rights asset the Group’s financial position has remained largely stable during the period with net assets of £261.6m (HY12: £250.7m; FY12: £263.1m). Its diversified portfolio of holdings in private and publicly listed companies is valued at £191.9m (HY12: £171.5m; FY12: £181.8m). “Hard” net assets, i.e. total net assets less intangibles and the Oxford Equity Rights asset, totalled £237.6m at 30 June 2013 (HY12: £220.7m; FY12: £236.6m).
The Group’s statement of financial position continues to include an equity rights asset reflecting, primarily, the Group’s right to 50% of the initial equity in any spin-out company created from the University of Oxford’s Department of Chemistry (“Oxford Chemistry”) during the 15-year term of the agreement to November 2015. The partnership was formed in 2000 and has been highly productive for both the University of Oxford and the Group, with a number of valuable spin-out companies, including Oxford Nanopore and Oxford Catalysts, being formed so far during its term.
The directors expect the Group’s long-standing relationship with the University of Oxford to remain successful and mutually valuable. However, as was the case in 2012, as the contract’s expiry date draws closer, the directors’ assessment of its carrying value under IFRS has resulted in a reduction in its fair value of £2.5m for the period (HY12: £2.5m; FY12: £6.0m). The remaining fair value of the asset will continue to be reduced until the contract’s expiry date in 2015.
_0_IPO_ir13.indd 9 9/9/2013 5:21:32 PM
10 IP Group plc Half-yearly Report 2013
Latest news, share price and other investor information can be found at www.ipgroupplc.com
Interim management report continued
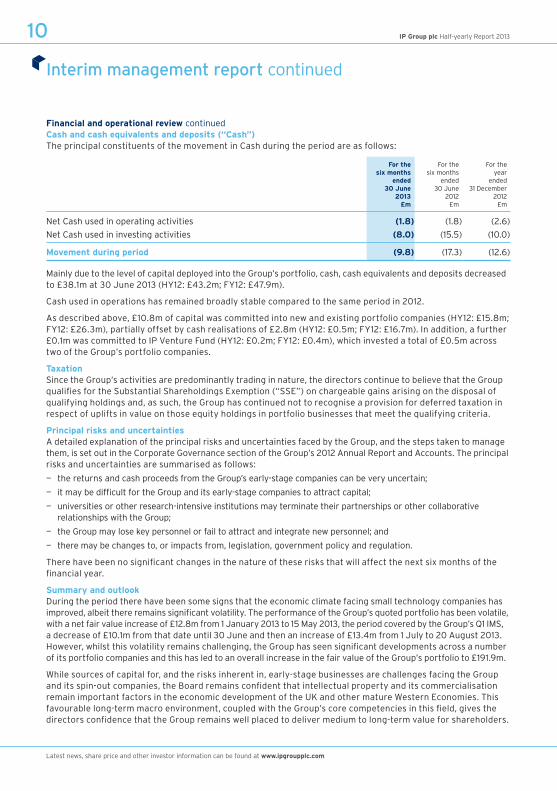
Financial and operational review continuedCash and cash equivalents and deposits (“Cash”)The principal constituents of the movement in Cash during the period are as follows:
For thesix months
ended30 June
2013 £m
For thesix months
ended30 June
2012£m
For theyear
ended31 December
2012£m
Net Cash used in operating activities (1.8) (1.8) (2.6)Net Cash used in investing activities (8.0) (15.5) (10.0)
Movement during period (9.8) (17.3) (12.6)
Mainly due to the level of capital deployed into the Group’s portfolio, cash, cash equivalents and deposits decreased to £38.1m at 30 June 2013 (HY12: £43.2m; FY12: £47.9m).
Cash used in operations has remained broadly stable compared to the same period in 2012.
As described above, £10.8m of capital was committed into new and existing portfolio companies (HY12: £15.8m; FY12: £26.3m), partially offset by cash realisations of £2.8m (HY12: £0.5m; FY12: £16.7m). In addition, a further £0.1m was committed to IP Venture Fund (HY12: £0.2m; FY12: £0.4m), which invested a total of £0.5m across two of the Group’s portfolio companies.
TaxationSince the Group’s activities are predominantly trading in nature, the directors continue to believe that the Group qualifies for the Substantial Shareholdings Exemption (“SSE”) on chargeable gains arising on the disposal of qualifying holdings and, as such, the Group has continued not to recognise a provision for deferred taxation in respect of uplifts in value on those equity holdings in portfolio businesses that meet the qualifying criteria.
Principal risks and uncertaintiesA detailed explanation of the principal risks and uncertainties faced by the Group, and the steps taken to manage them, is set out in the Corporate Governance section of the Group’s 2012 Annual Report and Accounts. The principal risks and uncertainties are summarised as follows:
— the returns and cash proceeds from the Group’s early-stage companies can be very uncertain;
— it may be difficult for the Group and its early-stage companies to attract capital;
— universities or other research-intensive institutions may terminate their partnerships or other collaborative relationships with the Group;
— the Group may lose key personnel or fail to attract and integrate new personnel; and
— there may be changes to, or impacts from, legislation, government policy and regulation.
There have been no significant changes in the nature of these risks that will affect the next six months of the financial year.
Summary and outlookDuring the period there have been some signs that the economic climate facing small technology companies has improved, albeit there remains significant volatility. The performance of the Group’s quoted portfolio has been volatile, with a net fair value increase of £12.8m from 1 January 2013 to 15 May 2013, the period covered by the Group’s Q1 IMS, a decrease of £10.1m from that date until 30 June and then an increase of £13.4m from 1 July to 20 August 2013. However, whilst this volatility remains challenging, the Group has seen significant developments across a number of its portfolio companies and this has led to an overall increase in the fair value of the Group’s portfolio to £191.9m.
While sources of capital for, and the risks inherent in, early-stage businesses are challenges facing the Group and its spin-out companies, the Board remains confident that intellectual property and its commercialisation remain important factors in the economic development of the UK and other mature Western Economies. This favourable long-term macro environment, coupled with the Group’s core competencies in this field, gives the directors confidence that the Group remains well placed to deliver medium to long-term value for shareholders.
_0_IPO_ir13.indd 10 9/9/2013 5:21:32 PM
11IP Group plc Half-yearly Report 2013
Financial statementsHalf-yearly review
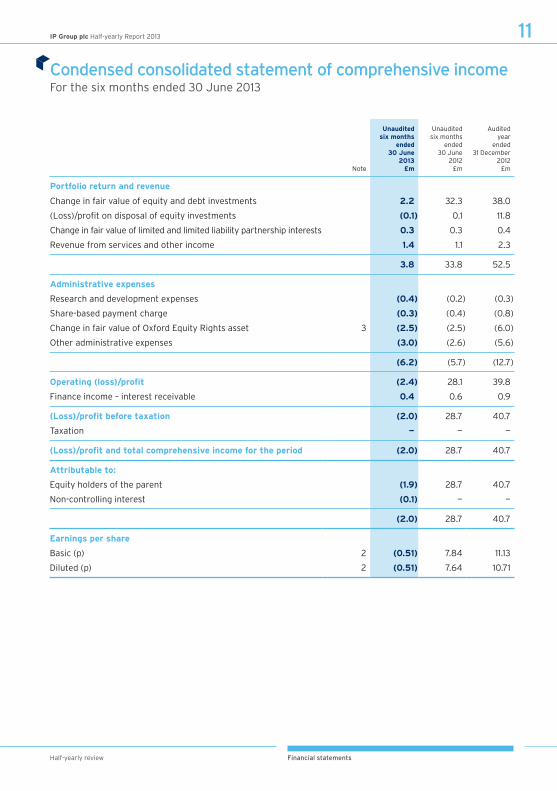
Condensed consolidated statement of comprehensive incomeFor the six months ended 30 June 2013
Note
Unauditedsix months
ended30 June
2013£m
Unauditedsix months
ended30 June
2012£m
Auditedyear
ended31 December
2012£m
Portfolio return and revenue
Change in fair value of equity and debt investments 2.2 32.3 38.0
(Loss)/profit on disposal of equity investments (0.1) 0.1 11.8
Change in fair value of limited and limited liability partnership interests 0.3 0.3 0.4
Revenue from services and other income 1.4 1.1 2.3
3.8 33.8 52.5
Administrative expenses
Research and development expenses (0.4) (0.2) (0.3)
Share-based payment charge (0.3) (0.4) (0.8)
Change in fair value of Oxford Equity Rights asset 3 (2.5) (2.5) (6.0)
Other administrative expenses (3.0) (2.6) (5.6)
(6.2) (5.7) (12.7)
Operating (loss)/profit (2.4) 28.1 39.8
Finance income – interest receivable 0.4 0.6 0.9
(Loss)/profit before taxation (2.0) 28.7 40.7
Taxation — — —
(Loss)/profit and total comprehensive income for the period (2.0) 28.7 40.7
Attributable to:
Equity holders of the parent (1.9) 28.7 40.7
Non-controlling interest (0.1) — —
(2.0) 28.7 40.7
Earnings per share
Basic (p) 2 (0.51) 7.84 11.13
Diluted (p) 2 (0.51) 7.64 10.71
_0_IPO_ir13.indd 11 9/9/2013 5:21:33 PM

12 IP Group plc Half-yearly Report 2013
Latest news, share price and other investor information can be found at www.ipgroupplc.com
Condensed consolidated statement of financial positionAs at 30 June 2013
Note
Unaudited30 June
2013£m
Unaudited30 June
2012£m
Audited31 December
2012£m
ASSETS
Non-current assets
Intangible assets:
– goodwill 18.4 18.4 18.4
Property, plant and equipment 0.2 0.2 0.3
Equity rights and related acquisition costs 3 5.6 11.6 8.1
Portfolio:
– equity investments 4 187.2 167.8 177.9
– debt investments 4 4.7 3.7 3.9
Limited and limited liability partnership interests 4.4 3.8 4.0
Other financial asset 0.7 0.7 0.7
Contingent value rights 1.4 — 1.4
Total non-current assets 222.6 206.2 214.7
Current assets
Trade and other receivables 1.3 1.9 0.9
Deposits 17.5 23.0 32.5
Cash and cash equivalents 20.6 20.2 15.4
Total current assets 39.4 45.1 48.8
Total assets 262.0 251.3 263.5
EQUITY AND LIABILITIES
Equity attributable to equity holders
Called up share capital 7.5 7.3 7.3
Share premium account 150.4 150.4 150.4
Merger reserve 12.8 12.8 12.8
Retained earnings 91.0 80.2 92.6
Total equity attributable to equity holders 261.7 250.7 263.1
Non-controlling interest (0.1) — —
Total equity 261.6 250.7 263.1
Current liabilities
Trade and other payables 0.4 0.6 0.4
Total equity and liabilities 262.0 251.3 263.5
_0_IPO_ir13.indd 12 9/9/2013 5:21:33 PM

13IP Group plc Half-yearly Report 2013
Financial statementsHalf-yearly review
Condensed consolidated statement of cash flowsFor the six months ended 30 June 2013
Unauditedsix months
ended30 June
2013£m
Unauditedsix months
ended30 June
2012£m
Auditedyear
ended31 December
2012£m
Operating activities
(Loss)/profit before taxation (2.0) 28.7 40.7
Adjusted for:
Finance income – interest receivable (0.4) (0.6) (0.9)
Change in fair value of equity and debt investments (2.2) (32.3) (38.0)
Change in fair value of limited and limited liability partnership interests (0.3) (0.3) (0.4)
Depreciation of property, plant and equipment 0.1 — 0.1
Loss/(profit) on disposal of equity investments 0.1 (0.1) (11.8)
Change in fair value of Oxford Equity Rights asset 2.5 2.5 6.0
Share-based payment charge 0.3 0.4 0.8
Other portfolio income (0.1) — —
Changes in working capital:
(Increase)/decrease in trade and other receivables (0.1) (0.5) 0.1
Decrease in trade and other payables — (0.1) (0.3)
Net cash flow from deposits 15.0 27.0 17.5
Operating cash flows:
Interest received 0.3 0.5 1.1
Net cash inflow from operating activities 13.2 25.2 14.9
Investing activities
Purchase of property, plant and equipment — — (0.1)
Purchase of equity and debt investments (10.8) (15.8) (26.3)
Investment in limited and limited liability partnerships (0.1) (0.2) (0.4)
Proceeds from sale of equity investments 2.8 0.5 16.7
Distributions from limited and limited liability partnerships — — 0.1
Other portfolio income received 0.1 — —
Net cash outflow from investing activities (8.0) (15.5) (10.0)
Financing activities
Proceeds from the issue of share capital — — —
Net cash inflow from financing activities — — —
Net increase in cash and cash equivalents 5.2 9.7 4.9
Cash and cash equivalents at the beginning of the period 15.4 10.5 10.5
Cash and cash equivalents at the end of the period 20.6 20.2 15.4
_0_IPO_ir13.indd 13 9/9/2013 5:21:33 PM
14 IP Group plc Half-yearly Report 2013
Latest news, share price and other investor information can be found at www.ipgroupplc.com
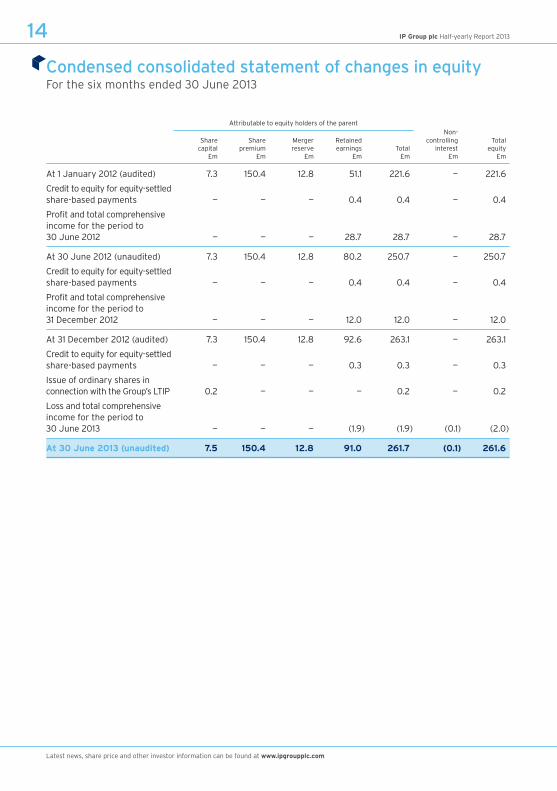
Condensed consolidated statement of changes in equityFor the six months ended 30 June 2013
Attributable to equity holders of the parentNon-
Sharecapital
£m
Sharepremium
£m
Mergerreserve
£m
Retainedearnings
£mTotal
£m
controllinginterest
£m
Totalequity
£m
At 1 January 2012 (audited) 7.3 150.4 12.8 51.1 221.6 — 221.6
Credit to equity for equity-settled share-based payments — — — 0.4 0.4 — 0.4
Profit and total comprehensive income for the period to 30 June 2012 — — — 28.7 28.7 — 28.7
At 30 June 2012 (unaudited) 7.3 150.4 12.8 80.2 250.7 — 250.7
Credit to equity for equity-settled share-based payments — — — 0.4 0.4 — 0.4
Profit and total comprehensive income for the period to 31 December 2012 — — — 12.0 12.0 — 12.0
At 31 December 2012 (audited) 7.3 150.4 12.8 92.6 263.1 — 263.1
Credit to equity for equity-settled share-based payments — — — 0.3 0.3 — 0.3
Issue of ordinary shares in connection with the Group’s LTIP 0.2 — — — 0.2 — 0.2
Loss and total comprehensive income for the period to 30 June 2013 — — — (1.9) (1.9) (0.1) (2.0)
At 30 June 2013 (unaudited) 7.5 150.4 12.8 91.0 261.7 (0.1) 261.6
_0_IPO_ir13.indd 14 9/9/2013 5:21:33 PM
15IP Group plc Half-yearly Report 2013
Financial statementsHalf-yearly review
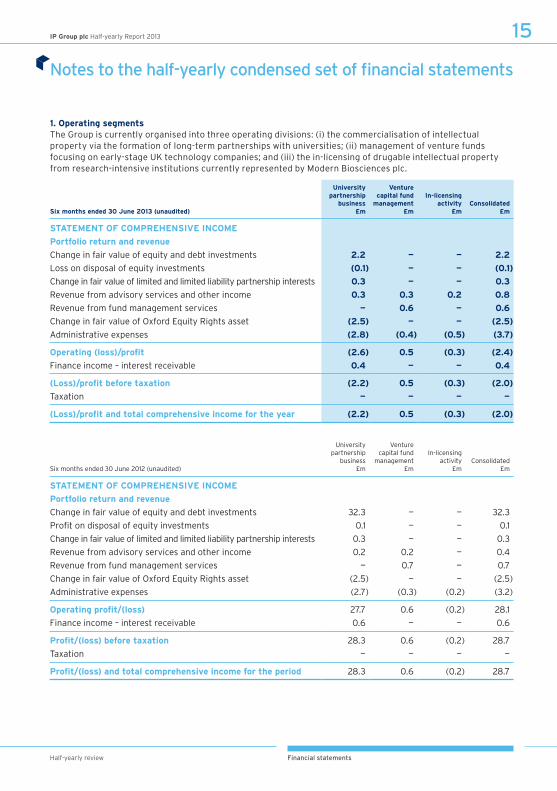
Notes to the half-yearly condensed set of financial statements
1. Operating segmentsThe Group is currently organised into three operating divisions: (i) the commercialisation of intellectual property via the formation of long-term partnerships with universities; (ii) management of venture funds focusing on early-stage UK technology companies; and (iii) the in-licensing of drugable intellectual property from research-intensive institutions currently represented by Modern Biosciences plc.
Six months ended 30 June 2013 (unaudited)
Universitypartnership
business£m
Venturecapital fund
management£m
In-licensingactivity
£mConsolidated
£m
STATEMENT OF COMPrEHENSIVE INCOMEPortfolio return and revenueChange in fair value of equity and debt investments 2.2 — — 2.2Loss on disposal of equity investments (0.1) — — (0.1)Change in fair value of limited and limited liability partnership interests 0.3 — — 0.3Revenue from advisory services and other income 0.3 0.3 0.2 0.8Revenue from fund management services — 0.6 — 0.6Change in fair value of Oxford Equity Rights asset (2.5) — — (2.5)Administrative expenses (2.8) (0.4) (0.5) (3.7)
Operating (loss)/profit (2.6) 0.5 (0.3) (2.4)Finance income – interest receivable 0.4 — — 0.4
(Loss)/profit before taxation (2.2) 0.5 (0.3) (2.0)Taxation — — — —
(Loss)/profit and total comprehensive income for the year (2.2) 0.5 (0.3) (2.0)
Six months ended 30 June 2012 (unaudited)
Universitypartnership
business£m
Venturecapital fund
management£m
In-licensingactivity
£mConsolidated
£m
STATEMENT OF COMPrEHENSIVE INCOMEPortfolio return and revenueChange in fair value of equity and debt investments 32.3 — — 32.3Profit on disposal of equity investments 0.1 — — 0.1Change in fair value of limited and limited liability partnership interests 0.3 — — 0.3Revenue from advisory services and other income 0.2 0.2 — 0.4Revenue from fund management services — 0.7 — 0.7Change in fair value of Oxford Equity Rights asset (2.5) — — (2.5)Administrative expenses (2.7) (0.3) (0.2) (3.2)
Operating profit/(loss) 27.7 0.6 (0.2) 28.1Finance income – interest receivable 0.6 — — 0.6
Profit/(loss) before taxation 28.3 0.6 (0.2) 28.7Taxation — — — —
Profit/(loss) and total comprehensive income for the period 28.3 0.6 (0.2) 28.7
_0_IPO_ir13.indd 15 9/9/2013 5:21:33 PM

16 IP Group plc Half-yearly Report 2013
Notes to the half-yearly condensed set of financial statementscontinued
Latest news, share price and other investor information can be found at www.ipgroupplc.com
1. Operating segments continued
Year ended 31 December 2012 (audited)
Universitypartnership
business£m
Venturecapital fund
management£m
In-licensingactivity
£mConsolidated
£m
STATEMENT OF COMPrEHENSIVE INCOMEPortfolio return and revenueChange in fair value of equity and debt investments 38.0 — — 38.0Profit on disposal of equity investments 11.8 — — 11.8Change in fair value of limited and limited liability partnership interests 0.4 — — 0.4Revenue from advisory services and other income 0.5 0.4 — 0.9Revenue from fund management services — 1.4 — 1.4Change in fair value of Oxford Equity Rights asset (6.0) — — (6.0)Administrative expenses (5.6) (0.7) (0.4) (6.7)
Operating profit/(loss) 39.1 1.1 (0.4) 39.8Finance income – interest receivable 0.9 — — 0.9
Profit/(loss) before taxation 40.0 1.1 (0.4) 40.7Taxation — — — —
Profit/(loss) and total comprehensive income for the year 40.0 1.1 (0.4) 40.7
2. Earnings per shareThe basic earnings per share has been calculated by dividing the loss for the period attributable to equity holders of the parent of £1.9m (HY12: profit £28.7m; FY12: profit £40.7m) by the weighted average number of shares of 369,706,904 in issue during the six-month period ended 30 June 2013 (HY12: 365,763,664; FY12: 365,763,664).
The Group has only one class of potentially dilutive ordinary shares. These are contingently issuable shares arising under the Group Long Term Incentive Plan (“LTIP”). Based upon information available at the end of the reporting period, a portion of the performance criteria for vesting of awards under the LTIP have been satisfied. Consequently, there are 3,257,952 potentially dilutive shares outstanding at the period end.
3. Equity rights and related acquisition costsEquity rights represent consideration paid to the University of Oxford between December 2000 and June 2001. In return for non-refundable, non-interest-bearing advances totalling £20.1m, the Group has the right to receive from the university the following over its 15-year term: 50% of the university’s equity shares in any spin-out company created based on intellectual property created by academics that are considered to be part of the chemistry department (i.e. equity instruments in unlisted companies); and 50% of the university’s share of any cash payments received by the university from parties who have licensed intellectual property created by academics that are considered to be part of the chemistry department. The contract expires on 23 November 2015.
The directors make use of a valuation model to seek to determine the fair value of the asset. However, there is a range of reasonably possible values for each key variable within the model and this in turn results in a wide range of reasonably possible alternative fair values for the asset. None of these estimates of fair value are considered more appropriate or relevant than any other. In order to calculate a more accurate valuation figure given the multitude of possible scenarios generated when altering the discounted cash flows (“DCF”) variables, a probability weighting expected return method is utilised. Having applied probabilities to the various possible scenarios, the method returned an estimated asset value of £5.4m at 30 June 2013.
_0_IPO_ir13.indd 16 9/9/2013 5:21:33 PM

17IP Group plc Half-yearly Report 2013
Financial statementsHalf-yearly review
3. Equity rights and related acquisition costs continuedEquity rights
£m
Contractcosts
£mTotal
£m
At 1 January 2013 7.9 0.2 8.1Change in fair value (2.5) — (2.5)
At 30 June 2013 5.4 0.2 5.6
4. Investment portfolioLevel 1 Level 2 Level 3
Equity investments
in quotedspin-out
companies£m
Equityinvestmentsin unquoted
spin-outcompanies
£m
Unquoteddebt
investmentsin spin-outcompanies
£m
Equityinvestments
in othercompanies
£mTotal
£m
At 1 January 2012 50.0 47.9 3.4 22.5 123.8 Investments during the period 4.3 7.8 1.3 2.3 15.7 Transaction-based reclassifications during the period 1.2 (0.6) (0.9) 0.3 —Other transfers between hierarchy levels during the year — — — — —Disposals during the period (0.4) — — — (0.4)Change in fair value in the period 19.7 25.5 (0.1) (12.7) 32.4
At 30 June 2012 (unaudited) 74.8 80.6 3.7 12.4 171.5Investments during the period 4.2 5.3 1.3 0.2 11.0 Transaction-based reclassifications during the period 2.9 (2.6) (0.3) — — Other transfers between hierarchy levels during the year — (1.6) — 1.6 — Disposals during the period (5.6) — (0.1) (0.2) (5.9)Change in fair value in the period 8.3 4.8 (0.7) (7.2) 5.2
At 31 December 2012 84.6 86.5 3.9 6.8 181.8 Investments during the period 5.4 2.4 2.6 0.4 10.8 Transaction-based reclassifications during the period — 0.9 (1.3) 0.4 —Other transfers between hierarchy levels during the year — — — — —Disposals during the period (2.8) 0.2 — (0.3) (2.9)Change in fair value in the period 2.7 1.0 (0.4) (1.1) 2.2
At 30 June 2013 (unaudited) 89.9 91.0 4.8 6.2 191.9
5. Share capitalUnaudited
30 June 2013
£m
Unaudited30 June
2012£m
Audited31 December
2012£m
Issued and fully paid:375,258,859 ordinary shares of 2p each (HY12: 365,763,664; FY12: 365,763,664) 7.5 7.3 7.3
In April 2013 the Group issued 9,495,195 new ordinary shares with a par value of 2p in order to settle the 2010 LTIP scheme which achieved its vesting conditions and consequently became due to the Group’s employees. The Company has one class of ordinary shares which carry equal voting rights, equal rights to income and distributions of assets on liquidation or otherwise, and no right to fixed income.
_0_IPO_ir13.indd 17 9/9/2013 5:21:34 PM

18 IP Group plc Half-yearly Report 2013
Notes to the half-yearly condensed set of financial statementscontinued
Latest news, share price and other investor information can be found at www.ipgroupplc.com
6. related party transactionsa) Limited partnershipsThe Group manages a number of investment funds structured as limited partnerships. Group entities act as the general partners of these limited partnerships and have the power to exert significant influence over them. The following amounts have been included in respect of these limited partnerships:
Income statement
Unauditedsix months
ended30 June
2013£m
Unauditedsix months
ended30 June
2012£m
Auditedyear
ended31 December
2012£m
Revenue from services 0.6 0.7 1.4
Statement of financial position
Unaudited30 June
2013£m
Unaudited30 June
2012£m
Audited31 December
2012£m
Investment in limited partnerships 3.1 2.6 2.8
b) Key management transactionsThe key management had investments with the following spin-out companies as at 30 June 2013:
Director Company name
Number of shares held
at 1 January2013
Number of shares
acquired/(disposed of)
in the period
Number ofshares heldat 30 June
2013 %
Alan Aubrey Amaethon Limited – A ordinary shares 104 — 104 3.1%Amaethon Limited – B ordinary shares 11,966 — 11,966 1.0%Amaethon Limited – ordinary shares 21 — 21 0.3%Avacta Group plc 20,276,113 — 20,276,113 0.6%Capsant Neurotechnologies Limited 11,631 — 11,631 0.8%Chamelic Limited 26 — 26 0.4%Crysalin Limited 1,447 — 1,447 0.1%EmDot Limited 15 — 15 0.9%Evocutis plc 767,310 — 767,310 0.4%Getech Group plc 15,000 — 15,000 0.1%Green Chemicals plc 108,350 — 108,350 0.8%Icona Solutions Limited 1,674 — 1,674 <0.1%Ilika plc 117,500 — 117,500 0.2%Karus Therapeutics Limited 223 — 223 0.1%Mode Diagnostics Limited 3,226 — 3,226 0.4%Modern Biosciences plc 1,185,150 — 1,185,150 2.1%Modern Water plc 519,269 — 519,269 0.7%Oxford Advanced Surfaces Group plc 2,172,809 — 2,172,809 1.1%Oxford Catalysts Group plc 122,109 (61,279) 60,830 0.1%Oxford Nanopore Technologies Limited 11,442 — 11,442 0.6%Oxtox Limited 25,363 — 25,363 0.3%Pharminox Limited 685 — 685 0.3%Photopharmica (Holdings) Limited1 37,020 — 37,020 1.0%Plexus Planning Limited 1,732 — 1,732 0.8%Retroscreen Virology Group plc 37,160 — 37,160 0.1%
_0_IPO_ir13.indd 18 9/9/2013 5:21:34 PM
19IP Group plc Half-yearly Report 2013
Financial statementsHalf-yearly review
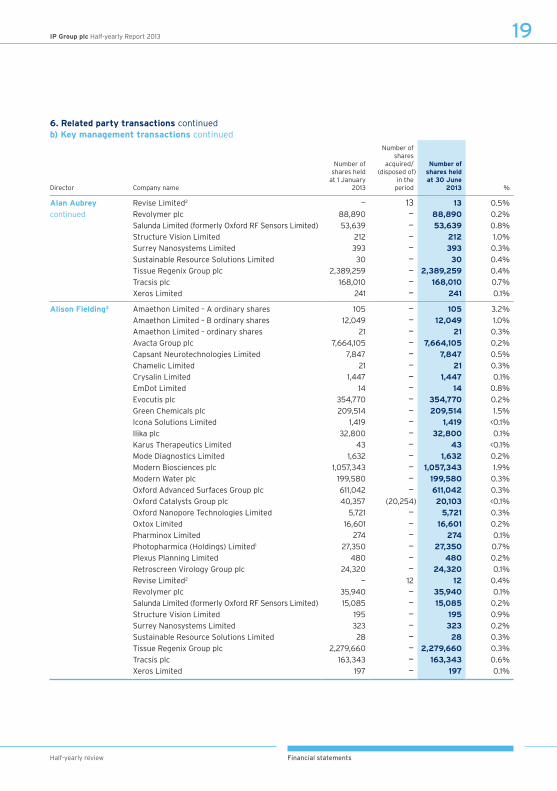
6. related party transactions continuedb) Key management transactions continued
Director Company name
Number of shares held
at 1 January2013
Number of shares
acquired/(disposed of)
in the period
Number ofshares heldat 30 June
2013 %
Alan Aubrey Revise Limited2 — 13 13 0.5%continued Revolymer plc 88,890 — 88,890 0.2%
Salunda Limited (formerly Oxford RF Sensors Limited) 53,639 — 53,639 0.8%Structure Vision Limited 212 — 212 1.0%Surrey Nanosystems Limited 393 — 393 0.3%Sustainable Resource Solutions Limited 30 — 30 0.4%Tissue Regenix Group plc 2,389,259 — 2,389,259 0.4%Tracsis plc 168,010 — 168,010 0.7%Xeros Limited 241 — 241 0.1%
Alison Fielding3 Amaethon Limited – A ordinary shares 105 — 105 3.2%Amaethon Limited – B ordinary shares 12,049 — 12,049 1.0%Amaethon Limited – ordinary shares 21 — 21 0.3%Avacta Group plc 7,664,105 — 7,664,105 0.2%Capsant Neurotechnologies Limited 7,847 — 7,847 0.5%Chamelic Limited 21 — 21 0.3%Crysalin Limited 1,447 — 1,447 0.1%EmDot Limited 14 — 14 0.8%Evocutis plc 354,770 — 354,770 0.2%Green Chemicals plc 209,514 — 209,514 1.5%Icona Solutions Limited 1,419 — 1,419 <0.1%Ilika plc 32,800 — 32,800 0.1%Karus Therapeutics Limited 43 — 43 <0.1%Mode Diagnostics Limited 1,632 — 1,632 0.2%Modern Biosciences plc 1,057,343 — 1,057,343 1.9%Modern Water plc 199,580 — 199,580 0.3%Oxford Advanced Surfaces Group plc 611,042 — 611,042 0.3%Oxford Catalysts Group plc 40,357 (20,254) 20,103 <0.1%Oxford Nanopore Technologies Limited 5,721 — 5,721 0.3%Oxtox Limited 16,601 — 16,601 0.2%Pharminox Limited 274 — 274 0.1%Photopharmica (Holdings) Limited1 27,350 — 27,350 0.7%Plexus Planning Limited 480 — 480 0.2%Retroscreen Virology Group plc 24,320 — 24,320 0.1%Revise Limited2 — 12 12 0.4%Revolymer plc 35,940 — 35,940 0.1%Salunda Limited (formerly Oxford RF Sensors Limited) 15,085 — 15,085 0.2%Structure Vision Limited 195 — 195 0.9%Surrey Nanosystems Limited 323 — 323 0.2%Sustainable Resource Solutions Limited 28 — 28 0.3%Tissue Regenix Group plc 2,279,660 — 2,279,660 0.3%Tracsis plc 163,343 — 163,343 0.6%Xeros Limited 197 — 197 0.1%
_0_IPO_ir13.indd 19 9/9/2013 5:21:34 PM
20 IP Group plc Half-yearly Report 2013
Notes to the half-yearly condensed set of financial statementscontinued
Latest news, share price and other investor information can be found at www.ipgroupplc.com
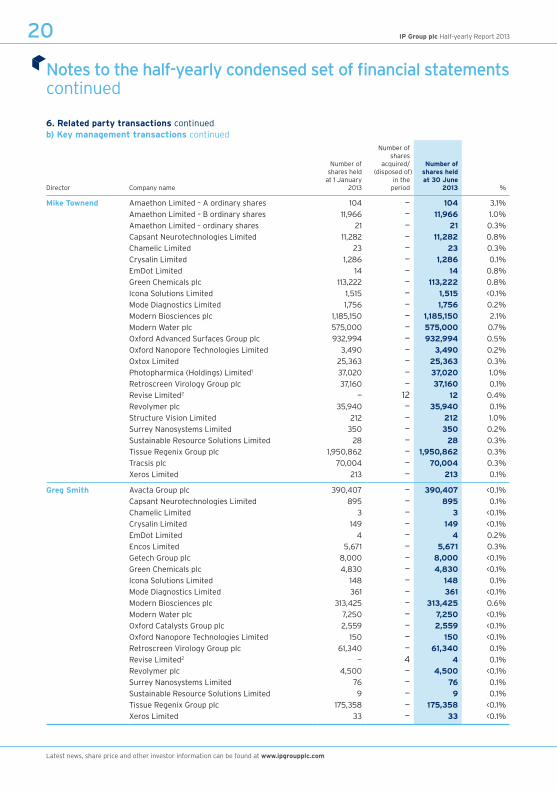
6. related party transactions continuedb) Key management transactions continued
Director Company name
Number of shares held
at 1 January2013
Number of shares
acquired/(disposed of)
in the period
Number ofshares heldat 30 June
2013 %
Mike Townend Amaethon Limited – A ordinary shares 104 — 104 3.1%Amaethon Limited – B ordinary shares 11,966 — 11,966 1.0%Amaethon Limited – ordinary shares 21 — 21 0.3%Capsant Neurotechnologies Limited 11,282 — 11,282 0.8%Chamelic Limited 23 — 23 0.3%Crysalin Limited 1,286 — 1,286 0.1%EmDot Limited 14 — 14 0.8%Green Chemicals plc 113,222 — 113,222 0.8%Icona Solutions Limited 1,515 — 1,515 <0.1%Mode Diagnostics Limited 1,756 — 1,756 0.2%Modern Biosciences plc 1,185,150 — 1,185,150 2.1%Modern Water plc 575,000 — 575,000 0.7%Oxford Advanced Surfaces Group plc 932,994 — 932,994 0.5%Oxford Nanopore Technologies Limited 3,490 — 3,490 0.2%Oxtox Limited 25,363 — 25,363 0.3%Photopharmica (Holdings) Limited1 37,020 — 37,020 1.0%Retroscreen Virology Group plc 37,160 — 37,160 0.1%Revise Limited2 — 12 12 0.4%Revolymer plc 35,940 — 35,940 0.1%Structure Vision Limited 212 — 212 1.0%Surrey Nanosystems Limited 350 — 350 0.2%Sustainable Resource Solutions Limited 28 — 28 0.3%Tissue Regenix Group plc 1,950,862 — 1,950,862 0.3%Tracsis plc 70,004 — 70,004 0.3%
Xeros Limited 213 — 213 0.1%
Greg Smith Avacta Group plc 390,407 — 390,407 <0.1%Capsant Neurotechnologies Limited 895 — 895 0.1%Chamelic Limited 3 — 3 <0.1%Crysalin Limited 149 — 149 <0.1%EmDot Limited 4 — 4 0.2%Encos Limited 5,671 — 5,671 0.3%Getech Group plc 8,000 — 8,000 <0.1%Green Chemicals plc 4,830 — 4,830 <0.1%Icona Solutions Limited 148 — 148 0.1%Mode Diagnostics Limited 361 — 361 <0.1%Modern Biosciences plc 313,425 — 313,425 0.6%Modern Water plc 7,250 — 7,250 <0.1%Oxford Catalysts Group plc 2,559 — 2,559 <0.1%Oxford Nanopore Technologies Limited 150 — 150 <0.1%Retroscreen Virology Group plc 61,340 — 61,340 0.1%Revise Limited2 — 4 4 0.1%Revolymer plc 4,500 — 4,500 <0.1%Surrey Nanosystems Limited 76 — 76 0.1%Sustainable Resource Solutions Limited 9 — 9 0.1%Tissue Regenix Group plc 175,358 — 175,358 <0.1%Xeros Limited 33 — 33 <0.1%
_0_IPO_ir13.indd 20 9/9/2013 5:21:34 PM

21IP Group plc Half-yearly Report 2013
Financial statementsHalf-yearly review
6. related party transactions continuedb) Key management transactions continued
Director Company name
Number of shares held
at 1 January2013
Number of shares
acquired/(disposed of)
in the period
Number ofshares heldat 30 June
2013 %
Charles Winward Amaethon Limited – A ordinary shares 15 — 15 0.5%Amaethon Limited – B ordinary shares 1,766 — 1,766 0.2%Amaethon Limited – ordinary shares 3 — 3 <0.1%Capsant Neurotechnologies Limited 2,264 — 2,264 0.2%Chamelic Limited 3 — 3 <0.1%Crysalin Limited 189 — 189 <0.1%EmDot Limited 5 — 5 0.3%Encos Limited 6,530 — 6,530 0.3%Icona Solutions Limited 376 — 376 0.1%Mode Diagnostics Limited 421 — 421 0.1%Modern Biosciences plc 360,914 — 360,914 0.7%Modern Water plc 12,400 — 12,400 <0.1%Oxford Advanced Surfaces Group plc 156,213 — 156,213 0.1%Oxford Nanopore Technologies Limited 150 — 150 <0.1%Oxtox Limited 3,742 — 3,742 <0.1%Photopharmica (Holdings) Limited1 3,590 — 3,590 0.1%Retroscreen Virology Group plc 66,080 — 66,080 0.2%Revise Limited2 — 4 4 0.1%Revolymer plc 4,500 — 4,500 <0.1%Structure Vision Limited 26 — 26 0.1%Surrey Nanosystems Limited 87 — 87 0.1%Sustainable Resource Solutions Limited 10 — 10 0.1%Tissue Regenix Group plc 482,236 — 482,236 0.1%Tracsis plc 56,500 — 56,500 0.2%Xeros Limited 39 — 39 <0.1%
Graham richards4 Summit Corporation plc 662,958 — 662,958 0.1%Tissue Regenix Group plc 150,000 — 150,000 <0.1%
Bruce Smith Capsant Neurotechnologies Limited 20,724 — 20,724 1.4%Evocutis plc 15,241 — 15,241 <0.1%Getech Group plc 15,000 — 15,000 0.1%iQur Limited 2,000 — 2,000 0.8%Nanotecture Group plc 50,000 — 50,000 0.5%Oxford Catalysts Group plc 10,000 — 10,000 <0.1%Synairgen plc 200,000 — 200,000 0.3%
1 Photopharmica (Holdings) Limited was restructured in 2012 and its trade and assets were transferred to Photopharmica Limited.
2 Revise Limited was demerged from Sustainable Resource Solutions Limited on 6 June 2013.
3 Dr Alison Fielding resigned from the Board on 30 June 2013.
4 Professor Graham Richards resigned from the Board on 14 May 2013.
_0_IPO_ir13.indd 21 9/9/2013 5:21:35 PM

22 IP Group plc Half-yearly Report 2013
Notes to the half-yearly condensed set of financial statementscontinued
Latest news, share price and other investor information can be found at www.ipgroupplc.com
General informationThe comparative financial information presented herein for the year ended 31 December 2012 does not constitute full statutory accounts within the meaning of the Companies Act 2006. The Group’s Annual Report and Accounts for the year ended 31 December 2012 have been delivered to the Registrar of Companies. The Group’s independent Auditors’ report on those accounts was unqualified, did not include references to any matters to which the auditor drew attention by way of emphasis without qualifying their report and did not contain a statement under Section 498(2) or 498(3) of the Companies Act 2006.
Accounting policiesBasis of preparationThe financial information presented in these half-yearly results constitutes the condensed consolidated financial statements of IP Group plc, a company incorporated in Great Britain and registered in England and Wales, and its subsidiaries (together, the “Group”) for the six months ended 30 June 2013.
The condensed consolidated financial statements have been prepared in accordance with IAS 34 Interim Financial Reporting and should be read in conjunction with the Annual Report and Accounts for the year ended 31 December 2012, which have been prepared in accordance with International Financial Reporting Standards as adopted for use in the EU (“IFRS”). The financial information in these half-yearly results, which were approved by the Board and authorised for issue on 21 August 2013, is unaudited but has been subject to a review by the Group’s independent auditor.
The preparation of the half-yearly results requires management to make judgements, estimates and assumptions that affect the application of accounting policies and the reported amounts of assets and liabilities, income and expenses. Estimates and judgements are continually evaluated and are based on historical experience and other factors, such as expectations of future events, and are believed to be reasonable under the circumstances. Actual results may differ from these estimates. In preparing these half-yearly results, the significant judgements made by management in applying the Group’s accounting policies and the key sources of estimation uncertainty were the same as those applied to the audited consolidated financial statements for the year ended 31 December 2012.
Accounting policiesThe accounting policies applied by the Group in these half-yearly results are the same as those applied by the Group in its audited consolidated financial statements for the year ended 31 December 2012 and which will form the basis of the 2013 Annual Report and Accounts. No new standards that have become effective in the period have had a material effect on the Group’s financial statements.
_0_IPO_ir13.indd 22 9/9/2013 5:21:35 PM
23IP Group plc Half-yearly Report 2013
Financial statementsHalf-yearly review
Statement of directors’ responsibilities
The directors confirm to the best of their knowledge that:
a) the half-yearly results have been prepared in accordance with IAS 34 as adopted by the European Union; and
b) the interim management report includes a fair review of the information required by the FCA’s Disclosure and Transparency Rules (4.2.7 R and 4.2.8 R).
The directors of IP Group plc and their functions are listed on the inside back cover.
By order of the Board
Bruce Smith Alan AubreyChairman Chief Executive Officer21 August 2013
_0_IPO_ir13.indd 23 9/9/2013 5:21:35 PM
24 IP Group plc Half-yearly Report 2013
Latest news, share price and other investor information can be found at www.ipgroupplc.com
Independent review reportTo IP Group plc
IntroductionWe have been engaged by the Company to review the condensed set of financial statements in the half-yearly financial report for the six months ended 30 June 2013 which comprises the condensed consolidated statement of comprehensive income, condensed consolidated statement of financial position, condensed consolidated statement of cash flows, condensed consolidated statement of changes in equity and the related notes.
We have read the other information contained in the half-yearly financial report and considered whether it contains any apparent misstatements or material inconsistencies with the information in the condensed set of financial statements.
Directors’ responsibilitiesThe half-yearly financial report is the responsibility of, and has been approved by, the directors. The directors are responsible for preparing the half-yearly financial report in accordance with the Disclosure and Transparency Rules of the United Kingdom’s Financial Conduct Authority.
As stated in the Basis of Preparation, the annual financial statements of the Group are prepared in accordance with International Financial Reporting Standards (“IFRSs”) as adopted by the European Union. The condensed set of financial statements included in this half-yearly financial report has been prepared in accordance with International Accounting Standard 34, Interim Financial Reporting, as adopted by the European Union.
Our responsibilityOur responsibility is to express to the Company a conclusion on the condensed set of financial statements in the half-yearly financial report based on our review.
Our report has been prepared in accordance with the terms of our engagement to assist the Company in meeting its responsibilities in respect of half-yearly financial reporting in accordance with the Disclosure and Transparency Rules of the United Kingdom’s Financial Conduct Authority and for no other purpose. No person is entitled to rely on this report unless such a person is a person entitled to rely upon this report by virtue of and for the purpose of our terms of engagement or has been expressly authorised to do so by our prior written consent. Save as above, we do not accept responsibility for this report to any other person or for any other purpose and we hereby expressly disclaim any and all such liability.
Scope of reviewWe conducted our review in accordance with International Standard on Review Engagements (UK and Ireland) 2410, ‘‘Review of Interim Financial Information Performed by the Independent Auditor of the Entity’’, issued by the Auditing Practices Board for use in the United Kingdom. A review of interim financial information consists of making enquiries, primarily of persons responsible for financial and accounting matters, and applying analytical and other review procedures. A review is substantially less in scope than an audit conducted in accordance with International Standards on Auditing (UK and Ireland) and consequently does not enable us to obtain assurance that we would become aware of all significant matters that might be identified in an audit. Accordingly, we do not express an audit opinion.
ConclusionBased on our review, nothing has come to our attention that causes us to believe that the condensed set of financial statements in the half-yearly financial report for the six months ended 30 June 2013 is not prepared, in all material respects, in accordance with International Accounting Standard 34, as adopted by the European Union, and the Disclosure and Transparency Rules of the United Kingdom’s Financial Conduct Authority.
BDO LLPChartered Accountants and registered AuditorLondon United Kingdom21 August 2013
BDO LLP is a limited liability partnership registered in England and Wales (with registered number OC305127).
_0_IPO_ir13.indd 24 9/9/2013 5:21:35 PM

IP Group plc Half-yearly Report 2013
Directors, secretary and advisers to the Group
Company registration number4204490
registered office 24 Cornhill London EC3V 3ND
Directors Dr Bruce Gordon Smith, CBE (Non-executive Chairman)
Alan John Aubrey (Chief Executive Officer)
Michael Charles Nettleton Townend (Chief Investment Officer)
Gregory Simon Smith (Chief Financial Officer)
Charles Stephen Winward (Managing Director, Top Technology Ventures)
Michael Humphrey (Senior Independent Director)
Francis Adam Wakefield Carpenter (Non-executive Director)
Jonathan Brooks (Non-executive Director)
Company secretary Angela Leach
Brokers Numis SecuritiesThe London Stock Exchange 10 Paternoster Square London EC4M 7LT
registrars Capita registrars LimitedThe Registry 34 Beckenham Road Beckenham Kent BR3 4TU
Bankersroyal Bank of ScotlandPO Box 333 Silbury House 300 Silbury Boulevard Milton Keynes MK9 2ZF
Solicitors Pinsent MasonsCityPoint One Ropemaker Street London EC2Y 9AH
Independent auditor BDO LLP55 Baker Street London W1U 7EU
Fully recyclable and biodegradableFully recyclable andbiodegradable
Printed on Evolution 100 Business Offset, which is made from 100% recycled de-inked post consumer waste. Certified as a 100% FSC uncoated paper. Fully recyclable and biodegradable.
_0_IPO_ir13.indd 26 9/9/2013 5:21:35 PM

IP Group plc24 Cornhill London EC3V 3ND
T +44 (0)845 074 2929 F +44 (0)845 074 2928
www.ipgroupplc.com
_0_IPO_ir13.indd 27 9/9/2013 5:21:35 PM