Embed Size (px)
Citation preview

R E A L E S T AT E C L A S S
APR I L 25 , 2012
BUILDING PROSPEROUS PLACES IN
MICHIGAN: UNDERSTANDING
PLACEMAKING VALUES,
PERCEPTIONS AND BARRIERS

LAND POLICY INSTITUTE
• Became a Program in CANR in 2004, and a formal Institute in 2006. Created by Dr. Soji Adelaja.
• Partnering with the School of Planning, Design and
Construction, with Dr. Scott Witter as Interim Director.
• Housed on third floor of Manly Miles Building.
• Has a strong focus on research and outreach based on
economic analysis of policy options in many contemporary issue areas.
• Please see our website for more information:
www.landpolicy.msu.edu.
PRESENTATION OUTLINE
• Overview of Placemaking
• Value of Placemaking Elements
• Perceptions and Barriers
• Policy Implications
• Further Research and Outreach
Presenter:
Mary Beth Graebert

WHAT IS PLACEMAKING?
“Placemaking” is defined as:
. . . the development or redevelopment of a place, within a
neighborhood or community, that uniquely creates a
functional space with a variety of uses, that is appealing to a wide range of people and that has an identifiable
character, or “sense of place.”

PLACEMAKING ELEMENTS
• Mixed-use development (i.e., live upstairs,
entertainment & shopping downstairs);
• Pedestrian-orientation (e.g., sidewalks, paths and
other foot-based connections);
• Opportunities for social activity and engagement
(e.g., outdoor seating, community festivals, farmers’
markets, meeting spaces, etc.);
• Arts, cultural and other entertainment opportunities
(e.g., museums, galleries, funhouses, bowling alleys,
bars, etc.);

PLACEMAKING ELEMENTS
• Alternative transportation choices (e.g., walking,
biking, transit, etc.);
• Public spaces (e.g., squares, streetscapes, plazas,
etc.);
• Green/open spaces (e.g., parks, trails, playgrounds,
etc. where people can walk, bike, play, socialize,
etc.);
• Diverse housing choices (e.g., workforce housing,
affordable housing, townhomes, etc.); and/or
• Green building (e.g., green roofs, rain gardens,
energy efficiency, etc.).
WHY PLACEMAKING IS IMPORTANT NOW
• Our “places” are built upon the Old Economy paradigm, where uses are separated, people are auto-dependent, and infrastructure is outdated and inefficient.
• In the New Economy, the precursors to growth (e.g., talent, entrepreneurship, knowledge industries) are attracted to communities that are enhanced through placemaking.
• Other places have learned to respond to this changing paradigm in the built environment choices they offer.
• Michigan and the Rust Belt states have not shifted quickly enough to this new mindset to have a critical mass of these places to attract growth.

GOAL OF THIS INITIATIVE
Our goal is to help Michigan
and other Rust Belt states to
catch up to and surpass other
successful places in their ability
to build placemaking projects
that attract growth through the
transformation of policies,
removal of barriers, education
of appropriate stakeholders,
and creation of incentives.

MODEL OF CHANGE INTERVENTION
Research Action Agents Impact on
Action Agents
Document studies on the
value of placemaking
Hedonic analysis of the
value gap in placemaking
Survey of developers,
banks, local officials, and
state agencies on barriers
to placemaking
Institutional and legal
analysis of regulatory
frameworks
Case studies on
placemaking in Michigan
Developers
Banks
Local Officials
Legislators
Housing Agencies
Economic Dev’t
Organizations
Environmental
Groups
New valuable opportunities
Security in financing green
development, with some intangibles
Tax base enhancement, quality
livable environment
Reducing policy impediments
(barriers) to green development
Incentivizing placemaking in
workforce housing developments
Promotion of new places, new
opportunities for economic dev’t
Encouraging sustainable practices in
the housing sector.

PROS AND CONS TO PLACEMAKING
Under traditional development projects, the majority of the
benefit is concentrated towards one stakeholder; with
placemaking, the benefits are often shared (Leinberger & Kozloff,
2003).
Placemaking creates a sense of place for community members,
which encourages community engagement and participation in the
development process (Wyckoff, 2010).
Some communities harbor NIMBY (Not in My Back Yard) mentality
toward placemaking and want to maintain traditional zoning
structures that encourage socioeconomic segregation and
separation of housing and retail.

WORKFORCE HOUSING CONSIDERATIONS
• Placemaking encourages housing provision in densely populated urban
centers in order to not only increase social equity, but secure access to
resources, a viable workforce and reduce environmental degradation
(Arigoni, 2001; Crowe, 2004).
• Some researchers argue that smart growth principles (which are embedded
in placemaking) inevitably increase housing prices and reduce affordability
(Demographia, 2008).
• Certain methods can be used to maintain housing affordability:
• Land use and planning strategies that intentionally secure affordable housing
(Arigoni, 2001)
• Inclusionary zoning (Haughey, 2002)
• Subsidies for developers and/ or consumers (Arigoni, 2001)

STUDY COMPONENTS
• Hedonic Analysis of Three Michigan Communities:
• Lansing
• Traverse City
• Royal Oak
• Placemaking Surveys of:
• Michigan Financial Institutions
• Michigan Developers
• Michigan Local Governments

HEDONIC ANALYSIS
• Purpose: Determine whether or not placemaking features like walkability and mixed uses are associated with higher home prices.
• Case Study of 3 Michigan Communities:
• Lansing
• Traverse City
• Royal Oak

HEDONIC PRICING METHOD
• The hedonic pricing method (HPM) can show
us how much more people are willing to pay
for a house that has certain features, all else
remaining equal.
• HPM has traditionally focused on home and lot
attributes to determine the value of a home.
• As the hedonic pricing method has evolved,
more data has become available to use for
analysis such as proximity features (i.e. nearby
parks, entertainment establishments, and
schools).

CONCEPTUAL FRAMEWORK
(ST) Structural and Temporal
Date of sale
Year built
Square footage
Bedrooms
Full baths
Half baths
Condominium
Stories
Heating fuel/AC
Exterior type
Basement square ft.
Porch area
Deck area
Garage area
Fireplaces
Acreage
Frontage
Depth
(N)Neighborhood Attributes
Income diversity
Educational Attainment
Racial diversity
Age diversity
Median household income
Neighborhood Enterprise Zone
Renaissance Zone
Area mixed use
(P)Proximity Features
Distance to interstate
Distance to rivers
Distance to lakes
Distance to parks
Distance to schools
Distance to downtown
SPi =α+ STβ + Nγ + Pτ + Eρ + ε (E) Establishments Nearby
Arts, entertainment and recreation business within ¼, ½, and 1 mile
Food service and drinking places within ¼, ½, and 1 mile
Retail businesses within ¼, ½, and 1 mile
Employment within 1 mile

DATA UTILIZED IN THE ANALYSIS
• Structural and Temporal
• Assessor’s data (e.g., sale price, building and lot characteristics)
• Neighborhood Attributes
• Census Socioeconomic and demographic data (e.g., income, race, age, poverty, education)
• Proximity Features
• Municipal and other Spatial data (e.g., parcel layers, land use, natural features, roads) • Municipalities and ESRI
• Establishments Nearby
• Business establishment data (e.g., employment, businesses, entertainment, retail) • National Establishment Time Series Database from Walls and Associates
• Dun and Bradstreet registered companies


• Largest study city by both population and area.
• Michigan’s Capital.
• Close proximity to Michigan State University.
• 114,297 people (2010 census) and 36 square miles of land.
• Population density of 3,175 people per square mile.
• Median household income for 2009 was $35,774.
LANSING CASE STUDY
Category 1 All Sold Properties $500 – $1,188,250
Category 2 Workforce <$179,000
Category 3 Affordable <$89,000

WHEN DID HOME SALES PEAK IN LANSING?

LANSING: SALES INFO & LOT ATTRIBUTES
• Study included 3,334 observations (home sales), with an R2
of 0.748 and 3,183 degrees of freedom.
• Peak year of sales was 2006, which coincided with the
industry sales. We are back to 2000 prices (our base year)
by 2010.
• Sales in cold months are lower, relative to summer months,
when people are more likely to move.
• Older properties have better values, but not by much, about
$24 per year older. This is also reflective of the fact that
Lansing has an older housing stock.
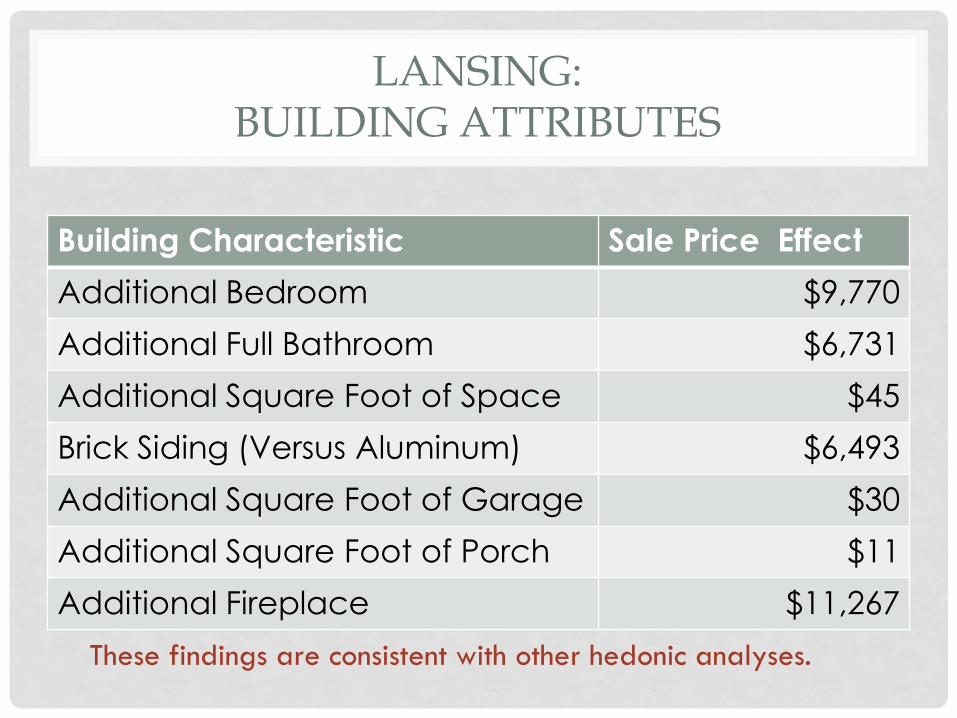
LANSING: BUILDING ATTRIBUTES
Building Characteristic Sale Price Effect
Additional Bedroom $9,770
Additional Full Bathroom $6,731
Additional Square Foot of Space $45
Brick Siding (Versus Aluminum) $6,493
Additional Square Foot of Garage $30
Additional Square Foot of Porch $11
Additional Fireplace $11,267
These findings are consistent with other hedonic analyses.

LANSING: NEIGHBORHOOD DEMOGRAPHICS
Neighborhood Characteristics Sale Price Effect
Within Neighborhood Enterprise Zone ($18,635)
Within Renaissance Zone $48,590
% Increase in Population that Graduated
from High School $1,358
% Increase in Population with an
Associate’s Degree
$1,000
% Increase in Population with a graduate/professional degree
$1,506
Percent Increase in Income-Diversity Index $513

HOW WOULD YOU EXPECT PROXIMITY TO THE FOLLOWING TO AFFECT HOME PRICES:
RIVERS? HIGHWAY? A SCHOOL?
MSU?

LANSING: COMMUNITY ATTRIBUTES
Community Characteristic –
One Additional Foot Closer to . . .
Sale Price Effect
Highway ($5)
Rivers $9
Downtown $21
Michigan State University $5
Michigan Avenue ($13)
Old Town ($9)
Middle School $1
High School $2

HOW WOULD YOU EXPECT TO THE FOLLOWING TO
AFFECT HOME PRICES: GROCERY STORES?
RESTAURANTS? BARS?

LANSING: COMMUNITY ATTRIBUTES (CONTINUED)
Community Characteristic Sale Price Effect
Additional Grocery Store within ¼ mile ($3,125)
Additional Full-Service Restaurant within ¼ mile $3,499
Additional Drinking Establishment within ¼ mile ($4,440)
Additional Sporting Goods Store within ½ to 1
mile
$2,748
Additional Book/Periodical/Music Store within
½ to 1 mile
$2,009
Additional Performing Arts Facility within ¼ mile $12,545
Additional Amusement Park/Arcade within ¼ mile
($8,688)
Additional Percentage of Commercial Space
within ½ mile
$709

Lack of qualitative measures for many variables.
For example, a park within proximity of a home may be nice or possibly unsafe.
Distances to amenities and other features were measured as the crow flies, and not along roadways.
Results for the three study
areas are not comparable
as there was varying data
availability for each city.
HEDONIC MODEL LIMITATIONS

PERCEPTIONS & BARRIERS SURVEYS
• Purpose: Identify perceptions about placemaking among key stakeholder groups and barriers that impede the ability to incorporate placemaking elements into Michigan’s built environment.
• Generated 3 Surveys:
• Local Government Officials (20 responses)
• Financial Institutions (16 responses)
• Developers (11 responses)

PLACEMAKING PERCEPTION
Please indicate your degree of agreement with the following statement:
“Supporting placemaking, as described above, needs to be an important
part of Michigan strategies to enhance property values and create high-
impact economic activity attraction.”
a. Strongly agree
5%
b. Agree 65%
c. Neutral/Not
sure 25%
d. Disagree 5%
Bankers
a. Strongly agree 23%
b. Agree 38%
c. Neutral/Not sure 31%
d. Disagree 8%
Developers

PLACEMAKING PERCEPTION
Please indicate your level of agreement or disagreement with the following
statements: "Incorporating placemaking elements in the design of new development
in our community...
is necessary for retaining/attracting population."
Strongly Agree 59%
Agree 27%
Neither Agree Nor Disagree
5% Disagree 9%
is necessary for retaining/attracting businesses."
Local Units of Government
Strongly Agree 68%
Agree 18%
Neither Agree Nor Disagree
5% Disagree 9%

PLACEMAKING COST/RISK BARRIERS
“Placemaking projects tend to be more expensive to produce than traditional development, but the long-term benefits outweigh the higher upfront
costs.”
All else being equal, how risky do you consider placemaking developments to be compared to more conventional developments?
a. Very risky 21%
b. Somewhat risky 32%
c. Neutral/Not sure 42%
d. Not very risky 5%
Bankers
a. Strongly agree 15%
b. Agree 39%
c. Neutral/Not sure 31%
d. Disagree 15%
Developers

PLACEMAKING COST/RISK BARRIERS
Please indicate your level of agreement or disagreement with the following
statements: "Incorporating placemaking elements in the design of new development
in our community...
Local Units of Government
is often hindered by
the lack of
financing."
Strongly Agree 41%
Agree 45%
Neither Agree Nor Disagree
9%
Disagree 5%

PLACEMAKING EXPERIENCE
…have you led or been involved in
any developments that have
incorporated placemaking features?
a. Yes 69%
b. No 23%
c. Not sure 8%
Developers
…has your financial institution financed or
been involved in the process to finance
developments that incorporate
placemaking elements?
a. Yes 30%
b. No 70%
Bankers

PLACEMAKING EXPERIENCE
…has your community had, or been
involved in, any developments/
projects that would be considered
placemaking development?
a. Yes 80%
b. No 20%
If yes, for how many years have
placemaking elements been incorporated
into development in your community?
a. Less than 1 year 12%
b. 1-2 years 19%
c. 3-5 years 19%
d. 6-10 years 25%
e. 11-20 years 6%
f. More than 21 years 19%
Local Units of Government

0
2
4
6
8
10
12
a. T
ax b
reak
s/re
nai
ssan
ce z
on
es
b. B
row
nfi
eld
tax
cre
dit
s
c. T
ax in
crem
ent
fin
anci
ng
d. S
tate
su
bsi
dy
pro
gram
s
e. B
ette
r in
form
atio
n f
or
loca
lgo
vern
men
ts, f
inan
cial
inst
itu
tio
ns,
dev
elo
per
s, r
ealt
ors
an
d c
itiz
ens
abo
ut
pla
cem
akin
g ec
on
om
ic a
nd
qu
alit
y…
f. O
ther
1-Very important
2-Important
3-Neutral/neither importantnor unimportant
4-Not important
5-Not important at all
How do you view the importance of the following
actions in creating a development environment in
Michigan that is more conducive to placemaking?
Developers
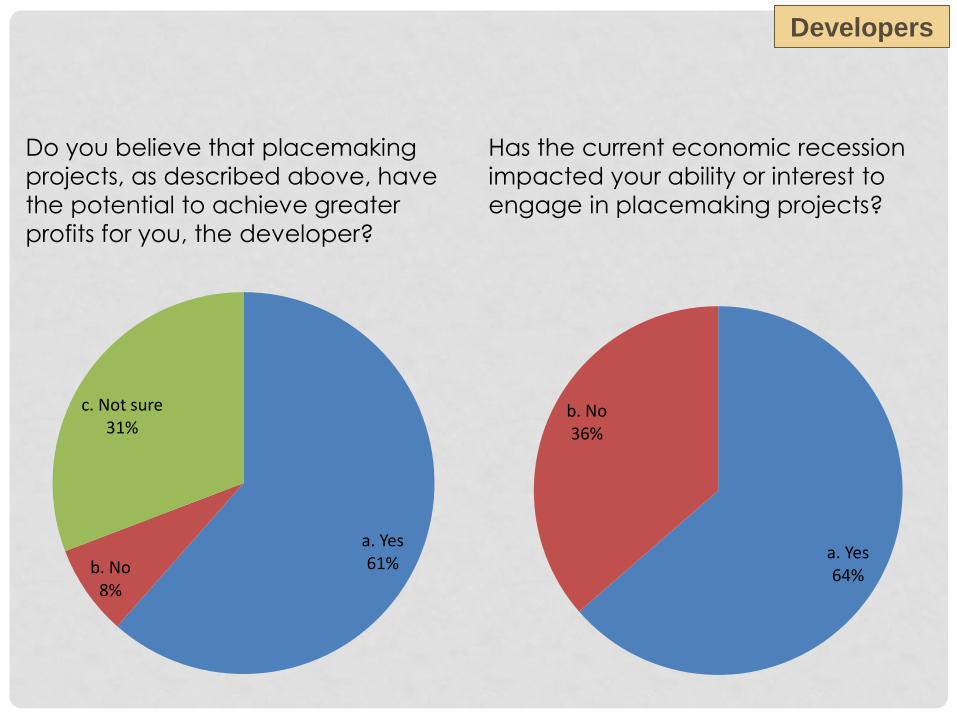
a. Yes 64%
b. No 36%
Do you believe that placemaking
projects, as described above, have
the potential to achieve greater
profits for you, the developer?
a. Yes 61% b. No
8%
c. Not sure 31%
Has the current economic recession
impacted your ability or interest to
engage in placemaking projects?
Developers Developers

Do you feel that there is a lessening demand for “sprawl”
products (greenfield, low density development farther out
from central services), and a growing demand for denser,
mixed use, infill development?
a. Yes 46%
b. No 36%
c. Not sure 18%
Developers Developers

How often are the following placemaking elements
incorporated into, or considered in, your
development projects?
In nearly all development
projects 10% In a majority of
development projects
10%
In very few development
projects 60%
Almost never 10%
Not sure or does not
apply 10%
Workforce/ Affordable Housing
Developers Developers

Please indicate your level of agreement or disagreement with
the following statements:
Bankers
“Having access to more tools, data, or
knowledge showing benefits would influence my decision to lend financing for a placemaking project.”
“Having access to a placemaking checklist or toolkit would enable better communication, valuation and understanding of the benefits of placemaking between my institution and developers.”
Strongly Agree 11%
Agree 72%
Neither Agree Nor Disagree
5%
Disagree 6% Strongly
Disagree 6%
Strongly Agree 22%
Agree 50%
Neither Agree Nor Disagree
17%
Disagree 11%
Bankers
Please indicate your level of agreement or
disagreement with the following statements:
Bankers
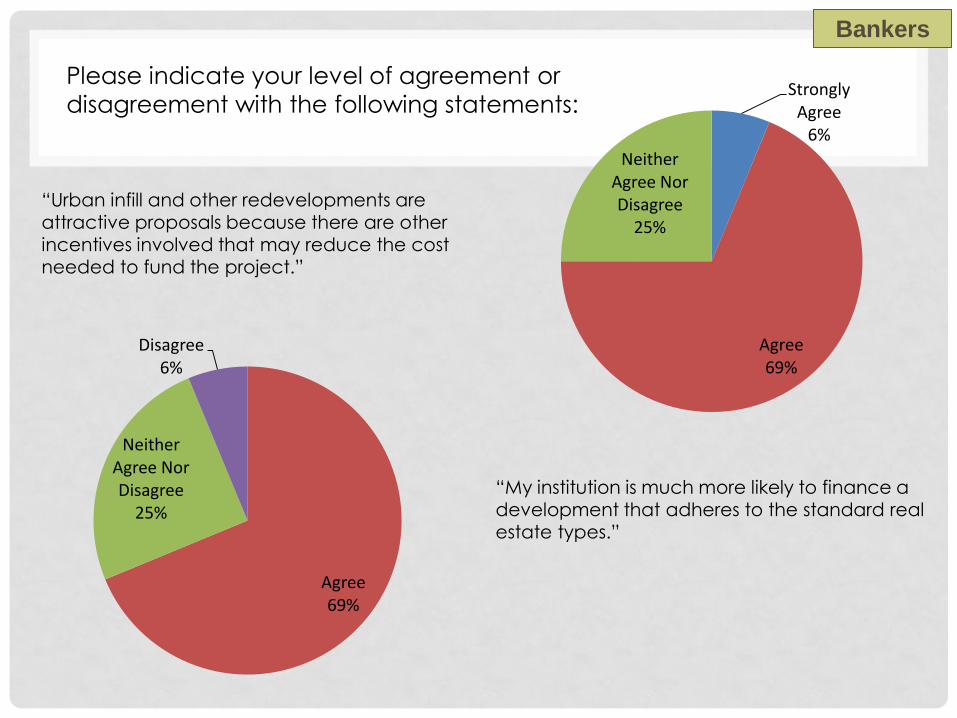
“Urban infill and other redevelopments are attractive proposals because there are other incentives involved that may reduce the cost needed to fund the project.”
“My institution is much more likely to finance a development that adheres to the standard real estate types.”
Agree 69%
Neither Agree Nor Disagree
25%
Disagree 6%
Strongly Agree
6%
Agree 69%
Neither Agree Nor Disagree
25%
Bankers

Please indicate your level of agreement or
disagreement with the following statements:
Bankers
“My institution has changed its lending procedures and/or requirements in an effort to more readily respond to alternative or placemaking developments.”
Agree 12%
Neither Agree Nor Disagree
13%
Disagree 75%
Bankers
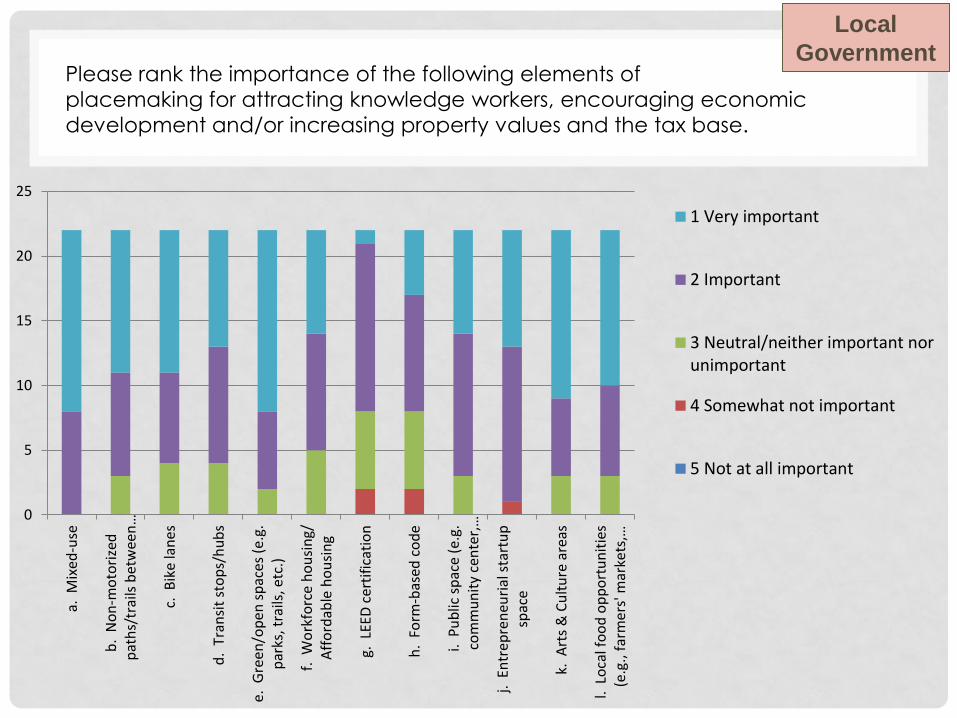
Please rank the importance of the following elements of
placemaking for attracting knowledge workers, encouraging economic
development and/or increasing property values and the tax base.
Local
Government
0
5
10
15
20
25
a. M
ixed
-use
b.
No
n-m
oto
rize
dp
ath
s/tr
ails
bet
wee
n…
c. B
ike
lan
es
d.
Tran
sit
sto
ps/
hu
bs
e. G
reen
/op
en s
pac
es (
e.g.
par
ks, t
rails
, etc
.)
f. W
ork
forc
e h
ou
sin
g/A
ffo
rdab
le h
ou
sin
g
g. L
EED
cer
tifi
cati
on
h.
Form
-bas
ed c
od
e
i. P
ub
lic s
pac
e (e
.g.
com
mu
nit
y ce
nte
r,…
j. E
ntr
epre
neu
rial
sta
rtu
psp
ace
k. A
rts
& C
ult
ure
are
as
l. L
oca
l fo
od
op
po
rtu
nit
ies
(e.g
., f
arm
ers'
mar
kets
,…
1 Very important
2 Important
3 Neutral/neither important norunimportant
4 Somewhat not important
5 Not at all important
Local
Government

Does your community currently have zoning ordinances
that would impede the development or inclusion of
these placemaking elements?
Local
Government
0
2
4
6
8
10
12
14
16
18
20
a. M
ixed
-use
b.
No
n-m
oto
rize
d p
ath
s/tr
ails
bet
wee
n r
esid
enti
al,
com
mer
cial
an
d r
etai
l use
s
c. B
ike
lan
es
d.
Tran
sit
sto
ps/
hu
bs
e. G
ree
n/o
pen
sp
aces
(p
arks
,tr
ails
)
f. W
ork
forc
e h
ou
sin
g/A
ffo
rdab
le h
ou
sin
g
g. L
EED
cer
tifi
cati
on
h.
Form
-bas
ed c
od
e d
esig
n
i. P
ub
lic s
pac
e (
such
as
com
mu
nit
y ce
nte
r, c
ou
rtya
rd,
etc
.)
j. E
ntr
epre
neu
rial
sta
rtu
psp
ace
k. A
rts
& C
ult
ure
are
as
l. L
oca
l Fo
od
op
po
rtu
nit
ies
(su
ch a
s fa
rmer
s' m
arke
ts,
foo
d s
tan
ds)
Yes
No
Not Sure
Local
Government

How would you describe the level of public
participation in proposed new developments in your
community?
Local
Government
No public participation (community members do not attend public
meetings on new developments).
26%
Some public participation on a
regular basis. 16%
Lots of participation on controversial
development/projects. 58%
Local
Government

SURVEY SUMMARY
• Low sample sizes
• Results are anecdotal and do not represent these
groups across the state
• Many “neutral/not sure” responses
• Placemaking appears to be a nebulous term
• But there was support among bankers for a
checklist/toolkit
• Even though anecdotal, we think these responses
help us understand the barriers to and
perceptions of placemaking

PLACEMAKING EXAMPLES
• Campus Martius, Detroit, Michigan • Green, public space & recreational opportunities
• Attracted big employer: Compuware
• Stadium District, Lansing, Michigan • Mixed-use development across from Cooley Stadium
• Walkable to downtown, restaurants, museums
• Kingsbury Place, Walker, Michigan • Affordable housing
• Michigan Green Communities project – LEED
• Durant Hotel, Flint, Michigan • Redevelopment of historic property
• Lofts and commercial space in downtown area

CAMPUS MARTIUS, DETROIT

DURANT HOTEL, FLINT

KINGSBURY PLACE, WALKER
Affordable, Accessible Homes

CONCLUSIONS
• It appears that some placemaking elements—including proximity to certain types of retail and green space—are associated with higher home values in at least 3 Michigan communities.
• A majority of respondents from the placemaking stakeholder groups—developers, bankers, and local government officials—seem to recognize the importance of placemaking for economic development.
• Barriers to placemaking—such as restrictive zoning, capital access and perceptions about density—appear to still exist in Michigan communities.

POLICY CONSIDERATIONS
• Different cities in our analysis showed different marginal effects of placemaking features => Regional visioning and community values should be taken into consideration in placemaking projects for success.
• Surveys indicate that there are perceived barriers between stakeholder groups and that informational programs about implementation strategies for placemaking projects would be beneficial => State and regional programs that educate stakeholders about placemaking and encourage public-private partnerships are needed in Michigan communities.

POLICY CONSIDERATIONS (CONTINUED)
• Some communities in Michigan, like Lansing, appear to have an abundance of affordable housing for the workforce, while others, like Royal Oak, may not have enough => Placemaking projects should keep in mind that adding features that improve quality of life can make housing unaffordable for certain population segments.
• Eighty-eight percent of respondents in the banking survey indicated that loan assistance programs, supplemental funding and expedited permitting that reduce development costs factor into favorable lending terms => State and regional programs that “de-risk” placemaking for developers and financers are more likely to get off the ground.
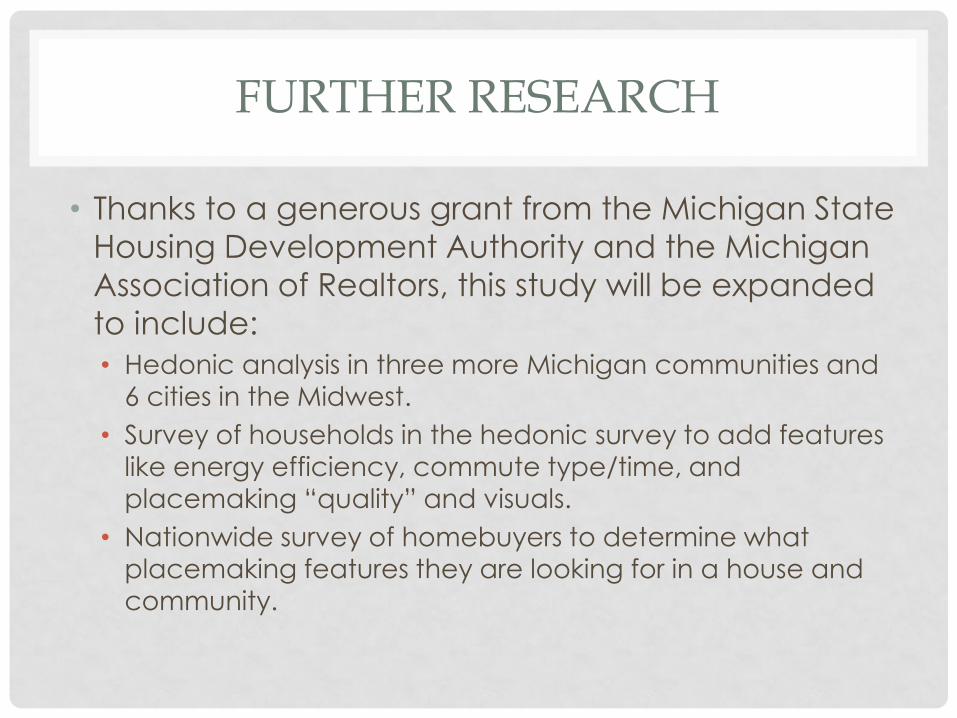
FURTHER RESEARCH
• Thanks to a generous grant from the Michigan State
Housing Development Authority and the Michigan
Association of Realtors, this study will be expanded
to include:
• Hedonic analysis in three more Michigan communities and
6 cities in the Midwest.
• Survey of households in the hedonic survey to add features
like energy efficiency, commute type/time, and
placemaking “quality” and visuals.
• Nationwide survey of homebuyers to determine what
placemaking features they are looking for in a house and community.

EXTRA SLIDES

ACKNOWLEDGEMENTS
This initiative was made possible by grants from the National Association of Realtors Ira Gribin Workforce Housing Program, the National Association of Realtors Smart Growth Program; and support from the Michigan Association of Realtors, the W.K. Kellogg Foundation, the Michigan State Housing Development Association, the Michigan State University Land Policy Institute, and the MSU Office of the John A. Hannah Distinguished Professor in Land Policy.
Final Report released in March 2012!

PROJECT TEAM
• Soji Adelaja, MSU Land Policy Institute
• Gilbert M. White, Realtor and Developer
• Chris Leinberger, Brookings Institution
• Robin Boyle, Wayne State University
• Richard Jelier, Grand Valley State University
• Mark Wyckoff, MSU Land Policy Institute
• Mary Beth Graebert, MSU Land Policy Institute
• John Warbach, MSU Land Policy Institute
• Melissa Gibson, MSU Land Policy Institute
• Ben Calnin, MSU Land Policy Institute
• Tyler Borowy, MSU Land Policy Institute

ADVISORY COMMITTEE
• Michigan Association of Realtors
• Michigan State Housing Development Authority
• Michigan Association of Home Builders
• Michigan Bankers Association
• Michigan Municipal League
• Michigan Economic Development Corporation
• Michigan Environmental Council
• Council of Michigan Foundations
• Small Business Association of Michigan
• Michigan Suburbs Alliance

• Traverse City is nestled on Grand Traverse Bay in the northwestern region of the Lower Peninsula.
• Population growing approximately 12% from 2000 to 2010
(Grand Traverse County).
• Traverse City is the smallest case study city, with an area of only
8.4 square miles (of land) and a population of 14,674 people.
• Population density of the city is 1,743 people per square mile,
which makes it the least dense case study city.
• Traverse City’s median household income for 2009 was $39,327.
LAND POLICY INSTITUTE
TRAVERSE CITY CASE STUDY
Category 1 All Sold Properties $25,000 - $2,900,000
Category 2 Workforce <$210,000
Category 3 Affordable <$105,000

TRAVERSE CITY: SALES INFO & LOT ATTRIBUTES
• Study included 1,212 observations (home sales), with an R2 of
0.852.
• Peak year of sales was 2008. The years 2002 and 2009 saw
lower priced sales.
• Sales in spring are lower, relative to summer months, when
people are more likely to move.
• Older properties are associated with lower values, about
$2,279 per year older. This is the opposite finding from the
Lansing case study.

TRAVERSE CITY: BUILDING ATTRIBUTES
Building Characteristic Sale Price Effect
Additional Bedroom $54,784
Additional Square Foot of Space $128
Vinyl Siding (Versus Aluminum) ($40,674)
Additional Fireplace $22,265

TRAVERSE CITY: NEIGHBORHOOD DEMOGRAPHICS
Neighborhood Characteristics Sale Price Effect
Additional $1 in Median Household
Income within Census Block Group (2005-
2009)
$1.77
% Increase in Poverty Level within Census Tract (2005-2009)
($162)
% Increase in Population with an
Associate’s Degree
$350
% Increase in Population with a Bachelor’s
Degree
$165
% Increase in Population with a
graduate/professional degree
($142)

TRAVERSE CITY: COMMUNITY ATTRIBUTES
Community Characteristic Sale Price Effect
One Foot Closer to Great Lakes Bay $24
Additional Home Furnishings Store within ½
to 1 mile
$12,439
Additional Building Material/ Gardening Equipment Supplier within ¼ mile
($31,416)
Additional Grocery Store within ¼ to ½
mile
$21,456
Additional Drinking Establishment within ¼
to ½ mile
($28,487)
Additional Religious Organization within ¼ to ½ mile
($13,551)

• Inner-ring suburb of Detroit
• 57,236 people and an area of 11.8 square miles,
• 4,850.5 people per square mile and makes it the densest
case study city.
• Royal Oak is known to feature many placemaking
attributes, some of which relate to its proximity to Detroit.
• median household income for 2009 was $54,754.
LAND POLICY INSTITUTE
ROYAL OAK CASE STUDY
Category 1 All Sold Properties $20,000 - $844,120
Category 2 Workforce <$295,000
Category 3 Affordable <$147,000

ROYAL OAK: SALES INFO & LOT ATTRIBUTES
• Study included 7,112 observations (home sales), with an R2 of
0.952.
• Peak year of sales was 2004. There was a steep drop
between 2007 and 2008.
• Sales in winter and fall are lower, relative to summer months,
when people are more likely to move.
• Older properties are associated with lower values, but only by
about $84 per year older. This is the opposite finding from the
Lansing case study.

ROYAL OAK: BUILDING ATTRIBUTES
Building Characteristic Sale Price Effect
Additional Bedroom $14,129
Additional Full Bathroom $27,637
Additional Square Foot of Space $45
Presence of Garage $18,857

ROYAL OAK: NEIGHBORHOOD DEMOGRAPHICS
Neighborhood Characteristics Sale Price Effect
One Point Increase in Income Diversity
Index
$470
One Point Increase in Racial Diversity ($264)
% Increase in Poverty Level within Census
Tract (2005-2009)
($546)
% Increase in Population with a Bachelor’s
Degree
$883
% Increase in Population with a graduate/professional degree
$1,341
% Increase in Population Aged 5-17 ($39,613)

ROYAL OAK: COMMUNITY ATTRIBUTES
Community Characteristic Sale Price Effect
Additional Motor Vehicle & Parts Dealer
within ¼ mile
$3,655
Additional Home Furnishings Store within ¼ to ½ mile
$2,738
Additional Building Material/ Gardening
Equipment Supplier within ¼ mile
($3,675)
Additional Grocery Store within ¼ mile ($3,200)
Additional Gas Station within ¼ mile ($6,052)
Additional Book/Periodical/Music Store within ¼ to ½ mile
$2,796
Additional Full-Service Restaurant within ¼
to ½ mile
$1,018

WORKFORCE & AFFORDABLE HOUSING
• Objective: To determine whether placemaking elements had different values in workforce and affordable housing.
• Workforce housing = housing priced at 60% to 120% of median household income (HUD).
• Affordable housing = housing priced at 30% or less of median household income.
• The hedonic model was run using all houses (Category 1), houses between 60-120% of median household income (Category 2), and houses below 60% median household income (Category 3).

WORKFORCE HOUSING IMPLICATIONS
• Houses in the “affordable” categories for the workforce and low-income population (less than 120% of median household income) often had hedonic price impacts in the same direction (positive or negative), though not always.
• For instance, proximity to health stores, limited-service restaurant and religious organizations were associated with higher values for workforce housing in Lansing.
• Examples of placemaking projects that have successfully incorporated workforce housing: • Miller’s Court in Baltimore, Maryland
• New Pennley Place in Pittsburgh, Pennsylvania
• Noji Gardens in Seattle, Washington
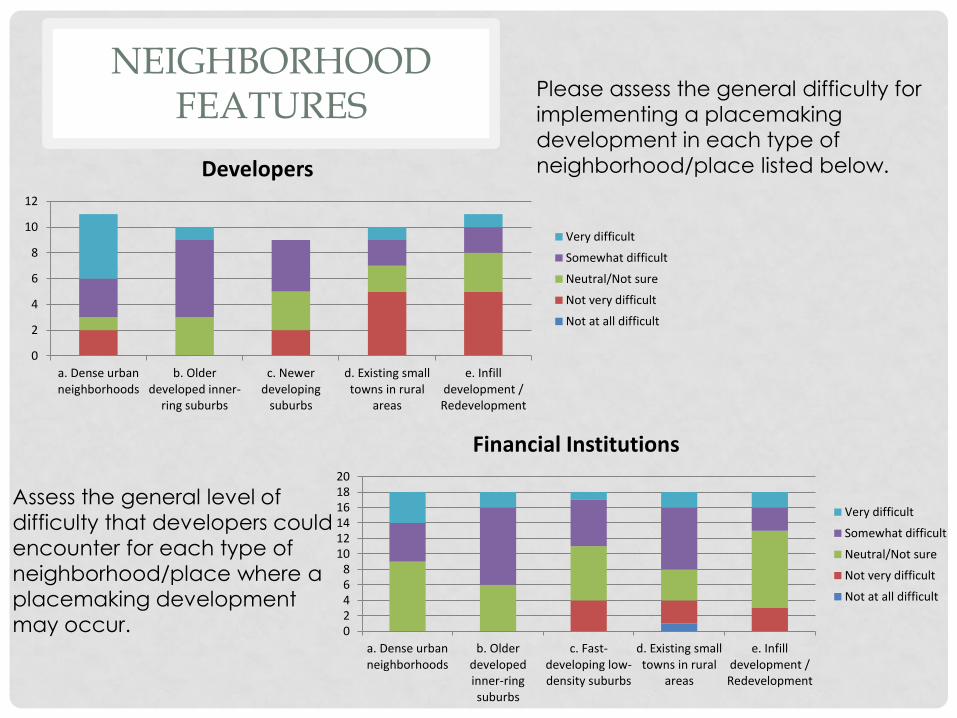
NEIGHBORHOOD FEATURES
Please assess the general difficulty for
implementing a placemaking
development in each type of
neighborhood/place listed below.
0
2
4
6
8
10
12
a. Dense urbanneighborhoods
b. Olderdeveloped inner-
ring suburbs
c. Newerdeveloping
suburbs
d. Existing smalltowns in rural
areas
e. Infilldevelopment /Redevelopment
Developers
Very difficult
Somewhat difficult
Neutral/Not sure
Not very difficult
Not at all difficult
02468
101214161820
a. Dense urbanneighborhoods
b. Olderdevelopedinner-ringsuburbs
c. Fast-developing low-density suburbs
d. Existing smalltowns in rural
areas
e. Infilldevelopment /Redevelopment
Financial Institutions
Very difficult
Somewhat difficult
Neutral/Not sure
Not very difficult
Not at all difficult
Assess the general level of
difficulty that developers could
encounter for each type of
neighborhood/place where a
placemaking development
may occur.

In your opinion, please rate the importance of the following
elements of placemaking to enhancing the market value of
a particular development project.
Workforce/ Affordable housing
Very important
10%
Important 40%
Neutral/ neither important nor unimportant
20%
Not important 20%
Not important at
all 10%
Developers Developers

For a hypothetical placemaking development project that
would maximize your profits and meet local/state
regulations, what portion of the development site would be
devoted to:
Developers
0
2
4
6
8
10
12
less than 10%
10-25%
25-50%
50-75%
greater than 75%
Developers

Please indicate your level of
agreement or disagreement with
the following statements:
Bankers
Strongly Agree 61%
Agree 39%
“The latest recession has greatly affected my/our institution’s lending terms and
practices.”
Bankers

Some placemaking projects have been identified as being
“long-term,” which means carrying costs may not be
absorbed for 10 years or so. How important are tax credits
and other abatements in easing this financial challenge?
Bankers
Very important 47%
Somewhat important
37%
Does not matter 16%

Please indicate your level of agreement or
disagreement with the following statements:
Bankers
“Loan assistance programs, public financing, tax credits, grants or other supplemental funding mechanisms that reduce development costs influence my institution’s decision to lend."
“Processes, such as expedited permitting or development fast-track approvals that would reduce a project’s timeline would help make lending decisions easier.”
Strongly Agree 19%
Agree 69%
Neither Agree Nor Disagree
12%
Strongly Agree 25%
Agree 69%
Neither Agree Nor Disagree
6%
Bankers
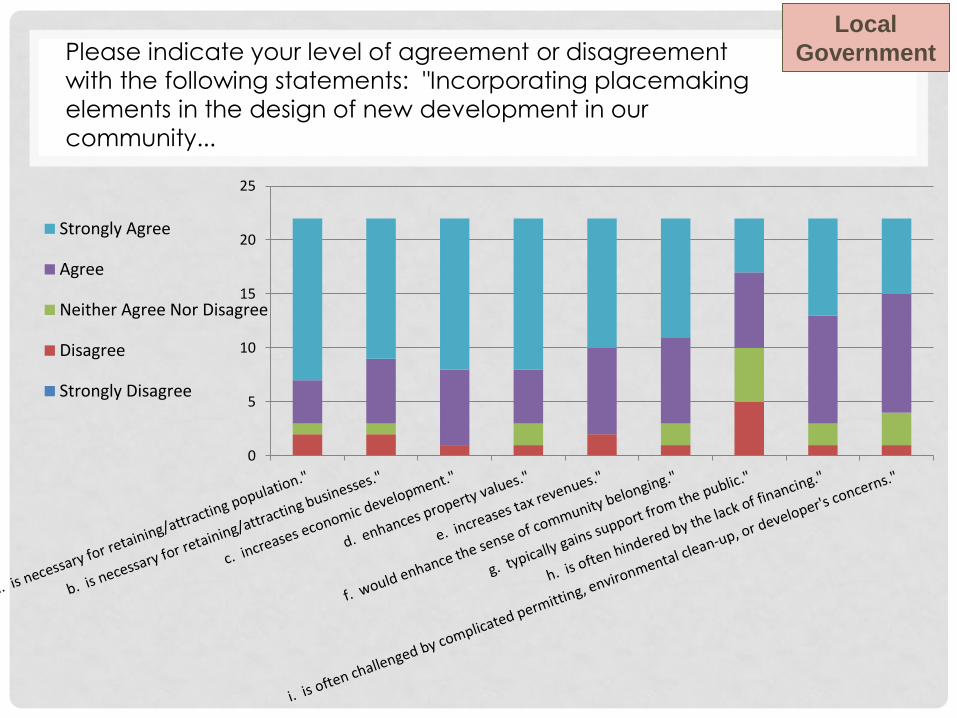
Please indicate your level of agreement or disagreement
with the following statements: "Incorporating placemaking
elements in the design of new development in our
community...
Local
Government
0
5
10
15
20
25
Strongly Agree
Agree
Neither Agree Nor Disagree
Disagree
Strongly Disagree