Embed Size (px)
Citation preview

BUILDING VALUE TOGETHER

The end-of-life for materials can often be the start of something new. That’s why we work not only to manage waste responsibly, but also to collaborate with our stakeholders to find ways to create new value—together.
About this reportWaste Management is committed to consistent public disclosure and discussion of ourprogress through the publication of our Sustainability Report. We are taking a new approach to reporting by publishing content in two different formats to further enhance reporting transparency: our annual Sustainability Report details the progress on our most material issues over the past year and is now available as an interactive website and PDF. Complementing our report is a new Environmental, Social and Governance (ESG)Resource Hub that houses easily accessible, detailed information and data related to many aspects of our ESG performance, policies and initiatives, as well as an archive of past reports and updates to recent initiatives.
BUILDING VALUE TOGETHER
Go online to view our full report.

Waste Management At-A-Glance (as of and for the year ended December 31, 2019)
Waste Management, Inc. (NYSE: WM), based in Houston, Texas, is the leading provider of comprehensive waste management environmental services in North America.
44.9Kemployees
11construction and demolition
recycling facilities
14bale/transfer/buy-back/dedicated customer processing facilities
Recycling Facilities
2dual stream recycling
facilities
4CORe® organics
processing facilities
36composting/chipping/
grinding facilities
46single-stream recycling
facilities
30commercial/paper only
recycling facilities
302transfer facilities
244active solid waste landfills
Landfills and Transfer Facilities
5active hazardous waste
landfills
Operations
97landfill gas-to-electricity
facilities
27landfill gas-to-fuel
facilities
Energy
8,924alternative fuel vehicles
145natural gas fueling
stations
217active habitat, species and education certified projects
17,917acres actively managed for
wildlife preservation
Environmental Conservation
79certified wildlife habitat
programs
63pollinator programs
Environmental Education
393,478people, including K-12 youth and college students, participated in
Waste Management-hosted education and community betterment activities
$1.6Min-kind services
donated
Community Vitality
3,496community events hosted and/or participated
in by Waste Management
$14.8Mdonated in
charitable giving$1.8B
capital expenditures
$15.5Btotal revenue
Financial
$1.1Breturned to shareholders
$3.9Bcash from operations
Impact
Note: Waste Management, Inc. is a holding company, and all operations are conducted by its subsidiaries. References to “Waste Management,” “the Company” or “WM” refer to Waste Management, Inc. and its consolidated subsidiaries, unless context provides otherwise.
People
2

Waste Management 2020 Executive Summary | sustainability.wm.com
3
CEO MessageThe past year has been a time of awakening to the many challenges we face as a society. From the COVID-19 pandemic, to growing calls for racial justice, to the continued urgency of the climate crisis, it’s clearer than ever that our lives are interconnected—and that understanding and collaboration are the right way forward.
When Waste Management faces difficult times, we respond and work to recover and become stronger than before. As the coronavirus crisis began to unfold, we reacted swiftly, taking care of employees with strong safety protocols and financial assurance. We took care of customers by continuing our waste and recycling collection services without interruption, supplying an essential feedstock for markets that use recycled material to produce the products and packages that we rely on each day.
Likewise, in the aftermath of the death of George Floyd in Minneapolis, Waste Management’s Inclusion and Diversity staff activated a series of dialogues and programs to further inclusivity among all employees, and to facilitate constructive discussions in our workplaces. We will continue to establish new cultural norms and to ensure consistent practices around education and equity, with goals established to guide this effort. I’ve always been proud of Waste Management’s People First culture, and that’s never been more true than in recent months.
Amidst all of these crises, we haven’t lost sight of our essential role in protecting the environment and contributing to a circular economy. As of the fall of 2020, we are processing a growing volume of residential recyclables, we continue to reduce our fleet emissions, and we are
creating value from waste at our landfills to generate clean, renewable energy. Record investments in our recycling infrastructure and fleet will help us continue on this path.
As you read our 2020 Sustainability Report, I hope you see a thoughtful, mature yet progressive company with a balanced approach to our social and environmental commitments—one with management systems in place, a track record of environmental investment and processes, and a commitment to our people. Close partnerships among our employees, customers, suppliers, community partners and others have made it possible.
In spite of trying times, our Commitments & Values have not changed. We are the same company with the same dedication, always working for a sustainable tomorrow. As we continue to build value, I’m optimistic about what the future holds.
Jim FishPresident and Chief Executive Officer
In spite of trying times, our Commitments & Values have not changed. We are the same company with the same dedication, always working for a sustainable tomorrow. As we continue to build value, I’m optimistic about what the future holds.
Watch Jim Fish’s interview with Fortune Magazine.

Waste Management 2020 Executive Summary | sustainability.wm.com
4
2019 Corporate Leadership Award—Employee Engagement, Wildlife Habitat Council
2020 World’s Most Ethical Companies, Ethisphere Institute
2019 Sector Leader, Dow Jones Sustainability Index
2020 Sustainability Yearbook, Gold Class, S&P Global
2020 World’s Most Admired Companies, Fortune Magazine
2019 Climate Change A-List, CDP
2020 100 Best Corporate Citizens, CR Magazine
Building Value Together in 2019
People FirstOur Commitments & Values are the foundation by which we are elevating our dedication to a People First organization. Putting our people first means achieving success with integrity. These guiding principles ensure that we’ll never lose sight of the things we value most: our people, our customers, our environment, our dedication to safety and our continuous goal to create great places to work for all.
Our 2020 Sustainability Report proves our commitment to continuous improvement. Throughout this report, you’ll find stories that describe how Waste Management and our stakeholders are Building Value Together. In addition to these stories, we’re proud to share the following highlights from the past year.
National RecognitionWe’re proud to have been recognized for our efforts to create a rewarding workplace and operate a sustainable business. Below are a few awards and recognitions we received in 2019 and 2020.
A full list of awards can be found on our ESG Resources Hub.
Waste Management 2020 Executive Summary | sustainability.wm.com
5 Building Value Together in 2019
Emissions Intensity Reduction Over the past decade, we have consistently decreased the intensity of our emissions. Even as we are managing more waste today than we were 10 years ago, our emissions per ton of waste disposed have continued to decline. We are investing in the latest fleet technology to produce and use renewable energy, and we are exploring ways to better measure landfill emissions in order to develop more precise approaches to managing these emissions.
Metric Tons of Carbon Dioxide per Ton of Waste Disposed0.250
0
2010 201920182017201620152014201320122011
0.235
0.1690.177 0.172 0.168
0.1510.141 0.1360.142
0.169
Million Tons of Recyclables Managed18
0
2011 20122010 2013 2014 2015 2016 2017 2018 2019
12.913.7
10.0
15.0 15.1 14.715.3 15.2 15.5
14.0
Environmental Highlights
Fleet LeadershipWe are also consistently reducing our GHG emissions per mile driven. By the end of 2019, for every 1,000 miles driven, we had reduced our GHG emissions by 32%, and total GHG emissions by 36% for our collection and support fleet. We’ve achieved these reductions through logistical efficiencies, transitioning to natural gas vehicles, and by increasing our use of renewable fuel.
Total Collection & Support FleetMetric Tons of GHGs per 1,000 Miles Driven
4.00
2.00
2011
3.50
2012
3.33
2010
3.52
2013
3.45
2014
3.39
2015 2016
3.00
2017
2.87
2018
2.74
2019
2.40
3.02
Recycling Growth and InvestmentOver the past decade, Waste Management has become an industry leader in our commitment to invest in recycling infrastructure with long-term sustainability in mind. We invested more than $100 million in recycling infrastructure in both 2018 and 2019, and set a new record in 2019, with over 15.5 million tons of material processed for beneficial use.

14
17
0
20192038
15.86
3X 4X
16.52Goal15
-60
-58
-56
-54
-52
-50
Goal-60
-52.68-53.93
2017 2018-54.45 -55
-52
15.93
Environmental GoalOur overarching environmental goal is to reduce GHG emissions while protecting the environment. Currently, the services we provide avoid three times (3X) more GHG emissions than we generate in our operations. Our 2038 goal calls for reducing even more GHG emissions—four times (4X) the GHG emissions we generate through our operations. All of our environmental goals contribute to this overarching goal of emitting less and reducing, avoiding and offsetting more. To achieve this goal, our strategy is to reduce emissions from our landfills, fleet and electricity use, while increasing the emissions-avoidance services that we provide to our customers. Between now and 2038, the bar above the zero line will decrease as we reduce operational emissions, while the bar below the zero line will increase.
Community GoalWaste Management aspires to make the communities where we live and work safe, resilient and sustainable. We are investing in a quieter, cleaner fleet; supporting programs that preserve biodiversity and conservation; continuing our programs that prioritize community safety; and organizing environmental education programs and activities, including facility tours, community events and social media engagement campaigns.
1M
0
2018 2019 2038
300K393K
Goal1M
Participants in WM Supported/Hosted Education Events and Programs
3
2018 2019 2038
4
3.26 3.32
Goal4.00
2017
3.42
Progress to Achieving Our 4X Goal
How We Measure Our 4X GoalMillion MTCO2e
Generated EmissionsOur current and targeted emissions generated are shown above the zero line
Avoided EmissionsThe emissions avoided by the services we provide are shown below the zero line
←
6
Goals & Progress
Waste Management 2020 Executive Summary | sustainability.wm.com

Waste Management 2020 Executive Summary | sustainability.wm.com
7 Goals & Progress
In 2019, Waste Management Committed to Six Goals With a 2025 Target:
70%of collection fleet to be alternative
fuel vehicles
50%of alternative fuel vehicles to run on
renewable natural gas
70%
0
2016 2017 2018 2019 2025
Goal70%
50%46%
38%34%
50%
0
2016 2017 2018 2019 2025
Goal50%
40%
30%30%30%
10%inbound recycling contamination
20%
0
2016 2017 2018 2019 2025
Goal10%
17%18%15%14%
Develop fugitive emissions measurement systems
100%renewable energy at WM
controlled sites
100%of WM employees paid
a Living Wage

Waste Management 2020 Executive Summary | sustainability.wm.com
Key Performance Indicators—Planet
GHG Emissions From Operations (MMTCO2e)1
15
13
2016 2017 2018 2019
13.97
14.54
13.6313.56
Landfill2 Collection Fleet3
Other Energy Use5
1.5
1.0
2016 2017 2018 2019 2038
1.21
Target*1.03
1.321.35
1.42
0.8
0
2016
0.62
2017
0.71
2018
0.41
2019
0.45
0.25
0
2016 2017 2018 2019 2025
0.2380.2460.244
Target0
0.236
Electricity4
GHG Emissions Avoided (MMTCO2e)6
Renewable Energy Generation7
3
2
2016 2017 2018 2019 2038
2.10
Target2.502.56
2.42
2.25
Recycling of Materials8
40
25
2016 2017 2018 2019 2038
30.06
Target39.08
31.3232.5932.57
25
15
2016 2017 2018 2019
20.7420.0419.48
18.54
Carbon Permanently Sequestered
Supply Chain
$350M
$0M
2016 2017 2018 2019 2020
$290.5$264.1
$234.2$191.0
$131.5
$300M
$100M
2019 2020
10% year-over-year growth in annual spend with diverse suppliers
10% increase in annual spend on sustainability-related products and services
* This is a 45% reduction in fleet emissions from the base year, 2010.
8Goals & Progress

9 Goals & Progress
Waste Management 2020 Executive Summary | sustainability.wm.com
100
75
2016
95
2017
90
2018
83
2019
79
$20
$10
2016
$13.7
2017
$17.2
2018
$13.0
2019
$14.9
Charitable Giving11
In MillionsNumber of Wildlife Habitat Programs
4,500
3,000
2018
4,000
2019
3,496
Community Events Supported/Hosted
Key Performance Indicators—People
Inclusion & Diversity
50
0Executive Managers
1612 13
Professionals Operatives & Craft Workers
All Workforce
2631 31 31
22 22
484247
41 4345
2018 2019 Peer Industries
Ethnic Diversity9
%
50
0Executive Managers
23 23 21
Professionals Operatives & Craft Workers
All Workforce
22
34
46 46
18 19
23 2
2417 18
2018 2019 U.S. Workforce
Female Representation10
%
Social Impact
Safety Performance
Total Recordable Incident RateIncidents per 100 Full-Time Employees per Year
WM Vehicle Accident Recordable Rate (VARR)12
Driver Hours Without a Vehicle-on-Vehicle Accident, in Thousands
2016
3.0
2017
2.8
2018
2.9
2019
2.8
3.5
2.5
2016
18.5
2017
19.4
2018
19.7
2019
19.4
21
15

Waste Management 2020 Executive Summary | sustainability.wm.com
10Goals & Progress
Key Performance Indicator Footnotes 1. These four graphs represent 100% of Waste Management’s Scope 1 and 2 greenhouse gas inventory, which is third-party verified
and reported to CDP. These emissions make up the numerator portion of our environmental goal to reduce, avoid or offset four times the emissions we generate in our operations, represented in the part of the 2019 bar chart that is above the 0 line of the How We Measure Our 4X Goal infographic. For a discussion of the protocols that govern these calculations, please visit our ESG Resource Hub, Carbon Footprint Calculation Methodology.
We use the modified 100-year global warming potentials (GWPs) promulgated by the U.S. EPA. Pertinent to our carbon footprint, our Scope 1, 2 and 3 emissions calculations use the Intergovernmental Panel on Climate Change (IPCC) Fourth Assessment Report (FAR) GWP. However, prior to 2019 our Scope 2 emissions from purchased electricity used the IPCC Second Assessment Report (SAR) GWP.
2. Our landfill emissions are from both active and closed facilities. The amount of landfill gas that is collected can be measured; the amount of landfill gas generated and the amount emitted to the atmosphere as fugitive emissions must be estimated using prescribed calculation methodologies. The applicable methodologies are the Solid Waste Industry for Climate Solutions (SWICS) Protocol and the U.S. EPA Greenhouse Gas Reporting Program (GHGRP) rules.
3. The methodology for calculating fleet emissions conforms to U.S. EPA’s SmartWay Truck Tool. SmartWay calculations use records compiled for tax credit and fee purposes. The tax documentation reflects fuel purchased in a year, including some insignificant amounts of fuel stored rather than used in a given year. The graph excludes biogenic emissions, as per The Greenhouse Protocol. Biogenic emissions are reported separately.
Note that in previous reports, this graph was named “Transportation” and emissions included those from both our collection fleet and our non-collection “yellow iron” (i.e., off-road equipment such as forklifts and excavators) used on site. These emissions have been moved to “Other Energy Use” to more clearly track progress on our collection fleet goals.
4. Emissions in this graph were previously reported in a graph named “Energy Use,” which included all non-transportation energy use. We have separated electricity emissions (Scope 2) from other energy use (Scope 1) because they are different scopes and to more clearly show progress toward our goal to purchase 100% renewable electricity by 2025.
5. This graph includes emissions from our “yellow iron” (i.e., off-road equipment such as forklifts and excavators), heating fuel, jet fuel, propane and a small amount of other fuels. Emissions in this graph were previously reported in a graph named “Energy Use,” which included all non-transportation energy use. We have separated electricity emissions (Scope 2) from other energy use (Scope 1).
6. These emissions make up the denominator portion of our environmental goal to reduce, avoid or offset four times the emissions we generate in our operations, represented in the part of the 2019 bar chart that is below the 0 line of the How We Measure Our 4X Goal infographic. For a discussion of the protocols that govern these calculations, please visit our ESG Resource Hub, Carbon Footprint Calculation Methodology.
We are reporting this data to inform our customers and the public about the potential GHG reduction benefits associated with carbon storage in landfills, our renewable energy production and the value of the recyclable materials we collect and process. We are not presuming to characterize how emerging regulatory programs will allocate credit for these avoided emissions, so we do not claim these GHG reduction benefits as our own nor attempt to deduct these reductions from our carbon footprint.
7. At 124 of our landfills, Waste Management captures the methane for beneficial use, recognized by the U.S. EPA as a renewable energy resource.
8. The U.S. EPA’s Waste Reduction Model (WARM) is used to calculate the life cycle GHG emission benefits from recycling. Note that instead of using the WARM “national average landfill” defaults, WM uses company-specific settings to account for our own landfill gas-to-energy capacity. Additionally, the increase in emissions reductions realized by recycling does not correspond arithmetically to the increase in total tons recycled. That is because, for example, paper recycling (80% of all recyclables) achieves very high emissions reductions, while the emissions reduction potential associated with glass recycling (20% of recyclables) is nominal on a per ton basis.
9. Waste Management aims to achieve ethnic diversity in each segment of our workforce, with emphasis on leadership, that is greater to or equal to that of the U.S. workforce standards. U.S. workforce averages are from the most recent data available, based on 2018 Equal Employment Opportunity Commission reports data.
10. Waste Management aims to lead the industry in female representation at all levels with a special emphasis on frontline employees and women in leadership. Industry averages are from the most recent data available, based on 2018 Equal Employment Opportunity Commission reports.
11. Due to the extraordinary devastation caused by hurricanes in the fall of 2017, Waste Management donated $3 million to Hurricane Harvey aid relief and $1 million to Hurricane Irma recovery efforts.
12. We have adjusted all years after 2016 to exclude “Other Vehicle Initiated Impact” incidents.

Waste Management 2020 Executive Summary | sustainability.wm.com
11
Where We Create Value, TogetherCreating a circular economy—one where we get the most possible value out of every type of material—takes everyone’s help and happens in places you might not expect. See a few of the many ways Waste Management works with our stakeholders to create value out of waste:
1
2
3
6
5
8
4
At a Championship Golf TournamentAt the Waste Management Phoenix Open, one of the largest zero waste events in the world, we divert waste from landfills and educate attendees on how they can do the same.
1
In the Compost CartComposting provides a sustainable alternative to landfills for the billions of pounds of food that are thrown away each year. The resulting organic matter is a valuable input for agriculture, landscaping and more.
2
In the Recycling CartWe are dedicated to educating customers about the importance of recycling right—ensuring that everything that goes in the bin is fit for recycling. Encouraging good recycling practices allows us to operate more efficiently, which lowers the cost of recycling for everyone.
3
On the Front Lines of a PandemicThroughout the COVID-19 crisis, Waste Management continued residential collection without interruption—providing an essential service to customers while supplying critically needed recycled goods for manufacturing industries.
4
On Top of a Closed LandfillIt’s possible that you’ve visited a closed landfill without even knowing it. We closely monitor landfills after closure and support their conversion into golf courses, parks, wildlife habitat and more.
5
At Our Customers’ BusinessesCustomers are looking for ways to operate more sustainably and reduce the waste they generate. Waste Management Sustainability Services (WMSS), our advisory services business, allows us to partner with customers to reduce their environmental impact.
6
Underneath a LandfillAt more than half of our landfills, Waste Management converts landfill gas into energy, which can be captured and beneficially used as an alternative to fossil fuel. In some cases, this fuel is used to power Waste Management’s own fleet.
7
At Our LandfillSeveral of WM’s landfills host solar and wind farms, which generate renewable energy that is placed into the electricity grid reducing the use of fossil fuel.
8
Solving Waste Together
7

Waste Management 2020 Executive Summary | sustainability.wm.com
12
8,079,346paper
What We Recycled Tons
666,838glass
1,109,558C&D/wood
3,577,122mixed organics
1,149,000fly ash
476,645metal
403,484plastic
39,594wood pallets
9,110e-waste/lamps
15,510,697total materials
recycled
2019 Recycling Performance
30 Commercial
11 C&D14 Other
46 Single Stream
2 Dual Stream
Materials Recovery Facilities
Recycling
Driving End-Market Demand Waste Management has been a leading voice in the call to focus on creating domestic market demand for products made with post-consumer recycled content. From home delivery and pizza boxes, to soda cans and water bottles, to fleece clothing and carpeting, manufacturers across the globe rely on recyclables from our MRFs as material inputs for their products. But significant opportunity remains to expand these markets further, and Waste Management is looking for new ways to generate demand among customers and within our business.
Demand From Our Customers In 2018, plastic recycler KW Plastics asked us to consider adding polypropylene (PP) to our recycling programs. Polypropylene plastic is used in products like yogurt cups and its use is growing, creating a demand for post-consumer PP resin. After auditing our available recyclables, we agreed and began to separate PP from other materials for recycling, even adding optical sorters at several of our facilities to efficiently sort this material. KW Plastics now has a reliable stream of PP that can be recycled into products such as paint cans. With our new capacity to sort PP, other markets for the material have the chance to develop as well. Watch video.
Demand From Our Collection Business Waste Management purchases hundreds of thousands of residential curbside carts each year, which contain post-industrial recycled plastic. In 2019, we signed on to the Association of Plastics Recyclers (APR) Demand Champion Program and pledged to increase the use of post-consumer resin (PCR) in products we purchase, starting with our residential carts. Waste Management teams from our supply chain, operations, marketing/branding and other functions collaborated with Cascade Cart Solutions to test the use of PCR in our residential carts, and purchase the resulting carts made with 10% PCR. Cascade’s Ecocarts are a first in our industry.
Demand From Major EventsThe Waste Management Phoenix Open (WMPO) and concurrent Sustainability Forum are great opportunities for us to showcase recycling’s potential. During the 2020 golf tournament, fans could purchase apparel made from Unifi’s Repreve recycled fibers produced from plastic bottles. One popular style was Loudmouth Golf’s “WMPO Party Pants,” made from Repreve fabric with 50% recycled content. The importance of end-markets for recycled goods was also a focus of 2019 and 2020 Forum presentations. During the 2020 Forum, we organized a Circular Economy Showcase where we highlighted 15 companies using post-consumer recycled content to produce new products.
Solving Waste Together
Waste Management 2020 Executive Summary | sustainability.wm.com
13
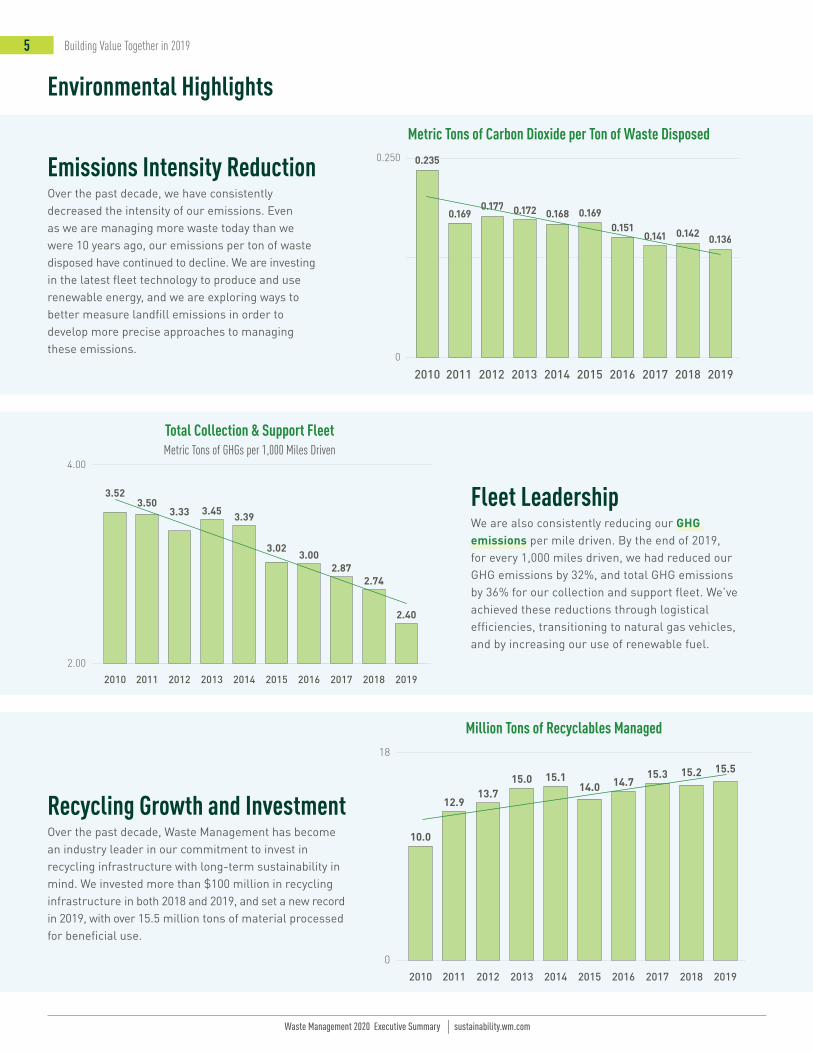
The Circularity of Recycling Recycling gives materials new life—even enabling them to be used more than once by the same household. For this process to remain circular, every step matters. Not only must goods be recycled properly, there must be markets for recycled materials that allow them to reenter the value chain.
Residential Home Customers separate clean recyclables such as bottles, cans, paper and cardboard boxes before placing them in their recycling bins.
Recycling Collection Where single-stream recycling is available, a Waste Management collection truck picks up all these items in a single pass.
Materials Recovery FacilityAt one of our MRFs, we use advanced technology, as well as manual sorting, to organize recyclables by type before packaging them into bales.
RESIDENTIAL HOME
MATERIALS PROCESSING
RECYCLING COLLECTION
MATERIALS RECOVERY FACILITY
PRODUCT MANUFACTURING
RETAIL
METAL PLASTIC CARDBOARD
CANS
PLASTICNEW BOX
PAPER PULP
PLASTIC PELLETS
SHEET METAL
Materials Processing Depending on material type, baled recyclables are processed into new forms, such as pulp, pellets or sheets, that prepare them to be made into new products.
Product Manufacturing New goods are created with these materials, such as boxes made from post-consumer paper or carpets with fibers made from recycled plastics.
Retail Consumers purchase products with packaging or other components that are made to be recycled.
Solving Waste Together
Waste Management 2020 Executive Summary | sustainability.wm.com
14
CORe®
Compost/Mulch
CORe®
Compost/Mulch
12
5
43
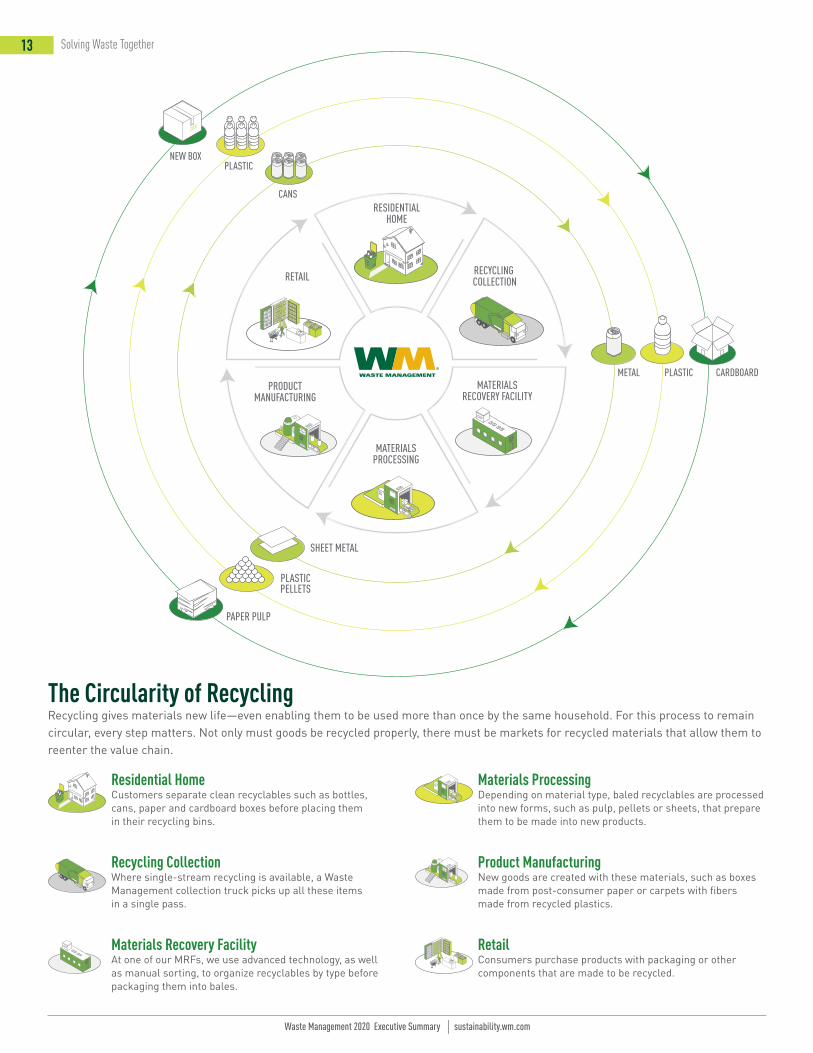
Waste Management Organics Processing SitesWaste Management is continually growing our capacity for processing organic material and making compost products available to local customers who can put them to good use. By partnering with stakeholders across the communities where our processing sites are located, we’re all helping to maximize the value of organics.
3,577,122Mtons organic
material recycledAlameda County Food Donation Program Given a recent California initiative to reduce food waste, the Alameda County Community Food Bank was looking to expand its operations. Waste Management helped secure a grant to purchase a new truck—the first hybrid vehicle in the Food Bank’s fleet—which will allow the Food Bank to expand its collection capacity by 1 million pounds annually. This new hybrid truck will also decrease GHG emissions, equivalent to removing 1,000 cars from the road for a year.
Redwood Compost Facility Our Redwood facility uses aerated static pile composting, an approach that has allowed us to increase processing capacity while reducing air emissions. Yard waste and residential food scraps from the nearby community truly stay local when they are turned into compost used by organic wine growers in Sonoma and Napa, ranchers in Marin County, landscapers and home gardeners alike.
1
31 Compost 9 Grinding/Beneficial Reuse 4 CORe®44
Total
Organics Processing Facilities
Boston CORe® Facility To help the state of Massachusetts meet its organics recycling goals, the Greater Lawrence Sanitary District entered a partnership with Waste Management to process additional organic material at our CORe® facility. The resulting agreement increased the district’s production of renewable energy. Since 2017, we have tripled GLSD’s biogas production to approximately 1 million cubic feet per day, and the district is well on its way to being a net energy exporter to the local grid.
New Jersey CORe® Facility The CORe® process is a great solution for residential and municipal organic programs located near a facility. For example, Woodbridge Township now collects food waste from schools with a special organics collection vehicle, which is delivered to CORe® every day of the week. The nearby Westfield Township provides its residents with a food waste drop-off program. The centralized location of this CORe® facility allowed for a cost-effective solution requiring minimal transportation.
Okeechobee Compost Facility In Okeechobee, Florida, high-quality compost is in demand from the region’s citrus groves. Compost from Waste Management’s facility there, which opened in 2012, is used exclusively in agricultural production, turf and other applications. The compost’s high-organic matter helps boost crop production and reduces the impact of citrus greening disease. The facility can produce up to 10,000 cubic yards of mature compost each year.
2
3
4
5
Organics
Solving Waste Together

Waste Management 2020 Executive Summary | sustainability.wm.com
15
Landfills & Renewable Energy
We have observed significant changes in municipal solid waste (MSW) streams over the years, including some encouraging findings. For example, between 1990 and 2017, the amount of MSW to landfills has decreased even as the U.S. population has grown. Nevertheless, large volumes of material that could be recycled or composted are still being sent to landfills. And even as we are managing more waste today than we were 10 years ago, our emissions per ton have declined.
As North America’s leading environmental services provider, Waste Management is committed to ensuring that all discarded material is handled in the most environmentally beneficial way, which comes down to changing the behavior of industries and individuals alike. We are making progress by working across our supply chain to help develop new technologies and markets for post-consumer materials and educating consumers on how best to dispose of all forms of waste.
The material we manage—across our recycling facilities, organics processing operations and landfills—is a function of what, and how much, people and businesses throw away.
Given currently available technology, there remain many waste streams that cannot be successfully or profitably processed into new materials. To ensure that these forms of waste do not enter natural land areas or waterways, where they can cause harm as they degrade, we manage them safely and sustainably through our network of 244 active MSW landfill sites across the U.S. and Canada. Combined, these sites process over 100 million tons of waste annually.
Renewable Energy Generation: Capturing the Value of Waste At 124 of our landfills, Waste Management creates economic and environmental value from waste by turning landfill gas into energy. As organic material decomposes in an anaerobic environment, it naturally produces landfill gas, which is roughly half carbon dioxide and half methane. We capture
this methane and use it beneficially as an alternative to fossil fuel. This landfill gas, or biogas, is recognized by the U.S. EPA as a renewable energy resource.
In 2019, approximately 55% of biogas collected at Waste Management-owned and -operated facilities went to beneficial use projects. Waste Management is the largest developer and operator in North America. We are continually looking for opportunities to develop new beneficial use projects. Proximity and accessibility to energy infrastructure makes projects more cost effective. While larger landfills tend to have greater potential, smaller landfills can also support beneficial use projects.
Renewable ElectricityToday, our most frequent application for biogas is to generate electricity that is sold to public utilities, municipal utilities and power cooperatives.
In this arrangement, the amount of renewable electricity delivered into the grid by one user must equal the amount of renewable electricity taken off the same grid by another user. This process has been used to offset traditional electricity with renewable energy for decades.
Renewable FuelBeyond electricity generation, we are also a leader in converting landfill gas into natural gas fuels that are distributed for use in residences, businesses and commercial vehicles, including our own. Renewable natural gas (RNG) produced from processed landfill gas now fuels over 40% of our natural gas trucks. Learn more about how we focus on sustainability within our fleet.
Solving Waste Together

Waste Management 2020 Executive Summary | sustainability.wm.com
16Solving Waste Together
Fleet & Energy Efficiency
Waste Management is reducing our fleet’s GHG emissions by transitioning from diesel to cleaner-burning natural gas, an increasing amount of which originates from our own landfill gas. Beyond using cleaner fuel, we are decreasing the amount of fuel we consume via logistics solutions, including route optimization technology that allows us to reach customers while traveling the least possible distance.
Progress Toward Fleet Goals Waste Management established our first fleet emissions reduction goal in 2007. By 2011, we reached our goal of 15% reduction, primarily by transitioning vehicles from diesel to natural gas. With a vision to create a near-zero emissions collection fleet, we’re now working toward a science-based target to cut fleet emissions by 45% by 2038, against a 2010 baseline. In 2019, we set an interim goal for 70% of our collection fleet to use compressed natural gas (CNG) engines by 2025, with 50% running on renewable natural gas (RNG). We are investing in both fuel and routing technologies to achieve these goals and ensure that Waste Management remains the industry leader in transportation technology.
Our fleet of more than 17,000 collection vehicles provides reliable, everyday service to our customers. And it does so while reducing our environmental impact.
17,000trucks
450Mmiles
driven each year
85%new purchasesare natural gas vehicles
8.9Mfewer miles driven
2017-2019
↓36%fleet emissions*
2010-2019
WM’s Collection Fleet by the Numbers
*36% reduction in total fleet emissions, excluding biogenic emissions.

Fueling Our Fleet Key to achieving our fleet emissions goal is a commitment to invest nearly $400 million annually in the cleanest near-zero-emissions trucks available. At the end of 2019, our natural gas fleet totaled 8,924 trucks, comprising the largest heavy-duty natural gas truck fleet of its kind in North America. Vehicles powered by natural gas emit almost zero particulate emissions, cut GHG emissions by 15% and are quieter than diesel trucks. For every diesel truck we replace with natural gas, we reduce annual use of diesel fuel by an average of 8,000 gallons, thereby reducing GHG emissions by 14 metric tons.
Vehicles receive CNG fuel through our network of Waste Management-owned and -operated fueling stations. As of the end of 2019, we operated 145 natural gas fueling stations across North America, with 25 of these also open to the public. Waste Management finances and constructs the stations, as well as purchasing the fuel.
We currently fuel over 40% of our natural gas fleet with RNG produced from our own landfills and third-party landfills. In 2019, these third parties expanded to include dairy farms. Using RNG reduces GHGs and nitrous oxide emissions (NOx) by over 90%.
Our long-term and ongoing investments in RNG production facilities, coupled with a natural gas fleet that can operate on RNG, are moving us closer to a near-zero emissions collection fleet. In 2019, Waste Management’s fleet consumed over 9,752,000 MMBtu of natural gas. Of that total usage, approximately 40% is biogas. In California, Oregon and Washington, 100% of our natural gas fleet runs on RNG.
ALTAMONT LANDFILLLIVERMORE, CALIFORNIA (JV)Since 2009 Produces 1.59M diesel gallon equivalents (DGE) of RNG per year Serves WM’s California operating districts
MILAM LANDFILLST. LOUIS, ILLINOISSince 2014Produces 5.0M DGE of RNG per yearServes Ameren Illinois pipeline
AMERICAN LANDFILLWAYNESBURG, OHIOSince 2014Produces 1.5M DGE of RNG per year Serves Dominion East Ohio pipeline
OUTER LOOP LANDFILLLOUISVILLE, KENTUCKYSince 2018 Produces 6.6M DGE of RNG per yearServes Texas Gas
SKYLINE LANDFILLFERRIS, TEXASSince 2019Will produce 1.6M DGE of RNG per year Serves Atmos Energy System
Waste Management RNG Facilities
Waste Management 2020 Executive Summary | sustainability.wm.com
17 Solving Waste Together
18
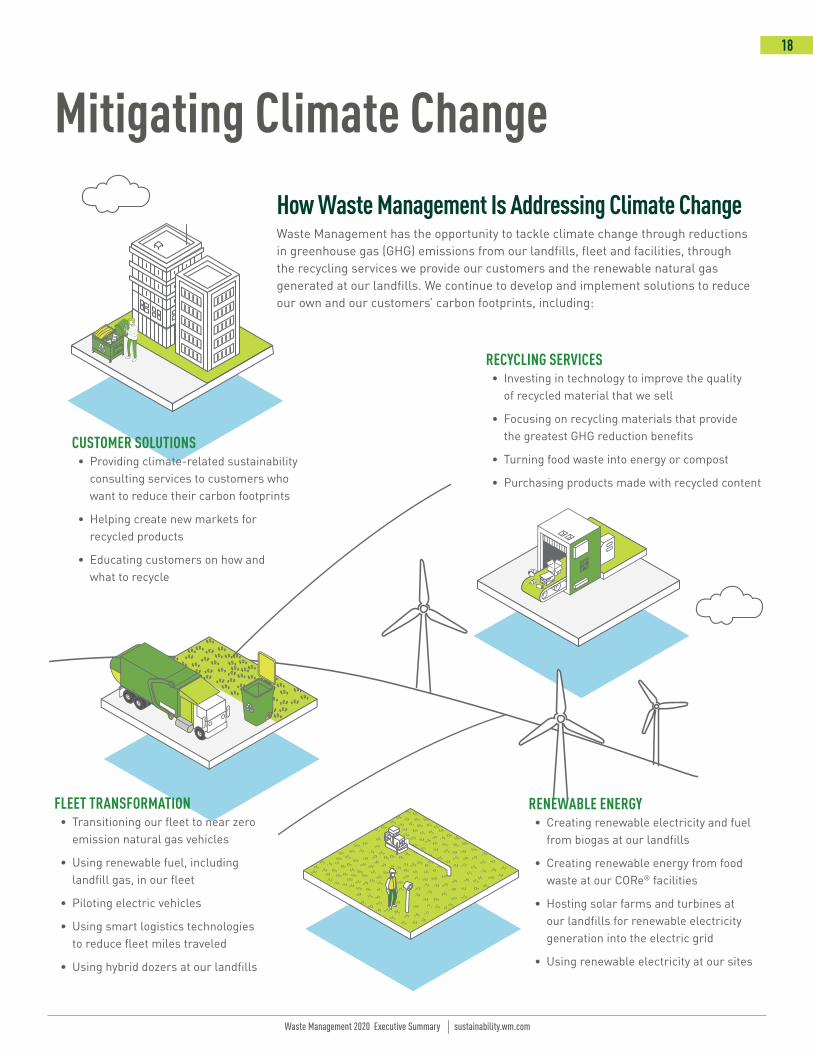
RENEWABLE ENERGY• Creating renewable electricity and fuel
from biogas at our landfills
• Creating renewable energy from food waste at our CORe® facilities
• Hosting solar farms and turbines at our landfills for renewable electricity generation into the electric grid
• Using renewable electricity at our sites
FLEET TRANSFORMATION• Transitioning our fleet to near zero
emission natural gas vehicles
• Using renewable fuel, including landfill gas, in our fleet
• Piloting electric vehicles
• Using smart logistics technologies to reduce fleet miles traveled
• Using hybrid dozers at our landfills
CUSTOMER SOLUTIONS• Providing climate-related sustainability
consulting services to customers who want to reduce their carbon footprints
• Helping create new markets for recycled products
• Educating customers on how and what to recycle
RECYCLING SERVICES• Investing in technology to improve the quality
of recycled material that we sell
• Focusing on recycling materials that provide the greatest GHG reduction benefits
• Turning food waste into energy or compost
• Purchasing products made with recycled content
How Waste Management Is Addressing Climate Change Waste Management has the opportunity to tackle climate change through reductions in greenhouse gas (GHG) emissions from our landfills, fleet and facilities, through the recycling services we provide our customers and the renewable natural gas generated at our landfills. We continue to develop and implement solutions to reduce our own and our customers’ carbon footprints, including:
Mitigating Climate Change
Waste Management 2020 Executive Summary | sustainability.wm.com

Putting People FirstWaste Management is a company committed to People First, knowing that the daily contributions of our 45,000 employees are what enable us to play a vital role in the communities we serve. The success of Waste Management depends upon the success of each employee, and we strive to give them the tools they need to develop and excel in their careers.
Waste Management employees span four generations—Baby Boomers, Gen Xers, Millennials and Gen Z—each with their own preferences and expectations when it comes to ways of working. Beyond generational differences, our workforce is diverse in terms of race, sexual
orientation, gender identity, ethnicity, language and life experience. We are committed to promoting and fostering equal opportunity for all employees, and we strive to maintain a workplace where everyone is valued and respected.
Waste Management Commitments & ValuesIn the simplest terms, our values come down to this: Do the Right Thing. The Right Way. This idea sets the standard for our fundamental commitments and core values, guiding our daily actions and decisions.
Commitments • People First: The proud, caring and
resilient members of the Waste Management family are the foundation of our success. We commit to taking care of each other, our customers, our communities and the environment.
• Success With Integrity: Our success is based not only on the results we achieve, but how we achieve them. We are committed to being accountable, honest, trustworthy, ethical and compliant in all that we do.
Values • Inclusion & Diversity: We embrace
and cultivate respect, trust, open communication and diversity of thought and people.
• Customers: We place our customers at the center of what we do and aspire to delight them every day.
• Safety: We have zero tolerance for unsafe actions and conditions, making safety a core value without compromise.
• Environment: We are responsible stewards of the environment and champions for sustainability.
Waste Management 2020 Executive Summary | sustainability.wm.com
19

20Putting People First
Waste Management Workforce
54.67% Caucasian 23.06% Hispanic 18.60% African American 1.60% Asian 1.01% Multiracial 0.67% American Indian or Alaskan Native 0.40% Native Hawaiian or Pacific Islander
33%ethnic minorities
61.38% Caucasian 15.02% African American 14.45% Hispanic 6.33% Asian 1.81% Multiracial 0.55% American Indian or Alaskan Native 0.47% Native Hawaiian or Pacific Islander
All Private Industry Workforce*
41,900 U.S. 2,199 Canada 740 India
Employees by Region
55.33% Gen Xers (born 1961–1980)
31.41% Millennials (born 1981–2000)
13.05% Baby Boomers (born 1944–1960)
0.02% Gen Z (born 1995-Current)
Employees by Generational Breakdown in U.S. and Canada
51.13% 31-50 (1966–1985)
35.70% Over 50 (before 1965)
13.17% 30 and Under (born after 1986)
Employees by Age Group
80.87% Hourly 19.22% Salaried
Employees by Payment Type
Board of Directors Senior Leadership Team Company Officials & Managers
22%women
22%ethnic minorities
33%women
22%ethnic minorities
20%women
Workforce
45%ethnic minorities
18%women
Diversity at Waste ManagementAs of 12/31/2019
*Based on U.S. employee/population data. Total does not equal 100% due to rounding.

BUILDING VALUE TOGETHER Taking Care of Each Other During Times of UncertaintyCOVID-19 touched every aspect of our business, from our customers and communities to employees and operating procedures. As an essential service, Waste Management continued to operate as much of the country paused, taking on the logistical challenge of adapting our operations to a new working environment. With many businesses closed, we re-routed our commercial collection trucks to residential routes where waste and recyclables increased up to 25%. With thousands of collection routes in North America, this was no small task.
We never took our attention off our primary focus of people and safety as we adjusted to changes in our services and market conditions. For example, we:
• Continued to provide glasses, masks and gloves as necessary for frontline employees.
• Created configurations and procedures to promote social distancing, including plexiglass shield separators.
• Developed policies regarding team meetings, breaks and public spaces to ensure social distancing.
• Instituted regular and enhanced cleaning procedures at all facilities.
• Guaranteed 40 hours pay to all full-time employees, regardless of COVID-related service decreases, and company-subsidized care for children and elderly parents.
• Moved 20,000 employees to work- from-home conditions, upgrading software company-wide to handle additional online traffic.
Knowing they were safe and taken care of, our employees were inspired to help others during the crisis. We launched the Million Meals Campaign, a two-week employee match program that raised funds for Feeding America and Food Banks Canada. Through our combined efforts, Waste Management provided 1.9 million meals to those experiencing food insecurity due to the pandemic. In addition, facilities across
the country pitched in to help neighbors and local organizations:
• Sites in the Greater Mid-Atlantic region donated money and supplied fruit, vegetables and other essentials to a Delaware food bank supporting more than 7,000 community members.
• The Varick Transfer station in New York City, participated in a food distribution program, helping to unload produce that is delivered to local families on a weekly basis. The facility was recognized as a Queens Chamber of Commerce Business of the Week for its efforts.
• An account manager for Delaware Valley South and his family expanded the Little Free Library in front of their house to include a community food pantry, inviting community members to take what they needed and contribute what they could.
• When students at Reed College and Lewis & Clark College in the Pacific Northwest had to leave campus on short notice, Waste Management teams provided drop boxes and front-load containers to collect recyclables and trash. This helped move-outs proceed more smoothly, reducing the burden on students and school administrators.
Waste Management 2020 Executive Summary | sustainability.wm.com
21
40hours
of guaranteed pay to all full-time employees
20,000employees
moved to work from home
1.9Mmeals
donated to those experiencing food insecurity
Putting People First

How We Support the UN Sustainable Development Goals The United Nations introduced 17 Sustainable Development Goals (SDGs) in 2015 to provide targets and indicators for broad global sustainability achievements. Waste Management has been contributing to each of these goals since, and in 2020 we refined our approach by aligning our 2025 and 2038 goals with eight SDGs targeted. WM is committed to action that provides the greatest contributions locally to affect positive change globally.
To explore our commitment to the UN SDG’s and how we use targets and indicators to refine and measure our approach, please visit our ESG Resource Hub.

To read our full report, please visit sustainability.wm.comRecycling is a good thing. Please recycle any printed copies of this report.