Embed Size (px)
Citation preview
INSTITUTUL NAŢIONAL DE STATISTICĂ NATIONAL INSTITUTE OF STATISTICS
BULETIN STATISTIC DE INDUSTRIE
INDUSTRY STATISTICAL BULLETIN
NR. 2 / 2015
ISSN 1223 – 0502
ISSN-L 1223 - 0502
CUPRINS
PaginaPage
CONTENTS
Evoluţia activităţii industriale din România în perioada 1.I - 28.II.2015. .......................................... 5
Evolution of industrial activity in period 1.I - 28.II.2015
1 Indicii producţiei industriale pe activităţi (diviziuni) CAEN Rev.2 - serie brută - .......................................... 26
Industrial output indices by activities (divisions) CANE Rev.2 - unadjusted series -
2 Indicii producţiei industriale pe activităţi (diviziuni) CAEN Rev.2 - serie ajustată în funcţie de numărul de zile lucrătoare - ....................................................... 32
Industrial output indices by activities (divisions) CANE Rev.2 - adjusted series for number of working days -
3 Indicii producţiei industriale pe activităţi (diviziuni) CAEN Rev.2 - serie ajustată în funcţie de numǎrul de zile lucrǎtoare şi de sezonalitate - ...................... 38
Industrial output indices by activities (divisions) CANE Rev.2 - working day and seasonally adjusted series -
4 Indicii productivităţii muncii în industrie pe activităţi (diviziuni) CAEN Rev.2 ................................................ 44
Labour productivity indices in industry by activities (divisions) CANE Rev.2
5 Indicii preţurilor producţiei industriale pe total (piaţă internă şi piaţă externă), pe activităţi (diviziuni) CAEN Rev.2 - luna corespunzătoare din anul precedent = 100 - ................. 50
Industrial production prices indices for total (domestic and non-domestic market) by activities (divisions) CANE Rev.2 - corresponding month from previous year = 100 -
6 Indicii preţurilor producţiei industriale pe total (piaţă internă şi piaţă externă), pe activităţi (diviziuni) CAEN Rev.2 - luna precedentă = 100 - .............................. 54
Industrial production prices indices for total (domestic and non-domestic market) by activities (divisions) CANE Rev.2 - previous month = 100 -
7 Indicii valorici ai cifrei de afaceri din industrie pe total, piaţă internă şi piaţă externă, pe activităţi (diviziuni) CAEN Rev.2 ................................................................. 58
Turnover indices in industry for total, domestic and non-domestic market by activities (divisions) CANE Rev.2
8 Indicii valorici ai comenzilor noi din industria prelucrătoare pe total, piaţă internă şi piaţă externă, pe activităţi (diviziuni) CAEN Rev.2 ............................. 70
New orders indices in manufacturing for total, domestic and non-domestic market by activities (divisions) CANE Rev.2
9 Producţia de lapte şi produse lactate ........................... 76 Output of milk and milk products
10 Exporturile (FOB) de produse industriale, în luna decembrie 2014, conform CPSA 2008 ...................... 78
Exports (FOB) of industrial products in December 2014 according CPA 2008
11 Importurile (CIF) de produse industriale, în luna decembrie 2014, conform CPSA 2008 ...................... 79
Imports (CIF) of industrial products in December 2014 according CPA 2008
12 Efectivul salariaţilor din industrie la sfârşitul lunii pe activităţi (diviziuni) CAEN Rev.2 .................................. 80
Number of employees in the industry at the end of the month by activities (divisions) CANE Rev.2
13 Câştigurile salariale medii nominale din industrie, în luna februarie 2015 pe activităţi (diviziuni) CAEN Rev.2 ................................................................ 82
Nominal average salary earnings in the industry, in February 2015 by activities (divisions) CANE Rev.2
14 Principalele resurse de energie primară în perioada 1.I - 28.II.2015............................................ 84
Main resources of primary energy in period 1.I - 28.II.2015
15 Balanţa energiei în perioada 1.I - 28.II.2015............... 85 Electric power balance sheet in period 1.I - 28.II.2015
16 Resursele de combustibili solizi şi destinaţiile acestora ....................................................................... 86
Supply of solid fossil fuels and their destinations
17 Balanţa prelucrării ţiţeiului şi a produselor petroliere ...................................................................... 90
Crude oil and petroleum products balance
18 Gaze naturale .............................................................. 92 Natural gas
19 Consumul de combustibili pentru producerea energiei electrice în termocentrale ............................................ 94
Fuel consumption in thermal power stations
20 Stocurile de combustibili existente în termocentrale, la sfârşitul lunii ................................................................. 94
Fuel stocks in thermal power stations at the end of period
Nota metodologică ...................................................... 96 Methodological note
5
EEvvoolluuţţiiaa aaccttiivviittăăţţiiii iinndduussttrriiaallee ddiinn RRoommâânniiaa îînn ppeerriiooaaddaa 11..II--2288..IIII..22001155 Evolution of industrial activity in Romania during the period 1.I-28.II.2015
1. Indicele producţiei industriale Indicele brut al producţiei
industriale în luna februarie 2015comparativ cu luna precedentă, a crescutpe ansamblu cu 4,8% datorită industrieiprelucrătoare (+6,7%). În sectorul producţiei şi furnizării de energie electrică şi termică, gaze, apă caldă şi aer condiţionat şi înindustria extractivă producţia a scăzut cu9,5%, respectiv cu 1,8%.
În industria prelucrătoare producţia a crescut datorită următoarelor ramuri:fabricarea altor produse din minerale nemetalice (+61,6%), repararea, întreţinerea, instalarea maşinilor şi echipamentelor (+39,6%), fabricarea produselor farmaceutice de bază şi a preparatelor farmaceutice (+35,5%), fabri-carea altor mijloace de transport (+33,4%), industria construcţiilor metalice şi a produselor din metal, exclusiv maşini, utilaje şi instalaţii (+18,7%).
Scăderi ale producţiei s-au înregistrat la: industria alimentară (-4,1%), tăbăcirea şi finisarea pieilor, fabricarea articolelor de voiaj şi marochinărie, harnaşamentelor şi încălţămintei, prepararea şi vopsirea blănurilor (-2,2%), fabricarea produselor de cocserie şi a produselor obţinute din prelucrarea ţiţeiului (-2,0%).
Pe marile grupe industriale creşterea producţiei a avut loc în industria bunurilor de capital (+9,7%), industria bunurilor intermediare (+7,8%), industria bunurilor de folosinţă îndelungată (+5,6%) şi descreştere în industria energetică (-8,6%) şi industria bunurilor de uz curent (-0,3%).
În luna februarie 2015 comparativ cu luna februarie 2014 indicele brut al producţiei industriale a crescut cu 3,2% datorită industriei prelucrătoare (+4,7%). În sectorul producţiei şi furnizării de energie electrică şi termică, gaze, apă caldă şi aer condiţionat şi industriaextractivă producţia a scăzut cu 7,0%, respectiv cu 5,9%.
Ramurile industriei prelucrătoare care au determinat creşterea indicelui brut au fost: fabricarea calculatoarelor şi a
1. Industrial production index • Gross industrial production index
of February 2015 as against the previous month registered an increase per total by 4.8% due to manufacturing (+6.7%). In the electricity, gas, steam and air conditioning supply sector and in mining and quarryingproduction decreased by 9.5%, respectively by 1.8%.
In manufacturing production increased
due to the following industrial branches:manufacture of other non-metallic mineral products (+61.6%), repair and installation of machinery and equipment (+39.6%), manufacture of basic pharmaceutical products and pharmaceutical preparations (+35.5%), manufacture of other transport equipment (+33.4%), manufacture of fabricated metal products, except machinery and equipment n.e.c. (+18.7%).
Decreases of the industrial production
have been registered for the following manufacturing branches: manufacture of food products (-4.1%), tanning and dressing of leather; manufacture of travel and leather goods, harness and footwear; preparation and dyeing of furs (-2.2%), manufacture of coke and refined petroleum products (-2.0%).
By main industrial groupings productionincrease took place for capital goods(+9.7%), intermediate goods (+7.8%), consumer durables (+5.6%) and production decreased for energy (-8.6%) and for consumer non-durables (-0.3%).
In February 2015 as compared to
February 2014 gross industrial production index increased by 3.2% due to manufacturing (+4.7%). In the electricity, gas, steam and air conditioning supply sector and in mining and quarrying production decreased by 7.0%, respectively by 5.9%.
The industrial branches which have
especially determinated the increase of the manufacturing gross index were:

6
produselor electronice şi optice (+48,1%),fabricarea produselor din tutun (+26,1%), fabricarea altor produse din minerale nemetalice (+20,4%), fabricarea produselor farmaceutice de bază şi a preparatelor farmaceutice (+19,9%),fabricarea produselor din cauciuc şi mase plastice (+9,0%).
Scăderi ale producţiei s-au înregistrat la: fabricarea produselor textile (-13,0%), tipărirea şi reproducerea pe suporturi a înregistrărilor (-11,3%), tăbăcirea şi finisarea pieilor, fabricarea articolelor de voiaj şi marochinărie, harnaşamentelor şi încălţămintei, prepararea şi vopsirea blănurilor (-4,5%), fabricarea substanţelor şi a produselor chimice (-3,7%), fabricarea articolelor de îmbrăcăminte (-3,5%).
Pe marile grupe industriale creşteri aleproducţiei s-au înregistrat în industria bunurilor de capital (+9,5%) şi industria bunurilor de folosinţă îndelungată (+5,4%) şi scăderi în industria energetică (-4,9%), industria bunurilor de uz curent (-1,3%), industria bunurilor intermediare (-0,3%).
În perioada 1.I-28.II.2015 comparativ cu perioada 1.I-28.II.2014, indicele brut al producţiei industriale a crescut cu 2,4%astfel: industria prelucrătoare (+3,6%), sectorul producţiei şi furnizării de energie electrică şi termică, gaze, apă caldă şi aer condiţionat (-5,8%), industria extractivă (-4,8%).
Ramurile industriei prelucrătoare care au determinat creşterea indicelui brut au fost: fabricarea calculatoarelor şi a produselor electronice şi optice (+57,4%),fabricarea produselor din tutun (+33,0%), fabricarea altor produse din minerale nemetalice (+19,2%), fabricarea produselor din cauciuc şi mase plastice (+10,4%), industria metalurgică (+7,7%).
Scăderi semnificative ale producţiei s-au înregistrat la: tipărirea şi reproducerea pe suporturi a înregistrărilor (-18,1%), fabricarea produselor textile (-13,0%), fabricarea altor mijloace de transport (-8,4%), repararea, întreţinerea, instalarea maşinilor şi echipamentelor (-7,9%), fabricarea de maşini, utilaje şi echipamente n.c.a. (-7,4%).
Pe marile grupe industriale cea mai
manufacture of computers, electronic and optical products (+48.1%), manufacture of tobacco products (+26.1%), manufacture of other non-metallic mineral products (+20.4%), manufacture of basic pharmaceutical products and pharmaceutical preparations (+19.9%), manufacture of rubber and plastic products (+9.0%).
Production decreases were registered in the industrial branches: manufacture of textiles (-13.0%), printing and reproduction of recorded media (-11.3%), tanning and dressing of leather; manufacture of travel and leather goods, harness and footwear; preparation and dyeing of furs (-4.5%), manufacture of chemicals and chemical products (-3.7%), manufacture of wearing apparel (-3.5%).
By main industrial groupings production increases were registered in capital goods (+9.5%) and in consumer durables (+5.4%) and production decreases were registered in energy (-4.9%), consumer non-durables (-1.3%) and intermediate goods (-0.3%).
During the period 1.I-28.II.2015 in
comparison with the period 1.I-28.II.2014 the gross industrial production index increased by 2.4% such as: manufacturing (+3.6%), the electricity, gas, steam and air conditioning supply sector (-5.8%), mining and quarrying (-4.8%).
The manufacturing branches which have
especially determinated the increase of the gross index were: manufacture of computers, electronic and optical products (+57.4%), manufacture of tobacco products (+33.0%), manufacture of other non-metallic mineral products (+19.2%), manufacture of rubber and plastic products (+10.4%), manufacture of basic metals (+7.7%).
Production decreases were registered in the industrial branches: printing and reproduction of recorded media (-18.1%), manufacture of textiles (-13.0%), manufacture of other transport equipment (-8.4%), repair and installation of machinery and equipment (-7.9%), manufacture of machinery and equipment n.e.c. (-7.4%).
By main industrial groupings the highest
7
mare creştere a producţiei s-a înregistrat în industria bunurilor de capital (+7,7%), urmată de industria bunurilor de folosinţă îndelungată (+7,6%) şi scădere în industria energetică (-3,9%), industria bunurilor intermediare (-1,3%) şi industria bunurilor de uz curent (-1,2%).
• Indicele producţiei industriale ajustat în funcţie de numărul de zile lucrătoare a crescut în luna februarie2015 faţă de luna precedentă cu 0,3% datorită industriei prelucrătoare (+3,8%), dar a scăzut în sectorul producţiei şi furnizării de energie electrică şi termică, gaze, apă caldă şi aer condiţionat (-10,9%)şi în industria extractivă (-4,1%).
Ramurile industriei prelucrătoare a căror producţie a crescut semnificativ au fost: fabricarea altor produse din minerale nemetalice (+53,4%), repararea, întreţinerea, instalarea maşinilor şi echipamentelor (+34,9%), fabricarea produselor farmaceutice de bază şi a preparatelor farmaceutice (+31,7%), fabri-carea altor mijloace de transport (+24,3%), fabricarea de maşini, utilaje şi echipamente n.c.a. (+11,2%).
Ramurile industriei prelucrătoare a căror producţie a scăzut au fost: tăbăcirea şi finisarea pieilor, fabricarea articolelor de voiaj şi marochinărie, harnaşamentelor şi încălţămintei, prepararea şi vopsirea blănurilor (-5,6%), fabricarea băuturilor (-5,3%), industria alimentară (-5,0%), fabricarea produselor de cocserie şi a produselor obţinute din prelucrarea ţiţeiului (-4,9%), fabricarea substanţelor şi a produselor chimice (-4,4%).
Pe marile grupe industriale creştereaproducţiei s-a înregistrat în: industria bunurilor de capital (+5,8%), industria bunurilor intermediare (+3,8%), industria bunurilor de folosinţă îndelungată (+1,8%) şi scădere în industria energetică (-8,6%) şi în industria bunurilor de uz curent (-1,9%).
Comparativ cu luna corespunzătoare din anul precedent,în luna februarie 2015 indicele ajustat al producţiei industriale a crescut cu 3,2%, datorită industriei prelucrătoare (+4,7%). În sectorul producţiei şi furnizării de energie electrică şi termică, gaze, apă
production increase was registered in capital goods (+7.7%) followed by consumer durables (+7.6%) and production decreased in energy (-3.9%), intermediate goods(-1.3%) and consumer non-durables (-1.2%).
• Adjusted index of industrial
production according to the number of working days increased in February2015 as against the previous month by0.3% due to manufacturing (+3.8%) and production decreased for the electricity, gas, steam and air conditioning supplysector (-10.9%) and for mining and quarrying (-4.1%).
The manufacturing industrial brancheswhose production meaningful increased were: manufacture of other non-metallic mineral products (+53.4%), repair and installation of machinery and equipment (+34.9%), manufacture of basic pharmaceutical products and pharmaceutical preparations (+31.7%), manufacture of other transport equipment (+24.3%), manufacture of fabricated metal products, except machinery and equipment n.e.c. (+11.2%).
The manufacturing industrial branches which production decreased were: tanningand dressing of leather; manufacture of travel and leather goods, harness and footwear; preparation and dyeing of furs (-5.6%), manufacture of beverages (-5.3%), manufacture of food products (-5.0%), manufacture of coke and refined petroleum products (-4.9%), manufacture of chemicals and chemical products (-4.4%).
By main industrial groupings production
increase has been registered in: capital goods (+5.8%), intermediate goods (+3.8%), consumer durables (+1.8%) and production decreased for energy (-8.6%) and for consumer non-durables (-1.9%).
Compared with the corresponding
month of the previous year in February2015 adjusted index of industrial production increased by 3.2% that increase being determined by manufacturing (+4.7%). In the electricity, gas, steam and air conditioning supply
8
caldă şi aer condiţionat şi în industria extractivă producţia a scăzut cu 7,1%, respectiv cu 5,8%.
În cadrul industriei prelucrătoare, ramurile cu cele mai importante creşteriau fost: fabricarea calculatoarelor şi a produselor electronice şi optice (+47,8%),fabricarea produselor din tutun (+25,8%),fabricarea altor produse din minerale nemetalice (+20,3%), fabricarea produselor farmaceutice de bază şi a preparatelor farmaceutice (+20,0%), fabricarea produselor din cauciuc şi mase plastice (+9,0%).
Scăderi semnificative ale producţiei pot fi menţionate la: fabricarea produselor textile (-13,0%), tipărirea şi reproducerea pe suporturi a înregistrărilor (-11,3%), tăbăcirea şi finisarea pieilor, fabricarea articolelor de voiaj şi marochinărie, harnaşamentelor şi încălţămintei, prepararea şi vopsirea blănurilor (-4,4%), fabricarea substanţelor şi a produselor chimice (-3,8%), fabricarea articolelor de îmbrăcăminte şi fabricarea de mobilă (-3,5% fiecare).
Pe marile grupe industriale producţia a evoluat astfel: industria bunurilor de capital (+9,4%), industria bunurilor de folosinţă îndelungată (+5,5%), industria energetică (-4,7%), industria bunurilor de uz curent (-1,3%), industria bunurilor intermediare(-0,2%).
În perioada 1.I-28.II.2015 comparativ cu perioada 1.I-28.II.2014, indicele ajustat al producţiei industriale a fost mai mare cu 3,6%, creştere determinată de industria prelucrătoare (+5,2%). În sectorul producţiei şi furnizării de energie electrică şi termică, gaze, apă caldă şi aer condiţionat şi în industria extractivăindicele ajustat a scăzut cu 5,5%, respectiv cu 4,5%.
În industria prelucrătoare cele mai mari creşteri ale producţiei s-au înregistrat în ramurile: fabricarea calculatoarelor şi a produselor electronice şi optice (+59,7%), fabricarea produselor din tutun (+29,6%), fabricarea altor produse din minerale nemetalice (+20,1%), fabricarea produselor din cauciuc şi mase plastice (+10,4%), industria alimentară (+8,4%).
sector and in mining and quarryingproduction decreased by 7.1%, respectively by 5.8%.
In manufacturing the industrial branches with the most important increases were: manufacture of computers, electronic and optical products (+47.8%), manufacture of tobacco products (+25.8%), manufacture of other non-metallic mineral products (+20.3%), manufacture of basic pharmaceutical products and pharmaceutical preparations (+20.0%), manufacture of rubber and plastic products (+9.0%).
Production decreases could be
mentioned for: manufacture of textiles (-13.0%), printing and reproduction of recorded media (-11.3%), tanning and dressing of leather; manufacture of travel and leather goods, harness and footwear; preparation and dyeing of furs (-4.4%), manufacture of chemicals and chemical products (-3.8%), manufacture of wearing apparel and manufacture of furniture (-3.5% each other).
By main industrial groupings production
evolved as follows: capital goods (+9.4%),consumer durables (+5.5%), energy (-4.7%), consumer non-durables (-1.3%),intermediate goods (-0.2%).
During the period 1.I-28.II.2015 in
comparison with the period 1.I-28.II.2014adjusted index of industrial production was by 3.6% higher that increase being supported by manufacturing (+5.2%). In the electricity, gas, steam and air conditioning supply sectorand in mining and quarrying the adjustedindustrial production index decreased by 5.5%, respectively by 4.5%.
In manufacturing the highest production
increases were registered in the industrial branches: manufacture of computers, electronic and optical products (+59.7%), manufacture of tobacco products (+29.6%), manufacture of other non-metallic mineral products (+20.1%), manufacture of rubber and plastic products (+10.4%), manufacture of food products (+8.4%).
9
Scăderi ale producţiei pot fi menţionate în ramurile industriale: tipărirea şi reproducerea pe suporturi a înregistrărilor (-17,2%), fabricarea produselor textile (-11,9%), repararea, întreţinerea, instalarea maşinilor şi echipamentelor (-8,7%), fabricarea de maşini, utilaje şi echipamente n.c.a. (-6,8%), fabricarea altor mijloace de transport (-5,9%).
Pe marile grupe industriale s-a înregistrat creşterea producţiei în: industria bunurilor de capital (+9,6%), industria bunurilor de folosinţă îndelungată (+9,4%), industria bunurilor de uz curent (+0,2%), şi scădere în industria energetică (-3,5%) şi industria bunurilor intermediare (-0,3%).
Meaningful production decreases can be mentioned for the industrial branches:printing and reproduction of recorded media (-17.2%), manufacture of textiles (-11.9%),repair and installation of machinery and equipment (-8.7%), manufacture of machinery and equipment n.e.c. (-6.8%), manufacture of other transport equipment (-5.9%).
By main industrial groupings the production increase was registered in: capital goods (+9.6%), consumer durables (+9.4%), consumer non-durables (+0.2%) and production decreased in energy (-3.5%) andintermediate goods (-0.3%).
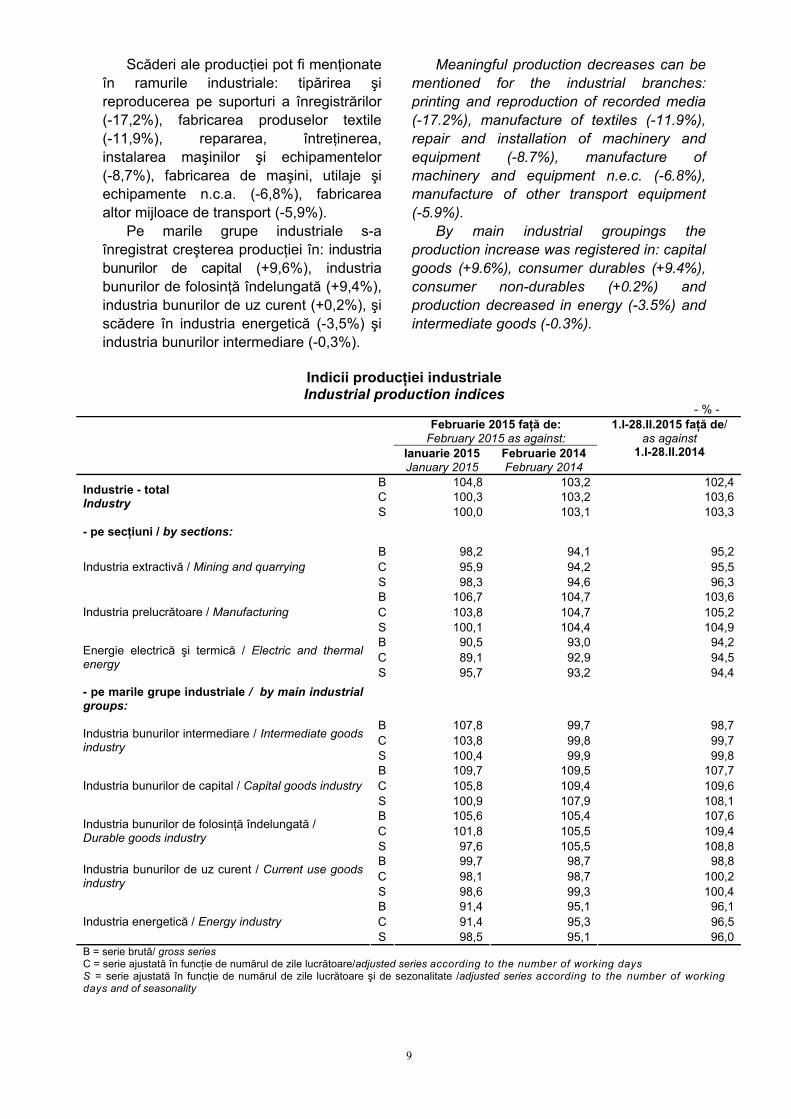
Indicii producţiei industriale Industrial production indices
- % - Februarie 2015 faţă de:
February 2015 as against: Ianuarie 2015 January 2015
Februarie 2014 February 2014
1.I-28.II.2015 faţă de/ as against
1.I-28.II.2014
B 104,8 103,2 102,4 C 100,3 103,2 103,6 Industrie - total
Industry S 100,0 103,1 103,3 - pe secţiuni / by sections:
B 98,2 94,1 95,2 C 95,9 94,2 95,5 Industria extractivă / Mining and quarrying S 98,3 94,6 96,3 B 106,7 104,7 103,6 C 103,8 104,7 105,2 Industria prelucrătoare / Manufacturing S 100,1 104,4 104,9 B 90,5 93,0 94,2 C 89,1 92,9 94,5 Energie electrică şi termică / Electric and thermal
energy S 95,7 93,2 94,4 - pe marile grupe industriale / by main industrial
groups: B 107,8 99,7 98,7 C 103,8 99,8 99,7 Industria bunurilor intermediare / Intermediate goods
industry S 100,4 99,9 99,8 B 109,7 109,5 107,7 C 105,8 109,4 109,6 Industria bunurilor de capital / Capital goods industry S 100,9 107,9 108,1 B 105,6 105,4 107,6 C 101,8 105,5 109,4 Industria bunurilor de folosinţă îndelungată /
Durable goods industry S 97,6 105,5 108,8 B 99,7 98,7 98,8 C 98,1 98,7 100,2 Industria bunurilor de uz curent / Current use goods
industry S 98,6 99,3 100,4 B 91,4 95,1 96,1 C 91,4 95,3 96,5 Industria energetică / Energy industry S 98,5 95,1 96,0
B = serie brută/ gross series C = serie ajustată în funcţie de numărul de zile lucrătoare/adjusted series according to the number of working days S = serie ajustată în funcţie de numărul de zile lucrătoare şi de sezonalitate /adjusted series according to the number of working days and of seasonality
10
2. Indicele productivităţii muncii în industrie
Faţă de luna precedentă, în luna februarie 2015 productivitatea muncii în industrie a crescut cu 4,4% datorită industriei prelucrătoare (+6,2%), dar a scăzut în sectorul producţiei şi furnizării de energie electrică şi termică, gaze, apă caldă şi aer condiţionat (-9,2%) şi în industria extractivă (-1,9%).
Ramurile industriei prelucrătoare a căror productivitate a muncii a crescut semnificativ au fost: fabricarea altor produse din minerale nemetalice (+60,2%), repararea, întreţinerea, instalarea maşinilor şi echipamentelor (+37,6%), fabricarea produselor farmaceutice de bază şi a preparatelor farmaceutice (+35,6%), fabricarea altor mijloace de transport (+32,5%), industria construcţiilor metalice şi a produselor din metal, exclusiv maşini, utilaje şi instalaţii (+18,0%).
Scăderi semnificative ale productivităţii muncii pot fi menţionate la: industria alimentară (-4,2%), tăbăcirea şi finisarea pieilor, fabricarea articolelor de voiaj şi marochinărie, harnaşamentelor şi încălţămintei, prepararea şi vopsirea blănurilor (-2,0%), fabricarea produselor de cocserie şi a produselor obţinute din prelucrarea ţiţeiului (-1,4%).
Pe marile grupe industriale creşteri ale productivităţii muncii s-au înregistrat în industria bunurilor de capital (+9,2%), industria bunurilor intermediare (+7,0%), industria bunurilor de folosinţă îndelungată (+4,2%) şi scăderi în industria energetică (-8,4%) şi industria bunurilor de uz curent (-0,3%).
Comparativ cu luna corespun-zătoare din anul precedent, în luna februarie 2015 productivitatea muncii în industrie a crescut cu 0,1% datorită industriei prelucrătoare (+0,8%) şi a scăzut în sectorul producţiei şi furnizării de energie electrică şi termică, gaze, apă caldă şi aer condiţionat (-3,1%) şi industriei extractive (-2,7%).
Ramurile industriei prelucrătoare a căror productivitate a muncii a crescut semnificativ au fost: fabricarea
3. Labour productivity index in industry
As against the previous month in February 2015 labor productivity in industry increased by 4.4% due to manufacturing (+6.2%) and productivity decreased for the electricity, gas, steam and air conditioning supply sector labor (-9.2%) and for mining and quarrying (-1.9%).
The industrial branches from
manufacturing whose labor productivity meaningful increased were: manufacture of other non-metallic mineral products (+60.2%), repair and installation of machinery and equipment (+37.6%), manufacture of basic pharmaceutical products and pharmaceutical preparations (+35.6%), manufacture of other transport equipment (+32.5%), manufacture of fabricated metal products, except machinery and equipment n.e.c. (+18.0%).
Meaningful decreases of the labor
productivity can be mentioned for the following manufacturing branches: manufacture of food products (-4.2%), tanning and dressing of leather; manufacture of travel and leather goods, harness and footwear; preparation and dyeing of furs (-2.0%), manufacture of coke and refined petroleum products (-1.4%).
By main industrial groupings labor productivity increase was registered in capital goods (+9.2%), intermediate goods (+7.0%), consumer durables (+4.2%) and labor productivity decreased for energy (-8.4%) and for consumer non-durables (-0.3%).
Compared with corresponding
month of previous year labor productivity in industry registered an increase in February 2015 of 0.1% due to manufacturing (+0.8%) and labor productivity decreased in the electricity, gas, steam and air conditioning supply sector (-3.1%) and in mining and quarrying (-2.7%).
The industrial branches which manufacturing labor productivity meaningful increased were: manufacture of computers,
11
calculatoarelor şi a produselor electronice şi optice (+32,3%), fabricarea produselor din tutun (+19,0%), fabricarea altor produse din minerale nemetalice (+14,8%), fabricarea produselor de cocserie şi a produselor obţinute din prelucrarea ţiţeiului (+14,4%), fabricarea produselor farmaceutice de bază şi a preparatelor farmaceutice (+13,7%).
Ramurile industriei prelucrătoare cu productivitatea muncii scăzută: fabricarea produselor textile (-18,8%), tăbăcirea şi finisarea pieilor, fabricarea articolelor de voiaj şi marochinărie, harnaşamentelor şi încălţămintei, prepararea şi vopsirea blănurilor (-10,1%), fabricarea altor mijloace de transport (-7,2%).
Pe marile grupe industriale cea mai mare creştere a productivităţii muncii s-a înregistrat în industria bunurilor de capital (+3,5%), urmată de industria bunurilor de folosinţă îndelungată (+1,6%), industria energetică (+0,8%) şi scădere în industria bunurilor intermediare (-4,7%) şi industria bunurilor de uz curent (-3,4%).
În perioada 1.I-28.II.2015 comparativ cu perioada corespunzătoare din anul precedent, productivitatea muncii în industrie a scăzut cu 0,8% fiind influenţată de sectorul producţiei şi furnizării de energie electrică şi termică, gaze, apă caldă şi aer condiţionat (-1,8%), de industria extractivă (-1,4%) şi industria prelucrătoare (-0,4%).
Ramurile industriei prelucrătoare cu cea mai redusă productivitate a muncii au fost: fabricarea produselor textile (-22,0%), fabricarea altor mijloace de transport (-15,4%), tipărirea şi reproducerea pe suporturi a înregistrărilor (-13,4%), repararea, întreţinerea, instalarea maşinilor şi echipamentelor (-10,0%), fabricarea de maşini, utilaje şi echipamente n.c.a. (-9,1%), iar ramurile cu cea mai ridicată productivitate a muncii au fost: fabricarea calculatoarelor şi a produselor electronice şi optice (+39,3%), fabricarea produselor din tutun (+25,5%), fabricarea altor produse din minerale nemetalice (+14,0%).
electronic and optical products (+32.3%), manufacture of tobacco products (+19.0%), manufacture of other non-metallic mineral products (+14.8%), manufacture of coke and refined petroleum products (+14.4%), manufacture of basic pharmaceutical products and pharmaceutical preparations (+13.7%).
The manufacturing branches with a low
labor productivity were: manufacture of textiles (-18.8%), tanning and dressing of leather; manufacture of travel and leather goods, harness and footwear; preparation and dyeing of furs (-10.1%), manufacture of other transport equipment (-7.2%).
By main industrial groupings the highest
labor productivity was registered in capital goods (+3.5%), followed by consumer durables (+1.6%), energy (+0.8%) and labor productivity decreased for intermediate goods (-4.7%) and consumer non-durables (-3.4%).
During the period 1.I-28.II.2015 in
comparison with the corresponding period of previous year labor productivity in industry decreased by 0.8% beeing influenced by the productivity decrease in the electricity, gas, steam and air conditioning supply sector (-1.8%), in mining and quarrying (-1.4%) and in manufacturing (-0.4%).
The industrial branches with the lowest manufacturing labor productivity were: manufacture of textiles (-22.0%), manufacture of other transport equipment (-15.4%), printing and reproduction of recorded media (-13.4%), repair and installation of machinery and equipment (-10.0%), manufacture of machinery and equipment n.e.c. (-9.1%) and the manufacturing branches which the labor productivity increased were: manufacture of computers, electronic and optical products (+39.3%), manufacture of tobacco products (+25.5%), manufacture of other non-metallic mineral products (+14.0%).
12
Pe marile grupe industriale productivitatea muncii a evoluat astfel: industria bunurilor de folosinţă îndelungată (+3,2%), industria energetică (+2,1%), industria bunurilor de capital (+1,7%), industria bunurilor intermediare (-5,8%), industria bunurilor de uz curent (-3,5%).
By main industrial groupings the labor productivity evolved like this: consumer durables (+3.2%), energy (+2.1%), capital goods (+1.7%), intermediate goods (-5.8%), consumer non-durables (-3.5%).
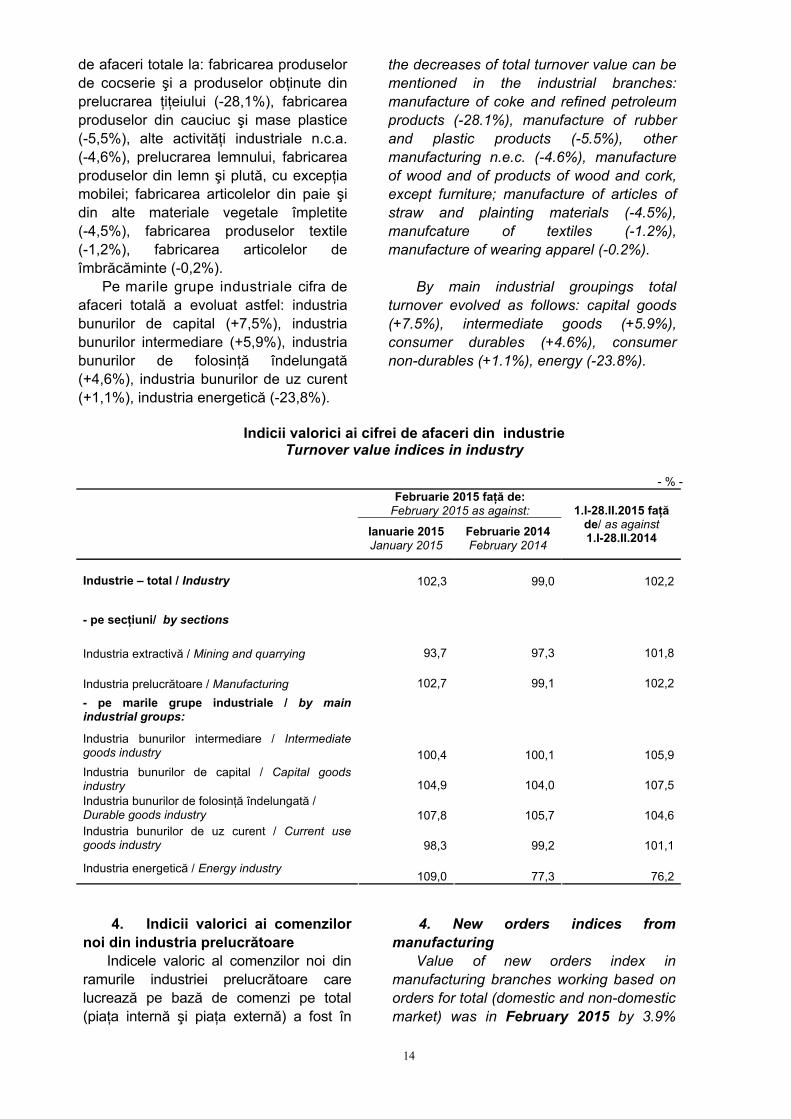
4. Indicii cifrei de afaceri din industrie În luna februarie 2015 comparativ cu luna precedentă, indicele valoric al cifrei de afaceri totale (piaţa internă şi piaţa externă) a unităţilor industriale a fost mai mare cu 2,3% datorită industriei prelucrătoare (+2,7%), dar a scăzut în industria extractivă (-6,3%).
În cadrul industriei prelucrătoare, creşteri importante ale cifrei de afaceri pot fi menţionate la: repararea, întreţinerea, instalarea maşinilor şi echipamentelor (+21,6%), fabricarea altor produse din minerale nemetalice (+21,4%), fabricarea produselor de cocserie şi a produselor obţinute din prelucrarea ţiţeiului (+16,1%), alte activităţi industriale n.c.a. (+15,0%), industria construcţiilor metalice şi a produselor din metal, exclusiv maşini, utilaje şi instalaţii (+8,3%).
Scăderi semnificative ale cifrei de afaceri s-au înregistrat la: industria alimentară (-7,2%), fabricarea altor mijloace de transport (-6,5%), industria metalurgică (-6,2%), fabricarea produselor textile (-3,3%), fabricarea hârtiei şi a produselor din hârtie (-2,3%).
Pe marile grupe industriale indicele valoric al cifrei de afaceri totale a evoluat astfel: industria energetică (+9,0%), industria bunurilor de folosinţă îndelungată (+7,8%), industria bunurilor de capital (+4,9%), industria bunurilor intermediare (+0,4%), industria bunurilor de uz curent (-1,7%).
În luna februarie 2015 comparativ cu luna februarie 2014, indicele valoric al cifrei de afaceri totale (piaţa internă şi piaţa externă) a unităţilor industriale a fost mai mic cu 1,0%, scăderea fiind determinată de industria extractivă (-2,7%) şi de industria prelucrătoare (-0,9%).
3. Industrial turnover indices In February 2015 total turnover value
index of industrial units (domestic and non-domestic market) was by 2.3% higher than in the previous month due to the increase registered in manufacturing (+2.7%) and total turnover decreased for mining and quarring (-6.3%).
In manufacturing important increases of the total turnover value could be mentioned in the industrial branches: repair and installation of machinery and equipment (+21.6%), manufacture of other non-metallic mineral products (+21.4%), manufacture of coke and refined petroleum products (+16.1%), other manufacturing n.e.c. (+15.0%), manufacture of fabricated metal products, except machinery and equipment (+8.3%).
Total turnover value registered important
decreases in the manufacturing industrial branches: manufacture of food products (-7.2%), manufacture of other transport equipment (-6.2%), manufacture of textiles (-3.3%), printing and reproduction of recorded media (-2.3%).
By main industrial groupings the total turnover value index of industrial units evolved such as: energy (+9.0%), consumer durables (+7.8%), capital goods (+4.9%), intermediate goods (+0.4%), consumer non-durables (-1.7%).
In February 2015 than in February
2014 total turnover value index of industrial units (domestic and non-domestic market) was by 1.0% lower that decrease being due to mining and quarrying (-2.7%) and to manufacturing (-0.9%).
13
În industria prelucrătoare cele mai mari scăderi ale cifrei de afaceri s-au obţinut în la: fabricarea produselor de cocserie şi a produselor obţinute din prelucrarea ţiţeiului (-25,8%), fabricarea produselor din cauciuc şi mase plastice (-13.1%), fabricarea altor mijloace de transport (-8,8%), prelucrarea lemnului, fabricarea produselor din lemn şi plută, cu excepţia mobilei; fabricarea articolelor din paie şi din alte materiale vegetale împletite (-5,0%), fabricarea produselor textile (-4,5%).
Creşteri ale cifrei de afaceri pot fi menţionate în ramurile industriale: fabricarea produselor din tutun (+27,7%), fabricarea calculatoarelor şi a produselor electronice şi optice (+23,5%), repararea, întreţinerea şi instalarea maşinilor şi echipamentelor (+20,3%), tipărirea şi reproducerea pe suporturi a înregistrărilor (+6,1%), industria metalurgică (+6,0%).
Pe marile grupe industriale evoluţia cifrei de afaceri arată astfel: industria bunurilor de folosinţă îndelungată (+5,7%), industria bunurilor de capital (+4,0%), industria bunurilor intermediare (+0,1%), industria energetică (-22,7%), industria bunurilor de uz curent (-0,8%).
În perioada 1.I-28.II.2015 comparativ cu perioada 1.I-28.II.2014, indicele valoric al cifrei de afaceri din industrie pe total (piaţa internă şi piaţa externă) a crescut cu 2,2%, datorită industriei prelucrătoare (+2,2%) şi industriei extractive (+1,8%).
În sectorul industriei prelucrătoare cele mai mari creşteri ale cifrei de afaceri totale au avut loc în ramurile: fabricarea produselor din tutun (+25,3%), repararea, întreţinerea şi instalarea maşinilor şi echipamentelor (+24,8%), fabricarea calculatoarelor şi a produselor electronice şi optice (+23,2%), industria metalurgică şi fabricarea altor mijloace de transport (+13,3% fiecare), tipărirea şi reproducerea pe suporturi a înregistrărilor (+9,0%), fabricarea produselor farmaceutice de bază şi a preparatelor farmaceutice (+8,1%) şi scăderi ale cifrei
In manufacturing the highest decreases of total turnover value of industrial units were in the following industrial branches: manufacture of coke and refined petroleum products (-25.8%), manufacture of rubber and plastic products (-13.1%), manufacture of other transport equipment (-8.8%), manufacture of wood and of products of wood and cork, except furniture; manufacture of articles of straw and plainting materials (-5.0%), manufcature of textiles (-4.5%).
Increases of turnover value could be
mentioned in the industrial branches: manufacture of tobacco products (+27.7%), manufacture of computers, electronic and optical products (+23.5%), repair, maintenance and installation of machinery and equipment (+20.3%), printing and reproduction of recorded media (+6.1%), manufacture of basic metals (+6.0%).
By main industrial groupings total
turnover evolution for industrial units looks like this: consumer durables (+5.7%), capital goods (+4.0%), intermediate goods (+0.1%), energy (-22.7%), consumer non-durables (-0.8%).
During the period 1.I-28.II.2015 in
comparison with the period 1.I-28.II.2014 turnover value index in industry for total (domestic and non-domestic market) increased by 2.2% that increase being due to manufacturing (+2.2%) and to mining and quarrying (+1.8%).
In manufacturing sector the highest increases of total turnover value index took place in the following industrial branches: manufacture of tobacco products (+25.3%), repair, maintenance and installation of machinery and equipment (+24.8%), manufacture of computers, electronic and optical products (+23.2%), manufacture of basic metals and manufacture of other transport equipment (+13.3% each other), printing and reproduction of recorded media (+9.0%), manufacture of basic pharmaceutical products and pharmaceutical preparations (+8.1%) and
14
de afaceri totale la: fabricarea produselor de cocserie şi a produselor obţinute din prelucrarea ţiţeiului (-28,1%), fabricarea produselor din cauciuc şi mase plastice (-5,5%), alte activităţi industriale n.c.a. (-4,6%), prelucrarea lemnului, fabricarea produselor din lemn şi plută, cu excepţia mobilei; fabricarea articolelor din paie şi din alte materiale vegetale împletite (-4,5%), fabricarea produselor textile (-1,2%), fabricarea articolelor de îmbrăcăminte (-0,2%).
Pe marile grupe industriale cifra de afaceri totală a evoluat astfel: industria bunurilor de capital (+7,5%), industria bunurilor intermediare (+5,9%), industria bunurilor de folosinţă îndelungată (+4,6%), industria bunurilor de uz curent (+1,1%), industria energetică (-23,8%).
the decreases of total turnover value can be mentioned in the industrial branches: manufacture of coke and refined petroleum products (-28.1%), manufacture of rubber and plastic products (-5.5%), other manufacturing n.e.c. (-4.6%), manufacture of wood and of products of wood and cork, except furniture; manufacture of articles of straw and plainting materials (-4.5%), manufcature of textiles (-1.2%), manufacture of wearing apparel (-0.2%).
By main industrial groupings total
turnover evolved as follows: capital goods (+7.5%), intermediate goods (+5.9%), consumer durables (+4.6%), consumer non-durables (+1.1%), energy (-23.8%).
Indicii valorici ai cifrei de afaceri din industrie
Turnover value indices in industry - % -
Februarie 2015 faţă de: February 2015 as against:
Ianuarie 2015 January 2015
Februarie 2014 February 2014
1.I-28.II.2015 faţă
de/ as against 1.I-28.II.2014
Industrie – total / Industry 102,3 99,0 102,2
- pe secţiuni/ by sections
Industria extractivă / Mining and quarrying 93,7 97,3 101,8
Industria prelucrătoare / Manufacturing 102,7 99,1 102,2 - pe marile grupe industriale / by main
industrial groups: Industria bunurilor intermediare / Intermediate
goods industry 100,4 100,1 105,9 Industria bunurilor de capital / Capital goods
industry 104,9 104,0 107,5 Industria bunurilor de folosinţă îndelungată /
Durable goods industry 107,8 105,7 104,6 Industria bunurilor de uz curent / Current use
goods industry 98,3 99,2 101,1 Industria energetică / Energy industry
109,0 77,3 76,2
4. Indicii valorici ai comenzilor noi din industria prelucrătoare
Indicele valoric al comenzilor noi din ramurile industriei prelucrătoare care lucrează pe bază de comenzi pe total (piaţa internă şi piaţa externă) a fost în
4. New orders indices from manufacturing
Value of new orders index in manufacturing branches working based on orders for total (domestic and non-domestic market) was in February 2015 by 3.9%
15
luna februarie 2015 cu 3,9% mai mic faţă de luna precedentă, scăderi înregistrându-se în ramurile industriale: fabricarea altor mijloace de transport (-74,3%), fabricarea substanţelor şi a produselor chimice (-6,8%), fabricarea produselor textile (-6,0%), industria metalurgică (-4,5%), fabricarea hârtiei şi a produselor din hârtie (-1,9%), fabricarea de maşini, utilaje şi echipamente n.c.a. (-1,5%).
Creşteri ale comenzilor noi pot fi menţionate la: industria construcţiilor metalice şi a produselor din metal, exclusiv maşini, utilaje şi instalaţii (+9,3%), fabricarea autovehiculelor de transport rutier, a remorcilor şi semiremorcilor (+7,1%), fabricarea calculatoarelor şi a produselor electronice şi optice (+3,8%), fabricarea articolelor de îmbrăcăminte (+3,1%), fabricarea echipamentelor electrice (+1,5%).
În ceea ce priveşte marile grupe industriale, indicele valoric al comenzilor noi a evoluat astfel: industria bunurilor de folosinţă îndelungată (+0,9%), industria bunurilor de capital (-6,7%), industria bunurilor de uz curent (-1,1%), industria bunurilor intermediare (-0,5%).
Faţă de luna corespunzătoare din anul precedent, în luna februarie 2015, indicele valoric al comenzilor noi din ramurile industriei prelucrătoare care lucrează pe bază de comenzi pe total (piaţa internă şi piaţa externă) a scăzut cu 7,1%, din cauza următoarelor ramuri industriale: fabricarea altor mijloace se transport (-82,7%), fabricarea produselor textile şi fabricarea de maşini, utilaje şi echipamente n.c.a. (-7,8% fiecare), fabricarea hârtiei şi a produselor din hârtie (-1,8%), fabricarea articolelor de îmbrăcăminte (-1,6%).
Creşterea comenzilor noi a avut loc la: fabricarea calculatoarelor şi a produselor electronice şi optice (+25,4%), fabricarea substanţelor şi a produselor chimice (+6,1%), fabricarea echipamentelor electrice şi fabricarea autovehiculelor de transport rutier, a remorcilor şi semiremorcilor (+5,8% fiecare), industria metalurgică (+2,6%),
lower as against the previous month, decreases being registered in the following industrial branches: manufacture of other transport equipment (-74.3%), manufacture of chemicals and chemical products (-6.8%), manufacture of textiles (-6.0%), manufacture of basic metals (-4.5%), manufacture of paper and paper products (-1.9%), manufacture of machinery and equipment n.e.c. (-1.5%).
New order increases can be mentioned
for: manufacture of fabricated metal products, except machinery and equipment (+9.3%), manufacture of motor vehicles, trailers and semi-trailers (+7.1%), manufacture of computer, electronic and optical products (+3.8%), manufacture of wearing apparel (+3.1%), manufacture of electrical equipment (+1.5%).
Regarding the main industrial
groupings, the value of new orders index evolved as follows: consumer durables (+0.9%), capital goods (-6.7%), consumer non-durables (-1.1%), intermediate goods (-0.5%).
Compared with corresponding
month of previous year in February 2015 value of new orders index in manufacturing branches working based on orders for total (domestic and non-domestic market) decreased by 7.1%, that decrease being supported by the following industrial branches: manufacture of other transport equipment (-82.7%), manufacture of textiles and manufacture of machinery and equipment n.c.a. (-7.8% each other), manufacture of paper and paper products (-1.8%), manufacture of wearing apparel (-1.6%).
Increase of new orders took place in the manufacturing branches: manufacture of computer, electronic and optical products (+25.4%), manufacture of chemicals and chemical products (+6.19%), manufacture of electrical equipment and manufacture of motor vehicles, trailers and semi-trailers (+5.8% each other), manufacture of basic metals (+2.6%), manufacture of basic
16
fabricarea produselor farmaceutice de bază şi a preparatelor farmaceutice (+2,2%), industria construcţiilor metalice şi a produselor din metal, exclusiv maşini, utilaje şi instalaţii (+1,9%).
Pe marile grupe industriale, indicele valoric al comenzilor noi a evoluat astfel: industria bunurilor de folosinţă îndelungată (+22,3%), industria bunurilor intermediare (+2,6%), industria bunurilor de capital (-14,0%), industria bunurilor de uz curent (-2,8%).
În perioada 1.I-28.II.2015 comparativ cu perioada 1.I-28.II.2014, indicele valoric al comenzilor noi din ramurile industriei prelucrătoare care lucrează pe bază de comenzi pe total (piaţa internă şi piaţa externă) a crescut cu 1,4%, în special în următoarele ramuri industriale: fabricarea calculatoarelor şi a produselor electronice şi optice (+27,3%), fabricarea substanţelor şi a produselor chimice (+14,7%), fabricarea echipamentelor electrice (+8,5%), industria metalurgică (+7,2%), fabricarea autovehiculelor de transport rutier, a remorcilor şi semiremorcilor (+4,4%), fabricarea produselor farmaceutice de bază şi a preparatelor farmaceutice (+4,3%), fabricarea hârtiei şi a produselor din hârtie (+3,6%), industria construcţiilor metalice şi a produselor din metal, exclusiv maşini, utilaje şi instalaţii (+1,1%).
Scăderi ale comenzilor noi au avut loc la: fabricarea altor mijloace se transport (-36,6%), fabricarea produselor textile (-2,9%), fabricarea de maşini, utilaje şi echipamente n.c.a. (-2,0%), fabricarea articolelor de îmbrăcăminte (-1,2%).
În ceea ce priveşte marile grupe industriale, indicele valoric al comenzilor noi a evoluat în felul următor: industria bunurilor de folosinţă îndelungată (+24,3%), industria bunurilor intermediare (+6,2%), industria bunurilor de capital (-1,9%), industria bunurilor de uz curent (-0,4%).
pharmaceutical products and pharmaceutical preparations (+2.2%), manufacture of fabricated metal products, except machinery and equipment (+1.9%).
By main industrial groupings, the value
of new order index evolved as follows: consumer durables (+22.3%), intermediate goods (+2.6%), capital goods (-14.0%), consumer non-durables (-2.8%).
During the period 1.I-28.II.2015 in
comparison with the period 1.I-28.II.2014 value of new orders index in manufacturing branches working based on orders for total (domestic and non-domestic market) increased by 1.4%, that increase being supported especially by the following industrial branches: manufacture of computer, electronic and optical products (+27.3%), manufacture of chemicals and chemical products (+14.7%), manufacture of electrical equipments (+8.5%), manufacture of basic metals (+7.2%), manufacture of motor vehicles, trailers and semi-trailers (+4.4%), manufacture of basic pharmaceutical products and pharmaceutical preparations (+4.3%), manufacture of paper and paper products (+3.6%), manufacture of fabricated metal products, except machinery and equipment (+1.1%).
Decreases of the total turnover value
took place at: manufacture of other transport equipment (-36.6%), manufacture of textiles (-2.9%), manufacture of machinery and equipment n.e.c. (-2.0%), manufacture of wearing apparel (-1.2%).
Regarding the main industrial
groupings, the value of new orders indices evolved as follows: consumer durables (+24.3%), intermediate goods (+6.2%), capital goods (-1.9%), consumer non-durables (-0.4%).
17
5. Indicii preţurilor producţiei industriale
În luna februarie 2015 comparativ cu luna ianuarie 2015, preţurile producţiei industriale au crescut cu 0,2%.
Pe sectoare de activitate, preţurile din industria extractivă şi cele din industria prelucrătoare au crescut cu 2,0%, respectiv 0,3%. Preţurile la producţia şi furnizarea de energie electrică şi termică, gaze, apă caldă şi aer condiţionat au scăzut cu 0,6%, iar cele la distribuţia apei; salubritate, gestionarea deşeurilor, activităţi de decontaminare s-au situat la acelaşi nivel înregistrat în luna anterioară.
În industria prelucrătoare, creşteri semnificative de preţuri s-au înregistrat la produsele din ramurile: fabricarea produselor de cocserie şi a produselor obţinute din prelucrarea ţiţeiului (+16,2%), fabricarea produselor farmaceutice de bază şi a preparatelor farmaceutice (+0,8%), fabricarea produselor din tutun (+0,6%), fabricarea băuturilor (+0,4%), fabricarea articolelor de îmbrăcăminte (+0,4%), fabricarea produselor textile (+0,4%).
Scăderi de preţuri au avut loc la produsele din ramurile: fabricarea substanţelor şi a produselor chimice (-3,4%), fabricarea calculatoarelor şi a produselor electronice şi optice (-3,1%), industria construcţiilor metalice şi a produselor din metal, exclusiv maşini, utilaje şi instalaţii (-1,2%), fabricarea altor produse din minerale nemetalice (-0,7%), fabricarea autovehiculelor de transport rutier, a remorcilor şi semiremorcilor (-0,6%).
Pe marile grupe industriale a fost înregistrată următoarea evoluţie a preţurilor: -0,7% pentru produsele din cadrul grupei bunurilor intermediare; -0,9% pentru produsele din cadrul grupei bunurilor de capital; -0,2% pentru produsele din cadrul grupei bunurilor de folosinţă îndelungată; +0,2% pentru produsele din cadrul grupei bunurilor de uz curent; +2,2% pentru produsele din cadrul industriei energetice.
5. Industrial production price indices
In February 2015, compared with January 2015, industrial product prices registered an increased of 0.2%.
By sectors of activity, mining and quarrying and manufacturing product prices registered an increase of 2.0%, respectively of 0.3%. Electricity, gas, steam and air conditioning supply product prices registered a decrease of 0.6%, water supply; sewerage, waste management and remediation activities product prices have been to the same level registered for the previous month.
In manufacturing, price increases were
registered for: manufacture of coke and refined petroleum products (+16.2%), manufacture of basic pharmaceutical products and pharmaceutical preparations (+0.8%), manufacture of tobacco products (+0.6%), manufacture of beverages (+0.4%), manufacture of wearing apparel (+0.4%), manufacture of textiles (+0.4%).
Price decreases were registered for:
manufacture of chemicals and chemical products (-3.4%), manufacture of computer, electronic and optical products (-3.1%), manufacture of fabricated metal products, except machinery and equipment (-1.2%), manufacture of other non-metallic mineral products (-0.7%), manufacture of motor vehicles, trailers and semi-trailers (-0.6%).
By main industrial groupings, the
following increases in prices were registered: -0.7% for products of intermediate goods; -0.9% for products of capital goods; -0.2% for products of consumer durables; +0.2% for products of consumer non-durables; +2.2% for products from the energy.

18
În luna februarie 2015, comparativ cu luna februarie 2014, creşteri de preţ s-au înregistrat la producţia şi furnizarea de energie electrică şi termică, gaze, apă caldă şi aer condiţionat (+4,8%) şi la distribuţia apei; salubritate, gestionarea deşeurilor, activităţi de decontaminare (+2,9%). Industria extractivă şi industria prelucrătoare au înregistrat scăderi de preţ cu 7,4%, respectiv 3,0%.
Pe marile grupe industriale creşteri semnificative de preţuri se remarcă în industria bunurilor de folosinţă îndelungată (+1,1%) şi industria bunurilor de uz curent (+0,9%). Industria energetică, industria bunurilor de capital şi industria bunurilor intermediare au înregistrat scăderi de preţ cu 4,4%, 2,8%, respectiv 0,6%.
In February 2015 compared with February 2014, price increases were registered for electricity, gas, steam and air conditioning supply (+4.8%) and water supply; sewerage, waste management and remediation activities (+2.9%). Mining and quarrying and manufacturing registered a decrease of 7.4%, respectively 3.0%.
By main industrial groupings, significant
increases in the prices were registered for the consumer durables (+1.1%) and the consumer non-durables (+0.9%). The energy, the capital goods and the intermediate goods registered a decrease of 4.4%, 2.8%, respectively of 0.6%.
6. Principalele resurse de
energie primară Principalele resurse de energie
primară, în perioada 1.I-28.II.2015, au totalizat 5333,9,1 mii tone echivalent petrol (tep), în scădere cu 15,4 mii tep faţă de perioada 1.I-28.II.2014.
Producţia internă a însumat 3749,7 mii tep, în creştere cu 4,2% faţă de perioada 1.I-28.II.2014, iar importul a fost de 1584,2 mii tep, în scădere cu 9,5% faţă de perioada 1.I-28.II.2014.
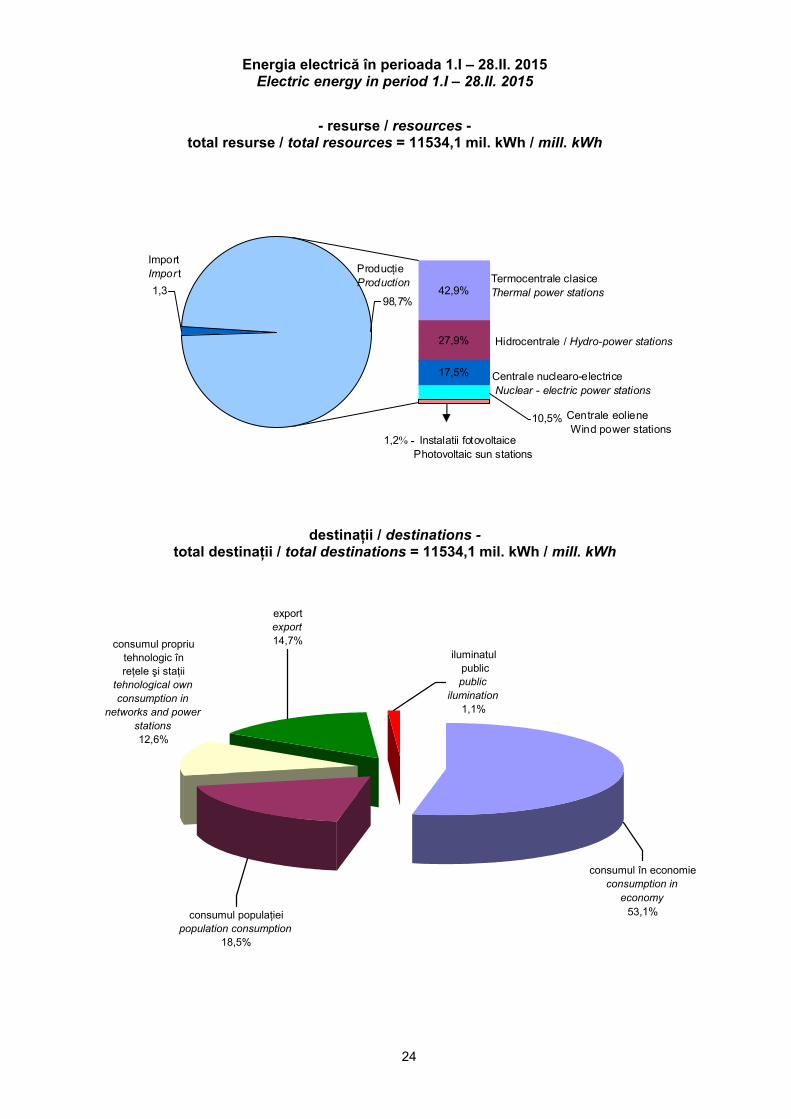
Resursele de energie electrică, în perioada 1.I-28.II.2015, au fost de 11534,1 milioane KWh, în creştere cu 433,1 milioane KWh (+3,9%) faţă de perioada 1.I-28.II.2014. Creşterea resurselor de energie electrică s-a datorat, în principal, creşterii producţiei cu 357,0 milioane KWh (+3,2%).
Producţia din termocentrale a fost de 4878,7 milioane KWh, în scădere cu 911,5 milioane KWh (-15,7%). Producţia din hidrocentrale a fost de 3175,3 milioane KWh în creştere cu 794,4 milioane KWh (+33,4%), iar cea din centrale nuclearo-electrice a fost de 1991,9 milioane KWh, în scădere cu 9,9 milioane KWh (-0,5%). Producţia din centralele electrice eoliene, în perioada 1.I-28.II.2015, a fost de 1201,5 milioane KWh în creştere cu 391,1
6. Main resources of primary energy
Main resources of primary energy in the period 1.I-28.II.2015 as against the period 1.I-28.II.2014, amounted to 5333.9 thou tones equivalent oil (teo), decreasing by 15.4 thou teo.
Domestic production amounted to 3749.7 thou teo increasing by 4.2% as against the period 1.I-28.II.2014 and import was 1584.2 thou teo, decreasing by 9.5% as against the period 1.I-28.II.2014.
Electric energy resources in the period 1.I-28.II.2015 amounted to 11534.1 million KWh, increasing by 433.1 million KWh (+3.9%) as compared with the period 1.I-28.II.2014. The increase of electric energy resources has been due to the production increase by 357.0 million kWh (+3.2%).
The production from thermo-power stations was 4878.7 million KWh decreasing by 911.5 million KWh (-15.7%). The production from hydro-power stations was 3175.3 million KWh increasing by 794.4 million KWh (+33.4%) and the nuclear-power stations production was 1991.9 million kWh decreasing by 9.9 million KWh (-0.5%). The production from the aeolian stations was in the period 1.I-28.II.2015 of 1201.5 million KWh increasing by 391.1

19
milioane KWh faţă de perioada 1.I-28.II.2014, iar energia solară produsă în instalaţii fotovoltaice a fost de 135,1 milioane KWh în creştere cu 92,9 milioane KWh faţă de perioada 1.I-28.II.2014.
Consumul final de energie electrică în economia naţională în perioada 1.I-28.II.2015, a fost de 8385,8 milioane KWh, cu 4,1% mai mic faţă de perioada 1.I-28.II.2014; iluminatul public a înregistrat o creştere cu 20,5%, iar consumul populaţiei a crescut cu 5,3%.
Exportul de energie electrică a fost în perioada 1.I-28.II.2015 de 1690,7 milioane KWh şi a crescut faţă de perioada 1.I-28.II.2014 cu 805,1 milioane KWh (+90,9%).
Consumul propriu tehnologic în reţele şi staţii a fost în perioada 1.I-28.II.2015 de 1457,6 milioane KWh în scădere cu 9,0 milioane KWh (-0,6%) faţă de perioada 1.I-28.II.2014.
million KWh as against the period 1.I-28.II.2014 and the solar energy produced in photovoltaic installations was of 135.1 million KWh, increasing by 92.9 million KWh, as against the period 1.I-28.II.2014.
Final consumption of electric energy
in the period 1.I-28.II.2015 amounted to 8385.8 million KWh, by 4.1% lower than in the period 1.I-28.II.2014; public lighting increased by 20.5% and population consumption increased by 5.3%.
The export of electric energy was in
the period 1.I-28.II.2015 of 1690.7 million KWh increasing by 805.1 million KWh as against the period 1.I-28.II.2014 (+90.9%).
The own techonological consumption
in networks and stations was in the period 1.I-28.II.2015 of 1457.6 million KWh decreasing by 9.0 million kWh (-0.6%) as against the period 1.I-28.II.2014.
7. Comerţ exterior Analizând structura exporturilor FOB
de produse industriale realizate în luna decembrie 2014 se observă că autovehiculele de transport rutier, remorci şi semiremorci deţin ponderea cea mai mare cu o valoare de 677,2 milioane euro, urmate de maşini, utilaje şi echipamente n.c.a. cu o valoare de 331,3 milioane euro, echipamente electrice cu o valoare de 315,3 milioane euro, calculatoare şi produse electronice şi optice cu 210,8 milioane euro, produse ale industriei metalurgice cu o valoare de 208,5 milioane euro.
În luna decembrie 2014, comparativ cu luna decembrie 2013 cele mai mari creşteri ale valorii exportului s-au înregistrat la: energie electrică şi termică, gaze, apă caldă şi aer condiţionat (+81,5%), produse din tututn (+74,5%), echipamente electrice (+20,4%), alte produse din minerale nemetalice (+9,7%), mobilă (+9,3%).
În perioada 1.I-31.XII.2014 comparativ cu perioada 1.I-31.XII.2013 cele mai mari creşteri ale valorii exportului s-au înregistrat la: energie
7. Foreign trade Analyzing the structure of exports FOB
of industrial products achieved in December 2014, one can notice that motor vehicles, trailers and semi-trailers holds the highest weight with € 677.2 million, followed by machinery and equipment n.e.c. € 331.3 million, by electrical equipment € 315.3 million, by computer, electronic and optical products € 210.8 million, by basic metals € 208.5 million.
In December 2014 compared with
December 2013 the highest increases of export value have been registered to: electricity, gas, steam and air conditioning (+81.5%), tobacco products (+74.5%), electrical equipment (+20.4%), other non metallic mineral products (+9.7%), furniture (+9.3%).
During the period 1.I-31.XII.2014 in
comparison with the period 1.I-31.XII.2013 the highest increases of export value have been registered to:
20
electrică şi termică, gaze, apă caldă şi aer condiţionat (+209,6%), cărbune şi lignit (+80,0%), produse din tututn (+35,7%), echipamente electrice (+18,3%), produse de cocserie; produse obţinute din prelucrarea ţiţeiului (+17,5%).
Analizând structura importurilor CIF de produse industriale realizate în luna decembrie 2014 se observă că ramura industrială maşini, utilaje şi echipamente n.c.a. deţine ponderea cea mai mare cu o valoare de 513,2 milioane euro, urmată de calculatoare şi produse electronice şi optice cu 458,9 milioane euro, autovehiculele de transport rutier, remorci şi semiremorci cu o valoare de 416,4 milioane euro, echipamente electrice cu o valoare de 367,6 milioane euro, substanţe şi produse chimice cu o valoare de 354,5 milioane euro.
În luna decembrie 2014 comparativ cu luna decembrie 2013, creşteri semnificative ale valorii importului au avut loc în ramurile industriale: energie electrică şi termică, gaze, apă caldă şi aer condiţionat (+400,6%), băuturi (+24,4%), alte produse industriale n.c.a. (+20,2%), maşini, utilaje şi echipamente n.c.a. (+18,8%), alte produse din minerale nemetalice (+18,6%).
În perioada 1.I-31.XII.2014 comparativ cu perioada 1.I-31.XII.2013, cele mai mari creşteri ale valorii importului s-au înregistrat la: energie electrică şi termică, gaze, apă caldă şi aer condiţionat (+64,8%), autovehicule de transport rutier, remorci şi semiremorci (+16,0%), piei şi produse din piele (+15,6%), alte produse industriale n.c.a. (+14,8%), produse ale industriei metalurgice (+12,4%).
electricity, gas, steam and air conditioning (+209.6%), coal and lignite (+80.0%), tobacco products (+35.7%), electrical equipment (+18.3%), coke and refined petroleum products (+17.5%).
Analyzing the structure of imports CIF
of industrial products registered in December 2014 one can notice that the industrial branch machinery and equipment n.e.c. holds the highest weight with € 513.2 million, followed by computer, electronic and optical products n.e.c. € 458.9 million, motor vehicles, trailers and semi-trailers with € 416.4 million, by electrical equipment € 367.6 million, by chemicals and chemical products € 354.5 million.
In December 2014 compared with
December 2013 meaningful increases of the import value has been registered to: electricity, gas, steam and air conditioning (+400.6%), beverages (+24.4%), other manufactured goods (+20.2%), machinery and equipment n.e.c. (+18.8%), other non metallic mineral products (+18.6%).
During the period 1.I-31.XII.2014 in
comparison with the period 1.I-31.XII.2013 the highest increases of the import value has been registered to: electricity, gas, steam and air conditioning (+64.8%), motor vehicles, trailers and semi-trailers (+16.0%), other manufactured goods (+14.8%), basic metals (+12.4%).
8. Piaţa forţei de muncă Efectivul salariaţilor din industrie
(din unităţile cu 4 salariaţi şi peste) a fost în luna februarie 2015 de 1317,5 mii persoane, cu 5,1 mii persoane mai mare decât în luna ianuarie 2015.
Industria prelucrătoare deţine ponderea cea mai mare cu 1104,1 mii
8. Labor force market Number of employees in industry (in
the units having 4 employees and over) was in February 2015 1317.5 thou persons, by 5.1 thou persons lower than in January 2015.
Manufacturing holds the highest weight with 1104.1 thou persons followed by water
21
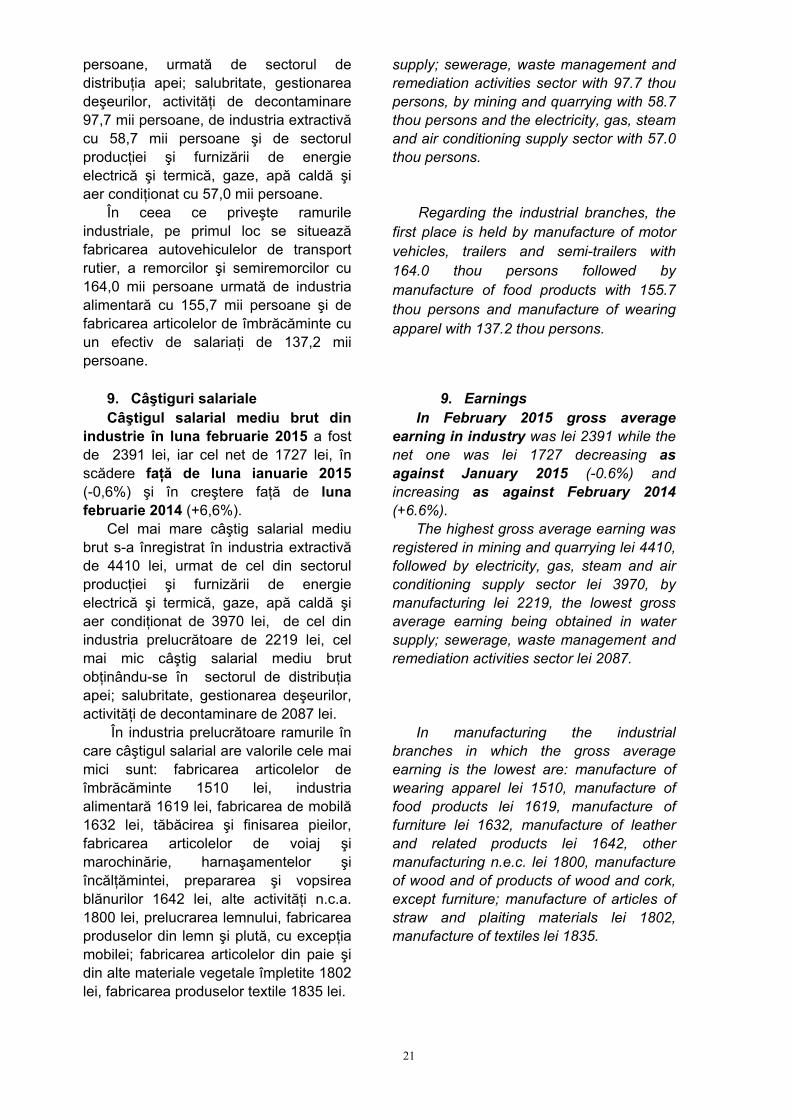
persoane, urmată de sectorul de distribuţia apei; salubritate, gestionarea deşeurilor, activităţi de decontaminare 97,7 mii persoane, de industria extractivă cu 58,7 mii persoane şi de sectorul producţiei şi furnizării de energie electrică şi termică, gaze, apă caldă şi aer condiţionat cu 57,0 mii persoane.
În ceea ce priveşte ramurile industriale, pe primul loc se situează fabricarea autovehiculelor de transport rutier, a remorcilor şi semiremorcilor cu 164,0 mii persoane urmată de industria alimentară cu 155,7 mii persoane şi de fabricarea articolelor de îmbrăcăminte cu un efectiv de salariaţi de 137,2 mii persoane.
supply; sewerage, waste management and remediation activities sector with 97.7 thou persons, by mining and quarrying with 58.7 thou persons and the electricity, gas, steam and air conditioning supply sector with 57.0 thou persons.
Regarding the industrial branches, the
first place is held by manufacture of motor vehicles, trailers and semi-trailers with 164.0 thou persons followed by manufacture of food products with 155.7 thou persons and manufacture of wearing apparel with 137.2 thou persons.
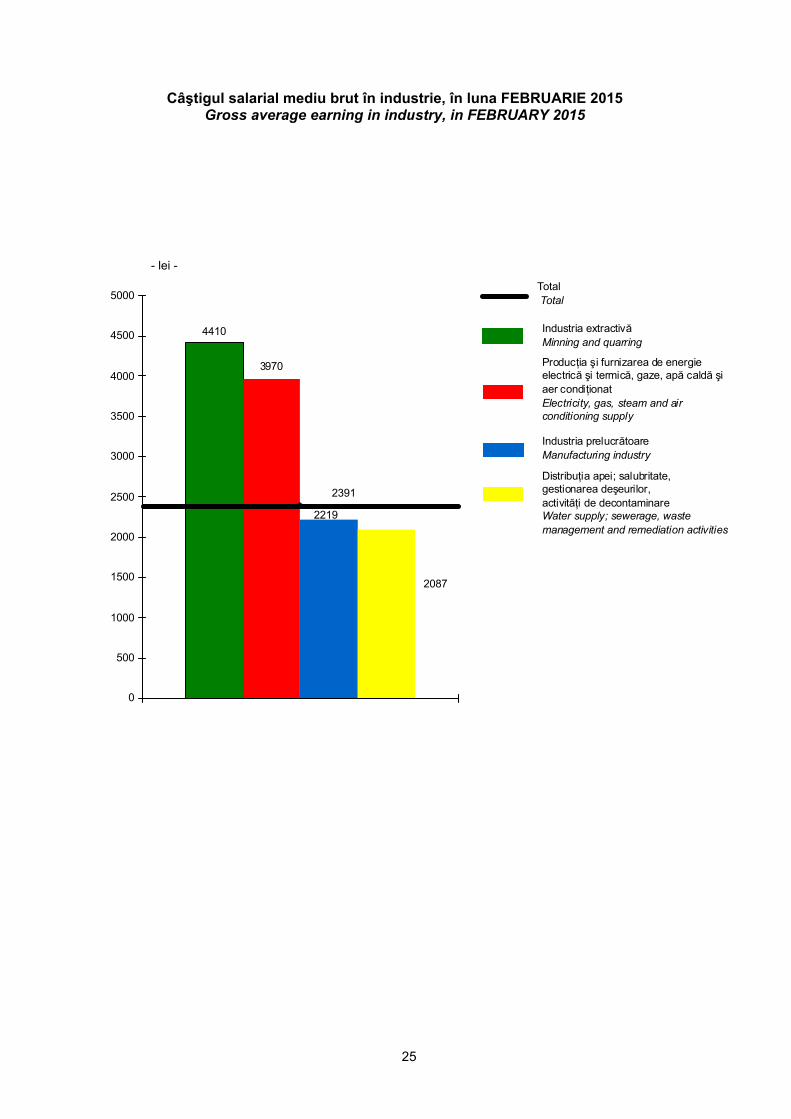
9. Câştiguri salariale Câştigul salarial mediu brut din
industrie în luna februarie 2015 a fost de 2391 lei, iar cel net de 1727 lei, în scădere faţă de luna ianuarie 2015 (-0,6%) şi în creştere faţă de luna februarie 2014 (+6,6%).
Cel mai mare câştig salarial mediu brut s-a înregistrat în industria extractivă de 4410 lei, urmat de cel din sectorul producţiei şi furnizării de energie electrică şi termică, gaze, apă caldă şi aer condiţionat de 3970 lei, de cel din industria prelucrătoare de 2219 lei, cel mai mic câştig salarial mediu brut obţinându-se în sectorul de distribuţia apei; salubritate, gestionarea deşeurilor, activităţi de decontaminare de 2087 lei.
În industria prelucrătoare ramurile în care câştigul salarial are valorile cele mai mici sunt: fabricarea articolelor de îmbrăcăminte 1510 lei, industria alimentară 1619 lei, fabricarea de mobilă 1632 lei, tăbăcirea şi finisarea pieilor, fabricarea articolelor de voiaj şi marochinărie, harnaşamentelor şi încălţămintei, prepararea şi vopsirea blănurilor 1642 lei, alte activităţi n.c.a. 1800 lei, prelucrarea lemnului, fabricarea produselor din lemn şi plută, cu excepţia mobilei; fabricarea articolelor din paie şi din alte materiale vegetale împletite 1802 lei, fabricarea produselor textile 1835 lei.
9. Earnings In February 2015 gross average
earning in industry was lei 2391 while the net one was lei 1727 decreasing as against January 2015 (-0.6%) and increasing as against February 2014 (+6.6%).
The highest gross average earning was registered in mining and quarrying lei 4410, followed by electricity, gas, steam and air conditioning supply sector lei 3970, by manufacturing lei 2219, the lowest gross average earning being obtained in water supply; sewerage, waste management and remediation activities sector lei 2087.
In manufacturing the industrial
branches in which the gross average earning is the lowest are: manufacture of wearing apparel lei 1510, manufacture of food products lei 1619, manufacture of furniture lei 1632, manufacture of leather and related products lei 1642, other manufacturing n.e.c. lei 1800, manufacture of wood and of products of wood and cork, except furniture; manufacture of articles of straw and plaiting materials lei 1802, manufacture of textiles lei 1835.
22
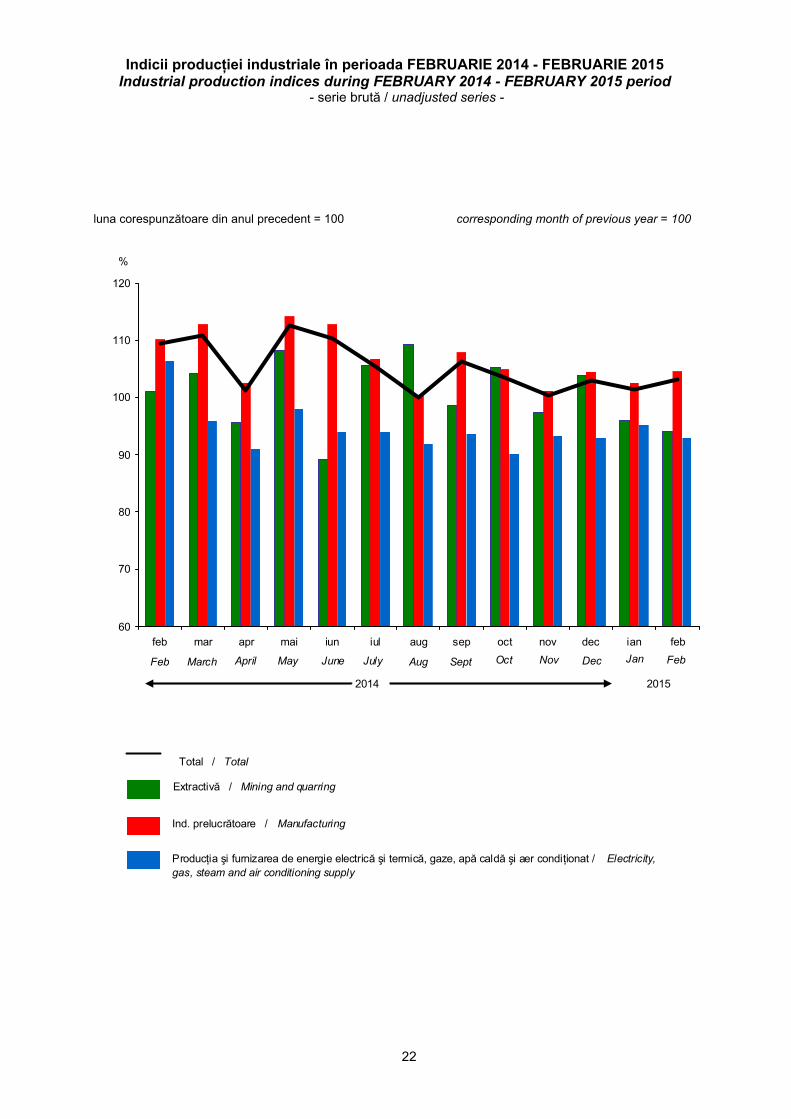
Indicii producţiei industriale în perioada FEBRUARIE 2014 - FEBRUARIE 2015 Industrial production indices during FEBRUARY 2014 - FEBRUARY 2015 period
- serie brută / unadjusted series -
luna corespunzătoare din anul precedent = 100 corresponding month of previous year = 100
60
70
80
90
100
110
120
feb mar apr mai iun iul aug sep oct nov dec ian feb
%
Total / Total
Ind. prelucrătoare / Manufacturing
Extractivă / Mining and quarring
Producţia şi furnizarea de energie electrică şi termică, gaze, apă caldă şi aer condiţionat / Electricity, gas, steam and air conditioning supply
20152014
FebJanDecNovOctSeptAugMayAprilMarchFeb June July

23
Indicii valorici ai cifrei de afaceri din industrie în perioada FEBRUARIE 2014 - FEBRUARIE 2015
Turnover value indices in industry during FEBRUARY 2014 - FEBRUARY 2015 period
luna corespunzătoare din anul precedent = 100 corresponding month of previous year = 100
60
70
80
90
100
110
120
130
140
feb mar apr mai iun iul aug sept oct nov dec ian feb
%
Total / Total
Industria prelucrătoare / Manufacturing
Extractivă / Mining and quarring
20152014
FebJanDecNovOctSeptAugJulyJuneMayFeb AprilMarch
24
Energia electrică în perioada 1.I – 28.II. 2015 Electric energy in period 1.I – 28.II. 2015
- resurse / resources - total resurse / total resources = 11534,1 mil. kWh / mill. kWh
destinaţii / destinations -
total destinaţii / total destinations = 11534,1 mil. kWh / mill. kWh
consumul populaţieipopulation consumption
18,5%
consumul propriu tehnologic în reţele şi staţii
tehnological own consumption in
networks and power stations 12,6%
exportexport14,7%
iluminatul publicpublic
ilumination1,1%
consumul în economieconsumption in
economy53,1%
10,5%
17,5%
27,9%
42,9%1,398,7%
Termocentrale clasice Thermal power stations
Hidrocentrale / Hydro-power stations
Centrale nuclearo-electrice Nuclear - electric power stations
ProducţieProduction
ImportImpor t
Centrale eoliene Wind power stations
1,2% - Instalatii fotovoltaice Photovoltaic sun stations
25
Câştigul salarial mediu brut în industrie, în luna FEBRUARIE 2015 Gross average earning in industry, in FEBRUARY 2015
4410
3970
2219
2087
2391
0
500
1000
1500
2000
2500
3000
3500
4000
4500
5000
Industria extractivăMinning and quarring
Producţia şi furnizarea de energie electrică şi termică, gaze, apă caldă şi aer condiţionatElectricity, gas, steam and air conditioning supply
Industria prelucrătoareManufacturing industry
Total Total
Distribuţia apei; salubritate, gestionarea deşeurilor, activităţi de decontaminareWater supply; sewerage, wastemanagement and remediation activities
- lei -
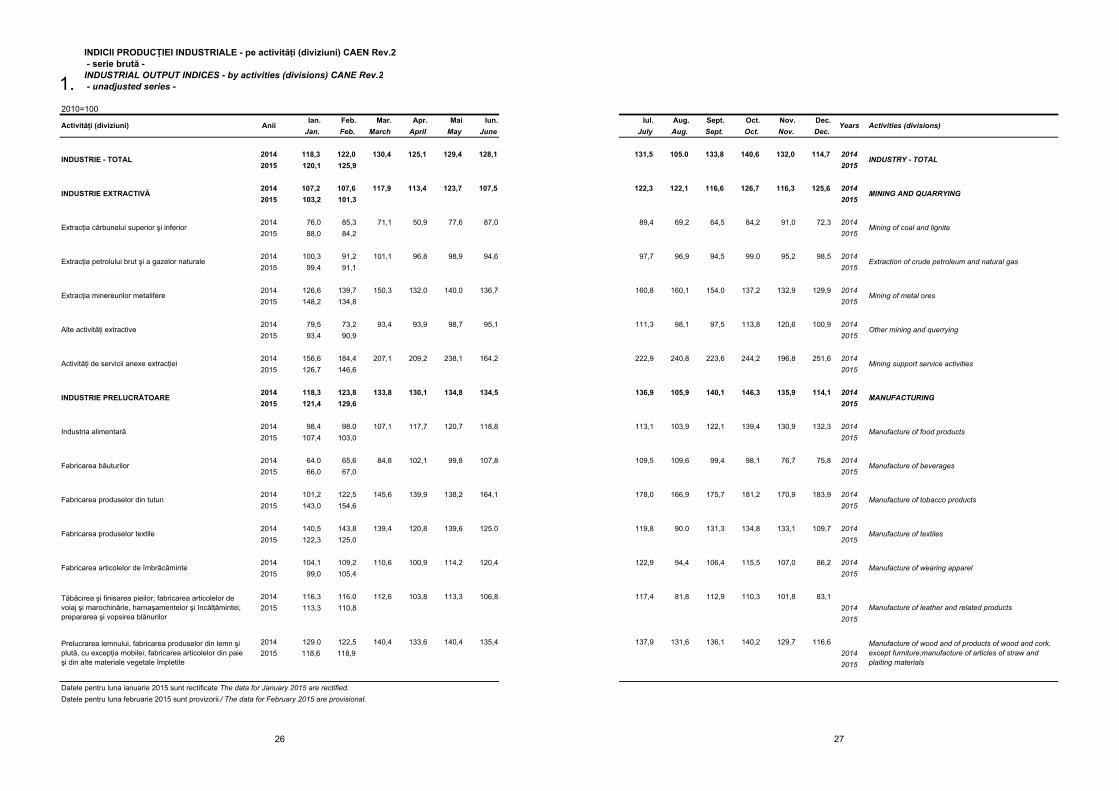
INDICII PRODUCŢIEI INDUSTRIALE - pe activităţi (diviziuni) CAEN Rev.2 - serie brută - INDUSTRIAL OUTPUT INDICES - by activities (divisions) CANE Rev.2 - unadjusted series -
2010=100Ian. Feb. Mar. Apr. Mai Iun.
Jan. Feb. March April May June
2014 118,3 122,0 130,4 125,1 129,4 128,12015 120,1 125,9
2014 107,2 107,6 117,9 113,4 123,7 107,52015 103,2 101,3
2014 76,0 85,3 71,1 50,9 77,6 87,02015 88,0 84,2
2014 100,3 91,2 101,1 96,8 98,9 94,62015 99,4 91,1
2014 126,6 139,7 150,3 132.0 140.0 136,72015 148,2 134,8
2014 79,5 73,2 93,4 93,9 98,7 95,12015 93,4 90,9
2014 156,6 184,4 207,1 209,2 238,1 164,22015 126,7 146,6
2014 118,3 123,8 133,8 130,1 134,8 134,52015 121,4 129,6
2014 98,4 98.0 107,1 117,7 120,7 118,82015 107,4 103,0
2014 64.0 65,6 84,8 102,1 99,8 107,82015 66,0 67,0
2014 101,2 122,5 145,6 139,9 138,2 164,12015 143,0 154,6
2014 140,5 143,8 139,4 120,8 139,6 125.02015 122,3 125,0
2014 104,1 109,2 110,6 100,9 114,2 120,42015 99,0 105,4
2014 116,3 116.0 112,6 103,8 113,3 106,82015 113,3 110,8
2014 129.0 122,5 140,4 133,6 140,4 135,42015 118,6 118,9
Fabricarea produselor din tutun
INDUSTRIE PRELUCRĂTOARE
Industria alimentară
Extracţia minereurilor metalifere
Alte activităţi extractive
Fabricarea băuturilor
Extracţia petrolului brut şi a gazelor naturale
Anii
INDUSTRIE - TOTAL
INDUSTRIE EXTRACTIVĂ
Extracţia cărbunelui superior şi inferior
Activităţi (diviziuni)
Datele pentru luna ianuarie 2015 sunt rectificate The data for January 2015 are rectified.
Prelucrarea lemnului, fabricarea produselor din lemn şi plută, cu excepţia mobilei; fabricarea articolelor din paie şi din alte materiale vegetale împletite
Tăbăcirea şi finisarea pieilor; fabricarea articolelor de voiaj şi marochinărie, harnaşamentelor şi încălţămintei; prepararea şi vopsirea blănurilor
Activităţi de servicii anexe extracţiei
Fabricarea articolelor de îmbrăcăminte
Fabricarea produselor textile
Datele pentru luna februarie 2015 sunt provizorii./ The data for February 2015 are provisional.
1.
26
Iul. Aug. Sept. Oct. Nov. Dec.July Aug. Sept. Oct. Nov. Dec.
131,5 105.0 133,8 140,6 132,0 114,7 20142015
122,3 122,1 116,6 126,7 116,3 125,6 20142015
89,4 69,2 64,5 84,2 91,0 72,3 20142015
97,7 96,9 94,5 99.0 95,2 98,5 20142015
160,8 160,1 154.0 137,2 132,9 129,9 20142015
111,3 98,1 97,5 113,8 120,6 100,9 20142015
222,9 240,8 223,6 244,2 196,8 251,6 20142015
136,9 105,9 140,1 146,3 135,9 114,1 20142015
113,1 103,9 122,1 139,4 130,9 132,3 20142015
109,5 109,6 99,4 98,1 76,7 75,8 20142015
178,0 166,9 175,7 181,2 170,9 183,9 20142015
119,8 90.0 131,3 134,8 133,1 109,7 20142015
122,9 94,4 106,4 115,5 107,0 86,2 20142015
117,4 81,8 112,9 110,3 101,8 83,120142015
137,9 131,6 136,1 140,2 129,7 116,620142015
Manufacture of tobacco products
Other mining and querrying
Mining support service activities
MANUFACTURING
Manufacture of food products
Mining of metal ores
Manufacture of beverages
Years Activities (divisions)
INDUSTRY - TOTAL
MINING AND QUARRYING
Mining of coal and lignite
Extraction of crude petroleum and natural gas
Manufacture of leather and related products
Manufacture of textiles
Manufacture of wearing apparel
Manufacture of wood and of products of wood and cork, except furniture;manufacture of articles of straw and plaiting materials
27
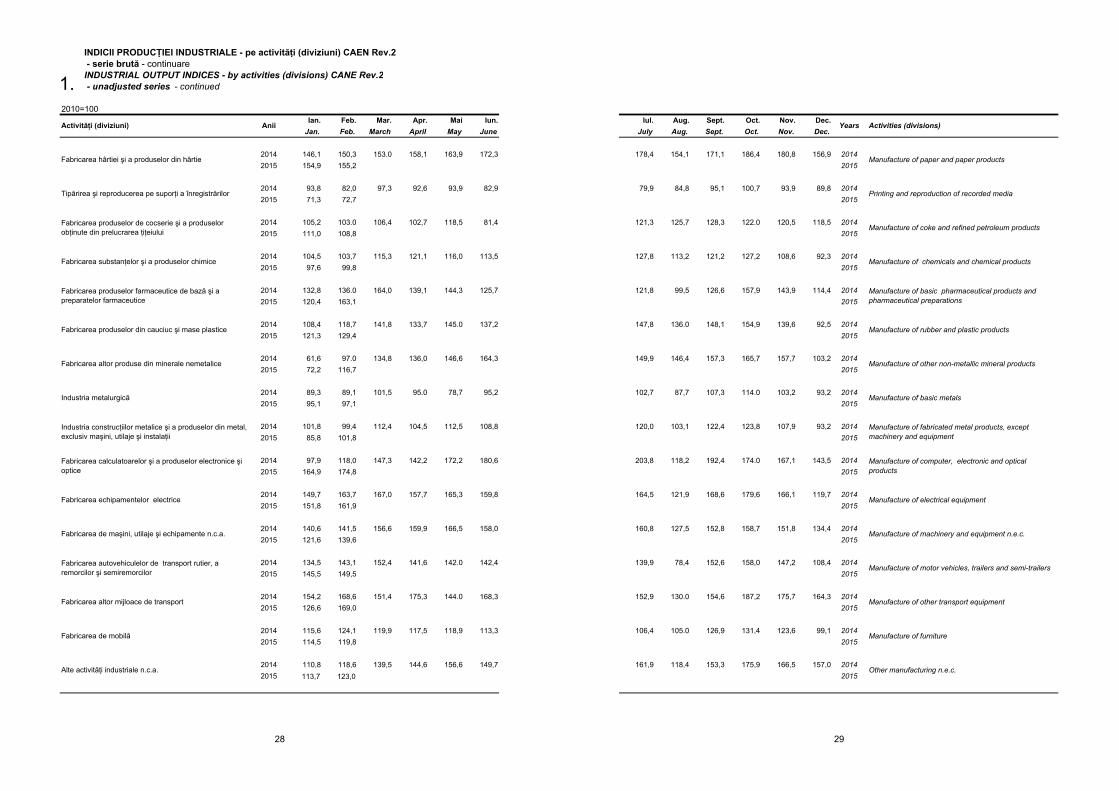
INDICII PRODUCŢIEI INDUSTRIALE - pe activităţi (diviziuni) CAEN Rev.2 - serie brută - continuareINDUSTRIAL OUTPUT INDICES - by activities (divisions) CANE Rev.2 - unadjusted series - continued
2010=100Ian. Feb. Mar. Apr. Mai Iun.
Jan. Feb. March April May June
2014 146,1 150,3 153.0 158,1 163,9 172,32015 154,9 155,2
2014 93,8 82,0 97,3 92,6 93,9 82,92015 71,3 72,7
2014 105,2 103.0 106,4 102,7 118,5 81,42015 111,0 108,8
2014 104,5 103,7 115,3 121,1 116,0 113,52015 97,6 99,8
2014 132,8 136.0 164,0 139,1 144,3 125,72015 120,4 163,1
2014 108,4 118,7 141,8 133,7 145.0 137,22015 121,3 129,4
2014 61,6 97.0 134,8 136,0 146,6 164,32015 72,2 116,7
2014 89,3 89,1 101,5 95.0 78,7 95,22015 95,1 97,1
2014 101,8 99,4 112,4 104,5 112,5 108,82015 85,8 101,8
2014 97,9 118,0 147,3 142,2 172,2 180,62015 164,9 174,8
2014 149,7 163,7 167,0 157,7 165,3 159,82015 151,8 161,9
2014 140,6 141,5 156,6 159,9 166,5 158,02015 121,6 139,6
2014 134,5 143,1 152,4 141,6 142.0 142,42015 145,5 149,5
2014 154,2 168,6 151,4 175,3 144.0 168,32015 126,6 169,0
2014 115,6 124,1 119,9 117,5 118,9 113,32015 114,5 119,8
2014 110,8 118,6 139,5 144,6 156,6 149,72015 113,7 123,0
Industria metalurgică
Activităţi (diviziuni)
Tipărirea şi reproducerea pe suporţi a înregistrărilor
Anii
Fabricarea hârtiei şi a produselor din hârtie
Fabricarea altor mijloace de transport
Fabricarea produselor de cocserie şi a produselor obţinute din prelucrarea ţiţeiului
Fabricarea substanţelor şi a produselor chimice
Fabricarea produselor farmaceutice de bază şi a preparatelor farmaceutice
Fabricarea produselor din cauciuc şi mase plastice
Fabricarea altor produse din minerale nemetalice
Fabricarea calculatoarelor şi a produselor electronice şi optice
Fabricarea de maşini, utilaje şi echipamente n.c.a.
Fabricarea autovehiculelor de transport rutier, a remorcilor şi semiremorcilor
Alte activităţi industriale n.c.a.
Fabricarea de mobilă
Industria construcţiilor metalice şi a produselor din metal, exclusiv maşini, utilaje şi instalaţii
Fabricarea echipamentelor electrice
1.
28
Iul. Aug. Sept. Oct. Nov. Dec.July Aug. Sept. Oct. Nov. Dec.
178,4 154,1 171,1 186,4 180,8 156,9 20142015
79,9 84,8 95,1 100,7 93,9 89,8 20142015
121,3 125,7 128,3 122.0 120,5 118,5 20142015
127,8 113,2 121,2 127,2 108,6 92,3 20142015
121,8 99,5 126,6 157,9 143,9 114,4 20142015
147,8 136.0 148,1 154,9 139,6 92,5 20142015
149,9 146,4 157,3 165,7 157,7 103,2 20142015
102,7 87,7 107,3 114.0 103,2 93,2 20142015
120,0 103,1 122,4 123,8 107,9 93,2 20142015
203,8 118,2 192,4 174.0 167,1 143,5 20142015
164,5 121,9 168,6 179,6 166,1 119,7 20142015
160,8 127,5 152,8 158,7 151,8 134,4 20142015
139,9 78,4 152,6 158,0 147,2 108,4 20142015
152,9 130.0 154,6 187,2 175,7 164,3 20142015
106,4 105.0 126,9 131,4 123,6 99,1 20142015
161,9 118,4 153,3 175,9 166,5 157,0 20142015
Years Activities (divisions)
Manufacture of paper and paper products
Printing and reproduction of recorded media
Manufacture of coke and refined petroleum products
Manufacture of chemicals and chemical products
Manufacture of basic pharmaceutical products and pharmaceutical preparations
Manufacture of rubber and plastic products
Manufacture of other non-metallic mineral products
Manufacture of basic metals
Manufacture of fabricated metal products, except machinery and equipment
Manufacture of computer, electronic and optical products
Manufacture of electrical equipment
Manufacture of machinery and equipment n.e.c.
Manufacture of motor vehicles, trailers and semi-trailers
Manufacture of other transport equipment
Manufacture of furniture
Other manufacturing n.e.c.
29
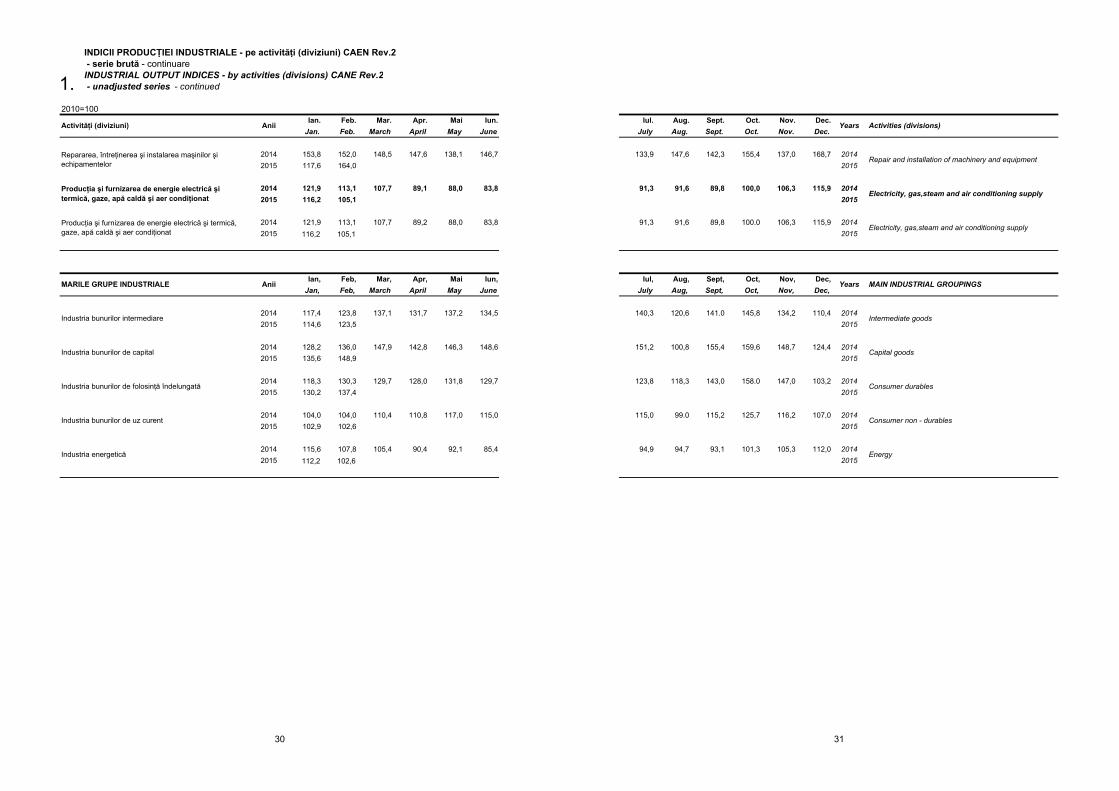
INDICII PRODUCŢIEI INDUSTRIALE - pe activităţi (diviziuni) CAEN Rev.2 - serie brută - continuareINDUSTRIAL OUTPUT INDICES - by activities (divisions) CANE Rev.2 - unadjusted series - continued
2010=100Ian. Feb. Mar. Apr. Mai Iun.
Jan. Feb. March April May June
2014 153,8 152,0 148,5 147,6 138,1 146,72015 117,6 164,0
2014 121,9 113,1 107,7 89,1 88,0 83,82015 116,2 105,1
2014 121,9 113,1 107,7 89,2 88,0 83,82015 116,2 105,1
Ian, Feb, Mar, Apr, Mai Iun,Jan, Feb, March April May June
2014 117,4 123,8 137,1 131,7 137,2 134,52015 114,6 123,5
2014 128,2 136,0 147,9 142,8 146,3 148,62015 135,6 148,9
2014 118,3 130,3 129,7 128,0 131,8 129,72015 130,2 137,4
2014 104,0 104,0 110,4 110,8 117,0 115,02015 102,9 102,6
2014 115,6 107,8 105,4 90,4 92,1 85,42015 112,2 102,6
Activităţi (diviziuni) Anii
Repararea, întreţinerea şi instalarea maşinilor şi echipamentelor
Producţia şi furnizarea de energie electrică şi termică, gaze, apă caldă şi aer condiţionat
MARILE GRUPE INDUSTRIALE
Industria bunurilor intermediare
Industria bunurilor de capital
Industria bunurilor de folosinţă îndelungată
Industria bunurilor de uz curent
Producţia şi furnizarea de energie electrică şi termică, gaze, apă caldă şi aer condiţionat
Industria energetică
Anii
1.
30
Iul. Aug. Sept. Oct. Nov. Dec.July Aug. Sept. Oct. Nov. Dec.
133,9 147,6 142,3 155,4 137,0 168,7 20142015
91,3 91,6 89,8 100,0 106,3 115,9 20142015
91,3 91,6 89,8 100.0 106,3 115,9 20142015
Iul, Aug, Sept, Oct, Nov, Dec,July Aug, Sept, Oct, Nov, Dec,
140,3 120,6 141.0 145,8 134,2 110,4 20142015
151,2 100,8 155,4 159,6 148,7 124,4 20142015
123,8 118,3 143,0 158.0 147,0 103,2 20142015
115,0 99.0 115,2 125,7 116,2 107,0 20142015
94,9 94,7 93,1 101,3 105,3 112,0 20142015
Repair and installation of machinery and equipment
Electricity, gas,steam and air conditioning supply
Electricity, gas,steam and air conditioning supply
Years Activities (divisions)
Consumer non - durables
Energy
MAIN INDUSTRIAL GROUPINGSYears
Intermediate goods
Capital goods
Consumer durables
31
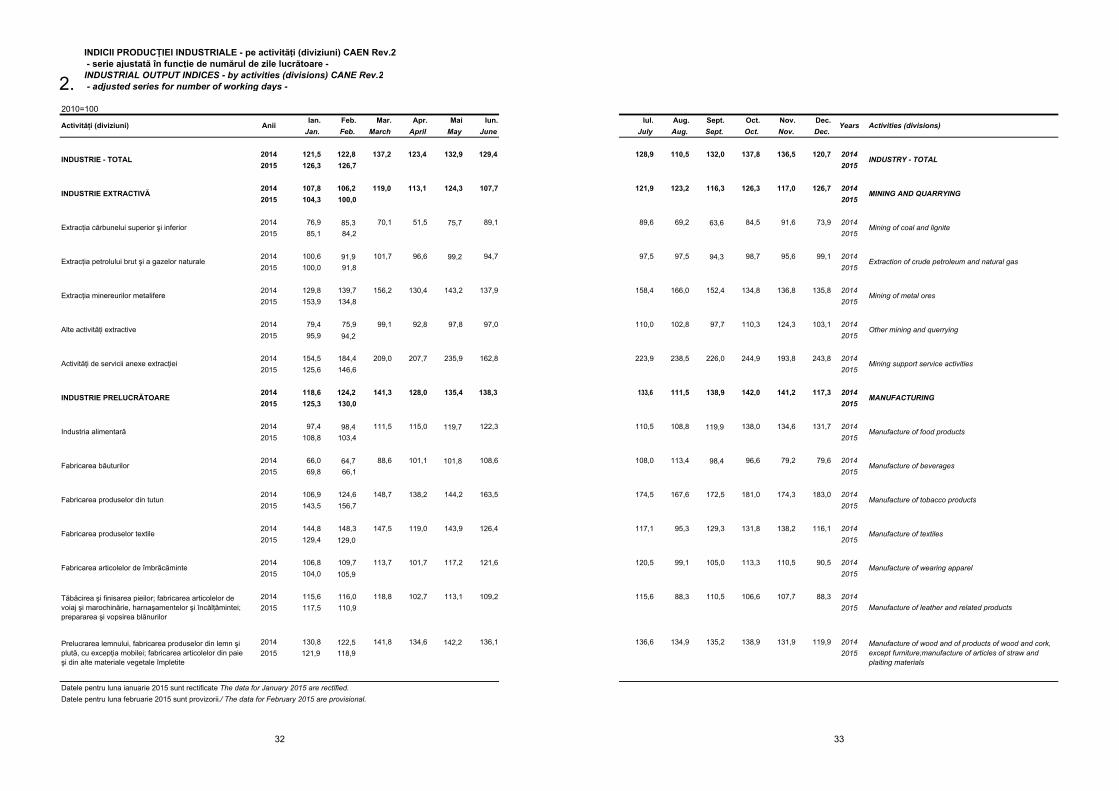
INDICII PRODUCŢIEI INDUSTRIALE - pe activităţi (diviziuni) CAEN Rev.2 - serie ajustată în funcţie de numărul de zile lucrătoare - INDUSTRIAL OUTPUT INDICES - by activities (divisions) CANE Rev.2 - adjusted series for number of working days -
2010=100Ian. Feb. Mar. Apr. Mai Iun.
Jan. Feb. March April May June
2014 121,5 122,8 137,2 123,4 132,9 129,42015 126,3 126,7
2014 107,8 106,2 119,0 113,1 124,3 107,72015 104,3 100,0
2014 76,9 85,3 70,1 51,5 75,7 89,12015 85,1 84,2
2014 100,6 91,9 101,7 96,6 99,2 94,72015 100,0 91,8
2014 129,8 139,7 156,2 130,4 143,2 137,92015 153,9 134,8
2014 79,4 75,9 99,1 92,8 97,8 97,02015 95,9 94,2
2014 154,5 184,4 209,0 207,7 235,9 162,82015 125,6 146,6
2014 118,6 124,2 141,3 128,0 135,4 138,32015 125,3 130,0
2014 97,4 98,4 111,5 115,0 119,7 122,32015 108,8 103,4
2014 66,0 64,7 88,6 101,1 101,8 108,62015 69,8 66,1
2014 106,9 124,6 148,7 138,2 144,2 163,52015 143,5 156,7
2014 144,8 148,3 147,5 119,0 143,9 126,42015 129,4 129,0
2014 106,8 109,7 113,7 101,7 117,2 121,62015 104,0 105,9
2014 115,6 116,0 118,8 102,7 113,1 109,22015 117,5 110,9
2014 130,8 122,5 141,8 134,6 142,2 136,12015 121,9 118,9
Fabricarea băuturilor
Fabricarea produselor din tutun
Fabricarea produselor textile
INDUSTRIE PRELUCRĂTOARE
Industria alimentară
Activităţi de servicii anexe extracţiei
Tăbăcirea şi finisarea pieilor; fabricarea articolelor de voiaj şi marochinărie, harnaşamentelor şi încălţămintei; prepararea şi vopsirea blănurilor
Activităţi (diviziuni) Anii
INDUSTRIE - TOTAL
INDUSTRIE EXTRACTIVĂ
Extracţia cărbunelui superior şi inferior
Extracţia petrolului brut şi a gazelor naturale
Extracţia minereurilor metalifere
Alte activităţi extractive
Fabricarea articolelor de îmbrăcăminte
Prelucrarea lemnului, fabricarea produselor din lemn şi plută, cu excepţia mobilei; fabricarea articolelor din paie şi din alte materiale vegetale împletite
Datele pentru luna ianuarie 2015 sunt rectificate The data for January 2015 are rectified.Datele pentru luna februarie 2015 sunt provizorii./ The data for February 2015 are provisional.
2.
32
Iul. Aug. Sept. Oct. Nov. Dec.July Aug. Sept. Oct. Nov. Dec.
128,9 110,5 132,0 137,8 136,5 120,7 20142015
121,9 123,2 116,3 126,3 117,0 126,7 20142015
89,6 69,2 63,6 84,5 91,6 73,9 20142015
97,5 97,5 94,3 98,7 95,6 99,1 20142015
158,4 166,0 152,4 134,8 136,8 135,8 20142015
110,0 102,8 97,7 110,3 124,3 103,1 20142015
223,9 238,5 226,0 244,9 193,8 243,8 20142015
133,6 111,5 138,9 142,0 141,2 117,3 20142015
110,5 108,8 119,9 138,0 134,6 131,7 20142015
108,0 113,4 98,4 96,6 79,2 79,6 20142015
174,5 167,6 172,5 181,0 174,3 183,0 20142015
117,1 95,3 129,3 131,8 138,2 116,1 20142015
120,5 99,1 105,0 113,3 110,5 90,5 20142015
115,6 88,3 110,5 106,6 107,7 88,3 20142015
136,6 134,9 135,2 138,9 131,9 119,9 20142015
Extraction of crude petroleum and natural gas
Mining of metal ores
Activities (divisions)
INDUSTRY - TOTAL
MINING AND QUARRYING
Mining of coal and lignite
Manufacture of wood and of products of wood and cork, except furniture;manufacture of articles of straw and plaiting materials
Other mining and querrying
Mining support service activities
MANUFACTURING
Manufacture of food products
Manufacture of beverages
Manufacture of leather and related products
Manufacture of tobacco products
Manufacture of textiles
Manufacture of wearing apparel
Years
33
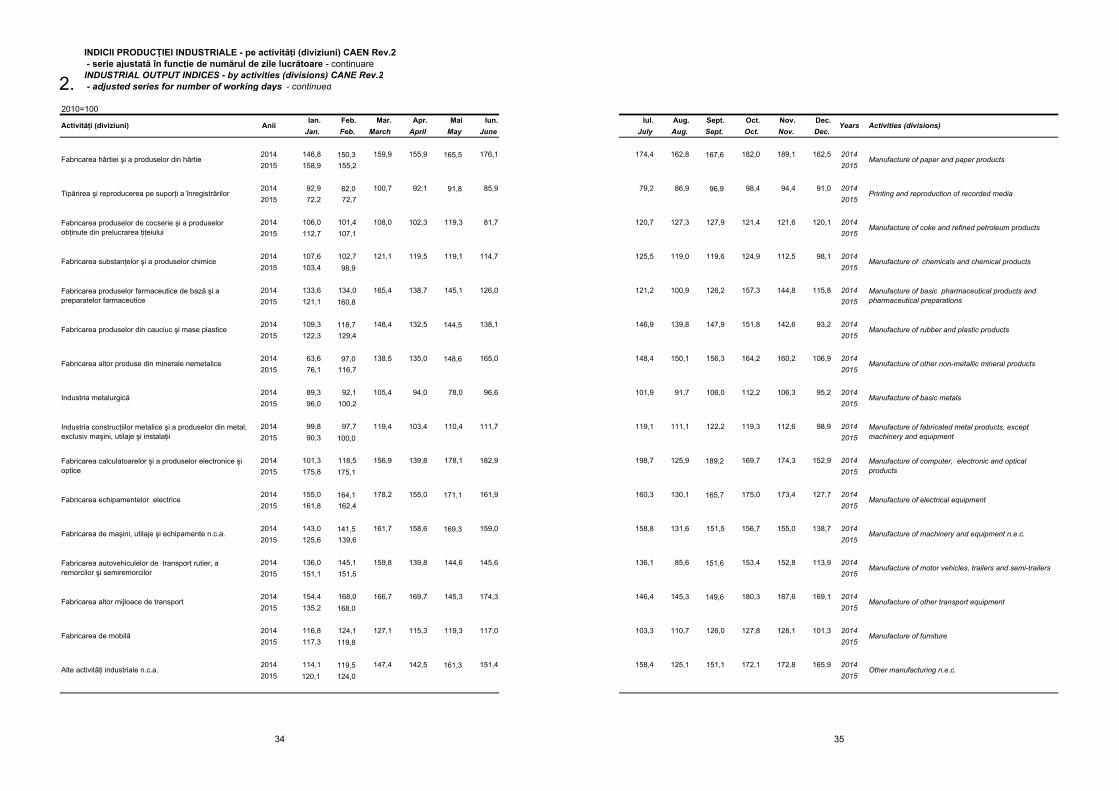
INDICII PRODUCŢIEI INDUSTRIALE - pe activităţi (diviziuni) CAEN Rev.2 - serie ajustată în funcţie de numărul de zile lucrătoare - continuareINDUSTRIAL OUTPUT INDICES - by activities (divisions) CANE Rev.2 - adjusted series for number of working days - continued
2010=100Ian. Feb. Mar. Apr. Mai Iun.
Jan. Feb. March April May June
2014 146,8 150,3 159,9 155,9 165,5 176,12015 158,9 155,2
2014 92,9 82,0 100,7 92,1 91,8 85,92015 72,2 72,7
2014 106,0 101,4 108,0 102,3 119,3 81,72015 112,7 107,1
2014 107,6 102,7 121,1 119,5 119,1 114,72015 103,4 98,9
2014 133,6 134,0 165,4 138,7 145,1 126,02015 121,1 160,8
2014 109,3 118,7 148,4 132,5 144,5 138,12015 122,3 129,4
2014 63,6 97,0 138,5 135,0 148,6 165,02015 76,1 116,7
2014 89,3 92,1 105,4 94,0 78,0 96,62015 96,0 100,2
2014 99,8 97,7 119,4 103,4 110,4 111,72015 90,3 100,0
2014 101,3 118,5 156,9 139,8 178,1 182,92015 175,8 175,1
2014 155,0 164,1 178,2 155,0 171,1 161,92015 161,8 162,4
2014 143,0 141,5 161,7 158,6 169,3 159,02015 125,6 139,6
2014 136,0 145,1 159,8 139,8 144,6 145,62015 151,1 151,5
2014 154,4 168,0 166,7 169,7 145,3 174,32015 135,2 168,0
2014 116,8 124,1 127,1 115,3 119,3 117,02015 117,3 119,8
2014 114,1 119,5 147,4 142,5 161,3 151,42015 120,1 124,0
Activităţi (diviziuni) Anii
Fabricarea hârtiei şi a produselor din hârtie
Tipărirea şi reproducerea pe suporţi a înregistrărilor
Fabricarea autovehiculelor de transport rutier, a remorcilor şi semiremorcilor
Fabricarea altor mijloace de transport
Fabricarea produselor de cocserie şi a produselor obţinute din prelucrarea ţiţeiului
Fabricarea substanţelor şi a produselor chimice
Fabricarea produselor farmaceutice de bază şi a preparatelor farmaceutice
Fabricarea produselor din cauciuc şi mase plastice
Fabricarea altor produse din minerale nemetalice
Industria metalurgică
Industria construcţiilor metalice şi a produselor din metal, exclusiv maşini, utilaje şi instalaţii
Fabricarea calculatoarelor şi a produselor electronice şi optice
Fabricarea de mobilă
Alte activităţi industriale n.c.a.
Fabricarea echipamentelor electrice
Fabricarea de maşini, utilaje şi echipamente n.c.a.
2.
34
Iul. Aug. Sept. Oct. Nov. Dec.July Aug. Sept. Oct. Nov. Dec.
174,4 162,8 167,6 182,0 189,1 162,5 20142015
79,2 86,9 96,9 98,4 94,4 91,0 20142015
120,7 127,3 127,9 121,4 121,6 120,1 20142015
125,5 119,0 119,6 124,9 112,5 98,1 20142015
121,2 100,9 126,2 157,3 144,8 115,8 20142015
146,9 139,8 147,9 151,8 142,6 93,2 20142015
148,4 150,1 156,3 164,2 160,2 106,9 20142015
101,9 91,7 106,0 112,2 106,3 95,2 20142015
119,1 111,1 122,2 119,3 112,6 98,9 20142015
198,7 125,9 189,2 169,7 174,3 152,9 20142015
160,3 130,1 165,7 175,0 173,4 127,7 20142015
158,8 131,6 151,5 156,7 155,0 138,7 20142015
136,1 85,6 151,6 153,4 152,8 113,9 20142015
146,4 145,3 149,6 180,3 187,6 169,1 20142015
103,3 110,7 126,0 127,8 128,1 101,3 20142015
158,4 125,1 151,1 172,1 172,8 165,9 20142015
Years Activities (divisions)
Manufacture of paper and paper products
Printing and reproduction of recorded media
Manufacture of fabricated metal products, except machinery and equipment
Manufacture of computer, electronic and optical products
Manufacture of other non-metallic mineral products
Manufacture of basic metals
Manufacture of coke and refined petroleum products
Manufacture of chemicals and chemical products
Manufacture of basic pharmaceutical products and pharmaceutical preparations
Manufacture of rubber and plastic products
Manufacture of electrical equipment
Manufacture of machinery and equipment n.e.c.
Manufacture of motor vehicles, trailers and semi-trailers
Manufacture of other transport equipment
Manufacture of furniture
Other manufacturing n.e.c.
35
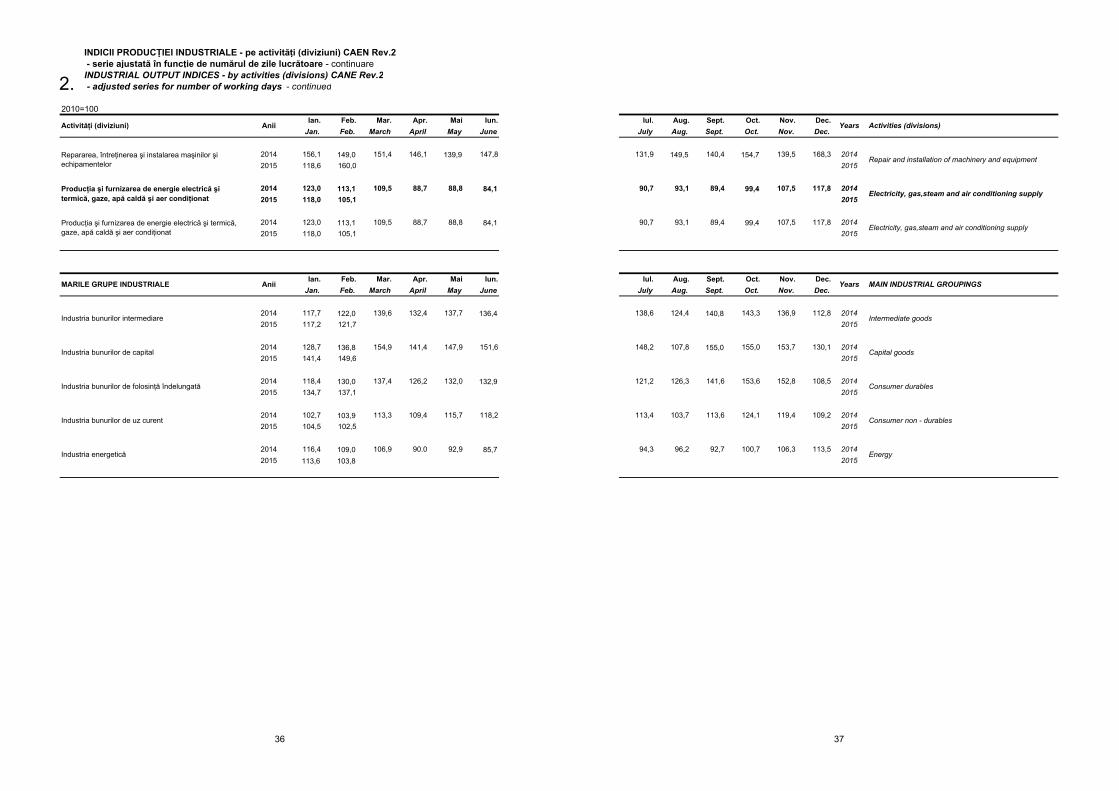
INDICII PRODUCŢIEI INDUSTRIALE - pe activităţi (diviziuni) CAEN Rev.2 - serie ajustată în funcţie de numărul de zile lucrătoare - continuareINDUSTRIAL OUTPUT INDICES - by activities (divisions) CANE Rev.2 - adjusted series for number of working days - continued
2010=100Ian. Feb. Mar. Apr. Mai Iun.
Jan. Feb. March April May June
2014 156,1 149,0 151,4 146,1 139,9 147,82015 118,6 160,0
2014 123,0 113,1 109,5 88,7 88,8 84,12015 118,0 105,1
2014 123,0 113,1 109,5 88,7 88,8 84,12015 118,0 105,1
Ian. Feb. Mar. Apr. Mai Iun.Jan. Feb. March April May June
2014 117,7 122,0 139,6 132,4 137,7 136,42015 117,2 121,7
2014 128,7 136,8 154,9 141,4 147,9 151,62015 141,4 149,6
2014 118,4 130,0 137,4 126,2 132,0 132,92015 134,7 137,1
2014 102,7 103,9 113,3 109,4 115,7 118,22015 104,5 102,5
2014 116,4 109,0 106,9 90.0 92,9 85,72015 113,6 103,8
Activităţi (diviziuni) Anii
Industria bunurilor intermediare
Industria bunurilor de capital
Industria bunurilor de folosinţă îndelungată
Repararea, întreţinerea şi instalarea maşinilor şi echipamentelor
Producţia şi furnizarea de energie electrică şi termică, gaze, apă caldă şi aer condiţionat
Producţia şi furnizarea de energie electrică şi termică, gaze, apă caldă şi aer condiţionat
Anii
Industria energetică
MARILE GRUPE INDUSTRIALE
Industria bunurilor de uz curent
2.
36
Iul. Aug. Sept. Oct. Nov. Dec.July Aug. Sept. Oct. Nov. Dec.
131,9 149,5 140,4 154,7 139,5 168,3 20142015
90,7 93,1 89,4 99,4 107,5 117,8 20142015
90,7 93,1 89,4 99,4 107,5 117,8 20142015
Iul. Aug. Sept. Oct. Nov. Dec.July Aug. Sept. Oct. Nov. Dec.
138,6 124,4 140,8 143,3 136,9 112,8 20142015
148,2 107,8 155,0 155,0 153,7 130,1 20142015
121,2 126,3 141,6 153,6 152,8 108,5 20142015
113,4 103,7 113,6 124,1 119,4 109,2 20142015
94,3 96,2 92,7 100,7 106,3 113,5 20142015
Years Activities (divisions)
Repair and installation of machinery and equipment
Electricity, gas,steam and air conditioning supply
Electricity, gas,steam and air conditioning supply
Years MAIN INDUSTRIAL GROUPINGS
Intermediate goods
Capital goods
Consumer durables
Consumer non - durables
Energy
37
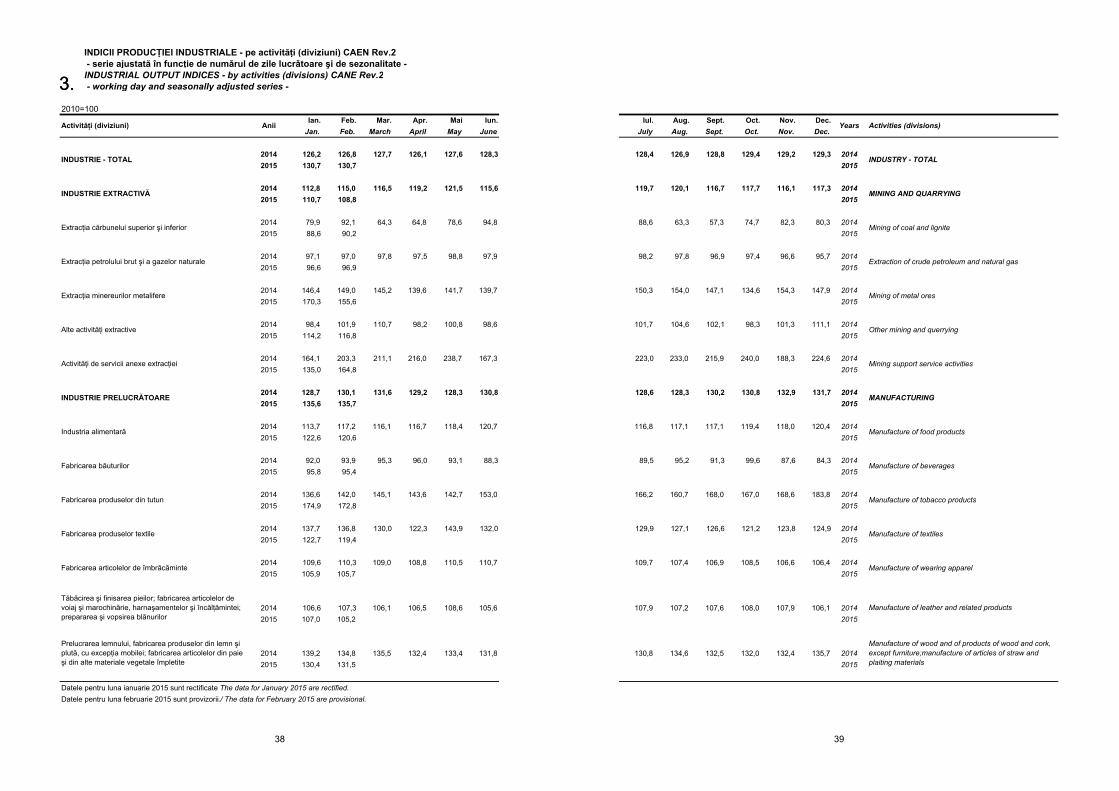
INDICII PRODUCŢIEI INDUSTRIALE - pe activităţi (diviziuni) CAEN Rev.2 - serie ajustată în funcţie de numǎrul de zile lucrǎtoare şi de sezonalitate - INDUSTRIAL OUTPUT INDICES - by activities (divisions) CANE Rev.2 - working day and seasonally adjusted series -
2010=100Ian. Feb. Mar. Apr. Mai Iun.
Jan. Feb. March April May June
2014 126,2 126,8 127,7 126,1 127,6 128,32015 130,7 130,7
2014 112,8 115,0 116,5 119,2 121,5 115,62015 110,7 108,8
2014 79,9 92,1 64,3 64,8 78,6 94,82015 88,6 90,2
2014 97,1 97,0 97,8 97,5 98,8 97,92015 96,6 96,9
2014 146,4 149,0 145,2 139,6 141,7 139,72015 170,3 155,6
2014 98,4 101,9 110,7 98,2 100,8 98,62015 114,2 116,8
2014 164,1 203,3 211,1 216,0 238,7 167,32015 135,0 164,8
2014 128,7 130,1 131,6 129,2 128,3 130,82015 135,6 135,7
2014 113,7 117,2 116,1 116,7 118,4 120,72015 122,6 120,6
2014 92,0 93,9 95,3 96,0 93,1 88,32015 95,8 95,4
2014 136,6 142,0 145,1 143,6 142,7 153,02015 174,9 172,8
2014 137,7 136,8 130,0 122,3 143,9 132,02015 122,7 119,4
2014 109,6 110,3 109,0 108,8 110,5 110,72015 105,9 105,7
2014 106,6 107,3 106,1 106,5 108,6 105,62015 107,0 105,2
2014 139,2 134,8 135,5 132,4 133,4 131,82015 130,4 131,5
Activităţi de servicii anexe extracţiei
INDUSTRIE PRELUCRĂTOARE
Industria alimentară
Extracţia cărbunelui superior şi inferior
Extracţia petrolului brut şi a gazelor naturale
Activităţi (diviziuni) Anii
INDUSTRIE - TOTAL
INDUSTRIE EXTRACTIVĂ
Prelucrarea lemnului, fabricarea produselor din lemn şi plută, cu excepţia mobilei; fabricarea articolelor din paie şi din alte materiale vegetale împletite
Tăbăcirea şi finisarea pieilor; fabricarea articolelor de voiaj şi marochinărie, harnaşamentelor şi încălţămintei; prepararea şi vopsirea blănurilor
Extracţia minereurilor metalifere
Alte activităţi extractive
Fabricarea produselor din tutun
Fabricarea produselor textile
Fabricarea articolelor de îmbrăcăminte
Fabricarea băuturilor
Datele pentru luna ianuarie 2015 sunt rectificate The data for January 2015 are rectified.Datele pentru luna februarie 2015 sunt provizorii./ The data for February 2015 are provisional.
3.3.
38
Iul. Aug. Sept. Oct. Nov. Dec.July Aug. Sept. Oct. Nov. Dec.
128,4 126,9 128,8 129,4 129,2 129,3 20142015
119,7 120,1 116,7 117,7 116,1 117,3 20142015
88,6 63,3 57,3 74,7 82,3 80,3 20142015
98,2 97,8 96,9 97,4 96,6 95,7 20142015
150,3 154,0 147,1 134,6 154,3 147,9 20142015
101,7 104,6 102,1 98,3 101,3 111,1 20142015
223,0 233,0 215,9 240,0 188,3 224,6 20142015
128,6 128,3 130,2 130,8 132,9 131,7 20142015
116,8 117,1 117,1 119,4 118,0 120,4 20142015
89,5 95,2 91,3 99,6 87,6 84,3 20142015
166,2 160,7 168,0 167,0 168,6 183,8 20142015
129,9 127,1 126,6 121,2 123,8 124,9 20142015
109,7 107,4 106,9 108,5 106,6 106,4 20142015
107,9 107,2 107,6 108,0 107,9 106,1 20142015
130,8 134,6 132,5 132,0 132,4 135,7 20142015
Manufacture of wood and of products of wood and cork, except furniture;manufacture of articles of straw and plaiting materials
Other mining and querrying
Mining support service activities
MANUFACTURING
Manufacture of food products
Manufacture of beverages
Manufacture of tobacco products
Manufacture of leather and related products
Extraction of crude petroleum and natural gas
Mining of metal ores
Manufacture of textiles
Manufacture of wearing apparel
Activities (divisions)
INDUSTRY - TOTAL
MINING AND QUARRYING
Mining of coal and lignite
Years
39
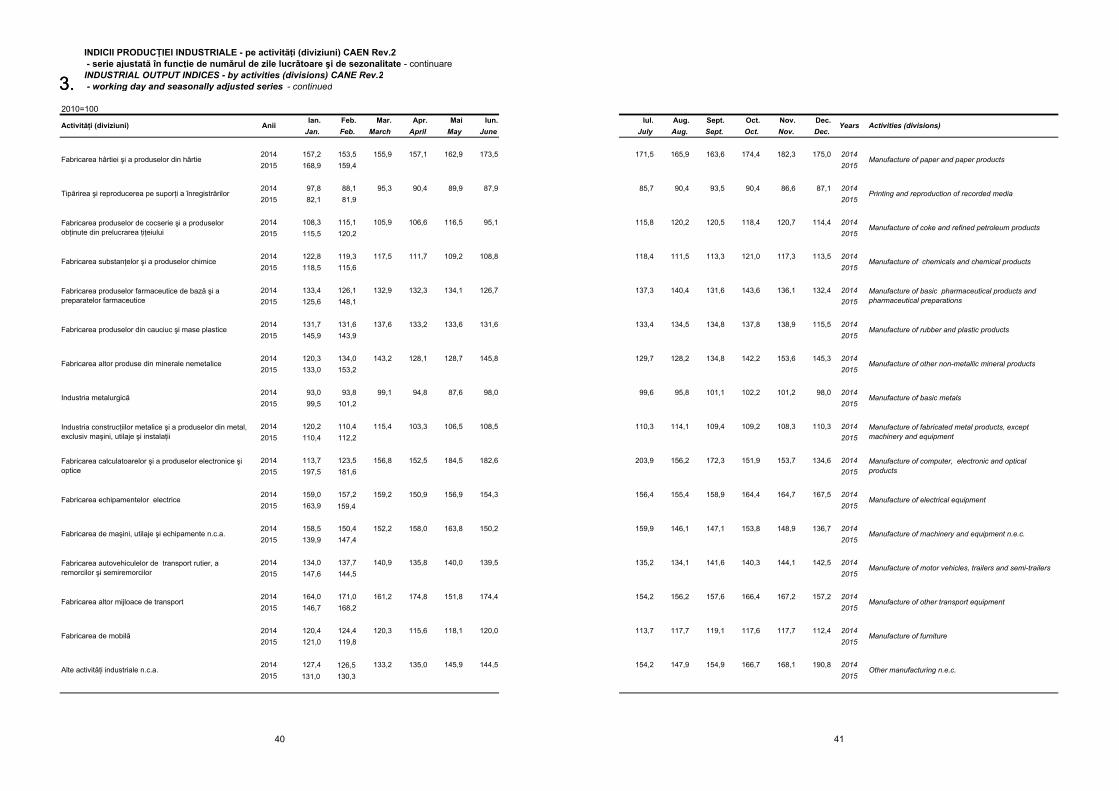
INDICII PRODUCŢIEI INDUSTRIALE - pe activităţi (diviziuni) CAEN Rev.2 - serie ajustată în funcţie de numǎrul de zile lucrǎtoare şi de sezonalitate - continuareINDUSTRIAL OUTPUT INDICES - by activities (divisions) CANE Rev.2 - working day and seasonally adjusted series - continued
2010=100Ian. Feb. Mar. Apr. Mai Iun.
Jan. Feb. March April May June
2014 157,2 153,5 155,9 157,1 162,9 173,52015 168,9 159,4
2014 97,8 88,1 95,3 90,4 89,9 87,92015 82,1 81,9
2014 108,3 115,1 105,9 106,6 116,5 95,12015 115,5 120,2
2014 122,8 119,3 117,5 111,7 109,2 108,82015 118,5 115,6
2014 133,4 126,1 132,9 132,3 134,1 126,72015 125,6 148,1
2014 131,7 131,6 137,6 133,2 133,6 131,62015 145,9 143,9
2014 120,3 134,0 143,2 128,1 128,7 145,82015 133,0 153,2
2014 93,0 93,8 99,1 94,8 87,6 98,02015 99,5 101,2
2014 120,2 110,4 115,4 103,3 106,5 108,52015 110,4 112,2
2014 113,7 123,5 156,8 152,5 184,5 182,62015 197,5 181,6
2014 159,0 157,2 159,2 150,9 156,9 154,32015 163,9 159,4
2014 158,5 150,4 152,2 158,0 163,8 150,22015 139,9 147,4
2014 134,0 137,7 140,9 135,8 140,0 139,52015 147,6 144,5
2014 164,0 171,0 161,2 174,8 151,8 174,42015 146,7 168,2
2014 120,4 124,4 120,3 115,6 118,1 120,02015 121,0 119,8
2014 127,4 126,5 133,2 135,0 145,9 144,52015 131,0 130,3
Fabricarea de maşini, utilaje şi echipamente n.c.a.
Fabricarea hârtiei şi a produselor din hârtie
Tipărirea şi reproducerea pe suporţi a înregistrărilor
Activităţi (diviziuni) Anii
Fabricarea altor produse din minerale nemetalice
Industria metalurgică
Fabricarea autovehiculelor de transport rutier, a remorcilor şi semiremorcilor
Fabricarea echipamentelor electrice
Industria construcţiilor metalice şi a produselor din metal, exclusiv maşini, utilaje şi instalaţii
Fabricarea calculatoarelor şi a produselor electronice şi optice
Fabricarea produselor de cocserie şi a produselor obţinute din prelucrarea ţiţeiului
Fabricarea substanţelor şi a produselor chimice
Fabricarea produselor farmaceutice de bază şi a preparatelor farmaceutice
Fabricarea produselor din cauciuc şi mase plastice
Alte activităţi industriale n.c.a.
Fabricarea altor mijloace de transport
Fabricarea de mobilă
3.3.
40
Iul. Aug. Sept. Oct. Nov. Dec.July Aug. Sept. Oct. Nov. Dec.
171,5 165,9 163,6 174,4 182,3 175,0 20142015
85,7 90,4 93,5 90,4 86,6 87,1 20142015
115,8 120,2 120,5 118,4 120,7 114,4 20142015
118,4 111,5 113,3 121,0 117,3 113,5 20142015
137,3 140,4 131,6 143,6 136,1 132,4 20142015
133,4 134,5 134,8 137,8 138,9 115,5 20142015
129,7 128,2 134,8 142,2 153,6 145,3 20142015
99,6 95,8 101,1 102,2 101,2 98,0 20142015
110,3 114,1 109,4 109,2 108,3 110,3 20142015
203,9 156,2 172,3 151,9 153,7 134,6 20142015
156,4 155,4 158,9 164,4 164,7 167,5 20142015
159,9 146,1 147,1 153,8 148,9 136,7 20142015
135,2 134,1 141,6 140,3 144,1 142,5 20142015
154,2 156,2 157,6 166,4 167,2 157,2 20142015
113,7 117,7 119,1 117,6 117,7 112,4 20142015
154,2 147,9 154,9 166,7 168,1 190,8 20142015
Manufacture of basic metals
Manufacture of motor vehicles, trailers and semi-trailers
Manufacture of computer, electronic and optical products
Manufacture of electrical equipment
Manufacture of machinery and equipment n.e.c.
Years Activities (divisions)
Manufacture of fabricated metal products, except machinery and equipment
Manufacture of other transport equipment
Manufacture of paper and paper products
Printing and reproduction of recorded media
Manufacture of coke and refined petroleum products
Manufacture of chemicals and chemical products
Manufacture of basic pharmaceutical products and pharmaceutical preparations
Manufacture of rubber and plastic products
Manufacture of other non-metallic mineral products
Manufacture of furniture
Other manufacturing n.e.c.
41
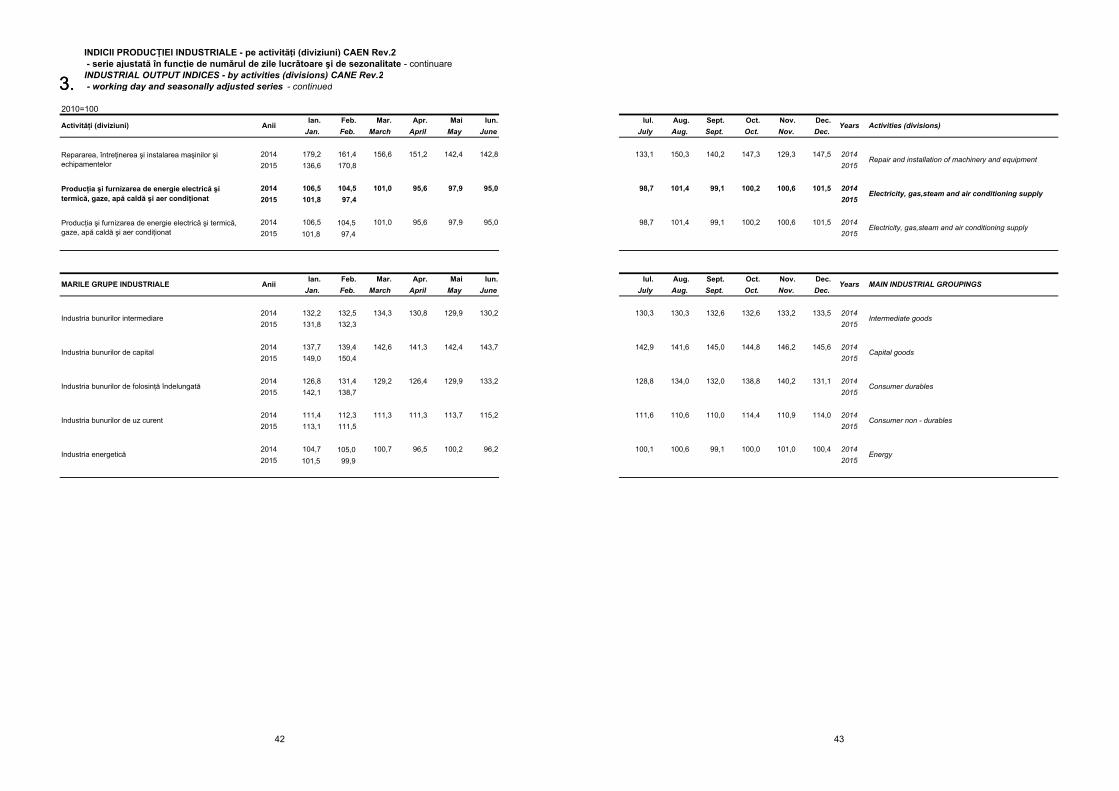
INDICII PRODUCŢIEI INDUSTRIALE - pe activităţi (diviziuni) CAEN Rev.2 - serie ajustată în funcţie de numǎrul de zile lucrǎtoare şi de sezonalitate - continuareINDUSTRIAL OUTPUT INDICES - by activities (divisions) CANE Rev.2 - working day and seasonally adjusted series - continued
2010=100Ian. Feb. Mar. Apr. Mai Iun.
Jan. Feb. March April May June
2014 179,2 161,4 156,6 151,2 142,4 142,82015 136,6 170,8
2014 106,5 104,5 101,0 95,6 97,9 95,02015 101,8 97,4
2014 106,5 104,5 101,0 95,6 97,9 95,02015 101,8 97,4
Ian. Feb. Mar. Apr. Mai Iun.Jan. Feb. March April May June
2014 132,2 132,5 134,3 130,8 129,9 130,22015 131,8 132,3
2014 137,7 139,4 142,6 141,3 142,4 143,72015 149,0 150,4
2014 126,8 131,4 129,2 126,4 129,9 133,22015 142,1 138,7
2014 111,4 112,3 111,3 111,3 113,7 115,22015 113,1 111,5
2014 104,7 105,0 100,7 96,5 100,2 96,22015 101,5 99,9
MARILE GRUPE INDUSTRIALE Anii
Industria bunurilor intermediare
Industria bunurilor de capital
Industria bunurilor de folosinţă îndelungată
Industria bunurilor de uz curent
Activităţi (diviziuni) Anii
Industria energetică
Repararea, întreţinerea şi instalarea maşinilor şi echipamentelor
Producţia şi furnizarea de energie electrică şi termică, gaze, apă caldă şi aer condiţionat
Producţia şi furnizarea de energie electrică şi termică, gaze, apă caldă şi aer condiţionat
3.3.
42
Iul. Aug. Sept. Oct. Nov. Dec.July Aug. Sept. Oct. Nov. Dec.
133,1 150,3 140,2 147,3 129,3 147,5 20142015
98,7 101,4 99,1 100,2 100,6 101,5 20142015
98,7 101,4 99,1 100,2 100,6 101,5 20142015
Iul. Aug. Sept. Oct. Nov. Dec.July Aug. Sept. Oct. Nov. Dec.
130,3 130,3 132,6 132,6 133,2 133,5 20142015
142,9 141,6 145,0 144,8 146,2 145,6 20142015
128,8 134,0 132,0 138,8 140,2 131,1 20142015
111,6 110,6 110,0 114,4 110,9 114,0 20142015
100,1 100,6 99,1 100,0 101,0 100,4 20142015
Activities (divisions)
Consumer non - durables
Energy
MAIN INDUSTRIAL GROUPINGS
Intermediate goods
Capital goods
Consumer durables
Years
Repair and installation of machinery and equipment
Electricity, gas,steam and air conditioning supply
Electricity, gas,steam and air conditioning supply
Years
43

2010=100Ian. Feb. Mar. Apr. Mai Iun.
Jan. Feb. March April May June
2014 113,6 116,4 123,7 118,4 122,1 120,82015 111,6 116,5
2014 116,3 117,1 127,9 121,7 132,4 115,42015 116,1 113,9
2014 89,1 101,3 85,2 60,7 93,2 105,12015 109,3 104,3
2014 116,1 105,7 117,4 112,4 114,8 109,82015 129,3 119,0
2014 123,7 138,6 147,3 129,4 135,4 132,22015 155,8 142,8
2014 83,9 74,9 90,1 84.0 84.0 80,72015 87,7 83,3
2014 116,8 139,3 156,5 159,7 183,4 128,32015 86,9 102,1
2014 110,8 114,9 123,5 119,8 123,7 123,32015 109,0 115,8
2014 95,8 95,4 104,1 114,1 116,6 114,82015 102,4 98,1
2014 72,8 75.0 95,9 115,3 114,7 121,52015 79,2 80,2
2014 100,3 120,2 142,6 136.0 134,9 156,92015 133,6 143,1
2014 109,7 103,6 99,3 86,7 99,1 89,32015 82,2 84,1
2014 107,2 112,1 113,1 103,2 116,9 123,32015 101,1 107,6
2014 110,6 110,9 108,2 98,2 105,1 98,12015 101,7 99,7
2014 120,8 114,4 133,8 128,2 134,5 129,1
2015 110,1 109,3
Datele pentru luna februarie 2015 sunt provizorii./ The data for February 2015 are provisional.Datele pentru luna ianuarie 2015 sunt rectificate The data for January 2015 are rectified.
Industria alimentară
Fabricarea băuturilor
INDUSTRIE PRELUCRĂTOARE
Activităţi (diviziuni) Anii
INDUSTRIE - TOTAL
Extracţia petrolului brut şi a gazelor naturale
Extracţia minereurilor metalifere
Alte activităţi extractive
Prelucrarea lemnului, fabricarea produselor din lemn şi plută, cu excepţia mobilei; fabricarea articolelor din paie şi din alte materiale vegetale împletite
Tăbăcirea şi finisarea pieilor; fabricarea articolelor de voiaj şi marochinărie, harnaşamentelor şi încălţămintei; prepararea şi vopsirea blănurilor
Fabricarea produselor din tutun
Fabricarea produselor textile
INDICII PRODUCTIVITĂŢII MUNCII ÎN INDUSTRIEpe activităţi (diviziuni) CAEN Rev.2LABOUR PRODUCTIVITY INDICES IN INDUSTRYby activities (divisions) CANE Rev.2
Activităţi de servicii anexe extracţiei
INDUSTRIE EXTRACTIVĂ
Extracţia cărbunelui superior şi inferior
Fabricarea articolelor de îmbrăcăminte
4.
44
Iul. Aug. Sept. Oct. Nov. Dec.July Aug. Sept. Oct. Nov. Dec.
123,8 99.0 125,9 131,9 123,4 108,0 20142015
131,6 130,9 125,5 137,4 127,7 139,7 20142015
108,3 84,2 79,6 104,3 113,4 89,9 20142015
119,9 118,8 115,5 121,2 120,0 128,1 20142015
157,3 157,2 151,2 134,6 130,7 127,1 20142015
95,1 80,1 79,4 97,6 103,2 88,2 20142015
152,1 166,8 155.0 168,1 135,3 173,3 20142015
125,2 97.0 127,9 133,1 123,2 104,1 20142015
109,2 99,9 118,6 135,1 126,4 128,0 20142015
126,1 127.0 113,9 113,1 91,6 89,8 20142015
166,5 155,5 164,3 167,2 157,1 170,6 20142015
85,2 64,2 93,1 94,5 92,9 77,3 20142015
125,7 97,5 110,2 118,9 110,2 90,3 20142015
107,9 75,1 103,5 101,9 93,5 76,4 20142015
131,6 127,4 131,5 134,8 124,2 111,0 2014
2015
MANUFACTURING
Manufacture of food products
Manufacture of beverages
Extraction of crude petroleum and natural gas
Mining of metal ores
Other mining and querrying
Mining support service activities
Activities (divisions)
INDUSTRY – TOTAL
MINING AND QUARRYING
Mining of coal and lignite
Years
Manufacture of tobacco products
Manufacture of wood and of products of wood and cork, except furniture; manufacture of articles of straw and plaiting materials
Manufacture of textiles
Manufacture of wearing apparel
Manufacture of leather and related products
45
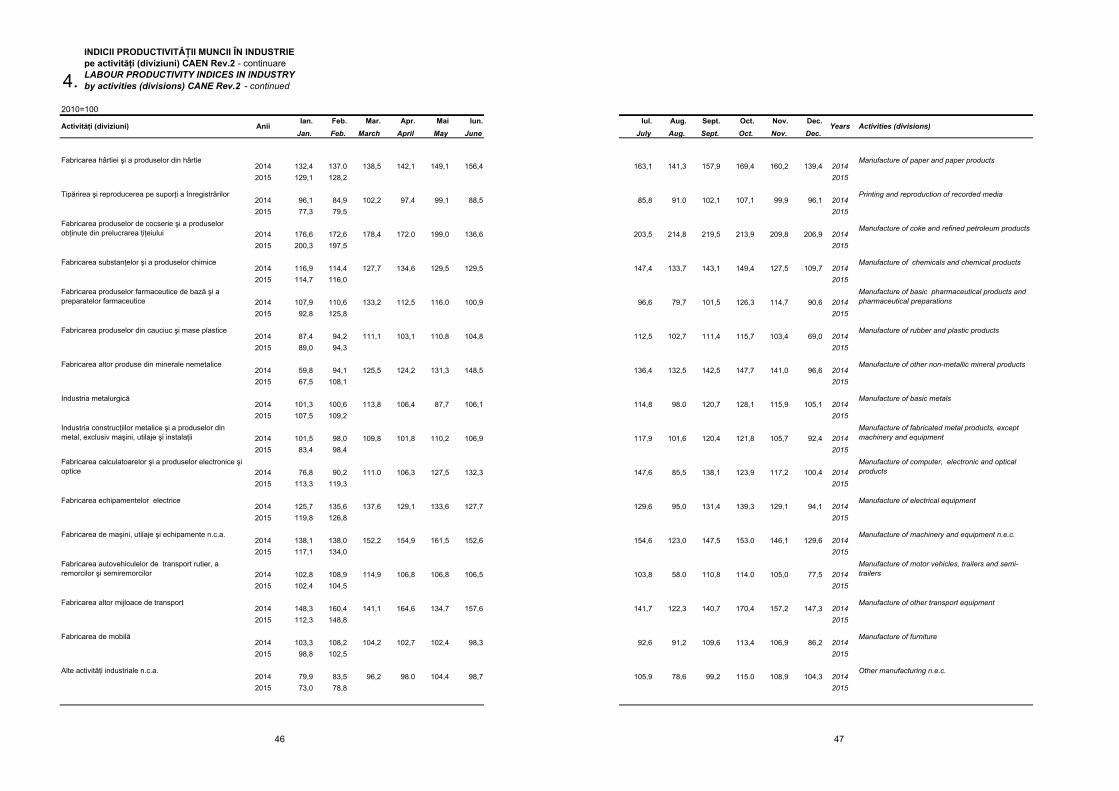
2010=100Ian. Feb. Mar. Apr. Mai Iun.
Jan. Feb. March April May June
2014 132,4 137.0 138,5 142,1 149,1 156,42015 129,1 128,2
2014 96,1 84,9 102,2 97,4 99,1 88,52015 77,3 79,5
2014 176,6 172,6 178,4 172.0 199,0 136,62015 200,3 197,5
2014 116,9 114,4 127,7 134,6 129,5 129,52015 114,7 116,0
2014 107,9 110,6 133,2 112,5 116.0 100,92015 92,8 125,8
2014 87,4 94,2 111,1 103,1 110,8 104,82015 89,0 94,3
2014 59,8 94,1 125,5 124,2 131,3 148,52015 67,5 108,1
2014 101,3 100,6 113,8 106,4 87,7 106,12015 107,5 109,2
2014 101,5 98,0 109,8 101,8 110,2 106,92015 83,4 98,4
2014 76,8 90,2 111.0 106,3 127,5 132,32015 113,3 119,3
2014 125,7 135,6 137,6 129,1 133,6 127,72015 119,8 126,8
2014 138,1 138,0 152,2 154,9 161,5 152,62015 117,1 134,0
2014 102,8 108,9 114,9 106,8 106,8 106,52015 102,4 104,5
2014 148,3 160,4 141,1 164,6 134,7 157,62015 112,3 148,8
2014 103,3 108,2 104,2 102,7 102,4 98,32015 98,8 102,5
2014 79,9 83,5 96,2 98.0 104,4 98,72015 73,0 78,8
Activităţi (diviziuni) Anii
by activities (divisions) CANE Rev.2 - continued
pe activităţi (diviziuni) CAEN Rev.2 - continuareLABOUR PRODUCTIVITY INDICES IN INDUSTRY
Fabricarea hârtiei şi a produselor din hârtie
Tipărirea şi reproducerea pe suporţi a înregistrărilor
Fabricarea produselor de cocserie şi a produselor obţinute din prelucrarea ţiţeiului
Fabricarea substanţelor şi a produselor chimice
INDICII PRODUCTIVITĂŢII MUNCII ÎN INDUSTRIE
Industria construcţiilor metalice şi a produselor din metal, exclusiv maşini, utilaje şi instalaţii
Fabricarea altor mijloace de transport
Fabricarea de mobilă
Alte activităţi industriale n.c.a.
Fabricarea calculatoarelor şi a produselor electronice şi optice
Fabricarea echipamentelor electrice
Fabricarea de maşini, utilaje şi echipamente n.c.a.
Fabricarea autovehiculelor de transport rutier, a remorcilor şi semiremorcilor
Fabricarea produselor farmaceutice de bază şi a preparatelor farmaceutice
Fabricarea produselor din cauciuc şi mase plastice
Fabricarea altor produse din minerale nemetalice
Industria metalurgică
4.
46
Iul. Aug. Sept. Oct. Nov. Dec.July Aug. Sept. Oct. Nov. Dec.
163,1 141,3 157,9 169,4 160,2 139,4 20142015
85,8 91.0 102,1 107,1 99,9 96,1 20142015
203,5 214,8 219,5 213,9 209,8 206,9 20142015
147,4 133,7 143,1 149,4 127,5 109,7 20142015
96,6 79,7 101,5 126,3 114,7 90,6 20142015
112,5 102,7 111,4 115,7 103,4 69,0 20142015
136,4 132,5 142,5 147,7 141,0 96,6 20142015
114,8 98.0 120,7 128,1 115,9 105,1 20142015
117,9 101,6 120,4 121,8 105,7 92,4 20142015
147,6 85,5 138,1 123,9 117,2 100,4 20142015
129,6 95,0 131,4 139,3 129,1 94,1 20142015
154,6 123,0 147,5 153.0 146,1 129,6 20142015
103,8 58.0 110,8 114.0 105,0 77,5 20142015
141,7 122,3 140,7 170,4 157,2 147,3 20142015
92,6 91,2 109,6 113,4 106,9 86,2 20142015
105,9 78,6 99,2 115.0 108,9 104,3 20142015
Activities (divisions)Years
Manufacture of paper and paper products
Printing and reproduction of recorded media
Manufacture of coke and refined petroleum products
Manufacture of chemicals and chemical products
Manufacture of basic pharmaceutical products and pharmaceutical preparations
Manufacture of rubber and plastic products
Manufacture of other non-metallic mineral products
Manufacture of basic metals
Manufacture of fabricated metal products, except machinery and equipment
Manufacture of computer, electronic and optical products
Manufacture of electrical equipment
Manufacture of machinery and equipment n.e.c.
Manufacture of motor vehicles, trailers and semi-trailers
Manufacture of other transport equipment
Manufacture of furniture
Other manufacturing n.e.c.
47
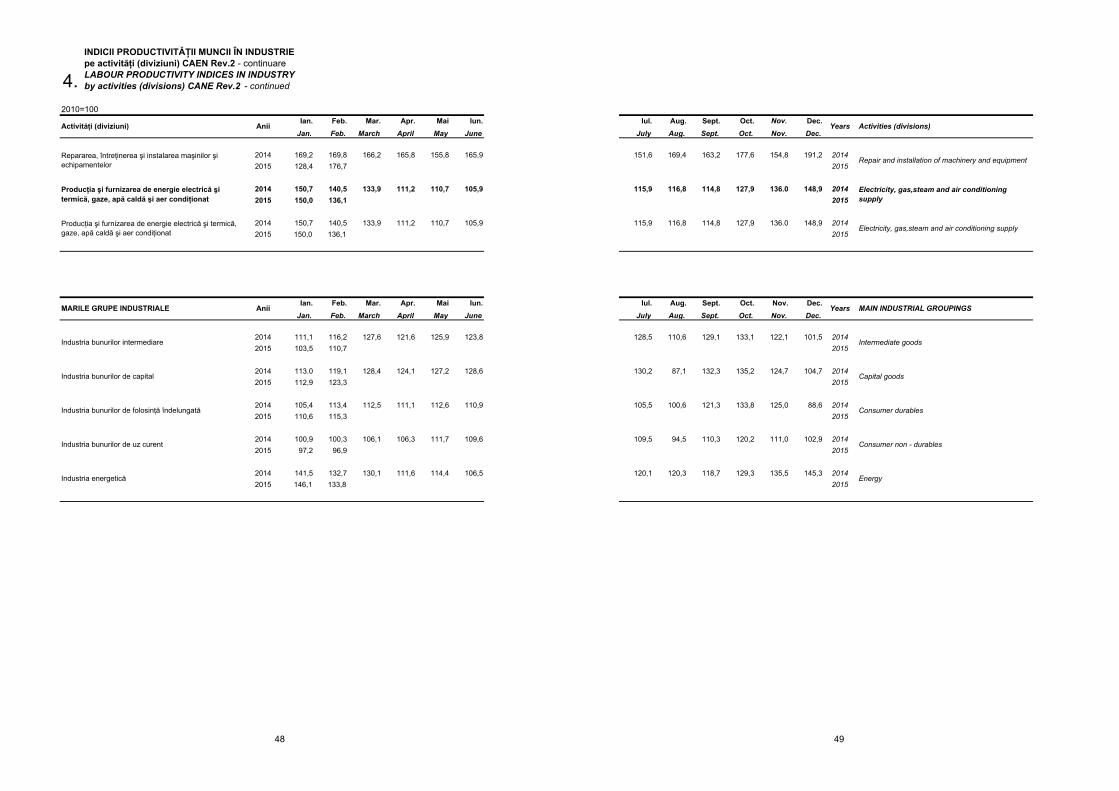
2010=100Ian. Feb. Mar. Apr. Mai Iun.
Jan. Feb. March April May June
2014 169,2 169,8 166,2 165,8 155,8 165,92015 128,4 176,7
2014 150,7 140,5 133,9 111,2 110,7 105,92015 150,0 136,1
2014 150,7 140,5 133,9 111,2 110,7 105,92015 150,0 136,1
Ian. Feb. Mar. Apr. Mai Iun.Jan. Feb. March April May June
2014 111,1 116,2 127,6 121,6 125,9 123,82015 103,5 110,7
2014 113.0 119,1 128,4 124,1 127,2 128,62015 112,9 123,3
2014 105,4 113,4 112,5 111,1 112,6 110,92015 110,6 115,3
2014 100,9 100,3 106,1 106,3 111,7 109,62015 97,2 96,9
2014 141,5 132,7 130,1 111,6 114,4 106,52015 146,1 133,8
Anii
Industria bunurilor intermediare
Repararea, întreţinerea şi instalarea maşinilor şi echipamentelor
Producţia şi furnizarea de energie electrică şi termică, gaze, apă caldă şi aer condiţionat
Industria bunurilor de folosinţă îndelungată
Industria bunurilor de uz curent
Industria energetică
Industria bunurilor de capital
MARILE GRUPE INDUSTRIALE
Producţia şi furnizarea de energie electrică şi termică, gaze, apă caldă şi aer condiţionat
Activităţi (diviziuni) Anii
LABOUR PRODUCTIVITY INDICES IN INDUSTRY
INDICII PRODUCTIVITĂŢII MUNCII ÎN INDUSTRIEpe activităţi (diviziuni) CAEN Rev.2 - continuare
by activities (divisions) CANE Rev.2 - continued4.
48
Iul. Aug. Sept. Oct. Nov. Dec.July Aug. Sept. Oct. Nov. Dec.
151,6 169,4 163,2 177,6 154,8 191,2 20142015
115,9 116,8 114,8 127,9 136.0 148,9 20142015
115,9 116,8 114,8 127,9 136.0 148,9 20142015
Iul. Aug. Sept. Oct. Nov. Dec.July Aug. Sept. Oct. Nov. Dec.
128,5 110,6 129,1 133,1 122,1 101,5 20142015
130,2 87,1 132,3 135,2 124,7 104,7 20142015
105,5 100,6 121,3 133,8 125,0 88,6 20142015
109,5 94,5 110,3 120,2 111,0 102,9 20142015
120,1 120,3 118,7 129,3 135,5 145,3 20142015
Years
Energy
Capital goods
Consumer durables
Consumer non - durables
Activities (divisions)
Repair and installation of machinery and equipment
Electricity, gas,steam and air conditioning supply
Electricity, gas,steam and air conditioning supply
MAIN INDUSTRIAL GROUPINGS
Intermediate goods
Years
49
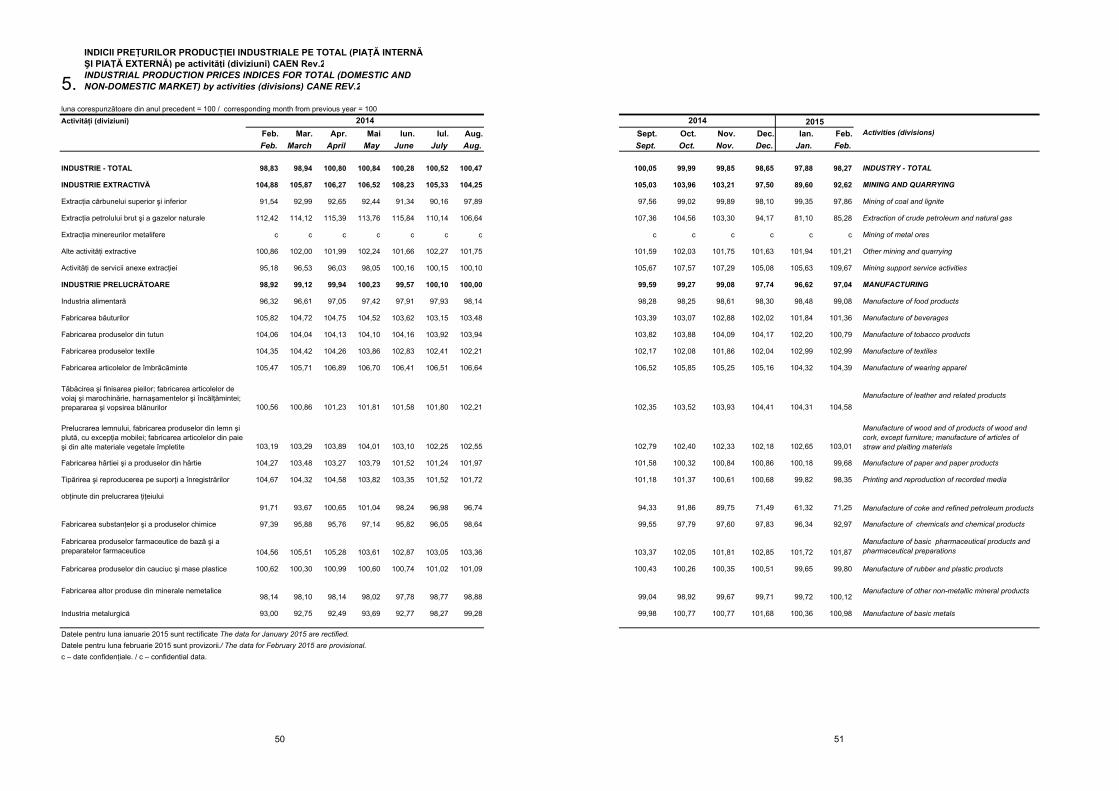
INDICII PREŢURILOR PRODUCŢIEI INDUSTRIALE PE TOTAL (PIAŢĂ INTERNĂ ŞI PIAŢĂ EXTERNĂ) pe activităţi (diviziuni) CAEN Rev.2INDUSTRIAL PRODUCTION PRICES INDICES FOR TOTAL (DOMESTIC AND NON-DOMESTIC MARKET) by activities (divisions) CANE REV.2
luna corespunzătoare din anul precedent = 100 / corresponding month from previous year = 100Activităţi (diviziuni)
Feb. Mar. Apr. Mai Iun. Iul. Aug.Feb. March April May June July Aug.
INDUSTRIE - TOTAL 98,83 98,94 100,80 100,84 100,28 100,52 100,47
INDUSTRIE EXTRACTIVĂ 104,88 105,87 106,27 106,52 108,23 105,33 104,25
Extracţia cărbunelui superior şi inferior 91,54 92,99 92,65 92,44 91,34 90,16 97,89
Extracţia petrolului brut şi a gazelor naturale 112,42 114,12 115,39 113,76 115,84 110,14 106,64
Extracţia minereurilor metalifere c c c c c c c
Alte activităţi extractive 100,86 102,00 101,99 102,24 101,66 102,27 101,75
Activităţi de servicii anexe extracţiei 95,18 96,53 96,03 98,05 100,16 100,15 100,10
INDUSTRIE PRELUCRĂTOARE 98,92 99,12 99,94 100,23 99,57 100,10 100,00
Industria alimentară 96,32 96,61 97,05 97,42 97,91 97,93 98,14
Fabricarea băuturilor 105,82 104,72 104,75 104,52 103,62 103,15 103,48
Fabricarea produselor din tutun 104,06 104,04 104,13 104,10 104,16 103,92 103,94
Fabricarea produselor textile 104,35 104,42 104,26 103,86 102,83 102,41 102,21
Fabricarea articolelor de îmbrăcăminte 105,47 105,71 106,89 106,70 106,41 106,51 106,64
100,56 100,86 101,23 101,81 101,58 101,80 102,21
103,19 103,29 103,89 104,01 103,10 102,25 102,55
Fabricarea hârtiei şi a produselor din hârtie 104,27 103,48 103,27 103,79 101,52 101,24 101,97
Tipărirea şi reproducerea pe suporţi a înregistrărilor 104,67 104,32 104,58 103,82 103,35 101,52 101,72
obţinute din prelucrarea ţiţeiului91,71 93,67 100,65 101,04 98,24 96,98 96,74
Fabricarea substanţelor şi a produselor chimice 97,39 95,88 95,76 97,14 95,82 96,05 98,64
104,56 105,51 105,28 103,61 102,87 103,05 103,36
Fabricarea produselor din cauciuc şi mase plastice 100,62 100,30 100,99 100,60 100,74 101,02 101,09
98,14 98,10 98,14 98,02 97,78 98,77 98,88
Industria metalurgică 93,00 92,75 92,49 93,69 92,77 98,27 99,28
c – date confidenţiale. / c – confidential data.
Fabricarea produselor farmaceutice de bază şi a preparatelor farmaceutice
Fabricarea altor produse din minerale nemetalice
Datele pentru luna ianuarie 2015 sunt rectificate The data for January 2015 are rectified.Datele pentru luna februarie 2015 sunt provizorii./ The data for February 2015 are provisional.
Tăbăcirea şi finisarea pieilor; fabricarea articolelor de voiaj şi marochinărie, harnaşamentelor şi încălţămintei; prepararea şi vopsirea blănurilor
Prelucrarea lemnului, fabricarea produselor din lemn şi plută, cu excepţia mobilei; fabricarea articolelor din paie şi din alte materiale vegetale împletite
2014
5.
50
Sept. Oct. Nov. Dec. Ian. Feb.Sept. Oct. Nov. Dec. Jan. Feb.
100,05 99,99 99,85 98,65 97,88 98,27 INDUSTRY - TOTAL
105,03 103,96 103,21 97,50 89,60 92,62 MINING AND QUARRYING
97,56 99,02 99,89 98,10 99,35 97,86 Mining of coal and lignite
107,36 104,56 103,30 94,17 81,10 85,28 Extraction of crude petroleum and natural gas
c c c c c c Mining of metal ores
101,59 102,03 101,75 101,63 101,94 101,21 Other mining and quarrying
105,67 107,57 107,29 105,08 105,63 109,67 Mining support service activities
99,59 99,27 99,08 97,74 96,62 97,04 MANUFACTURING
98,28 98,25 98,61 98,30 98,48 99,08 Manufacture of food products
103,39 103,07 102,88 102,02 101,84 101,36 Manufacture of beverages
103,82 103,88 104,09 104,17 102,20 100,79 Manufacture of tobacco products
102,17 102,08 101,86 102,04 102,99 102,99 Manufacture of textiles
106,52 105,85 105,25 105,16 104,32 104,39 Manufacture of wearing apparel
102,35 103,52 103,93 104,41 104,31 104,58
102,79 102,40 102,33 102,18 102,65 103,01
101,58 100,32 100,84 100,86 100,18 99,68 Manufacture of paper and paper products
101,18 101,37 100,61 100,68 99,82 98,35 Printing and reproduction of recorded media
94,33 91,86 89,75 71,49 61,32 71,25
99,55 97,79 97,60 97,83 96,34 92,97 Manufacture of chemicals and chemical products
103,37 102,05 101,81 102,85 101,72 101,87
100,43 100,26 100,35 100,51 99,65 99,80 Manufacture of rubber and plastic products
99,04 98,92 99,67 99,71 99,72 100,12
99,98 100,77 100,77 101,68 100,36 100,98 Manufacture of basic metals
Activities (divisions)
Manufacture of leather and related products
Manufacture of wood and of products of wood and cork, except furniture; manufacture of articles of straw and plaiting materials
2014 2015
Manufacture of coke and refined petroleum products
Manufacture of basic pharmaceutical products and pharmaceutical preparations
Manufacture of other non-metallic mineral products
51
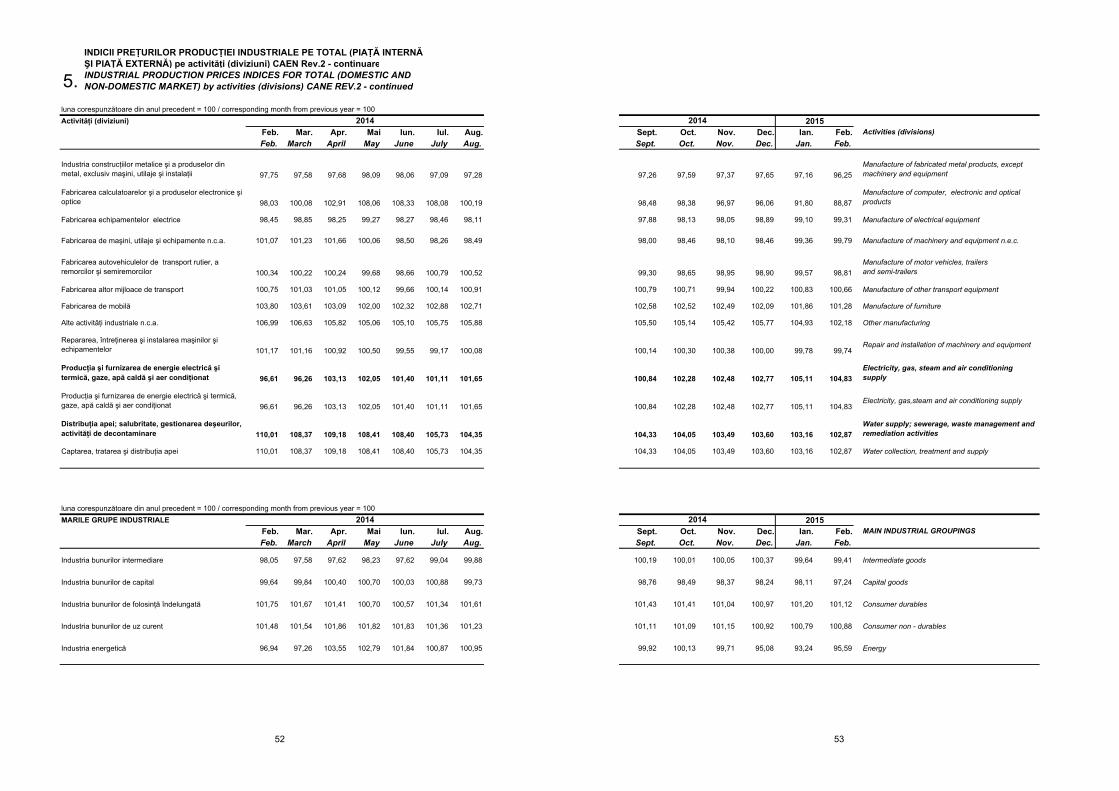
INDICII PREŢURILOR PRODUCŢIEI INDUSTRIALE PE TOTAL (PIAŢĂ INTERNĂ ŞI PIAŢĂ EXTERNĂ) pe activităţi (diviziuni) CAEN Rev.2 - continuareINDUSTRIAL PRODUCTION PRICES INDICES FOR TOTAL (DOMESTIC AND NON-DOMESTIC MARKET) by activities (divisions) CANE REV.2 - continued
luna corespunzătoare din anul precedent = 100 / corresponding month from previous year = 100Activităţi (diviziuni)
Feb. Mar. Apr. Mai Iun. Iul. Aug.Feb. March April May June July Aug.
97,75 97,58 97,68 98,09 98,06 97,09 97,28
98,03 100,08 102,91 108,06 108,33 108,08 100,19
Fabricarea echipamentelor electrice 98,45 98,85 98,25 99,27 98,27 98,46 98,11
Fabricarea de maşini, utilaje şi echipamente n.c.a. 101,07 101,23 101,66 100,06 98,50 98,26 98,49
100,34 100,22 100,24 99,68 98,66 100,79 100,52
Fabricarea altor mijloace de transport 100,75 101,03 101,05 100,12 99,66 100,14 100,91
Fabricarea de mobilă 103,80 103,61 103,09 102,00 102,32 102,88 102,71
Alte activităţi industriale n.c.a. 106,99 106,63 105,82 105,06 105,10 105,75 105,88
101,17 101,16 100,92 100,50 99,55 99,17 100,08
96,61 96,26 103,13 102,05 101,40 101,11 101,65
96,61 96,26 103,13 102,05 101,40 101,11 101,65
110,01 108,37 109,18 108,41 108,40 105,73 104,35
Captarea, tratarea şi distribuţia apei 110,01 108,37 109,18 108,41 108,40 105,73 104,35
luna corespunzătoare din anul precedent = 100 / corresponding month from previous year = 100MARILE GRUPE INDUSTRIALE
Feb. Mar. Apr. Mai Iun. Iul. Aug.Feb. March April May June July Aug.
Industria bunurilor intermediare 98,05 97,58 97,62 98,23 97,62 99,04 99,88
Industria bunurilor de capital 99,64 99,84 100,40 100,70 100,03 100,88 99,73
Industria bunurilor de folosinţă îndelungată 101,75 101,67 101,41 100,70 100,57 101,34 101,61
Industria bunurilor de uz curent 101,48 101,54 101,86 101,82 101,83 101,36 101,23
Industria energetică 96,94 97,26 103,55 102,79 101,84 100,87 100,95
Distribuţia apei; salubritate, gestionarea deşeurilor, activităţi de decontaminare
Industria construcţiilor metalice şi a produselor din metal, exclusiv maşini, utilaje şi instalaţii
Fabricarea calculatoarelor şi a produselor electronice şi optice
Fabricarea autovehiculelor de transport rutier, a remorcilor şi semiremorcilor
Repararea, întreţinerea şi instalarea maşinilor şi echipamentelor
Producţia şi furnizarea de energie electrică şi termică, gaze, apă caldă şi aer condiţionat
2014
Producţia şi furnizarea de energie electrică şi termică, gaze, apă caldă şi aer condiţionat
2014
5.
52
Sept. Oct. Nov. Dec. Ian. Feb.Sept. Oct. Nov. Dec. Jan. Feb.
97,26 97,59 97,37 97,65 97,16 96,25
98,48 98,38 96,97 96,06 91,80 88,87
97,88 98,13 98,05 98,89 99,10 99,31 Manufacture of electrical equipment
98,00 98,46 98,10 98,46 99,36 99,79 Manufacture of machinery and equipment n.e.c.
99,30 98,65 98,95 98,90 99,57 98,81
100,79 100,71 99,94 100,22 100,83 100,66 Manufacture of other transport equipment
102,58 102,52 102,49 102,09 101,86 101,28 Manufacture of furniture
105,50 105,14 105,42 105,77 104,93 102,18 Other manufacturing
100,14 100,30 100,38 100,00 99,78 99,74
100,84 102,28 102,48 102,77 105,11 104,83
100,84 102,28 102,48 102,77 105,11 104,83
104,33 104,05 103,49 103,60 103,16 102,87
104,33 104,05 103,49 103,60 103,16 102,87 Water collection, treatment and supply
Sept. Oct. Nov. Dec. Ian. Feb.Sept. Oct. Nov. Dec. Jan. Feb.
100,19 100,01 100,05 100,37 99,64 99,41 Intermediate goods
98,76 98,49 98,37 98,24 98,11 97,24 Capital goods
101,43 101,41 101,04 100,97 101,20 101,12 Consumer durables
101,11 101,09 101,15 100,92 100,79 100,88 Consumer non - durables
99,92 100,13 99,71 95,08 93,24 95,59 Energy
2014 2015
2014 2015
Manufacture of fabricated metal products, except machinery and equipment
Activities (divisions)
Manufacture of computer, electronic and optical products
Water supply; sewerage, waste management and remediation activities
MAIN INDUSTRIAL GROUPINGS
Manufacture of motor vehicles, trailers and semi-trailers
Repair and installation of machinery and equipment
Electricity, gas, steam and air conditioning supply
Electricity, gas,steam and air conditioning supply
53
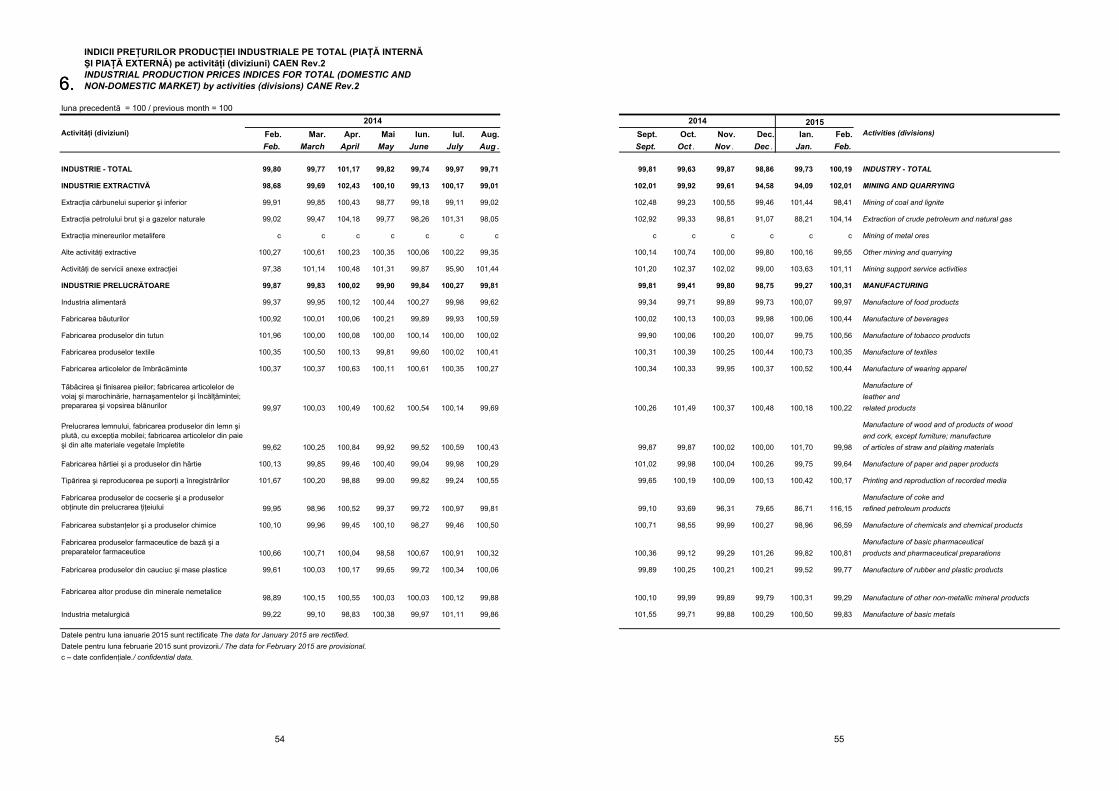
Feb. Mar. Apr. Mai Iun. Iul. Aug.Feb. March April May June July Aug .
INDUSTRIE - TOTAL 99,80 99,77 101,17 99,82 99,74 99,97 99,71
INDUSTRIE EXTRACTIVĂ 98,68 99,69 102,43 100,10 99,13 100,17 99,01
Extracţia cărbunelui superior şi inferior 99,91 99,85 100,43 98,77 99,18 99,11 99,02
Extracţia petrolului brut şi a gazelor naturale 99,02 99,47 104,18 99,77 98,26 101,31 98,05
Extracţia minereurilor metalifere c c c c c c c
Alte activităţi extractive 100,27 100,61 100,23 100,35 100,06 100,22 99,35
Activităţi de servicii anexe extracţiei 97,38 101,14 100,48 101,31 99,87 95,90 101,44
INDUSTRIE PRELUCRĂTOARE 99,87 99,83 100,02 99,90 99,84 100,27 99,81
Industria alimentară 99,37 99,95 100,12 100,44 100,27 99,98 99,62
Fabricarea băuturilor 100,92 100,01 100,06 100,21 99,89 99,93 100,59
Fabricarea produselor din tutun 101,96 100,00 100,08 100,00 100,14 100,00 100,02
Fabricarea produselor textile 100,35 100,50 100,13 99,81 99,60 100,02 100,41
Fabricarea articolelor de îmbrăcăminte 100,37 100,37 100,63 100,11 100,61 100,35 100,27
99,97 100,03 100,49 100,62 100,54 100,14 99,69
99,62 100,25 100,84 99,92 99,52 100,59 100,43
Fabricarea hârtiei şi a produselor din hârtie 100,13 99,85 99,46 100,40 99,04 99,98 100,29
Tipărirea şi reproducerea pe suporţi a înregistrărilor 101,67 100,20 98,88 99.00 99,82 99,24 100,55
99,95 98,96 100,52 99,37 99,72 100,97 99,81
Fabricarea substanţelor şi a produselor chimice 100,10 99,96 99,45 100,10 98,27 99,46 100,50
100,66 100,71 100,04 98,58 100,67 100,91 100,32
Fabricarea produselor din cauciuc şi mase plastice 99,61 100,03 100,17 99,65 99,72 100,34 100,06
98,89 100,15 100,55 100,03 100,03 100,12 99,88
Industria metalurgică 99,22 99,10 98,83 100,38 99,97 101,11 99,86
c – date confidenţiale./ confidential data.
luna precedentă = 100 / previous month = 100
Activităţi (diviziuni)
Fabricarea produselor de cocserie şi a produselor obţinute din prelucrarea ţiţeiului
Tăbăcirea şi finisarea pieilor; fabricarea articolelor de voiaj şi marochinărie, harnaşamentelor şi încălţămintei; prepararea şi vopsirea blănurilor
Prelucrarea lemnului, fabricarea produselor din lemn şi plută, cu excepţia mobilei; fabricarea articolelor din paie şi din alte materiale vegetale împletite
Datele pentru luna ianuarie 2015 sunt rectificate The data for January 2015 are rectified.
2014
INDICII PREŢURILOR PRODUCŢIEI INDUSTRIALE PE TOTAL (PIAŢĂ INTERNĂ ŞI PIAŢĂ EXTERNĂ) pe activităţi (diviziuni) CAEN Rev.2 INDUSTRIAL PRODUCTION PRICES INDICES FOR TOTAL (DOMESTIC AND NON-DOMESTIC MARKET) by activities (divisions) CANE Rev.2
Datele pentru luna februarie 2015 sunt provizorii./ The data for February 2015 are provisional.
Fabricarea produselor farmaceutice de bază şi a preparatelor farmaceutice
Fabricarea altor produse din minerale nemetalice
6.6.
54
Sept. Oct. Nov. Dec. Ian. Feb.Sept. Oct . Nov . Dec . Jan. Feb.
99,81 99,63 99,87 98,86 99,73 100,19 INDUSTRY - TOTAL
102,01 99,92 99,61 94,58 94,09 102,01 MINING AND QUARRYING
102,48 99,23 100,55 99,46 101,44 98,41 Mining of coal and lignite
102,92 99,33 98,81 91,07 88,21 104,14 Extraction of crude petroleum and natural gas
c c c c c c Mining of metal ores
100,14 100,74 100,00 99,80 100,16 99,55 Other mining and quarrying
101,20 102,37 102,02 99,00 103,63 101,11 Mining support service activities
99,81 99,41 99,80 98,75 99,27 100,31 MANUFACTURING
99,34 99,71 99,89 99,73 100,07 99,97 Manufacture of food products
100,02 100,13 100,03 99,98 100,06 100,44 Manufacture of beverages
99,90 100,06 100,20 100,07 99,75 100,56 Manufacture of tobacco products
100,31 100,39 100,25 100,44 100,73 100,35 Manufacture of textiles
100,34 100,33 99,95 100,37 100,52 100,44 Manufacture of wearing apparel
Manufacture of leather and
100,26 101,49 100,37 100,48 100,18 100,22 related products
Manufacture of wood and of products of wood and cork, except furniture; manufacture
99,87 99,87 100,02 100,00 101,70 99,98 of articles of straw and plaiting materials
101,02 99,98 100,04 100,26 99,75 99,64 Manufacture of paper and paper products
99,65 100,19 100,09 100,13 100,42 100,17 Printing and reproduction of recorded media
Manufacture of coke and 99,10 93,69 96,31 79,65 86,71 116,15 refined petroleum products
100,71 98,55 99,99 100,27 98,96 96,59 Manufacture of chemicals and chemical products
Manufacture of basic pharmaceutical 100,36 99,12 99,29 101,26 99,82 100,81 products and pharmaceutical preparations
99,89 100,25 100,21 100,21 99,52 99,77 Manufacture of rubber and plastic products
100,10 99,99 99,89 99,79 100,31 99,29 Manufacture of other non-metallic mineral products
101,55 99,71 99,88 100,29 100,50 99,83 Manufacture of basic metals
2014 2015Activities (divisions)
55
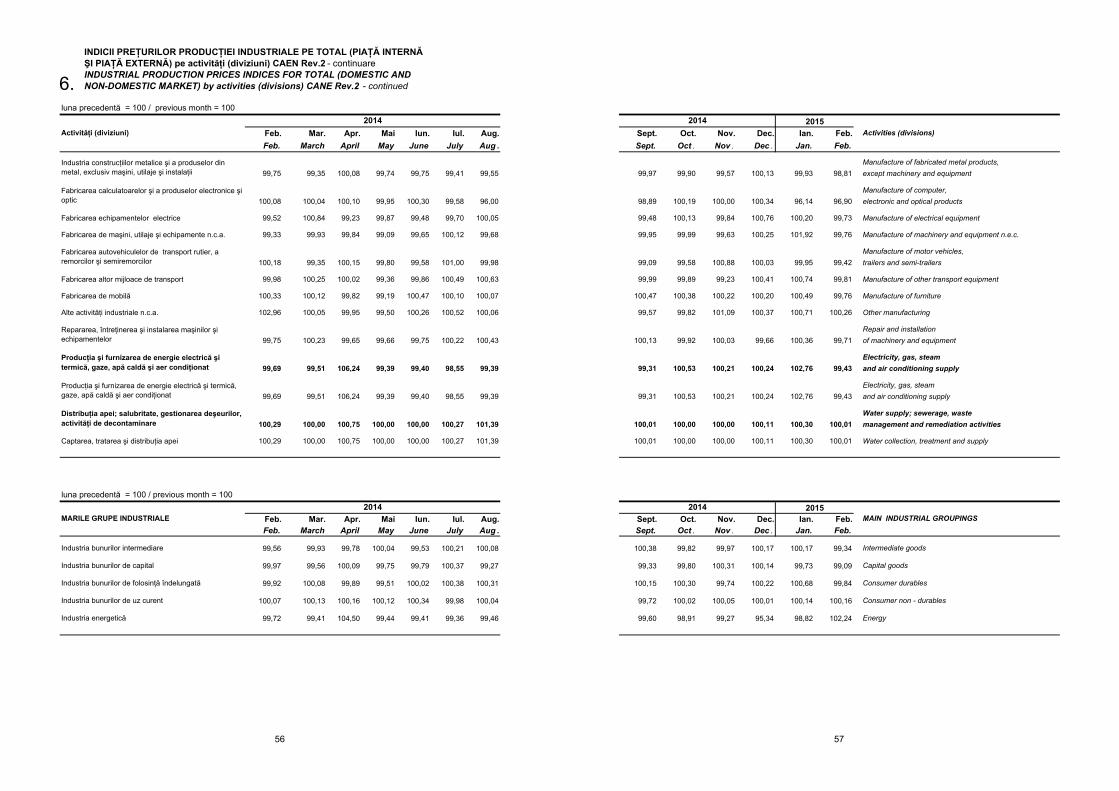
Feb. Mar. Apr. Mai Iun. Iul. Aug.Feb. March April May June July Aug .
99,75 99,35 100,08 99,74 99,75 99,41 99,55
100,08 100,04 100,10 99,95 100,30 99,58 96,00
Fabricarea echipamentelor electrice 99,52 100,84 99,23 99,87 99,48 99,70 100,05
Fabricarea de maşini, utilaje şi echipamente n.c.a. 99,33 99,93 99,84 99,09 99,65 100,12 99,68
100,18 99,35 100,15 99,80 99,58 101,00 99,98
Fabricarea altor mijloace de transport 99,98 100,25 100,02 99,36 99,86 100,49 100,63
Fabricarea de mobilă 100,33 100,12 99,82 99,19 100,47 100,10 100,07
Alte activităţi industriale n.c.a. 102,96 100,05 99,95 99,50 100,26 100,52 100,06
99,75 100,23 99,65 99,66 99,75 100,22 100,43
99,69 99,51 106,24 99,39 99,40 98,55 99,39
99,69 99,51 106,24 99,39 99,40 98,55 99,39
100,29 100,00 100,75 100,00 100,00 100,27 101,39
Captarea, tratarea şi distribuţia apei 100,29 100,00 100,75 100,00 100,00 100,27 101,39
Feb. Mar. Apr. Mai Iun. Iul. Aug.Feb. March April May June July Aug .
Industria bunurilor intermediare 99,56 99,93 99,78 100,04 99,53 100,21 100,08
Industria bunurilor de capital 99,97 99,56 100,09 99,75 99,79 100,37 99,27
Industria bunurilor de folosinţă îndelungată 99,92 100,08 99,89 99,51 100,02 100,38 100,31
Industria bunurilor de uz curent 100,07 100,13 100,16 100,12 100,34 99,98 100,04
Industria energetică 99,72 99,41 104,50 99,44 99,41 99,36 99,46
INDUSTRIAL PRODUCTION PRICES INDICES FOR TOTAL (DOMESTIC AND
Producţia şi furnizarea de energie electrică şi termică, gaze, apă caldă şi aer condiţionat
Fabricarea calculatoarelor şi a produselor electronice şi optic
Repararea, întreţinerea şi instalarea maşinilor şi echipamentelor
2014
ŞI PIAŢĂ EXTERNĂ) pe activităţi (diviziuni) CAEN Rev.2 - continuareINDICII PREŢURILOR PRODUCŢIEI INDUSTRIALE PE TOTAL (PIAŢĂ INTERNĂ
MARILE GRUPE INDUSTRIALE
Activităţi (diviziuni)
luna precedentă = 100 / previous month = 100
Fabricarea autovehiculelor de transport rutier, a remorcilor şi semiremorcilor
2014
NON-DOMESTIC MARKET) by activities (divisions) CANE Rev.2 - continued
luna precedentă = 100 / previous month = 100
Producţia şi furnizarea de energie electrică şi termică, gaze, apă caldă şi aer condiţionat
Distribuţia apei; salubritate, gestionarea deşeurilor, activităţi de decontaminare
Industria construcţiilor metalice şi a produselor din metal, exclusiv maşini, utilaje şi instalaţii
6.
56
Sept. Oct. Nov. Dec. Ian. Feb.Sept. Oct . Nov . Dec . Jan. Feb.
Manufacture of fabricated metal products, 99,97 99,90 99,57 100,13 99,93 98,81 except machinery and equipment
Manufacture of computer,98,89 100,19 100,00 100,34 96,14 96,90 electronic and optical products
99,48 100,13 99,84 100,76 100,20 99,73 Manufacture of electrical equipment
99,95 99,99 99,63 100,25 101,92 99,76 Manufacture of machinery and equipment n.e.c.
Manufacture of motor vehicles, 99,09 99,58 100,88 100,03 99,95 99,42 trailers and semi-trailers
99,99 99,89 99,23 100,41 100,74 99,81 Manufacture of other transport equipment
100,47 100,38 100,22 100,20 100,49 99,76 Manufacture of furniture
99,57 99,82 101,09 100,37 100,71 100,26 Other manufacturing
Repair and installation 100,13 99,92 100,03 99,66 100,36 99,71 of machinery and equipment
Electricity, gas, steam 99,31 100,53 100,21 100,24 102,76 99,43 and air conditioning supply
Electricity, gas, steam 99,31 100,53 100,21 100,24 102,76 99,43 and air conditioning supply
Water supply; sewerage, waste 100,01 100,00 100,00 100,11 100,30 100,01 management and remediation activities
100,01 100,00 100,00 100,11 100,30 100,01 Water collection, treatment and supply
Sept. Oct. Nov. Dec. Ian. Feb.Sept. Oct . Nov . Dec . Jan. Feb.
100,38 99,82 99,97 100,17 100,17 99,34 Intermediate goods
99,33 99,80 100,31 100,14 99,73 99,09 Capital goods
100,15 100,30 99,74 100,22 100,68 99,84 Consumer durables
99,72 100,02 100,05 100,01 100,14 100,16 Consumer non - durables
99,60 98,91 99,27 95,34 98,82 102,24 Energy
2014 2015
2014 2015Activities (divisions)
MAIN INDUSTRIAL GROUPINGS
57
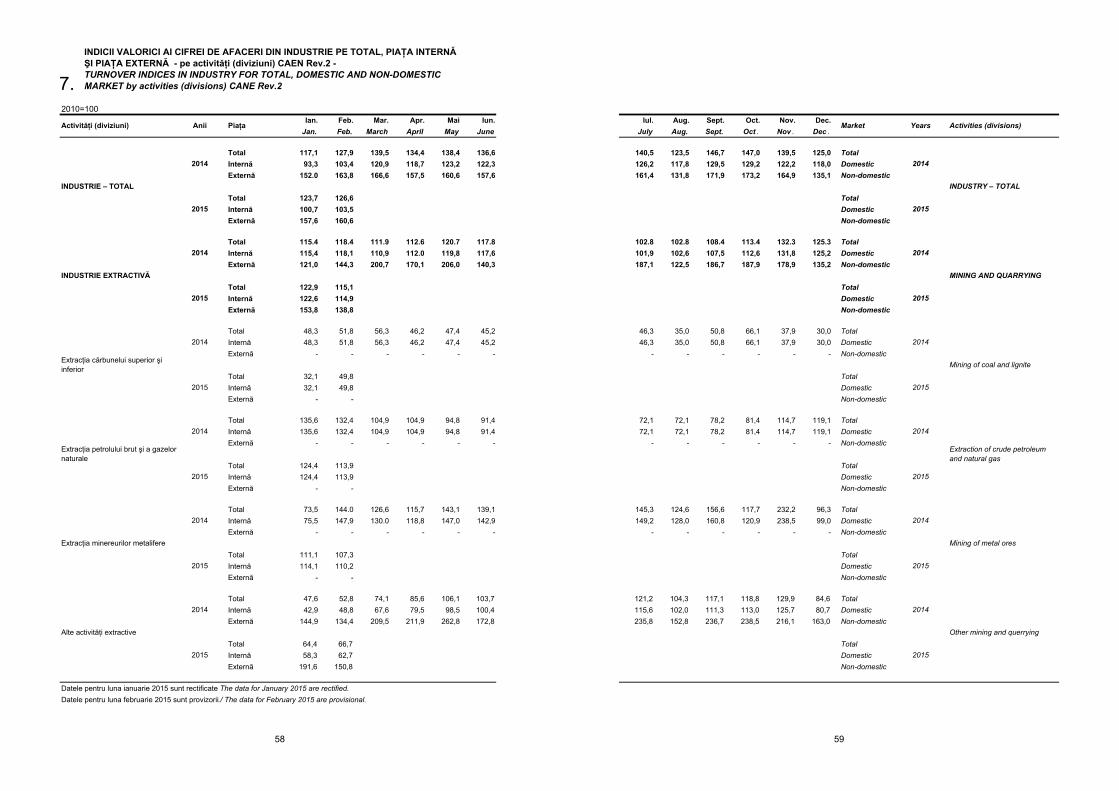
2010=100Ian. Feb. Mar. Apr. Mai Iun.
Jan. Feb. March April May June
Total 117,1 127,9 139,5 134,4 138,4 136,6Internă 93,3 103,4 120,9 118,7 123,2 122,3Externă 152.0 163,8 166,6 157,5 160,6 157,6
Total 123,7 126,6Internă 100,7 103,5Externă 157,6 160,6
Total 115.4 118.4 111.9 112.6 120.7 117.8Internă 115,4 118,1 110,9 112.0 119,8 117,6Externă 121,0 144,3 200,7 170,1 206,0 140,3
Total 122,9 115,1Internă 122,6 114,9Externă 153,8 138,8
Total 48,3 51,8 56,3 46,2 47,4 45,2Internă 48,3 51,8 56,3 46,2 47,4 45,2Externă - - - - - - Total 32,1 49,8Internă 32,1 49,8Externă - -
Total 135,6 132,4 104,9 104,9 94,8 91,4Internă 135,6 132,4 104,9 104,9 94,8 91,4Externă - - - - - -
Total 124,4 113,9Internă 124,4 113,9Externă - -
Total 73,5 144.0 126,6 115,7 143,1 139,1Internă 75,5 147,9 130.0 118,8 147,0 142,9Externă - - - - - -
Total 111,1 107,3Internă 114,1 110,2Externă - -
Total 47,6 52,8 74,1 85,6 106,1 103,7Internă 42,9 48,8 67,6 79,5 98,5 100,4Externă 144,9 134,4 209,5 211,9 262,8 172,8
Total 64,4 66,7Internă 58,3 62,7Externă 191,6 150,8
2014
2015
Extracţia minereurilor metalifere
2014
2015
Extracţia petrolului brut şi a gazelor naturale
2015
INDICII VALORICI AI CIFREI DE AFACERI DIN INDUSTRIE PE TOTAL, PIAŢA INTERNĂ
TURNOVER INDICES IN INDUSTRY FOR TOTAL, DOMESTIC AND NON-DOMESTIC MARKET by activities (divisions) CANE Rev.2
Extracţia cărbunelui superior şi inferior
2014
2015
ŞI PIAŢA EXTERNĂ - pe activităţi (diviziuni) CAEN Rev.2 -
2014
2015
INDUSTRIE EXTRACTIVĂ
INDUSTRIE – TOTAL
PiaţaActivităţi (diviziuni) Anii
2014
Alte activităţi extractive
2014
2015
Datele pentru luna ianuarie 2015 sunt rectificate The data for January 2015 are rectified.Datele pentru luna februarie 2015 sunt provizorii./ The data for February 2015 are provisional.
7.
58
Iul. Aug. Sept. Oct. Nov. Dec.July Aug. Sept. Oct . Nov . Dec .
140,5 123,5 146,7 147,0 139,5 125,0 Total126,2 117,8 129,5 129,2 122,2 118,0 Domestic161,4 131,8 171,9 173,2 164,9 135,1 Non-domestic
TotalDomesticNon-domestic
102.8 102.8 108.4 113.4 132.3 125.3 Total101,9 102,6 107,5 112,6 131,8 125,2 Domestic187,1 122,5 186,7 187,9 178,9 135,2 Non-domestic
TotalDomesticNon-domestic
46,3 35,0 50,8 66,1 37,9 30,0 Total46,3 35,0 50,8 66,1 37,9 30,0 Domestic
- - - - - - Non-domestic
TotalDomesticNon-domestic
72,1 72,1 78,2 81,4 114,7 119,1 Total72,1 72,1 78,2 81,4 114,7 119,1 Domestic
- - - - - - Non-domestic
TotalDomesticNon-domestic
145,3 124,6 156,6 117,7 232,2 96,3 Total149,2 128,0 160,8 120,9 238,5 99,0 Domestic
- - - - - - Non-domestic
TotalDomesticNon-domestic
121,2 104,3 117,1 118,8 129,9 84,6 Total115,6 102,0 111,3 113,0 125,7 80,7 Domestic235,8 152,8 236,7 238,5 216,1 163,0 Non-domestic
TotalDomesticNon-domestic
2014
MINING AND QUARRYING
2015
2014
Mining of coal and lignite
2014
INDUSTRY – TOTAL
2015
Market Years Activities (divisions)
2014
Mining of metal ores
2015
2015
2014
Extraction of crude petroleum and natural gas
2015
2014
Other mining and querrying
2015
59
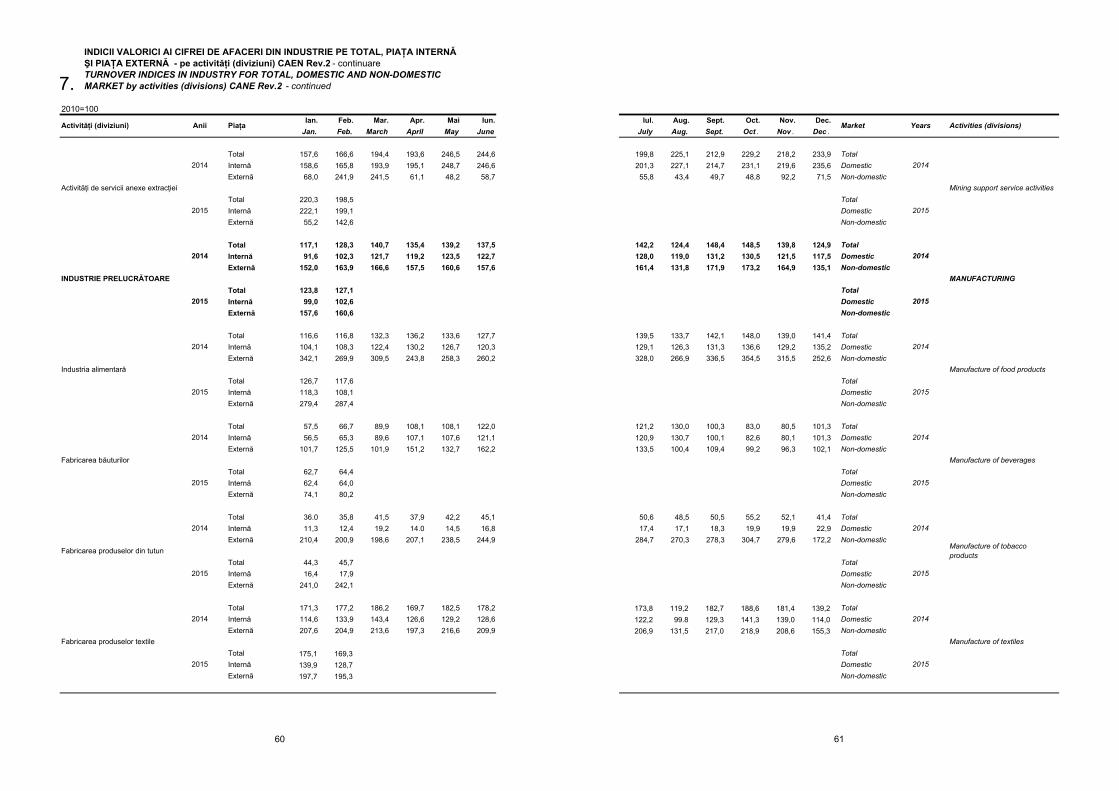
2010=100Ian. Feb. Mar. Apr. Mai Iun.
Jan. Feb. March April May June
Total 157,6 166,6 194,4 193,6 246,5 244,6Internă 158,6 165,8 193,9 195,1 248,7 246,6Externă 68,0 241,9 241,5 61,1 48,2 58,7
Total 220,3 198,5Internă 222,1 199,1Externă 55,2 142,6
Total 117,1 128,3 140,7 135,4 139,2 137,5Internă 91,6 102,3 121,7 119,2 123,5 122,7Externă 152,0 163,9 166,6 157,5 160,6 157,6
Total 123,8 127,1Internă 99,0 102,6Externă 157,6 160,6
Total 116,6 116,8 132,3 136,2 133,6 127,7Internă 104,1 108,3 122,4 130,2 126,7 120,3Externă 342,1 269,9 309,5 243,8 258,3 260,2
Total 126,7 117,6Internă 118,3 108,1Externă 279,4 287,4
Total 57,5 66,7 89,9 108,1 108,1 122,0Internă 56,5 65,3 89,6 107,1 107,6 121,1Externă 101,7 125,5 101,9 151,2 132,7 162,2
Total 62,7 64,4Internă 62,4 64,0Externă 74,1 80,2
Total 36.0 35,8 41,5 37,9 42,2 45,1Internă 11,3 12,4 19,2 14.0 14,5 16,8Externă 210,4 200,9 198,6 207,1 238,5 244,9
Total 44,3 45,7Internă 16,4 17,9Externă 241,0 242,1
Total 171,3 177,2 186,2 169,7 182,5 178,2Internă 114,6 133,9 143,4 126,6 129,2 128,6Externă 207,6 204,9 213,6 197,3 216,6 209,9
Total 175,1 169,3Internă 139,9 128,7Externă 197,7 195,3
Piaţa
INDICII VALORICI AI CIFREI DE AFACERI DIN INDUSTRIE PE TOTAL, PIAŢA INTERNĂ ŞI PIAŢA EXTERNĂ - pe activităţi (diviziuni) CAEN Rev.2 - continuareTURNOVER INDICES IN INDUSTRY FOR TOTAL, DOMESTIC AND NON-DOMESTIC MARKET by activities (divisions) CANE Rev.2 - continued
Activităţi de servicii anexe extracţiei
2014
2015
Activităţi (diviziuni) Anii
INDUSTRIE PRELUCRĂTOARE
2014
2015
Industria alimentară
2014
2015
2015
Fabricarea produselor textile
2014
Fabricarea băuturilor
2014
2015
Fabricarea produselor din tutun
2014
2015
7.
60
Iul. Aug. Sept. Oct. Nov. Dec.July Aug. Sept. Oct . Nov . Dec .
199,8 225,1 212,9 229,2 218,2 233,9 Total201,3 227,1 214,7 231,1 219,6 235,6 Domestic55,8 43,4 49,7 48,8 92,2 71,5 Non-domestic
TotalDomesticNon-domestic
142,2 124,4 148,4 148,5 139,8 124,9 Total128,0 119,0 131,2 130,5 121,5 117,5 Domestic161,4 131,8 171,9 173,2 164,9 135,1 Non-domestic
TotalDomesticNon-domestic
139,5 133,7 142,1 148,0 139,0 141,4 Total129,1 126,3 131,3 136,6 129,2 135,2 Domestic328,0 266,9 336,5 354,5 315,5 252,6 Non-domestic
TotalDomesticNon-domestic
121,2 130,0 100,3 83,0 80,5 101,3 Total120,9 130,7 100,1 82,6 80,1 101,3 Domestic133,5 100,4 109,4 99,2 96,3 102,1 Non-domestic
TotalDomesticNon-domestic
50,6 48,5 50,5 55,2 52,1 41,4 Total17,4 17,1 18,3 19,9 19,9 22,9 Domestic
284,7 270,3 278,3 304,7 279,6 172,2 Non-domestic
TotalDomesticNon-domestic
173,8 119,2 182,7 188,6 181,4 139,2 Total122,2 99.8 129,3 141,3 139,0 114,0 Domestic206,9 131,5 217,0 218,9 208,6 155,3 Non-domestic
TotalDomesticNon-domestic
Market Years Activities (divisions)
2014
Mining support service activities
2015
Manufacture of tobacco products
2015
2014
Manufacture of textiles
2014
2015
2014
MANUFACTURING
2015
2015
2014
Manufacture of food products
2014
Manufacture of beverages
2015
61
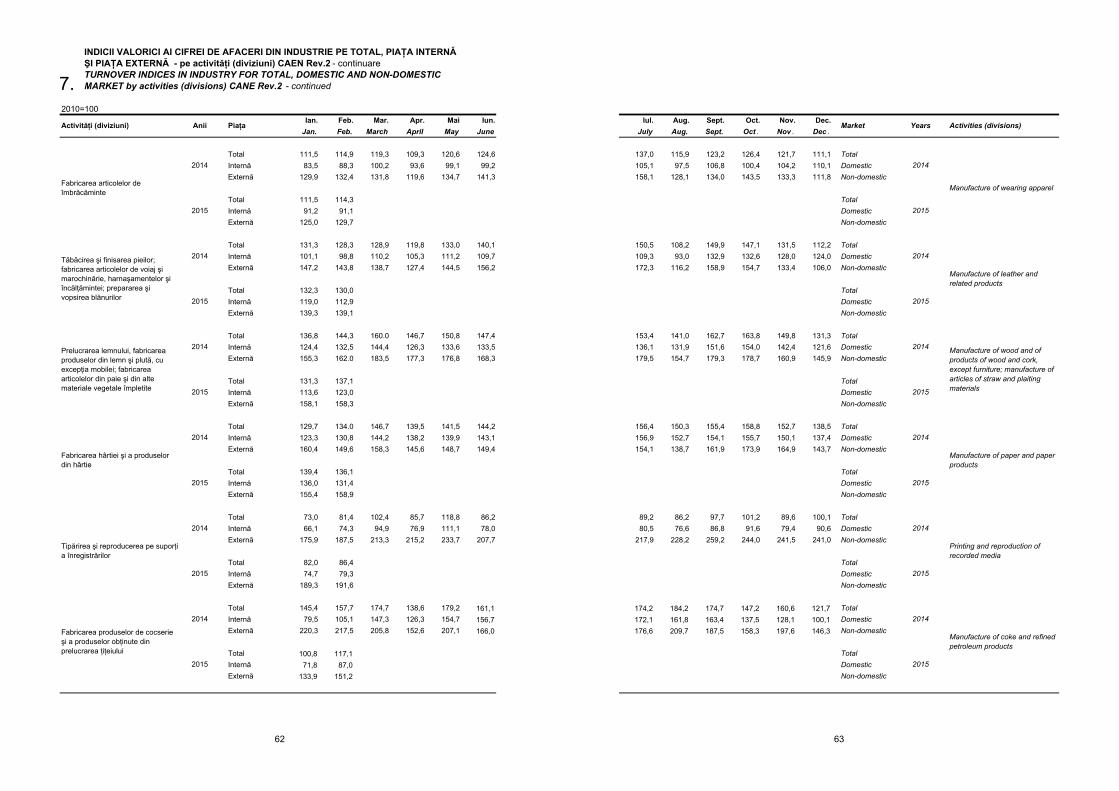
2010=100Ian. Feb. Mar. Apr. Mai Iun.
Jan. Feb. March April May June
Total 111,5 114,9 119,3 109,3 120,6 124,6Internă 83,5 88,3 100,2 93,6 99,1 99,2Externă 129,9 132,4 131,8 119,6 134,7 141,3
Total 111,5 114,3Internă 91,2 91,1Externă 125,0 129,7
Total 131,3 128,3 128,9 119,8 133,0 140,1Internă 101,1 98,8 110,2 105,3 111,2 109,7Externă 147,2 143,8 138,7 127,4 144,5 156,2
Total 132,3 130,0Internă 119,0 112,9Externă 139,3 139,1
Total 136,8 144,3 160.0 146,7 150,8 147,4Internă 124,4 132,5 144,4 126,3 133,6 133,5Externă 155,3 162.0 183,5 177,3 176,8 168,3
Total 131,3 137,1Internă 113,6 123,0Externă 158,1 158,3
Total 129,7 134.0 146,7 139,5 141,5 144,2Internă 123,3 130,8 144,2 138,2 139,9 143,1Externă 160,4 149,6 158,3 145,6 148,7 149,4
Total 139,4 136,1Internă 136,0 131,4Externă 155,4 158,9
Total 73,0 81,4 102,4 85,7 118,8 86,2Internă 66,1 74,3 94,9 76,9 111,1 78,0Externă 175,9 187,5 213,3 215,2 233,7 207,7
Total 82,0 86,4Internă 74,7 79,3Externă 189,3 191,6
Total 145,4 157,7 174,7 138,6 179,2 161,1Internă 79,5 105,1 147,3 126,3 154,7 156,7Externă 220,3 217,5 205,8 152,6 207,1 166,0
Total 100,8 117,1Internă 71,8 87,0Externă 133,9 151,2
2014
ŞI PIAŢA EXTERNĂ - pe activităţi (diviziuni) CAEN Rev.2 - continuareTURNOVER INDICES IN INDUSTRY FOR TOTAL, DOMESTIC AND NON-DOMESTIC
INDICII VALORICI AI CIFREI DE AFACERI DIN INDUSTRIE PE TOTAL, PIAŢA INTERNĂ
Fabricarea articolelor de îmbrăcăminte
2014
2015
Prelucrarea lemnului, fabricarea produselor din lemn şi plută, cu excepţia mobilei; fabricarea articolelor din paie şi din alte materiale vegetale împletite
2014
2015
Tăbăcirea şi finisarea pieilor; fabricarea articolelor de voiaj şi marochinărie, harnaşamentelor şi încălţămintei; prepararea şi vopsirea blănurilor
2015
MARKET by activities (divisions) CANE Rev.2 - continued
Activităţi (diviziuni) Anii Piaţa
Fabricarea hârtiei şi a produselor din hârtie
2015
Tipărirea şi reproducerea pe suporţi a înregistrărilor
2014
2015
2014
Fabricarea produselor de cocserie şi a produselor obţinute din prelucrarea ţiţeiului
2014
2015
7.
62
Iul. Aug. Sept. Oct. Nov. Dec.July Aug. Sept. Oct . Nov . Dec .
137,0 115,9 123,2 126,4 121,7 111,1 Total105,1 97,5 106,8 100,4 104,2 110,1 Domestic158,1 128,1 134,0 143,5 133,3 111,8 Non-domestic
TotalDomesticNon-domestic
150,5 108,2 149,9 147,1 131,5 112,2 Total109,3 93,0 132,9 132,6 128,0 124,0 Domestic172,3 116,2 158,9 154,7 133,4 106,0 Non-domestic
TotalDomesticNon-domestic
153,4 141,0 162,7 163,8 149,8 131,3 Total136,1 131,9 151,6 154,0 142,4 121,6 Domestic179,5 154,7 179,3 178,7 160,9 145,9 Non-domestic
TotalDomesticNon-domestic
156,4 150,3 155,4 158,8 152,7 138,5 Total156,9 152,7 154,1 155,7 150,1 137,4 Domestic154,1 138,7 161,9 173,9 164,9 143,7 Non-domestic
TotalDomesticNon-domestic
89,2 86,2 97,7 101,2 89,6 100,1 Total80,5 76,6 86,8 91,6 79,4 90,6 Domestic
217,9 228,2 259,2 244,0 241,5 241,0 Non-domestic
TotalDomesticNon-domestic
174,2 184,2 174,7 147,2 160,6 121,7 Total172,1 161,8 163,4 137,5 128,1 100,1 Domestic176,6 209,7 187,5 158,3 197,6 146,3 Non-domestic
TotalDomesticNon-domestic
Manufacture of wearing apparel
Manufacture of leather and related products
Manufacture of wood and of products of wood and cork, except furniture; manufacture of articles of straw and plaiting materials2015
2014
2014
2015
2014
2015
Market Years Activities (divisions)
Manufacture of paper and paper products
2015
Printing and reproduction of recorded media
2015
2014
2014
2014
Manufacture of coke and refined petroleum products
2015
63
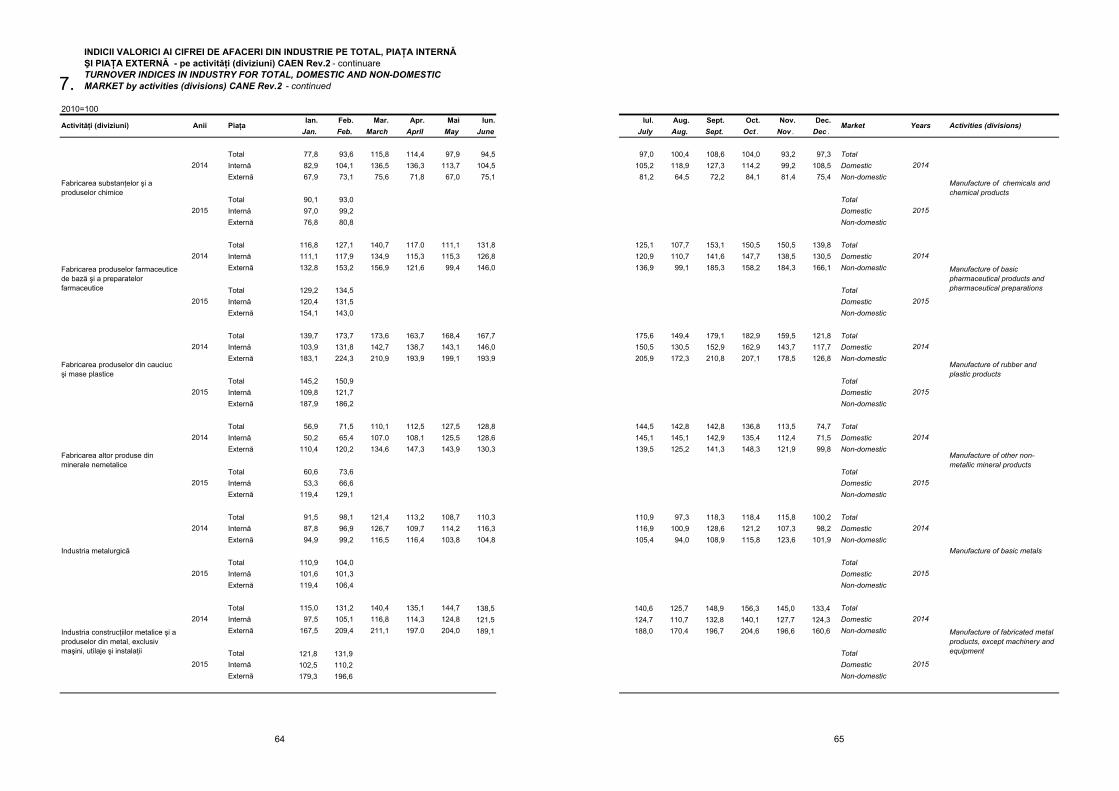
2010=100Ian. Feb. Mar. Apr. Mai Iun.
Jan. Feb. March April May June
Total 77,8 93,6 115,8 114,4 97,9 94,5Internă 82,9 104,1 136,5 136,3 113,7 104,5Externă 67,9 73,1 75,6 71,8 67,0 75,1
Total 90,1 93,0Internă 97,0 99,2Externă 76,8 80,8
Total 116,8 127,1 140,7 117.0 111,1 131,8Internă 111,1 117,9 134,9 115,3 115,3 126,8Externă 132,8 153,2 156,9 121,6 99,4 146,0
Total 129,2 134,5Internă 120,4 131,5Externă 154,1 143,0
Total 139,7 173,7 173,6 163,7 168,4 167,7Internă 103,9 131,8 142,7 138,7 143,1 146,0Externă 183,1 224,3 210,9 193,9 199,1 193,9
Total 145,2 150,9Internă 109,8 121,7Externă 187,9 186,2
Total 56,9 71,5 110,1 112,5 127,5 128,8Internă 50,2 65,4 107.0 108,1 125,5 128,6Externă 110,4 120,2 134,6 147,3 143,9 130,3
Total 60,6 73,6Internă 53,3 66,6Externă 119,4 129,1
Total 91,5 98,1 121,4 113,2 108,7 110,3Internă 87,8 96,9 126,7 109,7 114,2 116,3Externă 94,9 99,2 116,5 116,4 103,8 104,8
Total 110,9 104,0Internă 101,6 101,3Externă 119,4 106,4
Total 115,0 131,2 140,4 135,1 144,7 138,5Internă 97,5 105,1 116,8 114,3 124,8 121,5Externă 167,5 209,4 211,1 197.0 204,0 189,1
Total 121,8 131,9Internă 102,5 110,2Externă 179,3 196,6
INDICII VALORICI AI CIFREI DE AFACERI DIN INDUSTRIE PE TOTAL, PIAŢA INTERNĂ ŞI PIAŢA EXTERNĂ - pe activităţi (diviziuni) CAEN Rev.2 - continuareTURNOVER INDICES IN INDUSTRY FOR TOTAL, DOMESTIC AND NON-DOMESTIC MARKET by activities (divisions) CANE Rev.2 - continued
Fabricarea substanţelor şi a produselor chimice
2014
2015
Activităţi (diviziuni) Anii Piaţa
Fabricarea produselor farmaceutice de bază şi a preparatelor farmaceutice
2014
2015
Fabricarea produselor din cauciuc şi mase plastice
2014
2015
Fabricarea altor produse din minerale nemetalice
2014
2015
Industria metalurgică
2014
2015
Industria construcţiilor metalice şi a produselor din metal, exclusiv maşini, utilaje şi instalaţii
2014
2015
7.
64
Iul. Aug. Sept. Oct. Nov. Dec.July Aug. Sept. Oct . Nov . Dec .
97,0 100,4 108,6 104,0 93,2 97,3 Total105,2 118,9 127,3 114,2 99,2 108,5 Domestic81,2 64,5 72,2 84,1 81,4 75,4 Non-domestic
TotalDomesticNon-domestic
125,1 107,7 153,1 150,5 150,5 139,8 Total120,9 110,7 141,6 147,7 138,5 130,5 Domestic136,9 99,1 185,3 158,2 184,3 166,1 Non-domestic
TotalDomesticNon-domestic
175,6 149,4 179,1 182,9 159,5 121,8 Total150,5 130,5 152,9 162,9 143,7 117,7 Domestic205,9 172,3 210,8 207,1 178,5 126,8 Non-domestic
TotalDomesticNon-domestic
144,5 142,8 142,8 136,8 113,5 74,7 Total145,1 145,1 142,9 135,4 112,4 71,5 Domestic139,5 125,2 141,3 148,3 121,9 99,8 Non-domestic
TotalDomesticNon-domestic
110,9 97,3 118,3 118,4 115,8 100,2 Total116,9 100,9 128,6 121,2 107,3 98,2 Domestic105,4 94,0 108,9 115,8 123,6 101,9 Non-domestic
TotalDomesticNon-domestic
140,6 125,7 148,9 156,3 145,0 133,4 Total124,7 110,7 132,8 140,1 127,7 124,3 Domestic188,0 170,4 196,7 204,6 196,6 160,6 Non-domestic
TotalDomesticNon-domestic
Years Activities (divisions)
Manufacture of chemicals and chemical products
Market
2014
2015
2014
2014
Manufacture of basic pharmaceutical products and pharmaceutical preparations
2015
2014
Manufacture of rubber and plastic products
2015
Manufacture of other non-metallic mineral products
2015
2014
Manufacture of basic metals
2015
Manufacture of fabricated metal products, except machinery and equipment
2015
2014
65
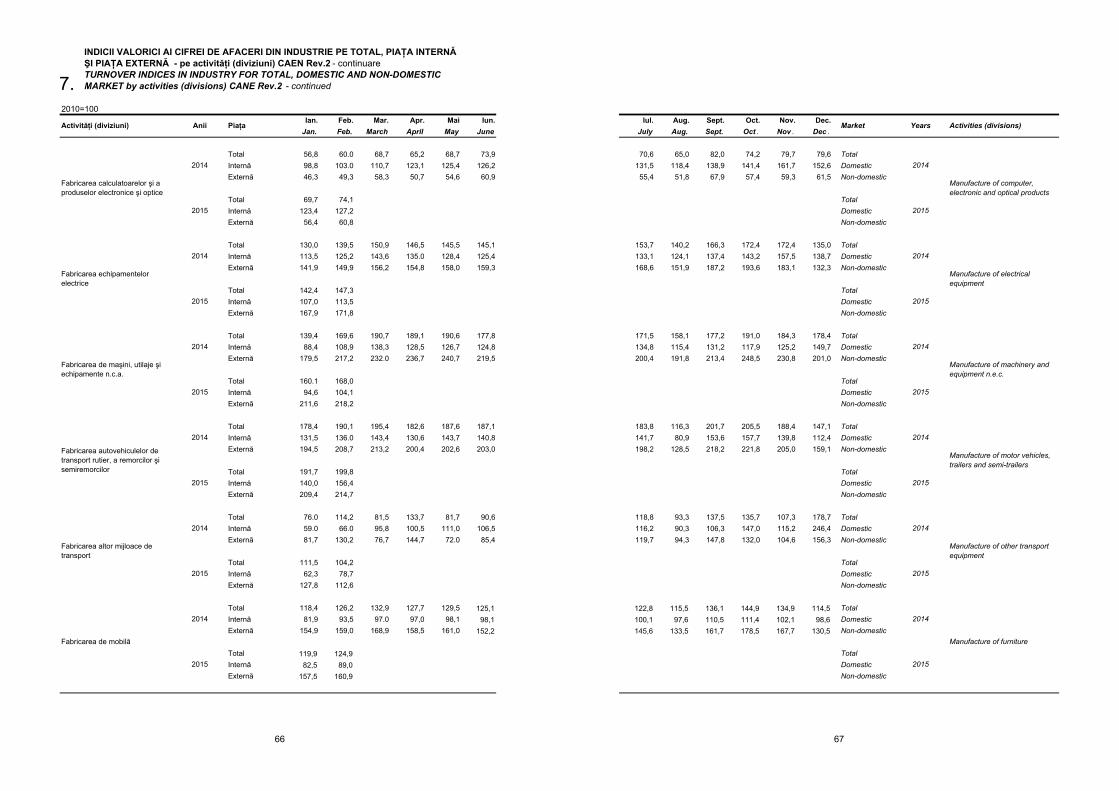
2010=100Ian. Feb. Mar. Apr. Mai Iun.
Jan. Feb. March April May June
Total 56,8 60.0 68,7 65,2 68,7 73,9Internă 98,8 103.0 110,7 123,1 125,4 126,2Externă 46,3 49,3 58,3 50,7 54,6 60,9
Total 69,7 74,1Internă 123,4 127,2Externă 56,4 60,8
Total 130,0 139,5 150,9 146,5 145,5 145,1Internă 113,5 125,2 143,6 135.0 128,4 125,4Externă 141,9 149,9 156,2 154,8 158,0 159,3
Total 142,4 147,3Internă 107,0 113,5Externă 167,9 171,8
Total 139,4 169,6 190,7 189,1 190,6 177,8Internă 88,4 108,9 138,3 128,5 126,7 124,8Externă 179,5 217,2 232.0 236,7 240,7 219,5
Total 160.1 168,0Internă 94,6 104,1Externă 211,6 218,2
Total 178,4 190,1 195,4 182,6 187,6 187,1Internă 131,5 136.0 143,4 130,6 143,7 140,8Externă 194,5 208,7 213,2 200,4 202,6 203,0
Total 191,7 199,8Internă 140,0 156,4Externă 209,4 214,7
Total 76.0 114,2 81,5 133,7 81,7 90,6Internă 59.0 66.0 95,8 100,5 111,0 106,5Externă 81,7 130,2 76,7 144,7 72.0 85,4
Total 111,5 104,2Internă 62,3 78,7Externă 127,8 112,6
Total 118,4 126,2 132,9 127,7 129,5 125,1Internă 81,9 93,5 97.0 97,0 98,1 98,1Externă 154,9 159,0 168,9 158,5 161,0 152,2
Total 119,9 124,9Internă 82,5 89,0Externă 157,5 160,9
INDICII VALORICI AI CIFREI DE AFACERI DIN INDUSTRIE PE TOTAL, PIAŢA INTERNĂ ŞI PIAŢA EXTERNĂ - pe activităţi (diviziuni) CAEN Rev.2 - continuareTURNOVER INDICES IN INDUSTRY FOR TOTAL, DOMESTIC AND NON-DOMESTIC MARKET by activities (divisions) CANE Rev.2 - continued
Activităţi (diviziuni) Anii Piaţa
Fabricarea calculatoarelor şi a produselor electronice şi optice
2014
2015
Fabricarea echipamentelor electrice
2014
2015
Fabricarea de maşini, utilaje şi echipamente n.c.a.
2014
2015
Fabricarea autovehiculelor de transport rutier, a remorcilor şi semiremorcilor
2014
2015
Fabricarea altor mijloace de transport
2014
2015
Fabricarea de mobilă
2014
2015
7.
66
Iul. Aug. Sept. Oct. Nov. Dec.July Aug. Sept. Oct . Nov . Dec .
70,6 65,0 82,0 74,2 79,7 79,6 Total131,5 118,4 138,9 141,4 161,7 152,6 Domestic55,4 51,8 67,9 57,4 59,3 61,5 Non-domestic
TotalDomesticNon-domestic
153,7 140,2 166,3 172,4 172,4 135,0 Total133,1 124,1 137,4 143,2 157,5 138,7 Domestic168,6 151,9 187,2 193,6 183,1 132,3 Non-domestic
TotalDomesticNon-domestic
171,5 158,1 177,2 191,0 184,3 178,4 Total134,8 115,4 131,2 117,9 125,2 149,7 Domestic200,4 191,8 213,4 248,5 230,8 201,0 Non-domestic
TotalDomesticNon-domestic
183,8 116,3 201,7 205,5 188,4 147,1 Total141,7 80,9 153,6 157,7 139,8 112,4 Domestic198,2 128,5 218,2 221,8 205,0 159,1 Non-domestic
TotalDomesticNon-domestic
118,8 93,3 137,5 135,7 107,3 178,7 Total116,2 90,3 106,3 147,0 115,2 246,4 Domestic119,7 94,3 147,8 132,0 104,6 156,3 Non-domestic
TotalDomesticNon-domestic
122,8 115,5 136,1 144,9 134,9 114,5 Total100,1 97,6 110,5 111,4 102,1 98,6 Domestic145,6 133,5 161,7 178,5 167,7 130,5 Non-domestic
TotalDomesticNon-domestic
Market Years Activities (divisions)
Manufacture of computer, electronic and optical products
2014
2015
2014
2014
Manufacture of electrical equipment
2015
2014
Manufacture of machinery and equipment n.e.c.
2015
Manufacture of motor vehicles, trailers and semi-trailers
2015
2014
Manufacture of other transport equipment
2015
Manufacture of furniture
2015
2014
67
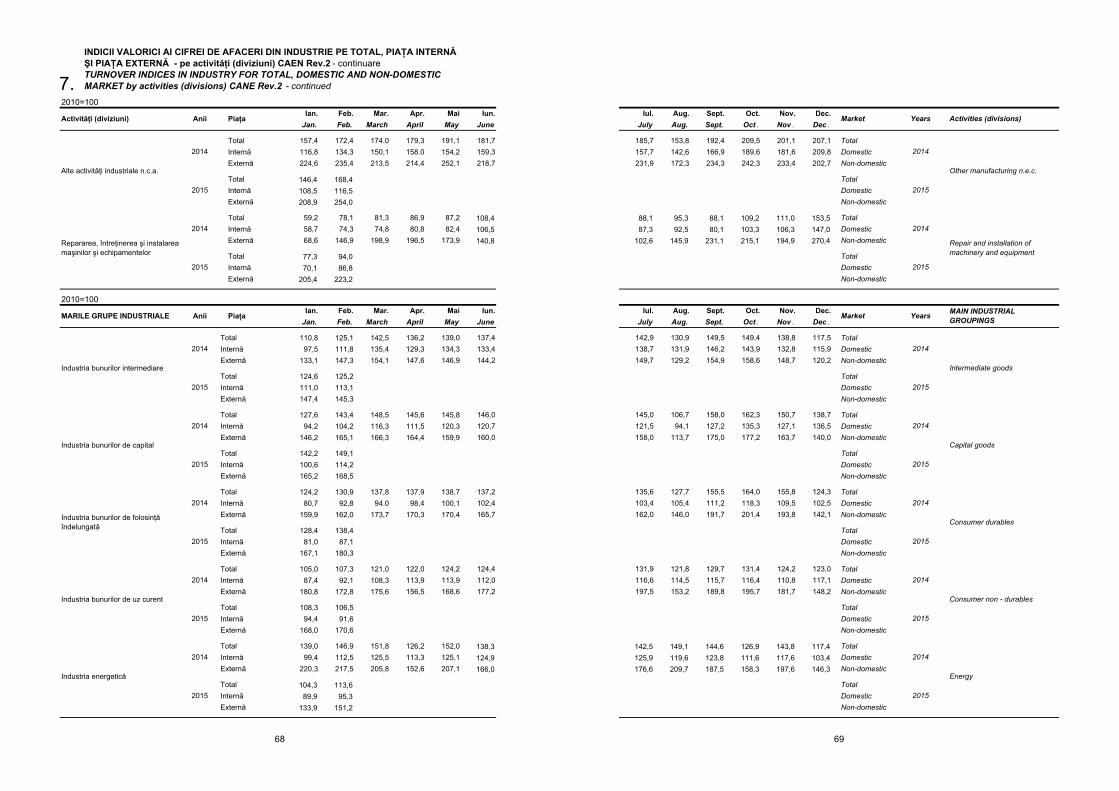
2010=100Ian. Feb. Mar. Apr. Mai Iun.
Jan. Feb. March April May June
Total 157,4 172,4 174.0 179,3 191,1 181,7Internă 116,8 134,3 150,1 158.0 154,2 159,3Externă 224,6 235,4 213,5 214,4 252,1 218,7
Total 146,4 168,4Internă 108,5 116,5Externă 208,9 254,0
Total 59,2 78,1 81,3 86,9 87,2 108,4Internă 58,7 74,3 74,8 80,8 82,4 106,5Externă 68,6 146,9 198,9 196,5 173,9 140,8
Total 77,3 94,0Internă 70,1 86,8Externă 205,4 223,2
2010=100Ian. Feb. Mar. Apr. Mai Iun.
Jan. Feb. March April May June
Total 110,8 125,1 142,5 136,2 139,0 137,4Internă 97,5 111,8 135,4 129,3 134,3 133,4Externă 133,1 147,3 154,1 147,6 146,9 144,2
Total 124,6 125,2Internă 111,0 113,1Externă 147,4 145,3
Total 127,6 143,4 148,5 145,6 145,8 146,0Internă 94,2 104,2 116,3 111,5 120,3 120,7Externă 146,2 165,1 166,3 164,4 159,9 160,0
Total 142,2 149,1Internă 100,6 114,2Externă 165,2 168,5
Total 124,2 130,9 137,8 137,9 138,7 137,2Internă 80,7 92,8 94.0 98,4 100,1 102,4Externă 159,9 162,0 173,7 170,3 170,4 165,7
Total 128,4 138,4Internă 81,0 87,1Externă 167,1 180,3
Total 105,0 107,3 121,0 122,0 124,2 124,4Internă 87,4 92,1 108,3 113,9 113,9 112,0Externă 180,8 172,8 175,6 156,5 168,6 177,2
Total 108,3 106,5Internă 94,4 91,6Externă 168,0 170,6
Total 139,0 146,9 151,8 126,2 152,0 138,3Internă 99,4 112,5 125,5 113,3 125,1 124,9Externă 220,3 217,5 205,8 152,6 207,1 166,0
Total 104,3 113,6Internă 89,9 95,3Externă 133,9 151,2
INDICII VALORICI AI CIFREI DE AFACERI DIN INDUSTRIE PE TOTAL, PIAŢA INTERNĂ ŞI PIAŢA EXTERNĂ - pe activităţi (diviziuni) CAEN Rev.2 - continuareTURNOVER INDICES IN INDUSTRY FOR TOTAL, DOMESTIC AND NON-DOMESTIC MARKET by activities (divisions) CANE Rev.2 - continued
Activităţi (diviziuni) Anii Piaţa
Alte activităţi industriale n.c.a.
2014
2015
2015
MARILE GRUPE INDUSTRIALE Anii Piaţa
Repararea, întreţinerea şi instalarea maşinilor şi echipamentelor
2014
2014
2015
Industria bunurilor intermediare
2014
2015
Industria bunurilor de capital
2014
2015
Industria energetică
2014
2015
Industria bunurilor de folosinţă îndelungată
2014
2015
Industria bunurilor de uz curent
7.
68
Iul. Aug. Sept. Oct. Nov. Dec.July Aug. Sept. Oct . Nov . Dec .
185,7 153,8 192,4 209,5 201,1 207,1 Total157,7 142,6 166,9 189,6 181,6 209,8 Domestic231,9 172,3 234,3 242,3 233,4 202,7 Non-domestic
TotalDomesticNon-domestic
88,1 95,3 88,1 109,2 111,0 153,5 Total87,3 92,5 80,1 103,3 106,3 147,0 Domestic
102,6 145,9 231,1 215,1 194,9 270,4 Non-domestic
TotalDomesticNon-domestic
Iul. Aug. Sept. Oct. Nov. Dec.July Aug. Sept. Oct . Nov . Dec .
142,9 130,9 149,5 149,4 138,8 117,5 Total138,7 131,9 146,2 143,9 132,8 115,9 Domestic149,7 129,2 154,9 158,6 148,7 120,2 Non-domestic
TotalDomesticNon-domestic
145,0 106,7 158,0 162,3 150,7 138,7 Total121,5 94,1 127,2 135,3 127,1 136,5 Domestic158,0 113,7 175,0 177,2 163,7 140,0 Non-domestic
TotalDomesticNon-domestic
135,6 127,7 155,5 164,0 155,8 124,3 Total103,4 105,4 111,2 118,3 109,5 102,5 Domestic162,0 146,0 191,7 201,4 193,8 142,1 Non-domestic
TotalDomesticNon-domestic
131,9 121,8 129,7 131,4 124,2 123,0 Total116,6 114,5 115,7 116,4 110,8 117,1 Domestic197,5 153,2 189,8 195,7 181,7 148,2 Non-domestic
TotalDomesticNon-domestic
142,5 149,1 144,6 126,9 143,8 117,4 Total125,9 119,6 123,8 111,6 117,6 103,4 Domestic176,6 209,7 187,5 158,3 197,6 146,3 Non-domestic
TotalDomesticNon-domestic
Market Years Activities (divisions)
Other manufacturing n.e.c.
2014
2015
2014
Repair and installation of machinery and equipment
2015
Market Years MAIN INDUSTRIAL GROUPINGS
2014
2014
2014
Intermediate goods
2015
2014
Capital goods
2015
Energy
2015
Consumer durables
2015
2014
Consumer non - durables
2015
69
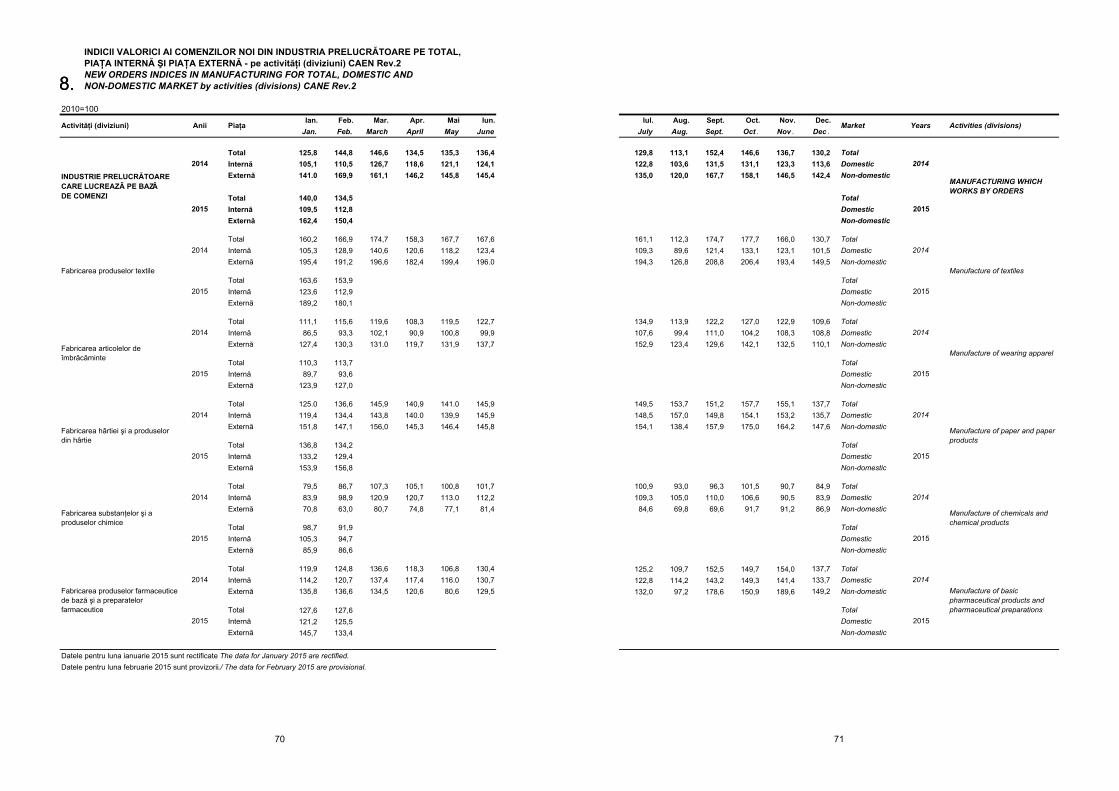
2010=100Ian. Feb. Mar. Apr. Mai Iun.
Jan. Feb. March April May June
Total 125,8 144,8 146,6 134,5 135,3 136,4Internă 105,1 110,5 126,7 118,6 121,1 124,1Externă 141.0 169,9 161,1 146,2 145,8 145,4
Total 140,0 134,5Internă 109,5 112,8Externă 162,4 150,4
Total 160,2 166,9 174,7 158,3 167,7 167,6Internă 105,3 128,9 140,6 120,6 118,2 123,4Externă 195,4 191,2 196,6 182,4 199,4 196.0
Total 163,6 153,9Internă 123,6 112,9Externă 189,2 180,1
Total 111,1 115,6 119,6 108,3 119,5 122,7Internă 86,5 93,3 102,1 90,9 100,8 99,9Externă 127,4 130,3 131.0 119,7 131,9 137,7
Total 110,3 113,7Internă 89,7 93,6Externă 123,9 127,0
Total 125.0 136,6 145,9 140,9 141.0 145,9Internă 119,4 134,4 143,8 140.0 139,9 145,9Externă 151,8 147,1 156,0 145,3 146,4 145,8
Total 136,8 134,2Internă 133,2 129,4Externă 153,9 156,8
Total 79,5 86,7 107,3 105,1 100,8 101,7Internă 83,9 98,9 120,9 120,7 113.0 112,2Externă 70,8 63,0 80,7 74,8 77,1 81,4
Total 98,7 91,9Internă 105,3 94,7Externă 85,9 86,6
Total 119,9 124,8 136,6 118,3 106,8 130,4Internă 114,2 120,7 137,4 117,4 116.0 130,7Externă 135,8 136,6 134,5 120,6 80,6 129,5
Total 127,6 127,6Internă 121,2 125,5Externă 145,7 133,4
Datele pentru luna februarie 2015 sunt provizorii./ The data for February 2015 are provisional.
2014
Activităţi (diviziuni) Anii
2015
2015
2015
INDICII VALORICI AI COMENZILOR NOI DIN INDUSTRIA PRELUCRĂTOARE PE TOTAL,
NEW ORDERS INDICES IN MANUFACTURING FOR TOTAL, DOMESTIC AND NON-DOMESTIC MARKET by activities (divisions) CANE Rev.2
PIAŢA INTERNĂ ŞI PIAŢA EXTERNĂ - pe activităţi (diviziuni) CAEN Rev.2
INDUSTRIE PRELUCRĂTOARECARE LUCREAZÃ PE BAZĂ DE COMENZI
2014
Fabricarea produselor textile
2014
Piaţa
Fabricarea articolelor de îmbrăcăminte
2014
Fabricarea hârtiei şi a produselor din hârtie
2014
2015
Fabricarea substanţelor şi a produselor chimice
Datele pentru luna ianuarie 2015 sunt rectificate The data for January 2015 are rectified.
2015
2015
2014Fabricarea produselor farmaceutice de bază şi a preparatelor farmaceutice
8.8.
70
Iul. Aug. Sept. Oct. Nov. Dec.July Aug. Sept. Oct . Nov . Dec .
129,8 113,1 152,4 146,6 136,7 130,2 Total122,8 103,6 131,5 131,1 123,3 113,6 Domestic135,0 120,0 167,7 158,1 146,5 142,4 Non-domestic
TotalDomesticNon-domestic
161,1 112,3 174,7 177,7 166,0 130,7 Total109,3 89,6 121,4 133,1 123,1 101,5 Domestic194,3 126,8 208,8 206,4 193,4 149,5 Non-domestic
TotalDomesticNon-domestic
134,9 113,9 122,2 127,0 122,9 109,6 Total107,6 99,4 111,0 104,2 108,3 108,8 Domestic152,9 123,4 129,6 142,1 132,5 110,1 Non-domestic
TotalDomesticNon-domestic
149,5 153,7 151,2 157,7 155,1 137,7 Total148,5 157,0 149,8 154,1 153,2 135,7 Domestic154,1 138,4 157,9 175,0 164,2 147,6 Non-domestic
TotalDomesticNon-domestic
100,9 93,0 96,3 101,5 90,7 84,9 Total109,3 105,0 110,0 106,6 90,5 83,9 Domestic84,6 69,8 69,6 91,7 91,2 86,9 Non-domestic
TotalDomesticNon-domestic
125,2 109,7 152,5 149,7 154,0 137,7 Total122,8 114,2 143,2 149,3 141,4 133,7 Domestic132,0 97,2 178,6 150,9 189,6 149,2 Non-domestic
TotalDomesticNon-domestic
2014
2015
2015
2015
Market Years Activities (divisions)
2014
MANUFACTURING WHICH WORKS BY ORDERS
2014
2014
Manufacture of textiles
Manufacture of wearing apparel
Manufacture of paper and paper products
2014
Manufacture of chemicals and chemical products
Manufacture of basic pharmaceutical products and pharmaceutical preparations
2015
2015
2014
2015
71
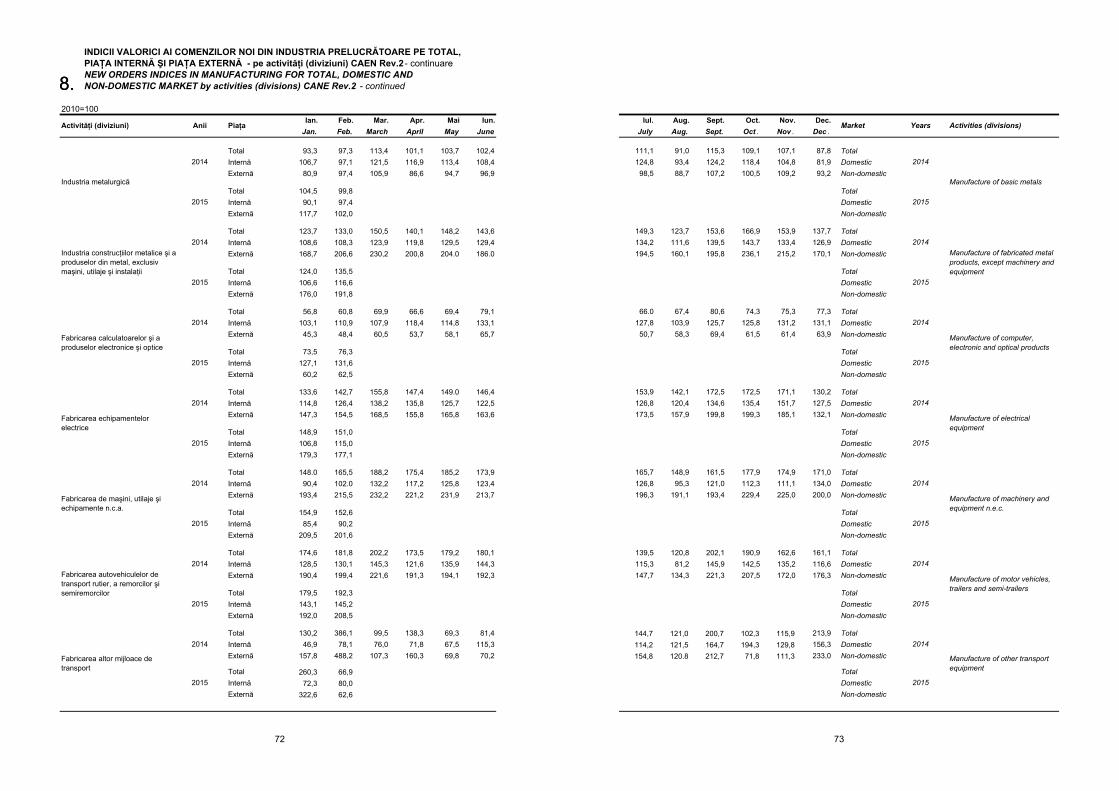
2010=100Ian. Feb. Mar. Apr. Mai Iun.
Jan. Feb. March April May June
Total 93,3 97,3 113,4 101,1 103,7 102,4Internă 106,7 97,1 121,5 116,9 113,4 108,4Externă 80,9 97,4 105,9 86,6 94,7 96,9
Total 104,5 99,8Internă 90,1 97,4Externă 117,7 102,0
Total 123,7 133,0 150,5 140,1 148,2 143,6Internă 108,6 108,3 123,9 119,8 129,5 129,4Externă 168,7 206,6 230,2 200,8 204.0 186.0
Total 124,0 135,5Internă 106,6 116,6Externă 176,0 191,8
Total 56,8 60,8 69,9 66,6 69,4 79,1Internă 103,1 110,9 107,9 118,4 114,8 133,1Externă 45,3 48,4 60,5 53,7 58,1 65,7
Total 73,5 76,3Internă 127,1 131,6Externă 60,2 62,5
Total 133,6 142,7 155,8 147,4 149.0 146,4Internă 114,8 126,4 138,2 135,8 125,7 122,5Externă 147,3 154,5 168,5 155,8 165,8 163,6
Total 148,9 151,0Internă 106,8 115,0Externă 179,3 177,1
Total 148.0 165,5 188,2 175,4 185,2 173,9Internă 90,4 102.0 132,2 117,2 125,8 123,4Externă 193,4 215,5 232,2 221,2 231,9 213,7
Total 154,9 152,6Internă 85,4 90,2Externă 209,5 201,6
Total 174,6 181,8 202,2 173,5 179,2 180,1Internă 128,5 130,1 145,3 121,6 135,9 144,3Externă 190,4 199,4 221,6 191,3 194,1 192,3
Total 179,5 192,3Internă 143,1 145,2Externă 192,0 208,5
Total 130,2 386,1 99,5 138,3 69,3 81,4Internă 46,9 78,1 76,0 71,8 67,5 115,3Externă 157,8 488,2 107,3 160,3 69,8 70,2
Total 260,3 66,9Internă 72,3 80,0Externă 322,6 62,6
2015
PIAŢA INTERNĂ ŞI PIAŢA EXTERNĂ - pe activităţi (diviziuni) CAEN Rev.2 - continuare NEW ORDERS INDICES IN MANUFACTURING FOR TOTAL, DOMESTIC AND
INDICII VALORICI AI COMENZILOR NOI DIN INDUSTRIA PRELUCRĂTOARE PE TOTAL,
Activităţi (diviziuni) Anii Piaţa
Fabricarea calculatoarelor şi a produselor electronice şi optice
2015
2014
Industria construcţiilor metalice şi a produselor din metal, exclusiv maşini, utilaje şi instalaţii
2014
2015
Industria metalurgică
Fabricarea echipamentelor electrice
2014
2015
2014
NON-DOMESTIC MARKET by activities (divisions) CANE Rev.2 - continued
Fabricarea de maşini, utilaje şi echipamente n.c.a.
Fabricarea autovehiculelor de transport rutier, a remorcilor şi semiremorcilor
2014
2015
2014
2015
Fabricarea altor mijloace de transport
2014
2015
8.8.
72
Iul. Aug. Sept. Oct. Nov. Dec.July Aug. Sept. Oct . Nov . Dec .
111,1 91,0 115,3 109,1 107,1 87,8 Total124,8 93,4 124,2 118,4 104,8 81,9 Domestic98,5 88,7 107,2 100,5 109,2 93,2 Non-domestic
TotalDomesticNon-domestic
149,3 123,7 153,6 166,9 153,9 137,7 Total134,2 111,6 139,5 143,7 133,4 126,9 Domestic194,5 160,1 195,8 236,1 215,2 170,1 Non-domestic
TotalDomesticNon-domestic
66.0 67,4 80,6 74,3 75,3 77,3 Total127,8 103,9 125,7 125,8 131,2 131,1 Domestic50,7 58,3 69,4 61,5 61,4 63,9 Non-domestic
TotalDomesticNon-domestic
153,9 142,1 172,5 172,5 171,1 130,2 Total126,8 120,4 134,6 135,4 151,7 127,5 Domestic173,5 157,9 199,8 199,3 185,1 132,1 Non-domestic
TotalDomesticNon-domestic
165,7 148,9 161,5 177,9 174,9 171,0 Total126,8 95,3 121,0 112,3 111,1 134,0 Domestic196,3 191,1 193,4 229,4 225,0 200,0 Non-domestic
TotalDomesticNon-domestic
139,5 120,8 202,1 190,9 162,6 161,1 Total115,3 81,2 145,9 142,5 135,2 116,6 Domestic147,7 134,3 221,3 207,5 172,0 176,3 Non-domestic
TotalDomesticNon-domestic
144,7 121,0 200,7 102,3 115,9 213,9 Total114,2 121,5 164,7 194,3 129,8 156,3 Domestic154,8 120.8 212,7 71,8 111,3 233,0 Non-domestic
TotalDomesticNon-domestic
Manufacture of basic metals
Market Years Activities (divisions)
Manufacture of fabricated metal products, except machinery and equipment
2015
2014
2014
Manufacture of computer, electronic and optical products
2014
2015
2015
Manufacture of electrical equipment
2015
Manufacture of machinery and equipment n.e.c.
2015
2014
2014
Manufacture of motor vehicles, trailers and semi-trailers
2015
2014
Manufacture of other transport equipment
2014
2015
73
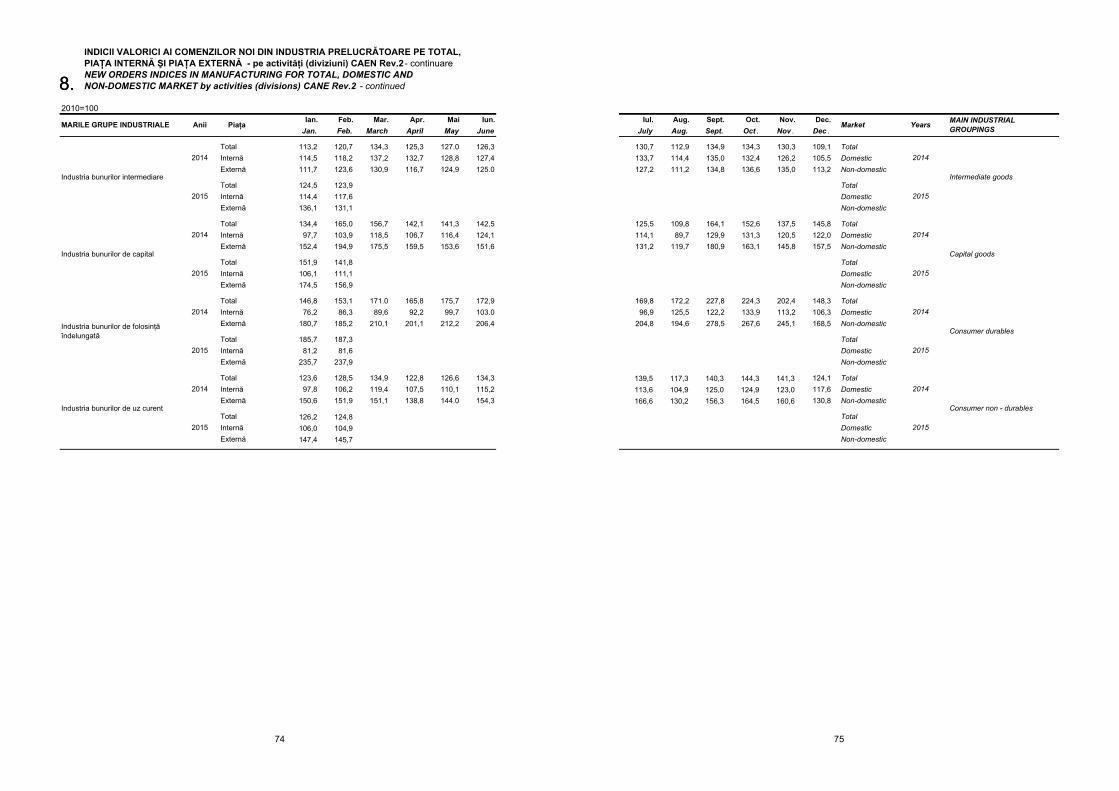
2010=100Ian. Feb. Mar. Apr. Mai Iun.
Jan. Feb. March April May June
Total 113,2 120,7 134,3 125,3 127.0 126,3Internă 114,5 118,2 137,2 132,7 128,8 127,4Externă 111,7 123,6 130,9 116,7 124,9 125.0
Total 124,5 123,9Internă 114,4 117,6Externă 136,1 131,1
Total 134,4 165,0 156,7 142,1 141,3 142,5Internă 97,7 103,9 118,5 106,7 116,4 124,1Externă 152,4 194,9 175,5 159,5 153,6 151,6
Total 151,9 141,8Internă 106,1 111,1Externă 174,5 156,9
Total 146,8 153,1 171.0 165,8 175,7 172,9Internă 76,2 86,3 89,6 92,2 99,7 103.0Externă 180,7 185,2 210,1 201,1 212,2 206,4
Total 185,7 187,3Internă 81,2 81,6Externă 235,7 237,9
Total 123,6 128,5 134,9 122,8 126,6 134,3Internă 97,8 106,2 119,4 107,5 110,1 115,2Externă 150,6 151,9 151,1 138,8 144.0 154,3
Total 126,2 124,8Internă 106,0 104,9Externă 147,4 145,7
NON-DOMESTIC MARKET by activities (divisions) CANE Rev.2 - continued
PIAŢA INTERNĂ ŞI PIAŢA EXTERNĂ - pe activităţi (diviziuni) CAEN Rev.2 - continuare NEW ORDERS INDICES IN MANUFACTURING FOR TOTAL, DOMESTIC AND
INDICII VALORICI AI COMENZILOR NOI DIN INDUSTRIA PRELUCRĂTOARE PE TOTAL,
MARILE GRUPE INDUSTRIALE Anii Piaţa
2014
2015
Industria bunurilor intermediare
2014
2015
Industria bunurilor de capital
2014
2015
Industria bunurilor de folosinţă îndelungată
2014
2015
Industria bunurilor de uz curent
8.8.
74
Iul. Aug. Sept. Oct. Nov. Dec.July Aug. Sept. Oct . Nov . Dec .
130,7 112,9 134,9 134,3 130,3 109,1 Total133,7 114,4 135,0 132,4 126,2 105,5 Domestic127,2 111,2 134,8 136,6 135,0 113,2 Non-domestic
TotalDomesticNon-domestic
125,5 109,8 164,1 152,6 137,5 145,8 Total114,1 89,7 129,9 131,3 120,5 122,0 Domestic131,2 119,7 180,9 163,1 145,8 157,5 Non-domestic
TotalDomesticNon-domestic
169,8 172,2 227,8 224,3 202,4 148,3 Total96,9 125,5 122,2 133,9 113,2 106,3 Domestic
204,8 194,6 278,5 267,6 245,1 168,5 Non-domestic
TotalDomesticNon-domestic
139,5 117,3 140,3 144,3 141,3 124,1 Total113,6 104,9 125,0 124,9 123,0 117,6 Domestic166,6 130,2 156,3 164,5 160,6 130,8 Non-domestic
TotalDomesticNon-domestic
Market Years MAIN INDUSTRIAL GROUPINGS
2014
2014
Intermediate goods
2015
2014
Capital goods
2015
Consumer durables
2015
2014
Consumer non - durables
2015
75
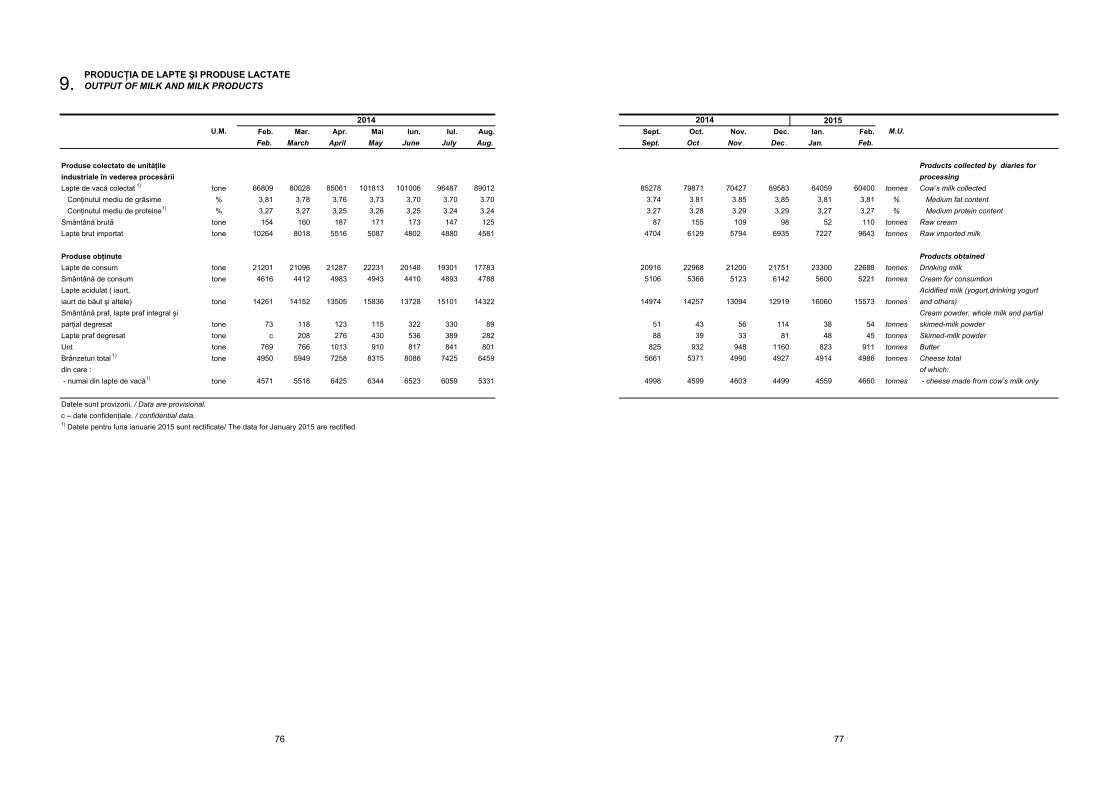
Feb. Mar. Apr. Mai Iun. Iul. Aug.Feb. March April May June July Aug.
Produse colectate de unităţileindustriale în vederea procesăriiLapte de vacă colectat 1) tone 66809 80028 85061 101813 101006 96487 89012 Conţinutul mediu de grăsime % 3,81 3,78 3,76 3,73 3,70 3.70 3.70 Conţinutul mediu de proteine1) % 3,27 3,27 3,25 3,26 3,25 3.24 3.24Smântână brutǎ tone 154 160 187 171 173 147 125Lapte brut importat tone 10264 8018 5516 5087 4802 4880 4581
Produse obţinuteLapte de consum tone 21201 21096 21287 22231 20148 19301 17783Smântână de consum tone 4616 4412 4983 4943 4410 4893 4788Lapte acidulat ( iaurt, iaurt de băut şi altele) tone 14261 14152 13505 15836 13728 15101 14322Smântână praf, lapte praf integral şiparţial degresat tone 73 118 123 115 322 330 89Lapte praf degresat tone c 208 276 430 536 389 282Unt tone 769 766 1013 910 817 841 801Brânzeturi total 1) tone 4950 5949 7258 8315 8086 7425 6459din care : - numai din lapte de vacă1) tone 4571 5518 6425 6344 6523 6059 5331
Datele sunt provizorii. / Data are provisional.c – date confidenţiale. / confidential data. 1) Datele pentru luna ianuarie 2015 sunt rectificate/ The data for January 2015 are rectified.
PRODUCŢIA DE LAPTE ŞI PRODUSE LACTATEOUTPUT OF MILK AND MILK PRODUCTS
U.M.2014
9.
76
Sept. Oct. Nov. Dec. Ian. Feb.Sept. Oct . Nov . Dec . Jan. Feb.
Products collected by diaries forprocessing
85278 79871 70427 69583 64059 60400 tonnes Cow’s milk collected3.74 3.81 3.85 3,85 3,81 3,81 % Medium fat content3.27 3.28 3.29 3,29 3,27 3,27 % Medium protein content
87 155 109 98 52 110 tonnes Raw cream 4704 6129 5794 6935 7227 9643 tonnes Raw imported milk
Products obtained20916 22968 21200 21751 23300 22688 tonnes Drinking milk5106 5368 5123 6142 5600 5221 tonnes Cream for consumtion
Acidified milk (yogurt,drinking yogurt 14974 14257 13094 12919 16060 15573 tonnes and others)
Cream powder, whole milk and partial51 43 56 114 38 54 tonnes skimed-milk powder88 39 33 81 48 45 tonnes Skimed-milk powder
825 932 948 1160 823 911 tonnes Butter5661 5371 4990 4927 4914 4986 tonnes Cheese total
of which:4998 4599 4603 4499 4559 4660 tonnes - cheese made from cow’s milk only
M.U.20152014
77
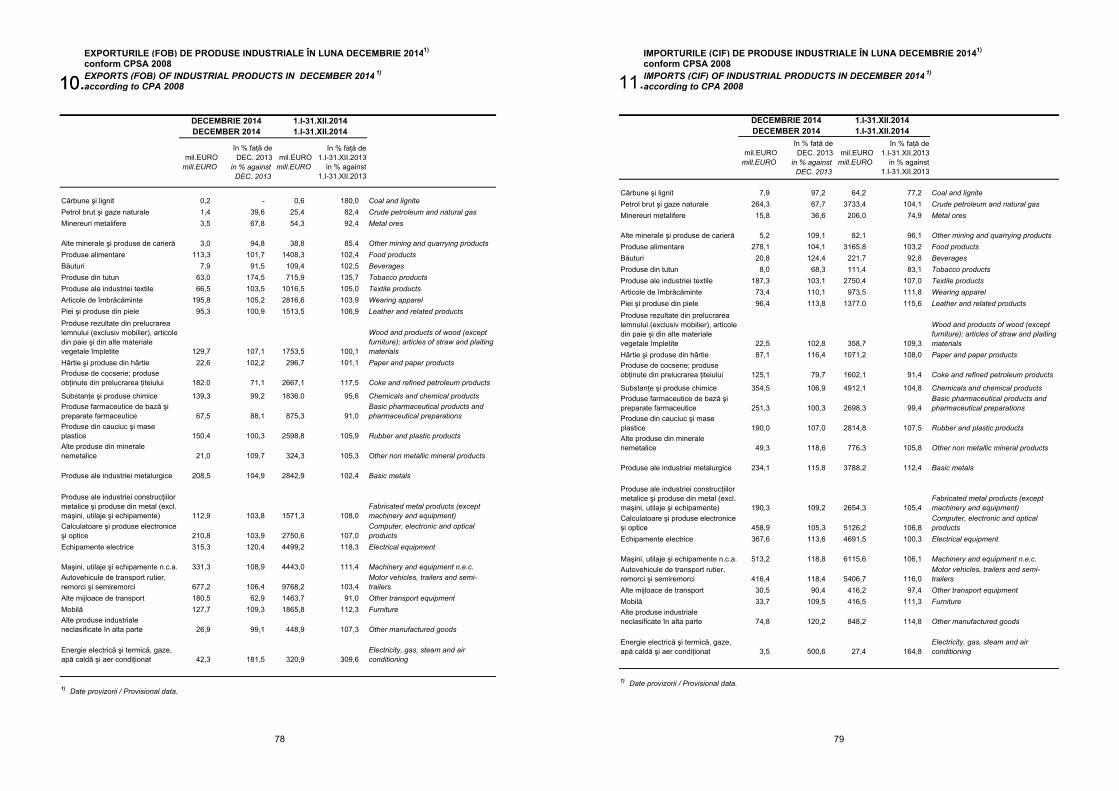
EXPORTURILE (FOB) DE PRODUSE INDUSTRIALE ÎN LUNA DECEMBRIE 20141)
conform CPSA 2008 EXPORTS (FOB) OF INDUSTRIAL PRODUCTS IN DECEMBER 2014 1)
according to CPA 2008
Cărbune şi lignit 0,2 - 0,6 180,0 Coal and lignitePetrol brut şi gaze naturale 1,4 39,6 25,4 82,4 Crude petroleum and natural gasMinereuri metalifere 3,5 67,8 54,3 92,4 Metal ores
Alte minerale şi produse de carieră 3,0 94,8 38,8 85,4 Other mining and quarrying productsProduse alimentare 113,3 101,7 1408,3 102,4 Food productsBăuturi 7,9 91,5 109,4 102,5 BeveragesProduse din tutun 63,0 174,5 715,9 135,7 Tobacco productsProduse ale industriei textile 66,5 103,5 1016,5 105,0 Textile productsArticole de îmbrăcăminte 195,8 105,2 2816,6 103,9 Wearing apparelPiei şi produse din piele 95,3 100,9 1513,5 106,9 Leather and related productsProduse rezultate din prelucrarea lemnului (exclusiv mobilier), articole din paie şi din alte materiale vegetale împletite 129,7 107,1 1753,5 100,1
Wood and products of wood (except furniture); articles of straw and plaiting materials
Hârtie şi produse din hârtie 22,6 102,2 296,7 101,1 Paper and paper productsProduse de cocserie; produse obţinute din prelucrarea ţiteiului 182.0 71,1 2667,1 117,5 Coke and refined petroleum products
Substanţe şi produse chimice 139,3 99,2 1836.0 95,6 Chemicals and chemical products Produse farmaceutice de bază şi preparate farmaceutice 67,5 88,1 875,3 91,0
Basic pharmaceutical products and pharmaceutical preparations
Produse din cauciuc şi mase plastice 150,4 100,3 2598,8 105,9 Rubber and plastic productsAlte produse din minerale nemetalice 21,0 109,7 324,3 105,3 Other non metallic mineral products
Produse ale industriei metalurgice 208,5 104,9 2842,9 102,4 Basic metals
Produse ale industriei construcţiilor metalice şi produse din metal (excl. maşini, utilaje şi echipamente) 112,9 103,8 1571,3 108,0
Fabricated metal products (except machinery and equipment)
Calculatoare şi produse electronice şi optice 210,8 103,9 2750,6 107,0
Computer, electronic and optical products
Echipamente electrice 315,3 120,4 4499,2 118,3 Electrical equipment
Maşini, utilaje şi echipamente n.c.a. 331,3 108,9 4443,0 111,4 Machinery and equipment n.e.c.Autovehicule de transport rutier, remorci şi semiremorci 677,2 106,4 9768,2 103,4
Motor vehicles, trailers and semi-trailers
Alte mijloace de transport 180,5 62,9 1463,7 91,0 Other transport equipmentMobilă 127,7 109,3 1865,8 112,3 Furniture Alte produse industriale neclasificate în alta parte 26,9 99,1 448,9 107,3 Other manufactured goods
Energie electrică şi termică, gaze, apă caldă şi aer condiţionat 42,3 181,5 320,9 309,6
Electricity, gas, steam and air conditioning
1) Date provizorii / Provisional data.
în % faţă de DEC. 2013
in % against DEC. 2013
în % faţă de1.I-31.XII.2013
in % against 1.I-31.XII.2013
DECEMBRIE 2014DECEMBER 2014
1.I-31.XII.20141.I-31.XII.2014
mil.EURO mill.EURO
mil.EURO mill.EURO
10.10.
78
IMPORTURILE (CIF) DE PRODUSE INDUSTRIALE ÎN LUNA DECEMBRIE 20141)
conform CPSA 2008 IMPORTS (CIF) OF INDUSTRIAL PRODUCTS IN DECEMBER 2014 1)
according to CPA 2008
Cărbune şi lignit 7,9 97,2 64,2 77,2 Coal and lignitePetrol brut şi gaze naturale 264,3 67,7 3733,4 104,1 Crude petroleum and natural gasMinereuri metalifere 15,8 36,6 206,0 74,9 Metal ores
Alte minerale şi produse de carieră 5,2 109,1 82,1 96,1 Other mining and quarrying productsProduse alimentare 278,1 104,1 3165,8 103,2 Food productsBăuturi 20,8 124,4 221,7 92,8 BeveragesProduse din tutun 8,0 68,3 111,4 83,1 Tobacco productsProduse ale industriei textile 187,3 103,1 2750,4 107,0 Textile productsArticole de îmbrăcăminte 73,4 110,1 973,5 111,8 Wearing apparelPiei şi produse din piele 96,4 113,8 1377.0 115,6 Leather and related productsProduse rezultate din prelucrarea lemnului (exclusiv mobilier), articole din paie şi din alte materiale vegetale împletite 22,5 102,8 358,7 109,3
Wood and products of wood (except furniture); articles of straw and plaiting materials
Hârtie şi produse din hârtie 87,1 116,4 1071,2 108,0 Paper and paper productsProduse de cocserie; produse obţinute din prelucrarea ţiteiului 125,1 79,7 1602,1 91,4 Coke and refined petroleum products
Substanţe şi produse chimice 354,5 106,9 4912,1 104,8 Chemicals and chemical products Produse farmaceutice de bază şi preparate farmaceutice 251,3 100,3 2698,3 99,4
Basic pharmaceutical products and pharmaceutical preparations
Produse din cauciuc şi mase plastice 190,0 107,0 2814,8 107,5 Rubber and plastic productsAlte produse din minerale nemetalice 49,3 118,6 776,3 105,8 Other non metallic mineral products
Produse ale industriei metalurgice 234,1 115,8 3788,2 112,4 Basic metals
Produse ale industriei construcţiilor metalice şi produse din metal (excl. maşini, utilaje şi echipamente) 190,3 109,2 2654,3 105,4
Fabricated metal products (except machinery and equipment)
Calculatoare şi produse electronice şi optice 458,9 105,3 5126,2 106,8
Computer, electronic and optical products
Echipamente electrice 367,6 113,6 4691,5 100,3 Electrical equipment
Maşini, utilaje şi echipamente n.c.a. 513,2 118,8 6115,6 106,1 Machinery and equipment n.e.c.Autovehicule de transport rutier, remorci şi semiremorci 416,4 118,4 5406,7 116,0
Motor vehicles, trailers and semi-trailers
Alte mijloace de transport 30,5 90,4 416,2 97,4 Other transport equipmentMobilă 33,7 109,5 416,5 111,3 Furniture Alte produse industriale neclasificate în alta parte 74,8 120,2 848,2 114,8 Other manufactured goods
Energie electrică şi termică, gaze, apă caldă şi aer condiţionat 3,5 500,6 27,4 164,8
Electricity, gas, steam and air conditioning
1) Date provizorii / Provisional data.
în % faţă de DEC. 2013
in % against DEC. 2013
în % faţă de1.I-31.XII.2013
in % against 1.I-31.XII.2013
DECEMBRIE 2014DECEMBER 2014
1.I-31.XII.20141.I-31.XII.2014
mil.EURO mill.EURO
mil.EURO mill.EURO
11.
79
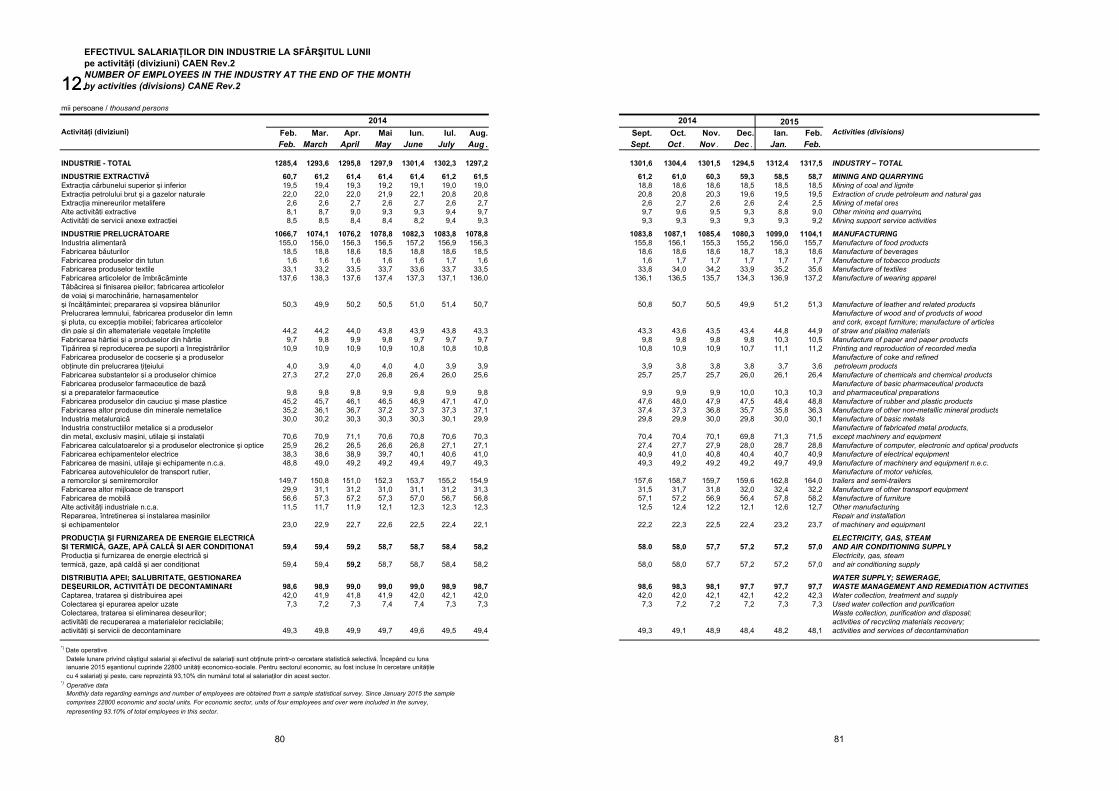
Feb. Mar. Apr. Mai Iun. Iul. Aug.Feb. March April May June July Aug .
INDUSTRIE - TOTAL 1285,4 1293,6 1295,8 1297,9 1301,4 1302,3 1297,2
INDUSTRIE EXTRACTIVĂ 60,7 61,2 61,4 61,4 61,4 61,2 61,5Extracţia cǎrbunelui superior şi inferior 19,5 19,4 19,3 19,2 19,1 19,0 19,0Extracţia petrolului brut şi a gazelor naturale 22,0 22,0 22,0 21,9 22,1 20,8 20,8Extracţia minereurilor metalifere 2,6 2,6 2,7 2,6 2,7 2,6 2,7Alte activitǎţi extractive 8,1 8,7 9,0 9,3 9,3 9,4 9,7Activitǎţi de servicii anexe extracţiei 8,5 8,5 8,4 8,4 8,2 9,4 9,3
INDUSTRIE PRELUCRĂTOARE 1066,7 1074,1 1076,2 1078,8 1082,3 1083,8 1078,8Industria alimentarǎ 155,0 156,0 156,3 156,5 157,2 156,9 156,3Fabricarea bǎuturilor 18,5 18,8 18,6 18,5 18,8 18,6 18,5Fabricarea produselor din tutun 1,6 1,6 1,6 1,6 1,6 1,7 1,6Fabricarea produselor textile 33,1 33,2 33,5 33,7 33,6 33,7 33,5Fabricarea articolelor de îmbrǎcǎminte 137,6 138,3 137,6 137,4 137,3 137,1 136,0Tǎbǎcirea şi finisarea pieilor; fabricarea articolelor de voiaj şi marochinǎrie, harnaşamentelor şi încǎlţǎmintei; prepararea şi vopsirea blǎnurilor 50,3 49,9 50,2 50,5 51,0 51,4 50,7Prelucrarea lemnului, fabricarea produselor din lemnşi pluta, cu excepţia mobilei; fabricarea articolelor din paie şi din altemateriale vegetale împletite 44,2 44,2 44,0 43,8 43,9 43,8 43,3Fabricarea hârtiei şi a produselor din hârtie 9,7 9,8 9,9 9,8 9,7 9,7 9,7Tipǎrirea şi reproducerea pe suporţi a înregistrǎrilor 10,9 10,9 10,9 10,9 10,8 10,8 10,8Fabricarea produselor de cocserie şi a produselor obţinute din prelucrarea ţiţeiului 4,0 3,9 4,0 4,0 4,0 3,9 3,9Fabricarea substanţelor şi a produselor chimice 27,3 27,2 27,0 26,8 26,4 26,0 25,6Fabricarea produselor farmaceutice de bazǎ şi a preparatelor farmaceutice 9,8 9,8 9,8 9,9 9,8 9,9 9,8Fabricarea produselor din cauciuc şi mase plastice 45,2 45,7 46,1 46,5 46,9 47,1 47,0Fabricarea altor produse din minerale nemetalice 35,2 36,1 36,7 37,2 37,3 37,3 37,1Industria metalurgicǎ 30,0 30,2 30,3 30,3 30,3 30,1 29,9Industria construcţiilor metalice şi a produselor din metal, exclusiv maşini, utilaje şi instalaţii 70,6 70,9 71,1 70,6 70,8 70,6 70,3Fabricarea calculatoarelor şi a produselor electronice şi optice 25,9 26,2 26,5 26,6 26,8 27,1 27,1Fabricarea echipamentelor electrice 38,3 38,6 38,9 39,7 40,1 40,6 41,0Fabricarea de masini, utilaje şi echipamente n.c.a. 48,8 49,0 49,2 49,2 49,4 49,7 49,3Fabricarea autovehiculelor de transport rutier, a remorcilor şi semiremorcilor 149,7 150,8 151,0 152,3 153,7 155,2 154,9Fabricarea altor mijloace de transport 29,9 31,1 31,2 31,0 31,1 31,2 31,3Fabricarea de mobilǎ 56,6 57,3 57,2 57,3 57,0 56,7 56,8Alte activitǎţi industriale n.c.a. 11,5 11,7 11,9 12,1 12,3 12,3 12,3Repararea, întreţinerea şi instalarea maşinilorşi echipamentelor 23,0 22,9 22,7 22,6 22,5 22,4 22,1
PRODUCŢIA ŞI FURNIZAREA DE ENERGIE ELECTRICǍ ŞI TERMICĂ, GAZE, APĂ CALDǍ ŞI AER CONDIŢIONAT 59,4 59,4 59,2 58,7 58,7 58,4 58,2Producţia şi furnizarea de energie electricǎ şitermică, gaze, apă caldǎ şi aer condiţionat 59,4 59,4 59,2 58,7 58,7 58,4 58,2
DISTRIBUŢIA APEI; SALUBRITATE, GESTIONAREADEŞEURILOR, ACTIVITĂŢI DE DECONTAMINARE 98,6 98,9 99,0 99,0 99,0 98,9 98,7Captarea, tratarea şi distribuirea apei 42,0 41,9 41,8 41,9 42,0 42,1 42,0Colectarea şi epurarea apelor uzate 7,3 7,2 7,3 7,4 7,4 7,3 7,3Colectarea, tratarea si eliminarea deşeurilor;activităţi de recuperarea a materialelor reciclabile;activităţi şi servicii de decontaminare 49,3 49,8 49,9 49,7 49,6 49,5 49,4
representing 93.10% of total employees in this sector.
mii persoane / thousand persons
Activităţi (diviziuni)
EFECTIVUL SALARIAŢILOR DIN INDUSTRIE LA SFÂRŞITUL LUNIIpe activităţi (diviziuni) CAEN Rev.2NUMBER OF EMPLOYEES IN THE INDUSTRY AT THE END OF THE MONTH by activities (divisions) CANE Rev.2
2014
*) Operative data Monthly data regarding earnings and number of employees are obtained from a sample statistical survey. Since January 2015 the sample comprises 22800 economic and social units. For economic sector, units of four employees and over were included in the survey,
cu 4 salariaţi şi peste, care reprezintă 93,10% din numărul total al salariaţilor din acest sector.
*) Date operative Datele lunare privind câştigul salarial şi efectivul de salariaţi sunt obţinute printr-o cercetare statistică selectivă. Începând cu luna ianuarie 2015 eşantionul cuprinde 22800 unităţi economico-sociale. Pentru sectorul economic, au fost incluse în cercetare unităţile
12.12.
80
Sept. Oct. Nov. Dec. Ian. Feb.Sept. Oct . Nov . Dec . Jan. Feb.
1301,6 1304,4 1301,5 1294,5 1312,4 1317,5 INDUSTRY – TOTAL
61,2 61,0 60,3 59,3 58,5 58,7 MINING AND QUARRYING18,8 18,6 18,6 18,5 18,5 18,5 Mining of coal and lignite20,8 20,8 20,3 19,6 19,5 19,5 Extraction of crude petroleum and natural gas2,6 2,7 2,6 2,6 2,4 2,5 Mining of metal ores9,7 9,6 9,5 9,3 8,8 9,0 Other mining and quarrying9,3 9,3 9,3 9,3 9,3 9,2 Mining support service activities
1083,8 1087,1 1085,4 1080,3 1099,0 1104,1 MANUFACTURING155,8 156,1 155,3 155,2 156,0 155,7 Manufacture of food products18,6 18,6 18,6 18,7 18,3 18,6 Manufacture of beverages1,6 1,7 1,7 1,7 1,7 1,7 Manufacture of tobacco products
33,8 34,0 34,2 33,9 35,2 35,6 Manufacture of textiles136,1 136,5 135,7 134,3 136,9 137,2 Manufacture of wearing apparel
50,8 50,7 50,5 49,9 51,2 51,3 Manufacture of leather and related productsManufacture of wood and of products of wood and cork, except furniture; manufacture of articles
43,3 43,6 43,5 43,4 44,8 44,9 of straw and plaiting materials9,8 9,8 9,8 9,8 10,3 10,5 Manufacture of paper and paper products
10,8 10,9 10,9 10,7 11,1 11,2 Printing and reproduction of recorded mediaManufacture of coke and refined
3,9 3,8 3,8 3,8 3,7 3,6 petroleum products25,7 25,7 25,7 26,0 26,1 26,4 Manufacture of chemicals and chemical products
Manufacture of basic pharmaceutical products 9,9 9,9 9,9 10,0 10,3 10,3 and pharmaceutical preparations
47,6 48,0 47,9 47,5 48,4 48,8 Manufacture of rubber and plastic products37,4 37,3 36,8 35,7 35,8 36,3 Manufacture of other non-metallic mineral products29,8 29,9 30,0 29,8 30,0 30,1 Manufacture of basic metals
Manufacture of fabricated metal products, 70,4 70,4 70,1 69,8 71,3 71,5 except machinery and equipment27,4 27,7 27,9 28,0 28,7 28,8 Manufacture of computer, electronic and optical products40,9 41,0 40,8 40,4 40,7 40,9 Manufacture of electrical equipment49,3 49,2 49,2 49,2 49,7 49,9 Manufacture of machinery and equipment n.e.c.
Manufacture of motor vehicles, 157,6 158,7 159,7 159,6 162,8 164,0 trailers and semi-trailers31,5 31,7 31,8 32,0 32,4 32,2 Manufacture of other transport equipment57,1 57,2 56,9 56,4 57,8 58,2 Manufacture of furniture12,5 12,4 12,2 12,1 12,6 12,7 Other manufacturing
Repair and installation 22,2 22,3 22,5 22,4 23,2 23,7 of machinery and equipment
ELECTRICITY, GAS, STEAM 58.0 58,0 57,7 57,2 57,2 57,0 AND AIR CONDITIONING SUPPLY
Electricity, gas, steam 58,0 58,0 57,7 57,2 57,2 57,0 and air conditioning supply
WATER SUPPLY; SEWERAGE, 98,6 98,3 98,1 97,7 97,7 97,7 WASTE MANAGEMENT AND REMEDIATION ACTIVITIES42,0 42,0 42,1 42,1 42,2 42,3 Water collection, treatment and supply7,3 7,2 7,2 7,2 7,3 7,3 Used water collection and purification
Waste collection, purification and disposal; activities of recycling materials recovery;
49,3 49,1 48,9 48,4 48,2 48,1 activities and services of decontamination
Activities (divisions)20152014
81
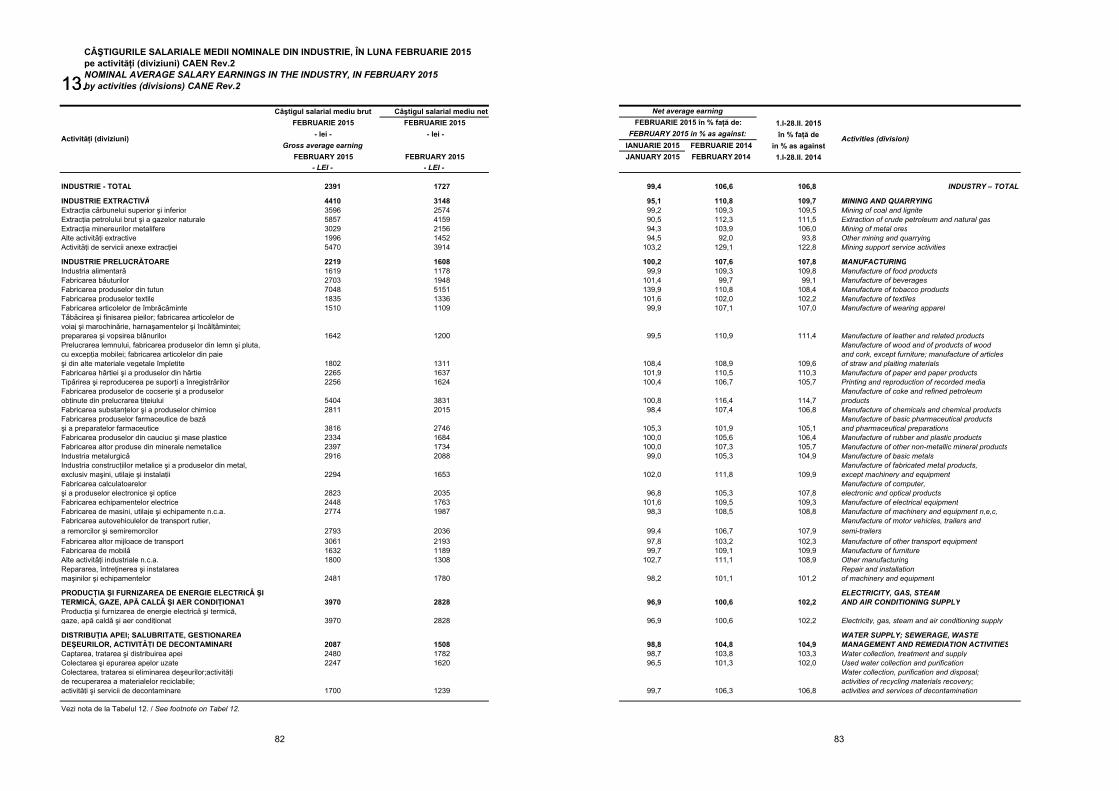
Câştigul salarial mediu brut Câştigul salarial mediu netFEBRUARIE 2015 FEBRUARIE 2015
- lei - - lei -Gross average earning
FEBRUARY 2015 FEBRUARY 2015- LEI - - LEI -
INDUSTRIE - TOTAL 2391 1727
INDUSTRIE EXTRACTIVĂ 4410 3148Extracţia cǎrbunelui superior şi inferior 3596 2574Extracţia petrolului brut şi a gazelor naturale 5857 4159Extracţia minereurilor metalifere 3029 2156Alte activitǎţi extractive 1996 1452Activitǎţi de servicii anexe extracţiei 5470 3914
INDUSTRIE PRELUCRĂTOARE 2219 1608Industria alimentarǎ 1619 1178Fabricarea bǎuturilor 2703 1948Fabricarea produselor din tutun 7048 5151Fabricarea produselor textile 1835 1336Fabricarea articolelor de îmbrǎcǎminte 1510 1109Tǎbǎcirea şi finisarea pieilor; fabricarea articolelor de voiaj şi marochinǎrie, harnaşamentelor şi încǎlţǎmintei; prepararea şi vopsirea blǎnurilor 1642 1200Prelucrarea lemnului, fabricarea produselor din lemn şi pluta, cu excepţia mobilei; fabricarea articolelor din paie şi din alte materiale vegetale împletite 1802 1311Fabricarea hârtiei şi a produselor din hârtie 2265 1637Tipǎrirea şi reproducerea pe suporţi a înregistrǎrilor 2256 1624Fabricarea produselor de cocserie şi a produselor obţinute din prelucrarea ţiţeiului 5404 3831Fabricarea substanţelor şi a produselor chimice 2811 2015Fabricarea produselor farmaceutice de bazǎ şi a preparatelor farmaceutice 3816 2746Fabricarea produselor din cauciuc şi mase plastice 2334 1684Fabricarea altor produse din minerale nemetalice 2397 1734Industria metalurgicǎ 2916 2088Industria construcţiilor metalice şi a produselor din metal, exclusiv maşini, utilaje şi instalaţii 2294 1653Fabricarea calculatoarelor şi a produselor electronice şi optice 2823 2035Fabricarea echipamentelor electrice 2448 1763Fabricarea de masini, utilaje şi echipamente n.c.a. 2774 1987Fabricarea autovehiculelor de transport rutier, a remorcilor şi semiremorcilor 2793 2036Fabricarea altor mijloace de transport 3061 2193Fabricarea de mobilǎ 1632 1189Alte activitǎţi industriale n.c.a. 1800 1308Repararea, întreţinerea şi instalarea maşinilor şi echipamentelor 2481 1780
PRODUCŢIA ŞI FURNIZAREA DE ENERGIE ELECTRICǍ ŞI TERMICĂ, GAZE, APĂ CALDǍ ŞI AER CONDIŢIONAT 3970 2828Producţia şi furnizarea de energie electricǎ şi termică, gaze, apă caldǎ şi aer condiţionat 3970 2828
DISTRIBUŢIA APEI; SALUBRITATE, GESTIONAREADEŞEURILOR, ACTIVITĂŢI DE DECONTAMINARE 2087 1508Captarea, tratarea şi distribuirea apei 2480 1782Colectarea şi epurarea apelor uzate 2247 1620Colectarea, tratarea si eliminarea deşeurilor;activităţi de recuperarea a materialelor reciclabile; activităţi şi servicii de decontaminare 1700 1239
Vezi nota de la Tabelul 12. / See footnote on Tabel 12.
CÂŞTIGURILE SALARIALE MEDII NOMINALE DIN INDUSTRIE, ÎN LUNA FEBRUARIE 2015pe activităţi (diviziuni) CAEN Rev.2NOMINAL AVERAGE SALARY EARNINGS IN THE INDUSTRY, IN FEBRUARY 2015by activities (divisions) CANE Rev.2
Activităţi (diviziuni)
13.13.
82
1.I-28.II. 2015în % faţă de
IANUARIE 2015 FEBRUARIE 2014 in % as againstJANUARY 2015 FEBRUARY 2014 1.I-28.II. 2014
99,4 106,6 106,8 INDUSTRY – TOTAL
95,1 110,8 109,7 MINING AND QUARRYING99,2 109,3 109,5 Mining of coal and lignite90,5 112,3 111,5 Extraction of crude petroleum and natural gas94,3 103,9 106,0 Mining of metal ores94,5 92,0 93,8 Other mining and quarrying
103,2 129,1 122,8 Mining support service activities
100,2 107,6 107,8 MANUFACTURING99,9 109,3 109,8 Manufacture of food products
101,4 99,7 99,1 Manufacture of beverages139,9 110,8 108,4 Manufacture of tobacco products101,6 102,0 102,2 Manufacture of textiles99,9 107,1 107,0 Manufacture of wearing apparel
99,5 110,9 111,4 Manufacture of leather and related productsManufacture of wood and of products of wood and cork, except furniture; manufacture of articles
108,4 108,9 109,6 of straw and plaiting materials101,9 110,5 110,3 Manufacture of paper and paper products100,4 106,7 105,7 Printing and reproduction of recorded media
Manufacture of coke and refined petroleum 100,8 116,4 114,7 products98,4 107,4 106,8 Manufacture of chemicals and chemical products
Manufacture of basic pharmaceutical products 105,3 101,9 105,1 and pharmaceutical preparations100,0 105,6 106,4 Manufacture of rubber and plastic products100,0 107,3 105,7 Manufacture of other non-metallic mineral products99,0 105,3 104,9 Manufacture of basic metals
Manufacture of fabricated metal products, 102,0 111,8 109,9 except machinery and equipment
Manufacture of computer, 96,8 105,3 107,8 electronic and optical products
101,6 109,5 109,3 Manufacture of electrical equipment98,3 108,5 108,8 Manufacture of machinery and equipment n,e,c,
Manufacture of motor vehicles, trailers and99,4 106,7 107,9 semi-trailers97,8 103,2 102,3 Manufacture of other transport equipment99,7 109,1 109,9 Manufacture of furniture
102,7 111,1 108,9 Other manufacturingRepair and installation
98,2 101,1 101,2 of machinery and equipment
ELECTRICITY, GAS, STEAM96,9 100,6 102,2 AND AIR CONDITIONING SUPPLY
96,9 100,6 102,2 Electricity, gas, steam and air conditioning supply
WATER SUPPLY; SEWERAGE, WASTE 98,8 104,8 104,9 MANAGEMENT AND REMEDIATION ACTIVITIES98,7 103,8 103,3 Water collection, treatment and supply96,5 101,3 102,0 Used water collection and purification
Water collection, purification and disposal; activities of recycling materials recovery;
99,7 106,3 106,8 activities and services of decontamination
Activities (division)
Net average earningFEBRUARIE 2015 în % faţă de:
FEBRUARY 2015 in % as against:
83
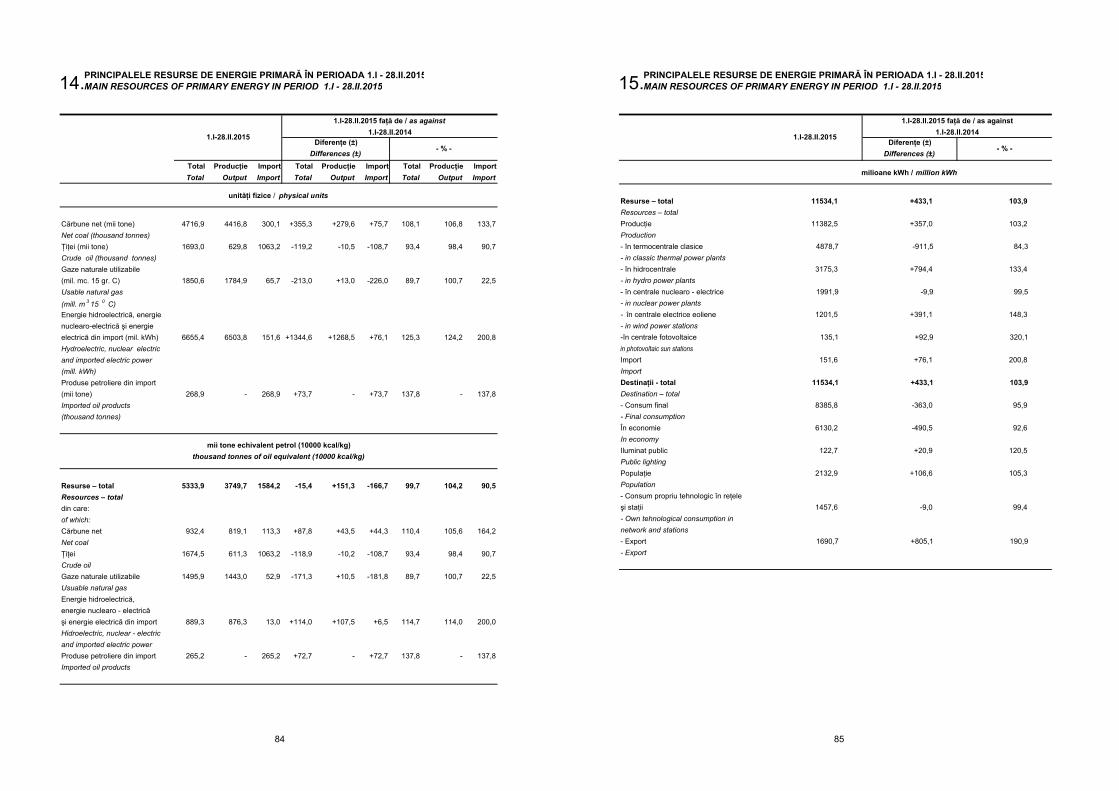
PRINCIPALELE RESURSE DE ENERGIE PRIMARĂ ÎN PERIOADA 1.I - 28.II.2015MAIN RESOURCES OF PRIMARY ENERGY IN PERIOD 1.I - 28.II.2015
Total Producţie Import Total Producţie Import Total Producţie ImportTotal Output Import Total Output Import Total Output Import
Cărbune net (mii tone) 4716,9 4416,8 300,1 +355,3 +279,6 +75,7 108,1 106,8 133,7Net coal (thousand tonnes)Ţiţei (mii tone) 1693,0 629,8 1063,2 -119,2 -10,5 -108,7 93,4 98,4 90,7Crude oil (thousand tonnes)Gaze naturale utilizabile (mil. mc. 15 gr. C) 1850,6 1784,9 65,7 -213,0 +13,0 -226,0 89,7 100,7 22,5Usable natural gas (mill. m 3 15 0 C)Energie hidroelectrică, energienuclearo-electrică şi energieelectrică din import (mil. kWh) 6655,4 6503,8 151,6 +1344,6 +1268,5 +76,1 125,3 124,2 200,8Hydroelectric, nuclear electricand imported electric power(mill. kWh)Produse petroliere din import(mii tone) 268,9 - 268,9 +73,7 - +73,7 137,8 - 137,8Imported oil products(thousand tonnes)
Resurse – total 5333,9 3749,7 1584,2 -15,4 +151,3 -166,7 99,7 104,2 90,5Resources – totaldin care:of which:Cărbune net 932,4 819,1 113,3 +87,8 +43,5 +44,3 110,4 105,6 164,2Net coalŢiţei 1674,5 611,3 1063,2 -118,9 -10,2 -108,7 93,4 98,4 90,7Crude oilGaze naturale utilizabile 1495,9 1443,0 52,9 -171,3 +10,5 -181,8 89,7 100,7 22,5Usuable natural gasEnergie hidroelectrică,energie nuclearo - electricăşi energie electrică din import 889,3 876,3 13,0 +114,0 +107,5 +6,5 114,7 114,0 200,0Hidroelectric, nuclear - electric and imported electric powerProduse petroliere din import 265,2 - 265,2 +72,7 - +72,7 137,8 - 137,8Imported oil products
mii tone echivalent petrol (10000 kcal/kg)thousand tonnes of oil equivalent (10000 kcal/kg)
unităţi fizice / physical units
Diferenţe (±) Differences (±)
1.I-28.II.2015
1.I-28.II.2015 faţă de / as against 1.I-28.II.2014
- % -
14.
84
PRINCIPALELE RESURSE DE ENERGIE PRIMARĂ ÎN PERIOADA 1.I - 28.II.2015MAIN RESOURCES OF PRIMARY ENERGY IN PERIOD 1.I - 28.II.2015
Diferenţe (±) Differences (±)
Resurse – total 11534,1 +433,1 103,9Resources – totalProducţie 11382,5 +357,0 103,2Production- în termocentrale clasice 4878,7 -911,5 84,3- in classic thermal power plants- în hidrocentrale 3175,3 +794,4 133,4- in hydro power plants- în centrale nuclearo - electrice 1991,9 -9,9 99,5- in nuclear power plants- în centrale electrice eoliene 1201,5 +391,1 148,3- in wind power stations-în centrale fotovoltaice 135,1 +92,9 320,1in photovoltaic sun stations
Import 151,6 +76,1 200,8ImportDestinaţii - total 11534,1 +433,1 103,9Destination – total- Consum final 8385,8 -363,0 95,9- Final consumptionÎn economie 6130,2 -490,5 92,6In economyIluminat public 122,7 +20,9 120,5Public lightingPopulaţie 2132,9 +106,6 105,3Population- Consum propriu tehnologic în reţeleşi staţii 1457,6 -9,0 99,4- Own tehnological consumption innetwork and stations- Export 1690,7 +805,1 190,9- Export
milioane kWh / million kWh
1.I-28.II.2015
1.I-28.II.2015 faţă de / as against 1.I-28.II.2014
- % -
15.
85
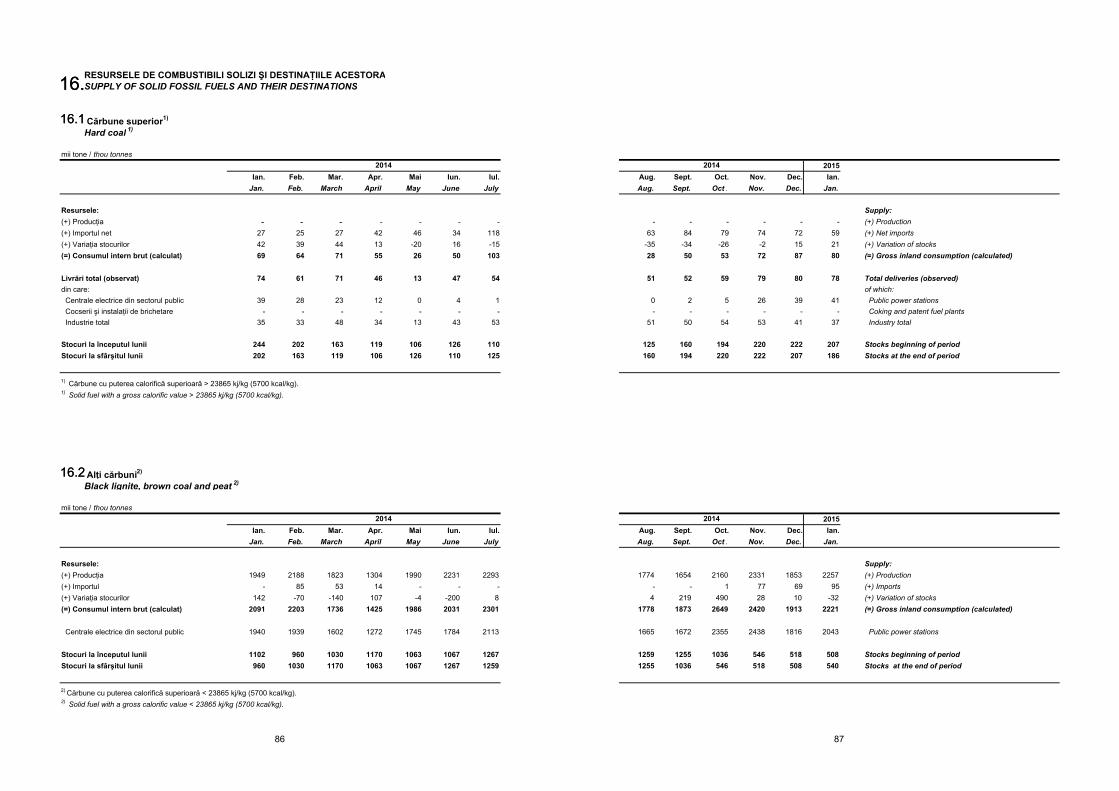
RESURSELE DE COMBUSTIBILI SOLIZI ŞI DESTINAŢIILE ACESTORASUPPLY OF SOLID FOSSIL FUELS AND THEIR DESTINATIONS
Cărbune superior1)
Hard coal 1)
mii tone / thou tonnes
Ian. Feb. Mar. Apr. Mai Iun. Iul.Jan. Feb. March April May June July
Resursele:(+) Producţia - - - - - - -(+) Importul net 27 25 27 42 46 34 118(+) Variaţia stocurilor 42 39 44 13 -20 16 -15(=) Consumul intern brut (calculat) 69 64 71 55 26 50 103
Livrări total (observat) 74 61 71 46 13 47 54din care: Centrale electrice din sectorul public 39 28 23 12 0 4 1 Cocserii şi instalaţii de brichetare - - - - - - - Industrie total 35 33 48 34 13 43 53
Stocuri la începutul lunii 244 202 163 119 106 126 110Stocuri la sfârşitul lunii 202 163 119 106 126 110 125
1) Cărbune cu puterea calorifică superioară > 23865 kj/kg (5700 kcal/kg).1) Solid fuel with a gross calorific value > 23865 kj/kg (5700 kcal/kg).
Alţi cărbuni2)
Black lignite, brown coal and peat 2)
mii tone / thou tonnes
Ian. Feb. Mar. Apr. Mai Iun. Iul.Jan. Feb. March April May June July
Resursele:(+) Producţia 1949 2188 1823 1304 1990 2231 2293(+) Importul - 85 53 14 - - -(+) Variaţia stocurilor 142 -70 -140 107 -4 -200 8(=) Consumul intern brut (calculat) 2091 2203 1736 1425 1986 2031 2301
Centrale electrice din sectorul public 1940 1939 1602 1272 1745 1784 2113
Stocuri la începutul lunii 1102 960 1030 1170 1063 1067 1267Stocuri la sfârşitul lunii 960 1030 1170 1063 1067 1267 1259
2) Cărbune cu puterea calorifică superioară < 23865 kj/kg (5700 kcal/kg).2) Solid fuel with a gross calorific value < 23865 kj/kg (5700 kcal/kg).
2014
2014
16.
16.1
16.2
16.
16.1
16.2
86
2015Aug. Sept. Oct. Nov. Dec. Ian.Aug. Sept. Oct . Nov. Dec. Jan.
Supply:- - - - - - (+) Production
63 84 79 74 72 59 (+) Net imports-35 -34 -26 -2 15 21 (+) Variation of stocks28 50 53 72 87 80 (=) Gross inland consumption (calculated)
51 52 59 79 80 78 Total deliveries (observed)of which:
0 2 5 26 39 41 Public power stations- - - - - - Coking and patent fuel plants
51 50 54 53 41 37 Industry total
125 160 194 220 222 207 Stocks beginning of period160 194 220 222 207 186 Stocks at the end of period
2015Aug. Sept. Oct. Nov. Dec. Ian.Aug. Sept. Oct . Nov. Dec. Jan.
Supply:1774 1654 2160 2331 1853 2257 (+) Production
- - 1 77 69 95 (+) Imports4 219 490 28 10 -32 (+) Variation of stocks
1778 1873 2649 2420 1913 2221 (=) Gross inland consumption (calculated)
1665 1672 2355 2438 1816 2043 Public power stations
1259 1255 1036 546 518 508 Stocks beginning of period1255 1036 546 518 508 540 Stocks at the end of period
2014
2014
87
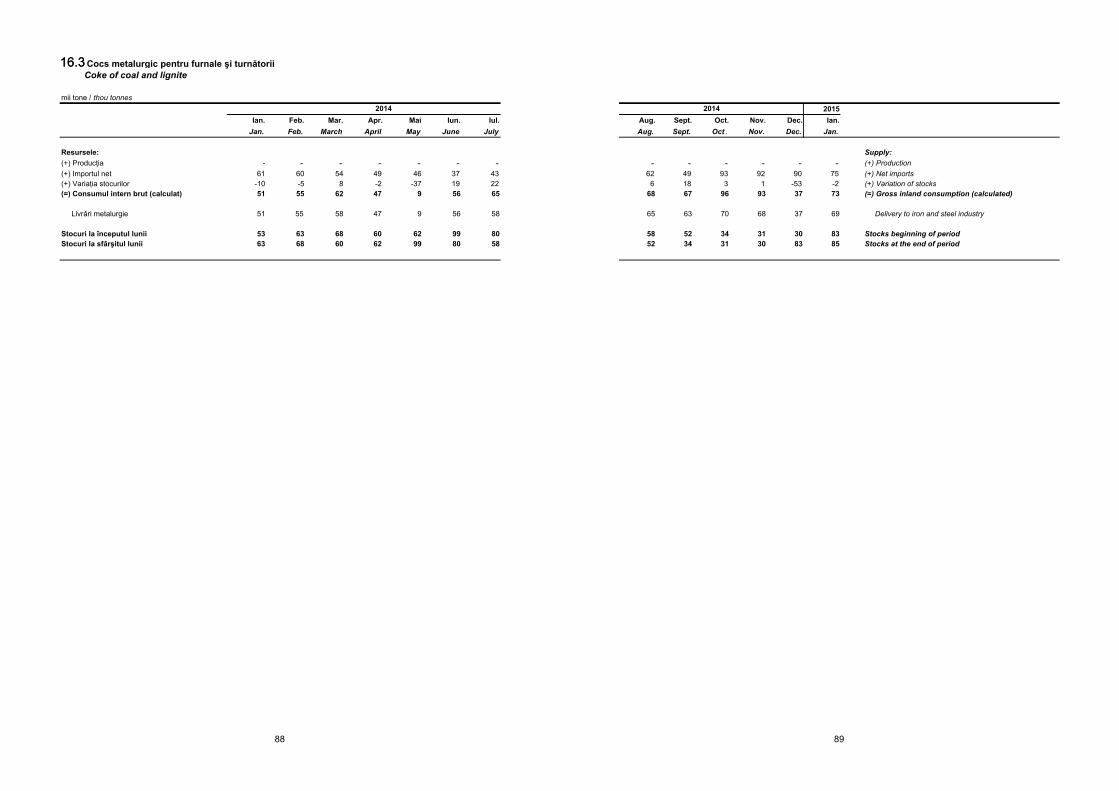
Cocs metalurgic pentru furnale şi turnătoriiCoke of coal and lignite
mii tone / thou tonnes
Ian. Feb. Mar. Apr. Mai Iun. Iul.Jan. Feb. March April May June July
Resursele:(+) Producţia - - - - - - -(+) Importul net 61 60 54 49 46 37 43(+) Variaţia stocurilor -10 -5 8 -2 -37 19 22(=) Consumul intern brut (calculat) 51 55 62 47 9 56 65
Livrǎri metalurgie 51 55 58 47 9 56 58
Stocuri la începutul lunii 53 63 68 60 62 99 80Stocuri la sfârşitul lunii 63 68 60 62 99 80 58
2014
16.316.3
88
2015Aug. Sept. Oct. Nov. Dec. Ian.Aug. Sept. Oct . Nov. Dec. Jan.
Supply:- - - - - - (+) Production
62 49 93 92 90 75 (+) Net imports6 18 3 1 -53 -2 (+) Variation of stocks
68 67 96 93 37 73 (=) Gross inland consumption (calculated)
65 63 70 68 37 69 Delivery to iron and steel industry
58 52 34 31 30 83 Stocks beginning of period52 34 31 30 83 85 Stocks at the end of period
2014
89
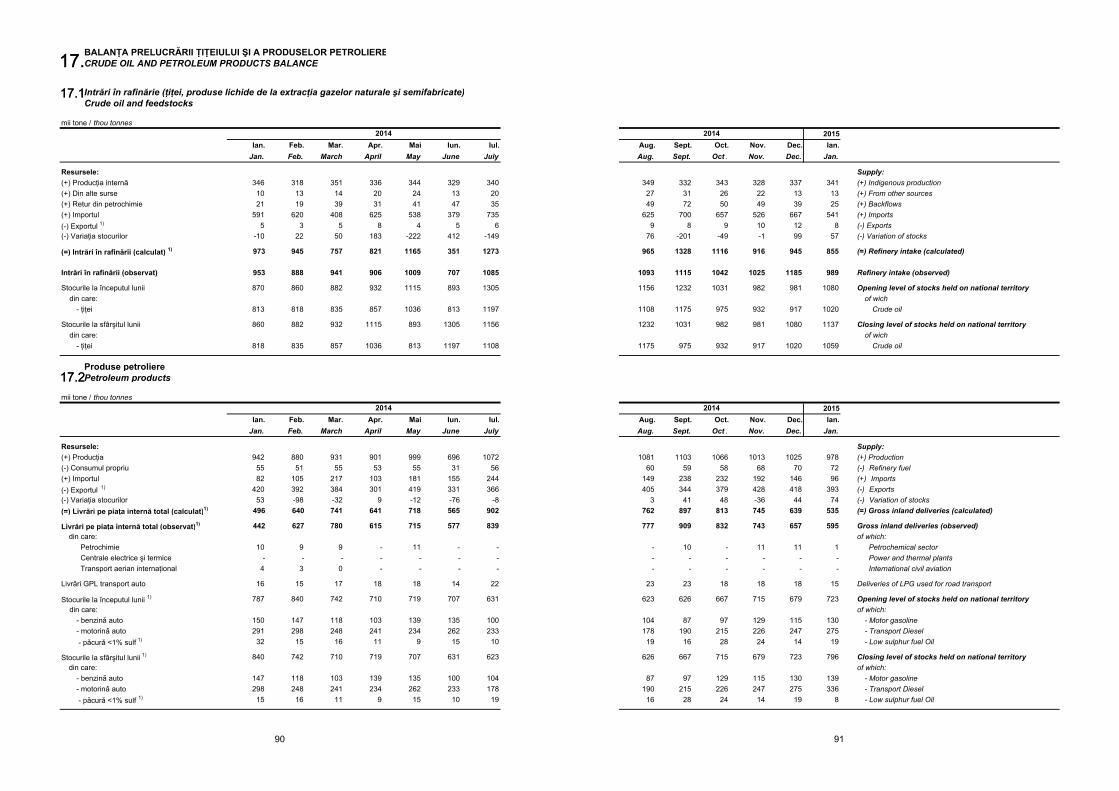
BALANŢA PRELUCRĂRII ŢIŢEIULUI ŞI A PRODUSELOR PETROLIERECRUDE OIL AND PETROLEUM PRODUCTS BALANCE
Intrări în rafinărie (ţiţei, produse lichide de la extracţia gazelor naturale şi semifabricate)Crude oil and feedstocks
mii tone / thou tonnes
Ian. Feb. Mar. Apr. Mai Iun. Iul.Jan. Feb. March April May June July
Resursele:(+) Producţia internă 346 318 351 336 344 329 340(+) Din alte surse 10 13 14 20 24 13 20(+) Retur din petrochimie 21 19 39 31 41 47 35(+) Importul 591 620 408 625 538 379 735(-) Exportul 1) 5 3 5 8 4 5 6(-) Variaţia stocurilor -10 22 50 183 -222 412 -149
(=) Intrări în rafinării (calculat) 1) 973 945 757 821 1165 351 1273
Intrări în rafinării (observat) 953 888 941 906 1009 707 1085
Stocurile la începutul lunii 870 860 882 932 1115 893 1305 din care:
- ţiţei 813 818 835 857 1036 813 1197
Stocurile la sfârşitul lunii 860 882 932 1115 893 1305 1156 din care:
- ţiţei 818 835 857 1036 813 1197 1108
Produse petrolierePetroleum products
mii tone / thou tonnes
Ian. Feb. Mar. Apr. Mai Iun. Iul.Jan. Feb. March April May June July
Resursele:(+) Producţia 942 880 931 901 999 696 1072(-) Consumul propriu 55 51 55 53 55 31 56(+) Importul 82 105 217 103 181 155 244(-) Exportul 1) 420 392 384 301 419 331 366(-) Variaţia stocurilor 53 -98 -32 9 -12 -76 -8(=) Livrări pe piaţa internă total (calculat)1) 496 640 741 641 718 565 902
Livrări pe piaţa internă total (observat)1) 442 627 780 615 715 577 839din care:
Petrochimie 10 9 9 - 11 - - Centrale electrice şi termice - - - - - - - Transport aerian internaţional 4 3 0 - - - -
Livrǎri GPL transport auto 16 15 17 18 18 14 22
Stocurile la începutul lunii 1) 787 840 742 710 719 707 631 din care:
- benzinǎ auto 150 147 118 103 139 135 100- motorinǎ auto 291 298 248 241 234 262 233 - pǎcurǎ <1% sulf 1) 32 15 16 11 9 15 10
Stocurile la sfârşitul lunii 1) 840 742 710 719 707 631 623din care:
- benzinǎ auto 147 118 103 139 135 100 104- motorinǎ auto 298 248 241 234 262 233 178 - pǎcurǎ <1% sulf 1) 15 16 11 9 15 10 19
2014
2014
17.17.1
17.2
17.17.1
17.2
90
2015Aug. Sept. Oct. Nov. Dec. Ian.Aug. Sept. Oct . Nov. Dec. Jan.
Supply:349 332 343 328 337 341 (+) Indigenous production27 31 26 22 13 13 (+) From other sources49 72 50 49 39 25 (+) Backflows
625 700 657 526 667 541 (+) Imports9 8 9 10 12 8 (-) Exports
76 -201 -49 -1 99 57 (-) Variation of stocks
965 1328 1116 916 945 855 (=) Refinery intake (calculated)
1093 1115 1042 1025 1185 989 Refinery intake (observed)
1156 1232 1031 982 981 1080 Opening level of stocks held on national territoryof wich
1108 1175 975 932 917 1020 Crude oil
1232 1031 982 981 1080 1137 Closing level of stocks held on national territoryof wich
1175 975 932 917 1020 1059 Crude oil
2015Aug. Sept. Oct. Nov. Dec. Ian.Aug. Sept. Oct . Nov. Dec. Jan.
Supply:1081 1103 1066 1013 1025 978 (+) Production
60 59 58 68 70 72 (-) Refinery fuel149 238 232 192 146 96 (+) Imports405 344 379 428 418 393 (-) Exports
3 41 48 -36 44 74 (-) Variation of stocks762 897 813 745 639 535 (=) Gross inland deliveries (calculated)
777 909 832 743 657 595 Gross inland deliveries (observed)of which:
- 10 - 11 11 1 Petrochemical sector- - - - - - Power and thermal plants- - - - - - International civil aviation
23 23 18 18 18 15 Deliveries of LPG used for road transport
623 626 667 715 679 723 Opening level of stocks held on national territoryof which:
104 87 97 129 115 130 - Motor gasoline178 190 215 226 247 275 - Transport Diesel19 16 28 24 14 19 - Low sulphur fuel Oil
626 667 715 679 723 796 Closing level of stocks held on national territoryof which:
87 97 129 115 130 139 - Motor gasoline190 215 226 247 275 336 - Transport Diesel16 28 24 14 19 8 - Low sulphur fuel Oil
2014
2014
91
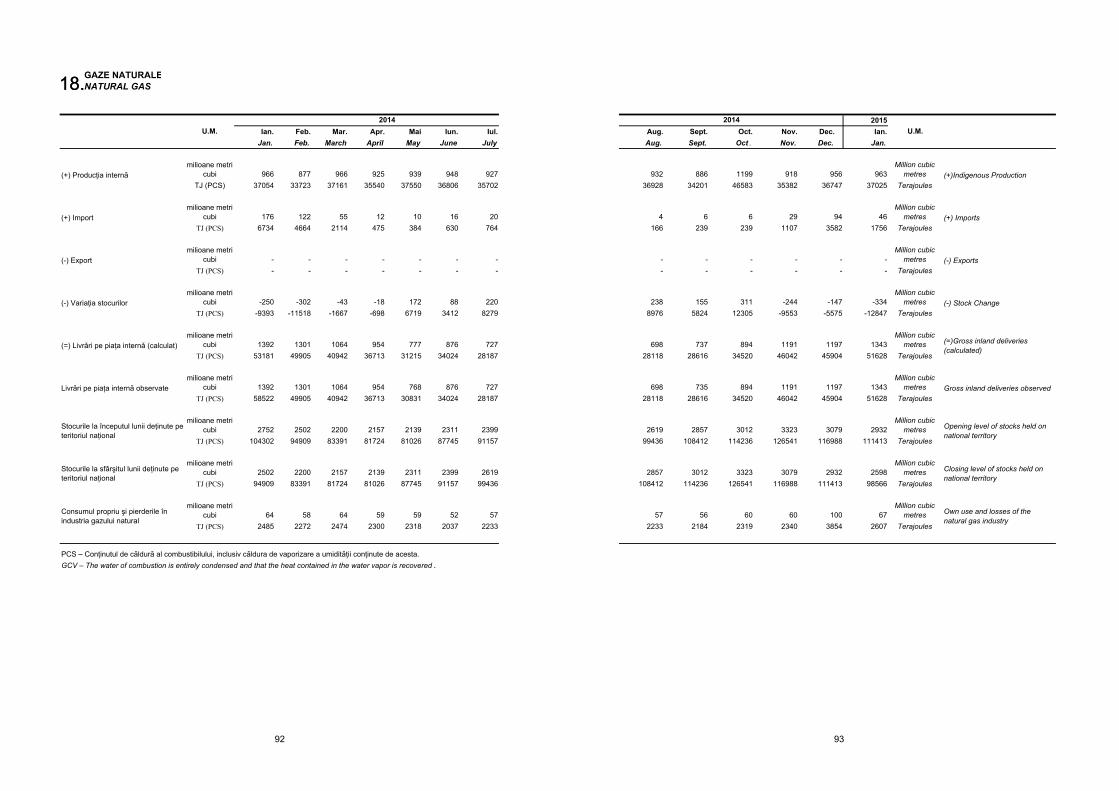
GAZE NATURALENATURAL GAS
Ian. Feb. Mar. Apr. Mai Iun. Iul.Jan. Feb. March April May June July
milioane metri cubi 966 877 966 925 939 948 927
TJ (PCS) 37054 33723 37161 35540 37550 36806 35702
milioane metri cubi 176 122 55 12 10 16 20
TJ (PCS) 6734 4664 2114 475 384 630 764
milioane metri cubi - - - - - - -
TJ (PCS) - - - - - - -
milioane metri cubi -250 -302 -43 -18 172 88 220
TJ (PCS) -9393 -11518 -1667 -698 6719 3412 8279
milioane metri cubi 1392 1301 1064 954 777 876 727
TJ (PCS) 53181 49905 40942 36713 31215 34024 28187
milioane metri cubi 1392 1301 1064 954 768 876 727
TJ (PCS) 58522 49905 40942 36713 30831 34024 28187
milioane metri cubi 2752 2502 2200 2157 2139 2311 2399
TJ (PCS) 104302 94909 83391 81724 81026 87745 91157
milioane metri cubi 2502 2200 2157 2139 2311 2399 2619
TJ (PCS) 94909 83391 81724 81026 87745 91157 99436
milioane metri cubi 64 58 64 59 59 52 57
TJ (PCS) 2485 2272 2474 2300 2318 2037 2233
PCS – Conţinutul de cǎldurǎ al combustibilului, inclusiv cǎldura de vaporizare a umiditǎţii conţinute de acesta.
Stocurile la sfârşitul lunii deţinute pe teritoriul naţional
GCV – The water of combustion is entirely condensed and that the heat contained in the water vapor is recovered .
(+) Import
Livrǎri pe piaţa internǎ observate
Stocurile la începutul lunii deţinute pe teritoriul naţional
Consumul propriu şi pierderile în industria gazului natural
U.M.
(-) Export
(-) Variaţia stocurilor
(=) Livrǎri pe piaţa internǎ (calculat)
(+) Producţia internǎ
2014
18.18.
92
2015Aug. Sept. Oct. Nov. Dec. Ian.Aug. Sept. Oct . Nov. Dec. Jan.
932 886 1199 918 956 963Million cubic
metres36928 34201 46583 35382 36747 37025 Terajoules
4 6 6 29 94 46Million cubic
metres166 239 239 1107 3582 1756 Terajoules
- - - - - -Million cubic
metres- - - - - - Terajoules
238 155 311 -244 -147 -334Million cubic
metres8976 5824 12305 -9553 -5575 -12847 Terajoules
698 737 894 1191 1197 1343Million cubic
metres28118 28616 34520 46042 45904 51628 Terajoules
698 735 894 1191 1197 1343Million cubic
metres28118 28616 34520 46042 45904 51628 Terajoules
2619 2857 3012 3323 3079 2932Million cubic
metres99436 108412 114236 126541 116988 111413 Terajoules
2857 3012 3323 3079 2932 2598Million cubic
metres108412 114236 126541 116988 111413 98566 Terajoules
57 56 60 60 100 67Million cubic
metres2233 2184 2319 2340 3854 2607 Terajoules
Own use and losses of the natural gas industry
U.M.
Opening level of stocks held on national territory
Closing level of stocks held on national territory
(+)Indigenous Production
(+) Imports
(-) Exports
(=)Gross inland deliveries (calculated)
Gross inland deliveries observed
(-) Stock Change
2014
93
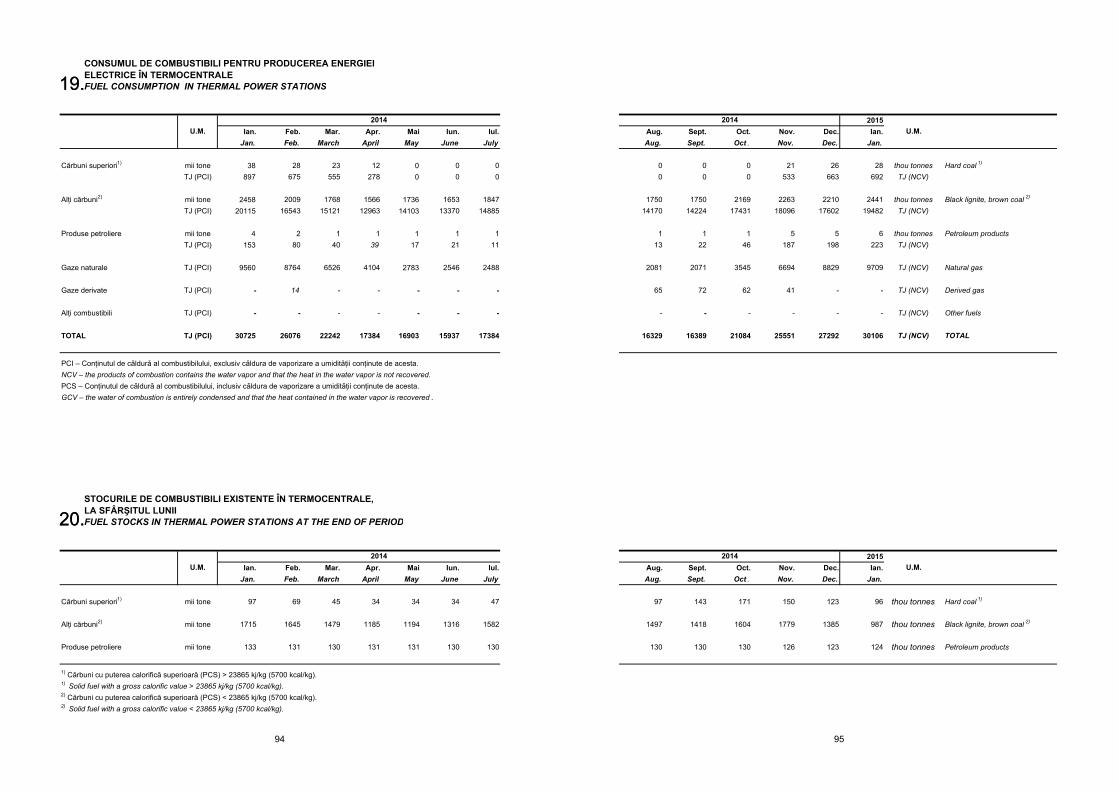
CONSUMUL DE COMBUSTIBILI PENTRU PRODUCEREA ENERGIEI ELECTRICE ÎN TERMOCENTRALEFUEL CONSUMPTION IN THERMAL POWER STATIONS
Ian. Feb. Mar. Apr. Mai Iun. Iul.Jan. Feb. March April May June July
Cărbuni superiori1) mii tone 38 28 23 12 0 0 0TJ (PCI) 897 675 555 278 0 0 0
Alţi cărbuni2) mii tone 2458 2009 1768 1566 1736 1653 1847TJ (PCI) 20115 16543 15121 12963 14103 13370 14885
Produse petroliere mii tone 4 2 1 1 1 1 1TJ (PCI) 153 80 40 39 17 21 11
Gaze naturale TJ (PCI) 9560 8764 6526 4104 2783 2546 2488
Gaze derivate TJ (PCI) - 14 - - - - -
Alţi combustibili TJ (PCI) - - - - - - -
TOTAL TJ (PCI) 30725 26076 22242 17384 16903 15937 17384
STOCURILE DE COMBUSTIBILI EXISTENTE ÎN TERMOCENTRALE, LA SFÂRŞITUL LUNIIFUEL STOCKS IN THERMAL POWER STATIONS AT THE END OF PERIOD
Ian. Feb. Mar. Apr. Mai Iun. Iul.Jan. Feb. March April May June July
Cărbuni superiori1) mii tone 97 69 45 34 34 34 47
Alţi cărbuni2) mii tone 1715 1645 1479 1185 1194 1316 1582
Produse petroliere mii tone 133 131 130 131 131 130 130
2014
GCV – the water of combustion is entirely condensed and that the heat contained in the water vapor is recovered .
U.M.
NCV – the products of combustion contains the water vapor and that the heat in the water vapor is not recovered.PCS – Conţinutul de cǎldurǎ al combustibilului, inclusiv cǎldura de vaporizare a umiditǎţii conţinute de acesta.
PCI – Conţinutul de cǎldurǎ al combustibilului, exclusiv cǎldura de vaporizare a umiditǎţii conţinute de acesta.
2) Solid fuel with a gross calorific value < 23865 kj/kg (5700 kcal/kg).
U.M.
1) Cărbuni cu puterea calorifică superioară (PCS) > 23865 kj/kg (5700 kcal/kg).1) Solid fuel with a gross calorific value > 23865 kj/kg (5700 kcal/kg).2) Cărbuni cu puterea calorifică superioară (PCS) < 23865 kj/kg (5700 kcal/kg).
2014
19.
20.
19.
20.
94
2015Aug. Sept. Oct. Nov. Dec. Ian.Aug. Sept. Oct . Nov. Dec. Jan.
0 0 0 21 26 28 thou tonnes Hard coal 1)
0 0 0 533 663 692 TJ (NCV)
1750 1750 2169 2263 2210 2441 thou tonnes Black lignite, brown coal 2)
14170 14224 17431 18096 17602 19482 TJ (NCV)
1 1 1 5 5 6 thou tonnes Petroleum products13 22 46 187 198 223 TJ (NCV)
2081 2071 3545 6694 8829 9709 TJ (NCV) Natural gas
65 72 62 41 - - TJ (NCV) Derived gas
- - - - - - TJ (NCV) Other fuels
16329 16389 21084 25551 27292 30106 TJ (NCV) TOTAL
2015Aug. Sept. Oct. Nov. Dec. Ian.Aug. Sept. Oct . Nov. Dec. Jan.
97 143 171 150 123 96 thou tonnes Hard coal 1)
1497 1418 1604 1779 1385 987 thou tonnes Black lignite, brown coal 2)
130 130 130 126 123 124 thou tonnes Petroleum products
2014
2014
U.M.
U.M.
95
96
NOTA METODOLOGICĂ Industrie Indicele producţiei industriale (IPI)
este un indice de volum şi măsoară evoluţia rezultatelor activităţilor cu caracter industrial dintr-o perioadă faţă de alta.
Indicele producţiei industriale este de tip Laspeyres, iar utilizarea lui sub această formă necesită revizuirea periodică a sistemului de ponderare şi asigurarea reprezentativităţii seriilor de produse selectate.
În conformitate cu prevedirile Regulamentului CE nr. 1165/1998 amendat cu Regulamentul Parlamentului European nr. 1158/2005 cu privire la statisticile pe termen scurt, în calculul indicelui producţiei industriale, se cuprind diviziunile CAEN Rev. 2: 05÷35, exclusiv grupa 353.
Indicii producţiei industriale măsoară evoluţia acesteia pe total, secţiuni (industria extractivă, prelucrătoare şi producţia şi furnizarea de energie electrică şi termică, gaze, apă caldă şi aer condiţionat), diviziuni CAEN Rev. 2 precum şi pe marile grupe industriale. Gradul de acoperire pe total industrie este de 89,8%.
Pentru calculul indicilor producţiei industriale se utilizează un eşantion de produse reprezentative grupate în 777 subclase elementare CPSA 2008, pentru care se înregistrează date cantitative privind producţia realizată.
Nomenclatoarele utilizate la
calculul indicelui producţiei industriale sunt:
• Clasificarea Activităţilor Economiei Naţionale (CAEN Rev. 2)
• Clasificarea produselor şi serviciilor asociate activităţilor (CPSA 2008).
• Marile grupe industriale (industria bunurilor intermediare, industria bunurilor de capital, industria bunurilor de folosinţă
METHODOLOGICAL NOTE Industry
The industrial production index
(IPI), is a volume index and measures the evolution of industrial activities results from one period as against another one.
The industrial production index is of
Laspeyres type and its use under this form needs periodical revision of the weighting system and ensuring of the representativeness for the selected products series.
According to the provisions of EC Regulation no.1165/1998 amended by the Regulation of European Parliament no. 1158/2005 regarding the short term statistics, the calculation of industrial production index includes CANE Rev.2: 05-35 divisions, excluding 353 group.
The industrial production indices
measure its evolution per total and by CANE Rev 2 sections (mining and quarrying, manufacturing and electricity, gas, steam and air conditioning production and supply) and divisions as well as by broad industrial groups. The coverage degree per total industry is 89.8%.
For the calculation of industrial production indices, it is used a sample of representative products grouped into 777 elementary subclasses CPSA 2008, for which quantitative data regarding the achieved production are registered.
The nomenclatures used to
calculate the industrial production index are:
• The Classification of Activities in the National Economy (CANE Rev. 2).
• The Classification of products and services associated to activities (CPSA 2008).
• Broad industrial groupings (intermediate goods, capital goods, consumer durables , consumer non-
97
îndelungată, industria bunurilor de uz curent, industria energetică) reprezintă un nomenclator agregat de diviziuni sau grupe CAEN Rev. 2 utilizat în statistica europeană pentru caracterizarea industriei după destinaţia bunurilor produse.
Industria bunurilor intermediare cuprinde următoarele diviziuni, respectiv grupe CAEN Rev. 2: 07, 08, 09, 106, 109, 131, 132, 133, 16, 17, 201, 202, 203, 205, 206, 22, 23, 24, 255, 256, 257, 259, 261, 268, 271, 272, 273, 274, 279.
Industria bunurilor de capital cuprinde următoarele diviziuni, respectiv grupe CAEN Rev. 2: 251, 252, 253, 254, 262, 263, 265, 266, 28, 29, 301, 302, 303, 304, 325, 33.
Industria bunurilor de folosinţă îndelungată cuprinde următoarele diviziuni, respectiv grupe CAEN Rev. 2: 264, 267, 275, 309, 31, 321, 322.
Industria bunurilor de uz curent cuprinde următoarele diviziuni, respectiv grupe CAEN Rev. 2: 101, 102, 103, 104, 105, 107, 108, 11, 12, 139, 14, 15, 18, 204, 21, 323, 324, 329.
Industria energetică cuprinde următoarele diviziuni, respectiv grupe CAEN Rev. 2: 05, 06, 19, 351, 352.
• PRODROM - Nomenclatorul de produse şi servicii industriale utilizat la colectarea datelor privind producţia industrială este total armonizat cu nomenclatorul utilizat în ţările U.E., respectiv Lista PRODCOM. Poziţiile din cadrul nomenclatorului PRODROM sunt rezultatul detalierii subclaselor elementare CPSA 2008. Toate poziţiile PRODROM sunt la acelaşi nivel de nominalizare, eventualele grupări solicitate pentru cerinţele de analiză şi diseminare, obţinându-se prin prelucrare, pe baza criteriilor de structurare utilizate pentru definirea fiecărei poziţii.
Nomenclatorul de produse industriale
(PRODROM) cuprinde circa 3397 produse şi caracterizează activităţile
durables, energy) represent an aggregated nomenclature of CANE Rev. 2 divisions or groups used in the European statistics for industry characterization by destination of produced goods.
Intermediate goods includes the
following CANE Rev. 2 divisions, respectively groups: 07, 08, 09, 106, 109, 131, 132, 133, 16, 17, 201, 202, 203, 205, 206, 22, 23, 24, 255, 256, 257, 259, 261, 268, 271, 272, 273, 274, 279.
Capital goods includes the following CANE Rev. 2 divisions, respectively groups: 251, 252, 253, 254, 262, 263, 265, 266, 28, 29, 301, 302, 303, 304, 325, 33.
Consumer durables includes the following CANE Rev. 2 divisions, respectively groups: 264, 267, 275, 309, 31, 321, 322.
Consumer non-durables includes the following CANE Rev. 2 divisions, respectively groups: 101, 102, 103, 104, 105, 107, 108, 11, 12, 139, 14, 15, 18, 204, 21, 323, 324, 329.
Energy includes the following CANE Rev.2 divisions, respectively groups: 05, 06, 19, 351, 352.
• PRODROM - The Nomenclature of Industrial Products and Services used for the collection of data regarding the industrial production is fully harmonised with the nomenclature used in European Union countries, respectively the PRODCOM List. The positions from PRODROM nomenclature are the result of CPSA 2008 detailing elementary subclasses. All PRODROM headings are at the same level of nominalization, possible groups required for analysis and dissemination being obtained by processing, based on the structuring criteria used to define each heading.
The Nomenclature of Industrial
Products (PRODROM) includes about 3397 products and characterizes the

98
industriale din secţiunile CAEN Rev. 2: B, C şi D.
• Nivelul de subclasă elementară CPSA reprezintă primul nivel de calcul al IPI. Cele cca 3397 produse PRODROM se agregă în 1162 subclase elementare CPSA, din care 777 sunt luate în calculul IPI.
• Nomenclatorul operatorilor economici care furnizează lunar date privind producţia fizică industrială cuprinde un eşantion reprezentativ de întreprinderi cu activitate principală de industrie (CAEN Rev. 2: 05÷35) şi care este constituit din totalitatea întreprinderilor cu peste 50 de salariaţi şi dintr-un eşantion de întreprinderi cu număr de salariaţi cuprins între 4-49, astfel încât să se asigure un grad de reprezentativitate de cca 90% la nivel de total industrie şi minim 80% la nivel de diviziune CAEN Rev.2, reprezentativitate calculată pe baza cifrei de afaceri.
Pentru o mai bună reprezentare a industriei alimentare, datorită specificului acesteia, în eşantionul de întreprinderi industriale sunt incluse şi societăţile comerciale cu activitate principală de agricultură, dar care au subunităţi specializate în fabricarea produselor agroalimentare.
Construirea sistemului de ponderare şi algoritmul de calcul
Agregarea indicilor primari ai producţiei industriale se realizează printr-un sistem de ponderări succesive, utilizându-se pentru agregarea la nivel de subclasă elementară CPSA - nivel de agregare superior al PRODROM-ului, preţul mediu unitar din anul de bază (2010), iar pentru nivelurile de agregare superioare (clasă, grupă, diviziune, secţiune CAEN Rev. 2 sau mare grupă industrială) folosindu-se ca element de ponderare valoarea adăugată brută la costul factorilor calculată conform conturilor naţionale (VABCF) din anul de bază (2010).
Primul nivel de agregare este nivelul
industrial activities of the CANE Rev. 2: B, C and D sections.
• CSPA elementary subclass level represents the first IPI calculation level. The about 3397 PRODROM products are aggregated into 1162 CSPA elementary subclasses, of which 777 are taken into IPI calculation.
• The Nomenclature of economic operators, which provides monthly data about industrial physical production, includes a representative sample of enterprises having industry as their main activity (CANE Rev.2: 05÷35) and which includes all the enterprises having over 50 employees and a sample of enterprises having 4-49 employees, so that a representativeness of about 90% should be ensured at the level of total industry and minimum 80% at the level of CANE Rev. 2 division, this representativeness being calculated based on turnover.
For a better representation of food industry, due to its specific, the sample of industrial enterprises also includes commercial companies having agriculture as their main activity, but which have subunits specialised in the fabrication of agro-food products.
Building up the weighting system
and the calculation algorithm Primary indices of industrial
production are aggregated by a system of successive weightings, using for the aggregation at the level of CPSA elementary subclass – PRODROM, level of upper aggregation, the unit average price of the base year (2010), while for upper aggregation levels (CANE Rev. 2 class, group, division, section or broad industrial group), the gross value added at the cost of factors calculated according national to accounts (GVACF) of the base year (2010) is used as weighting element.
The first aggregation level is the level
99
clasei CAEN Rev. 2, următoarele niveluri de agregare fiind determinate ca o medie aritmetică ponderată a indicilor claselor, grupelor, diviziunilor, secţiunilor CAEN Rev. 2, marilor grupe industriale, cu VABCF corespunzătoare din anul de bază (2010).
Indicii pentru marile grupe industriale se obţin prin agregarea indicilor la nivelul grupelor CAEN Rev. 2 componente, ponderate cu VABCF corespunzător.
Indicii producţiei industriale pe total industrie se obţin prin agregarea indicilor calculaţi la nivel de diviziune CAEN Rev. 2.
Pe lângă indicii bruţi ai producţiei
industriale, se calculează lunar şi indici ajustaţi cu numărul de zile lucrătoare prin metoda regresivă, metodă recomandată de regulamentele europene referitoare la indicatorii pe termen scurt (Regulamentul Consiliului 1165/1998).
Pentru ajustarea seriilor (nivel,
diviziune, secţiune, total industrie - CAEN Rev. 2, mare grupă industrială) s-a folosit pachetul de programe DEMETRA (metoda TRAMO/SEATS), care realizează estimarea efectului numărului de zile lucrătoare diferit de la o lună la alta şi efectului calendarului (an bisect şi alte sărbători naţionale) precum şi identificarea şi corectarea valorilor extreme (schimbări de nivel ocazionale, tranzitorii sau permanente) şi interpolarea valorilor lipsă.
Seria ajustată cu numărul de zile lucrătoare s-a obţinut prin eliminarea din seria brută a acestor efecte, cu ajutorul unor coeficienţi de corecţie, stabiliţi în funcţie de modelul de regresie folosit (aditiv sau multiplicativ).
Stabilirea modelelor de regresie folosite pentru fiecare serie se face la începutul fiecărui an şi implică recalcularea seriilor ajustate calculate în anul precedent (recalculare datorată
of CANE Rev. 2 class, the next aggregation levels being determined as a weighted arithmetic mean of the CANE Rev. 2 classes, groups, divisions, sections, of broad industrial groups, with the corresponding GVACF of the base year (2010).
The indices for the broad industrial groupings are obtained by the aggregation of the CANE Rev. 2 component group indices, weighted with the corresponding GVACF.
The industrial production indices per total industry are obtained by the aggregation of indices calculated at the level of the CANE Rev. 2 division.
Besides gross indices of industrial
production, indices adjusted with working days number are also monthly calculated by means of the regressive method, which is recommended by European regulations regarding the short-term indicators (Council Regulation no. 1165/1998).
In order to adjust the series (level, division, section, total industry – CANE Rev. 2, broad industrial group) DEMETRA programs package (TRAMO/SEATS method) was used, estimating the effect of working days number, different from one month to another and the calendar effect (leap year and other national holidays)as well as for the identification and correction of outliers (occasional, transitional or permanent changes) and interpolation of missing values.
The series adjusted with working days number was obtained by eliminating from unadjusted series these effects, by means of correction coefficients, set up according to the regression model used (additive or multiplicative).
Regression models used for each series are set up at the beginning of each year, involving the recalculation of adjusted series calculated in the previous year (recalculation due to the change in
100
modificării modelelor adoptate, numărului de regresori folosit şi numărului de observaţii disponibile).
Ajustarea nivelurilor agregate s-a realizat prin metoda directă care presupune ajustarea directă a seriilor agregate. Utilizarea metodei directe poate conduce la unele inconsistenţe în seriile de date (respectiv, agregatele să nu fie cuprinse întotdeuna între valorile componentelor din care provin).
Indicii producţiei industriale sunt
provizorii şi se revizuiesc pe baza rectificărilor ce se efectuează retroactiv de către întreprinderile din eşantion, asupra datelor furnizate anterior de către acestea.
Indicele productivităţii muncii în
industrie Indicele productivităţii muncii în
industrie este indicatorul ce caracterizează eficienţa muncii depuse într-o anumită perioadă în cadrul activităţii industriale şi se calculează ca raport între indicele brut al producţiei industriale şi indicele numărului mediu de salariaţi din industrie.
Indicii productivităţii muncii în industrie sunt calculaţi pe total industrie, secţiuni (industria extractivă, prelucrătoare şi producţia şi furnizarea de energie electrică şi termică, gaze, apă caldă şi aer condiţionat), diviziuni CAEN Rev.2 precum şi pe marile grupe industriale.
Indicii lunari ai productivităţii muncii în industrie sunt provizorii şi se revizuiesc pe baza rectificărilor ce se efectuează retroactiv de către operatorii economici din eşantion.
Cifra de afaceri reprezintă veniturile
totale înregistrate de către întreprindere în perioada de referinţă, provenite atât din activitatea principală, cât şi din activităţile secundare exercitate de aceasta. Cifra de
the adopted models, number of regressors used and number of available observations).
The adjustment of the aggregated
levels was made through the direct method, which involves the direct adjustment of the aggregated series. The use of the direct method may lead to inconsistencies in the data series (namely, the aggregates are not always comprised between the values of the components they come from).
The industrial production indices are
provisional and are revised based on the corrections retroactively done by the enterprises in the sample, concerning the data previously provided.
Labour productivity index in
industry Labour productivity index in industry is
the indicator which characterizes the efficiency of work carried out during a certain period of time within the industrial activity and is calculated as ratio between the gross industrial production index and the index of average number of employees in industry.
Labour productivity indices in industry are calculated per total industry, by CANE Rev 2 sections (mining and quarrying, manufacturing and electricity, gas, steam and air conditioning production and supply) and divisions, as well as by broad industrial groups.
Monthly labour productivity indices in
industry are provisional and they are revised on the basis of retroactive corrections made by economic operators from the sample.
Turnover represents total income
registered by the enterprise in the reference period, coming both from its main activity and from secondary
101
afaceri nu include TVA şi veniturile din vânzarea sau transferul de mijloace fixe.
Nomenclatorul operatorilor economici
ce furnizează lunar date privind cifra de afaceri din industrie, cuprinde operatorii economici care au ca activitate principală industria (CAEN Rev.2 diviziunile: 05÷33).
activities. Turnover does not include VAT and income from sale or transfer of fixed assets.
The Nomenclature of economic
operator’s monthly providing data on industry turnover includes economic operators having industry as main activity (CANE Rev.2: 05÷33 divisions).
Cercetarea statistică este de tip
selectiv. Tipul de sondaj utilizat şi procedeul de extragere a eşantionului pentru această cercetare statistică este cel al sondajului stratificat simplu aleator, în care straturile sunt definite în funcţie de activitatea economică şi clasa de mărime în funcţie de numărul de salariaţi.
Datorită necesităţilor privind comparabilitatea rezultatelor pe grupe de activităţi omogene cât şi la nivel de întreprindere de la o perioadă la alta, categoria întreprinderilor cu potenţial economic ridicat, se cercetează exhaustiv (50 de salariaţi şi peste).
În conformitate cu prevederile Regulamentului CE nr. 1165/1998 amendat cu Regulamentul Parlamentului European nr. 1158/2005 cu privire la statisticile pe termen scurt, în calculul indicelui cifrei de afaceri, se cuprind diviziunile CAEN Rev.2: 05÷33.
Indicii valorici ai cifrei de afaceri sunt indici de tip Laspeyres şi măsoară evoluţia acesteia pe total, secţiuni, diviziuni CAEN Rev.2, precum şi pe marile grupe industriale.
Indicele cifrei de afaceri pe total (piaţa internă şi piaţa externă) se calculează ca medie ponderată dintre indicele cifrei de afaceri pe piaţa internă şi indicele cifrei de afaceri pe piaţa externă, pe fiecare nivel de agregare (diviziune, secţiune, mare grupă industrială şi total industrie). Anul de bază şi sistemul de ponderare sunt aferente anului 2010. Ponderile sunt calculate pe baza cifrei de afaceri, conform rezultatelor Anchetei Structurale în Întreprinderi din anul de bază (2010).
The statistical survey is selective. The survey type used and the method of taking over the sample for this statistical survey, is the random simple stratified survey, in which strata are defined according to economic activity and to size class, depending on the number of employees.
Due to the needs regarding the comparability of results by homogenous activity group and at enterprise level from one period to another, the category of enterprises with high economic potential (50 employees and over) is exhaustively surveyed.
According to the stipulations of EC Regulation no. 1165/1998 amended by the Regulation of European Parliament no.1158/2005 regarding the short term statistics, the calculation of turnover index includes CANE Rev. 2: 05÷33 divisions.
urnover value indices are indices of
Laspeyres type and measure its evolution per total, by CANE Rev.2 sections and divisions, as well as by broad industrial groups.
Turnover index per total (domestic and non-domestic market) is calculated as the weighed mean between the turnover index on domestic market and the turnover index on non-domestic market, by each aggregation level (division, section, broad industrial group and total industry). The base year and the weighting system are for the year 2010. The weights are calculated based on the turnover, according to the results of the Structural Business Survey in the base year (2010).
102
Marile grupe industriale (industria bunurilor intermediare, industria bunurilor de capital, industria bunurilor de folosinţă îndelungată, industria bunurilor de uz curent, industria energetică) reprezintă un nomenclator agregat de diviziuni sau grupe CAEN Rev. 2 utilizat în statistica europeană pentru caracterizarea industriei după destinaţia bunurilor produse.
Industria bunurilor intermediare cuprinde următoarele diviziuni, respectiv grupe CAEN Rev. 2: 07, 08, 09, 106, 109, 131, 132, 133, 16, 17, 201, 202, 203, 205, 206, 22, 23, 24, 255, 256, 257, 259, 261, 268, 271, 272, 273, 274, 279.
Industria bunurilor de capital cuprinde următoarele diviziuni, respectiv grupe CAEN Rev. 2: 251, 252, 253, 254, 262, 263, 265, 266, 28, 29, 301, 302, 303, 304, 325, 33.
Industria bunurilor de folosinţă îndelungată cuprinde următoarele diviziuni, respectiv grupe CAEN Rev. 2: 264, 267, 275, 309, 31, 321, 322.
Industria bunurilor de uz curent cuprinde următoarele diviziuni, respectiv grupe CAEN Rev. 2: 101, 102, 103, 104, 105, 107, 108, 11, 12, 139, 14, 15, 18, 204, 21, 323, 324, 329.
Industria energetică cuprinde următoarele diviziuni CAEN Rev. 2: 05, 06, 19.
Indicii cifrei de afaceri sunt provizorii şi se revizuiesc pe baza rectificărilor ce se efectuează retroactiv de către întreprinderile din eşantion.
Comenzile noi din industriereprezintă valoarea contractelor încheiate în luna de referinţă între un producător şi un client şi privesc livrările de bunuri şi servicii aferente producătorului, indiferent de perioada în care urmează a fi onorate.
Nu sunt incluse taxele legate de produse (cum ar fi TVA), rabaturile şidiscount-urile, atunci când acestea sunt acordate contractual.
Indicii comenzilor noi măsoară evoluţia acestora pe total industrie prelucrătoare care lucrează pe bază de comenzi,
Broad industrial groupings(intermediate goods, capital goods, consumer durables, consumer non-durables, energy) represent an aggregate nomenclature of CANE Rev. 2 divisions or groups used in European statistics to characterize industry by destination of goods.
Intermediate goods includes the
following divisions, CANE Rev. 2 respectively groups: 07, 08, 09, 106, 109, 131, 132, 133, 16, 17, 201, 202, 203, 205, 206, 22, 23, 24, 255, 256, 257, 259, 261, 268, 271, 272, 273, 274, 279.
Capital goods includes the following divisions CANE Rev. 2, respectively groups: 251, 252, 253, 254, 262, 263, 265, 266, 28, 29, 301, 302, 303, 304, 325, 33.
Consumer durables includes the
following divisions CANE Rev. 2, respectively groups: 264, 267, 275, 309, 31, 321, 322.
Consumer non-durables includes the following divisions CANE Rev. 2, respectively groups: 101, 102, 103, 104, 105, 107, 108, 11, 12, 139, 14, 15, 18, 204, 21, 323, 324, 329.
Energy includes the following CANE Rev. 2: 05, 06, 19 divisions.
Turnover indices are provisional and
they are revised based on the corrections which are retroactively done by the enterprises from the sample.
New orders in industry represent the value of contracts from the reference month between a producer and a customer and refer to the deliveries of goods and services related to the producer, no matter of the period when they are to be provided.
There are not included taxes on products (such as VAT), trade discounts and other discounts, when they are granted by contract.
Indices of new orders measure their evolution per total manufacturing, which is working based on orders, for CANE Rev. 2 divisions (13, 14, 17, 20, 21, 24÷30) as
103
diviziunile CAEN Rev.2 (13, 14, 17, 20, 21, 24÷30) precum şi pe marile grupe industriale care lucrează pe bază de comenzi.
Se utilizează Nomenclatorul operatorilor economici folosit la colectarea cifrei de afaceri din industrie, pentru operatorii economici din industria prelucrătoare care lucrează pe bază de comenzi (CAEN Rev. 2 diviziunile : 13, 14, 17, 20, 21, 24÷30).
Marile grupe industriale (industria bunurilor intermediare, industria bunurilor de capital, industria bunurilor de folosinţă îndelungată, industria bunurilor de uz curent) reprezintă un nomenclator agregat de diviziuni sau grupe CAEN Rev. 2 utilizat în statistica europeană pentru caracterizarea industriei după destinaţia bunurilor produse.
Industria bunurilor intermediare cuprinde următoarele diviziuni, respectiv grupe CAEN Rev. 2: 131, 132, 133, 17, 201, 202, 203, 205, 206, 24, 255, 256, 257, 259, 261, 268, 271, 272, 273, 274, 279.
Industria bunurilor de capital cuprinde următoarele diviziuni, respectiv grupe CAEN Rev. 2: 251, 252, 253, 254, 262, 263, 265, 266, 28, 29, 301, 302, 303, 304.
Industria bunurilor de folosinţă îndelungată cuprinde următoarele grupe CAEN Rev. 2: 264, 267, 275, 309.
Industria bunurilor de uz curent cuprinde următoarele diviziuni, respectiv grupe CAEN Rev. 2: 139, 14, 204, 21.
Indicii valorici ai comenzilor noi sunt indici de tip Laspeyres şi măsoară evoluţia acestora pe total, secţiuni, diviziuni CAEN Rev.2, precum şi pe marile grupe industriale. Anul de bază şi sistemul de ponderare sunt aferente anului 2010. Ponderile sunt calculate pe baza cifrei de afaceri, conform rezultatelor Anchetei Structurale în Întreprinderi din anul de bază (2010).
Indicii comenzilor noi sunt provizorii şi se revizuiesc pe baza rectificărilor ce se efectuează retroactiv de către
well as by broad industrial groups working based on orders.
The Nomenclature of economic
operators is used in order to collect turnover from industry, for economic operators from manufacturing, which are working based on orders (CANE Rev.2 divisions: 13, 14, 17, 20, 21, 24÷30).
Broad industrial groupings
(intermediate goods, capital goods, consumer durables, consumer non-durables) represent an aggregated nomenclature by CANE Rev. 2 divisions or groups used in the European statistics to characterize the industry by destination of produced goods.
Intermediate goods includes the
following divisions CANE Rev. 2, respectively groups: 131, 132, 133, 17, 201, 202, 203, 205, 206, 24, 255, 256, 257, 259, 261, 268, 271, 272, 273, 274, 279.
Capital goods includes the following divisions CANE Rev. 2, respectively groups: 251, 252, 253, 254, 262, 263, 265, 266, 28, 29, 301, 302, 303, 304.
Consumer durables includes the following groups CANE Rev. 2: 264, 267, 275, 309.
Consumer non-durables includes the following divisions CANE Rev. 2, respectively groups: 139, 14, 204, 21.
New orders value indices are indices of Laspeyres type and measure its evolution per total, by CANE Rev.2 sections and divisions, as well as by broad industrial groups. The base year and the weighting system are for the year 2010.The weights are calculated based on the turnover, according to the results of the Structural Business Survey in the base year (2010).
Indices of new orders are provisional
and are revised based on the corrections retroactively done by sample enterprises.
104
întreprinderile din eşantion.
Indicele preţurilor producţiei industriale pe total (piaţa internă şi piaţa externă)
Indicele preţurilor producţiei industriale
măsoară evoluţia de ansamblu a preţurilor produselor/serviciilor industriale fabricate şi livrate în primul stadiu de comercializare de producătorii interni într-o anumită perioadă (denumită perioadă curentă) faţă de o perioadă anterioară (denumită perioadă de referinţă).
Sfera de cuprindere a indicelui preţurilor producţiei industriale este reprezentată de ansamblul produselor fabricate şi comercializate (la intern şi/sau la export) de către operatorii economici a căror activitate principală se înscrie în cadrul diviziunilor CAEN Rev.2: 05÷36.
Variabila observată este preţul de producţie asociat acestor tranzacţii care va fi determinat în funcţie de vânzător (operator economic), de specificul produsului supus tranzacţionării, de tipul de cumpărător şi de alte caracteristici ale tranzacţiei.
Industrial production price index per total (domestic and non-domestic market)
The industrial production price index
measures the evolution of prices for industrial products/services manufactured and delivered during the first marketing stage by domestic producers in a certain period (called current period) as against the previous period (called reference period).
The coverage of the industrial production price index is represented by all the products manufactured and sold (on domestic market and/or non-domestic market) by economic operators whose main activity is includes in CANE Rev.2 05÷36 divisions.
The observed variable represents the production price associated to these transactions, which is to be determined according to the seller (economic operator), to the specific product for transaction and to the type of buyer and other characteristics of the transaction.
Numărul mare de tranzacţii efectuate de operatorii economici industriali, în cadrul economiei naţionale, face imposibilă urmărirea lor în totalitate. De aceea, observarea şi culegerea preţurilor de vânzare a produselor industriale care intră în calculul indicelui preţurilor producţiei industriale se realizează pe un eşantion reprezentativ de operatori economici în cadrul fiecărei clase de activitate CAEN Rev.2, având la bază un nomenclator unic de produse industriale.
De asemenea indicele preţurilor producţiei industriale acoperă aproape în totalitate sectoarele industriilor extractivă şi prelucrătoare, precum şi sectorul energetic.
În calculul indicelui conform Regulamentului CE nr. 1165/1998 amendat cu Regulamentul Parlamentului European nr. 1158/2005 cu privire la
The great number of transactions carried out by industrial economic operators, within the national economy, makes impossible their pursuing as a whole. Therefore, the observation and collection of selling prices for industrial products used to calculate the industrial production price index are carried out on a representative sample of economic operators for each CANE Rev.2 activity class, according to an unique nomenclature of industrial products.
The industrial production price index also covers almost totally the sector of mining and quarrying and manufacturing, as well as energy sector.
The calculation of the index according
to EC Regulation no. 1165/1998 amended with the Regulation of European Parliament no.1158/2005 regarding the
105
statisticile pe termen scurt, nu se cuprind: • extracţia minereurilor de
uraniu şi toriu; • prelucrarea combustibililor
nucleari; • fabricarea armamentului şi
muniţiei; • construcţia de nave şi bărci;
• fabricarea de aeronave şi
nave spaţiale; • fabricarea vehiculelor
militare de luptă; • colectarea şi epurarea
apelor uzate; • colectarea, tratarea şi
eliminarea deşeurilor; activităţi de recuperare a materialelor reciclabile;
• activităţi şi servicii de decontaminare;
• producţia fabricată şi livrată în cadrul aceluiaşi operator economic (consumul intern).
Produsele fabricate de operatorii economici selectaţi în eşantion sunt tratate în mod diferit în funcţie de principalele destinaţii ale acestora, piaţa internă şi export.
Principalul nomenclator utilizat în calculul indicelui preţurilor producţiei industriale este:
Nomenclatorul operatorilor
economici Principala sursă de date pentru
construirea eşantionului de operatori economici o constituie cercetarea statistică Ancheta Statistică Anuală (structurală) în întreprinderi (ASA) din anul de referinţă 2010. Pe baza datelor din această cercetare statistică, operatorii economici sunt ordonaţi descrescător după cifra de afaceri în cadrul fiecărei clase de activitate CAEN Rev.2, reţinându-se în eşantion operatorii economici a căror cifră de afaceri reprezintă cel puţin 70% din totalul clasei CAEN Rev.2.
short-term statistics, does not include: • extraction of uranium and
thorium ores; • nuclear fuel processing;
• weapons and ammunition
fabrication; • ships and boats
construction; • airships and space ships
fabrication; • fight military vehicles
fabrication; • used waters collection and
purification; • waste collection, purification
and disposal; recovery activities of recycling materials;
• decontamination activities and services;
• production fabricated and delivered within the same economic operator (domestic consumption).
The products manufactured by economic operators selected in the sample are differently treated according to their main destinations, domestic market and export.
The main nomenclature used in the calculation of industrial production price index is:
Nomenclature of economic operators The main data source to build up the
sample of economic operators is represented by the Annual (structural) Statistical Business Survey (ASBS) in the base year 2010. Based on the data of this statistical survey, the economic operators are downward set by turnover in each CANE Rev.2 activity class, keeping in the sample the economic operators whose turnover represents at least 70% of total CANE Rev.2 class.
106
Gradul de acoperire obţinut este cuprins între 70% şi 100%.
Nomenclatorul de produse Urmărirea şi înregistrarea preţurilor
sortimentelor fabricate şi livrate de operatorii economici din eşantion se va face pe baza unui nomenclator unic de produse industriale - PRODROM ce caracterizează activităţile B, C, D şi E din CAEN Rev.2. Produsul cuprins în nomenclator reprezintă primul nivel de agregare a sortimentelor componente ce caracterizează mişcarea preţurilor producţiei industriale.
Nomenclatorul de sortimente Sortimentul este un bun material care
rezultă dintr-un proces tehnologic de fabricaţie bine definit, având caracteristici tehnico-funcţionale specifice.
Sortimentul reprezintă nivelul
elementar la care se urmăreşte preţul asociat tranzacţiilor.
Nomenclatorul de sortimente nu este unic pe ţară, el se realizează la nivelul fiecărei unităţi de observare de către specialiştii statisticieni împreună cu specialiştii din cadrul operatorului economic.
Construirea sistemului de ponderare şi algoritmul de calcul
Indicele preţurilor producţiei industriale este de tip Laspeyres şi se determină pe baza unui sistem de ponderi constante.
Sistemul de ponderi utilizat în calculul indicelui preţurilor producţiei industriale se stabileşte separat pe destinaţii, după cum acesta serveşte la calculul indicelui preţurilor producţiei industriale livrată pieţei interne sau indicelui preţurilor producţiei industriale livrată la export. Valorile de ponderare pe destinaţii pentru toate nivelele de agregare s-au determinat din Ancheta Statistică Anuală (structurală) în întreprinderi din anul de referinţă 2010.
Indicele preţurilor producţiei industriale pe total (piaţa internă şi piaţa externă) se
The obtained coverage is between 70% and 100%.
Nomenclature of products Pursuing and registering the prices of
assortments manufactured and delivered by economic operators in the sample rely on an unique nomenclature of industrial products - PRODROM which characterizes the activity of B, C, D and E section of CANE Rev.2. The product included in the nomenclature represents the first aggregation level of component assortments characterizing the movement of industrial production prices.
Nomenclature of assortments The assortment is a material good
resulting from a well-defined manufacturing technological process, having specific technical and functional characteristics.
The assortment represents the elementary level of pursuing the price associated to the transactions.
The nomenclature of assortments is not unique at national level, it is carried out at level of each observation unit by expert statisticians together with the specialists from the economic operator.
Building up the weighting system
and the calculation algorithm The industrial production price index is
a Laspeyres type index and is determined based on a system of constant weights.
The system of weights used in the calculation of the industrial production price index is set up separately by destination, as it is used for the calculation of industrial production price index, delivered for domestic market or export. The weighting values by destination for allthe aggregation levels were determined from the Annual (structural) Statistical Business Survey in the base year 2010.
Industrial production price index per
total (domestic and non-domestic market)
107
calculează ca medie aritmetică ponderată dintre indicele preţurilor producţiei industriale livrată pe piaţa internă şi indicele preţurilor producţiei industriale livrată pe piaţa externă, pe fiecare nivel de agregare (clasă, grupă, diviziune, secţiune, total industrie).
is calculated as a weighted arithmetic mean between the industrial production price index for domestic market and the industrial production price index for non-domestic market, by each level of aggregation (class, group, division, section, total industry).
Datele privind producţia de lapte şi produse lactate sunt obţinute dintr-o cercetare statistică exhaustivă care se adresează tuturor întreprinderilor cu activitate principală sau secundară în clasa CAEN Rev.2 1051.
Aceste unităţi cumpǎră lapte integral de la exploataţiile agricole sau centre de colectare sau lapte importat, în vederea transformării acestuia în produse lactate.
Conţinutul mediu de grăsime, respectiv de proteine aferent cantităţilor lunare de lapte de vacă colectat se calculează ca o medie aritmetică ponderată a conţinutului mediu de grăsime, respectiv de proteine, cu cantităţile de lapte de vacă corespunzătoare raportate de fiecare unitate.
Data regarding milk and milk products are obtained through an exhaustive statistical survey filled in by the units who have the main or the secondary activity milk and derivates from milk production CAEN Rev.2 1051.
These diaries buys whole milk from farms or collecting centres or imported milk for processing in milk products.
The medium fat and protein content
corresponding monthly collected milk amounts is compiled as a weighted arithmetic average of the medium fat and protein content with the corresponding milk amounts reported by each unit.
Energie Resursele de energie primară se
determină în cursul anului numai pentru sortimentele principale, pe baza cantităţilor rezultate din producţia internă şi din import.
Transformarea în combustibil convenţional se efectuează în funcţie de aportul energetic al fiecărui purtător de energie primară. Unitatea de măsură este tona echivalent petrol (t.e.p.) în acord cu publicaţiile internaţionale în domeniu. Aceasta reprezintă, prin convenţie, un combustibil cu puterea calorifică de 41868 kj/kg (10000 kcal/kg). Pentru energia electrică, cu excepţia energiei nuclearo-electrice, transformarea se face pe baza potenţialului energetic al acesteia (0,086 t.e.p./kWh), în conformitate cu statistica energetică europeană, metodologie denumită generic “sistemul energiei finale”.
Energia nuclearo-electrică se
Energy The primary energy resources are
determined during the year only for the main assortments, based on the quantities from domestic production and import.
The transformation into conventional
fuel is carried out according to the energy contribution of each primary energy carrier. Unit of measure is oil equivalent ton (o.e.t.) according to international publications in the field. It represents by convention a fuel with calorific power of 41868 kj/kg (10000 kcal/kg). For electric energy, except nuclear-electric energy, the transformationis based on its energy potential (0.086 o.e.t./kWh), according to the European energy statistics, the methodology being generically called "the final energy system".
Nuclear-electric energy is changed
108
transformă în combustibil convenţional pe baza randamentului de producere, conform metodologiei internaţionale.
Energia electrică din import cuprinde cantitatea efectiv intrată pe teritoriul naţional pe baza contractelor de import, taxelor de tranzit şi schimburilor cu altesisteme naţionale interconectate. Nu sunt cuprinse cantitǎţile fizice de energie electricǎ care tranziteazǎ teritoriul naţional.
Balanţa energiei electrice se
întocmeşte pe baza datelor de producţie şi consum în economie, precum şi a celor furnizate de C.N. TRANSELECTRICA S.A. şi de societăţi comerciale distribuitoare de energie electrică privind consumul de energie electrică pentru iluminatul public, consumul populaţiei şi consumul propriu tehnologic în reţele şi staţii.
Sursa datelor: datele privind producţia
sunt obţinute prin cercetarea statistică a tuturor unităţilor producătoare de resurse energetice.
Datele privind comerţul internaţional cu bunuri sunt obţinute astfel:
- pentru comerţul extracomunitar de la Directia Generala a Vămilor din cadrul Agentiei Nationale de Administrare Fiscala, care realizează colectarea şi prelucrarea declaraţiilor vamale de export şi import (Sistemul Statistic Extrastat);
- pentru comerţul intracomunitar, prin
intermediul declaraţiilor statistice Intrastat colectate de I.N.S. de la operatorii economici care au realizat schimburi intracomunitare de bunuri (conform Legii Nr. 422/2006) şi pe baza declaraţiilor vamale aferente schimburilor comerciale intracomunitare furnizate de DGV , (Sistemul Statistic Intrastat)
- pentru energie electrica si gaz
natural, datele cantitative sunt furnizate de operatorii de retea (CN Transelectrica SA si SNTGN Transgaz SA).
In cadrul importului si exportului, nu
into conventional fuel, based on the production yield, according to the international methodology.
The electric energy from importcomprises the quantity effectively entered the national territory based on import contracts, transit fees and exchanges with other interconnected national systems.The physical quantites of electrical energy that transit through the national teritory are not included.
The electric energy balance is determined based on the production and consumption data in the economy and data provided by the National Company TRANSELECTRICA S.A. and electric energy distribution companies regarding electric energy consumption for the public lighting, population consumption and own technological consumption in the networks and stations.
The data source: data about output are obtained from statistical survey of all the units producing energy resources.
Data on international trade in goods
are obtained as follows: - for the extra-community trade from
General Directorate of Customs (GDC) within the National Agency for Fiscal Administration which carries out exports and imports custom declarations collection and processing (Extrastat Statistical System);
- for those related to intra-community trade, based on Intrastat statistical declarations collected by NIS from economic operators wich performed intra-community exchanges of goods (in compliance with Law No. 422/2006) and based on custom declaration related to intra-community comercial exchanges supplied by GDC (Intrastat Statistical System);
- for electricity and natural gas, quantitative data are provided by network operators (CN Transelectrica SA and SNTGN Transgaz SA)
In the import and export are not
109
sunt cuprinse cantităţile fizice de energie electrică care tranzitează teritoriul naţional.
Resursele de combustibili solizi şi destinaţiile acestora, balanţa prelucrării ţiţeiului şi a produselor petroliere, consumul de combustibili solizi pentru producerea energiei electrice şi stocurile de combustibili în termocentrale.
Datele referitoare la producţie,
consumuri, livrări şi stocuri sunt obţinute pe baza cercetărilor statistice pe termen scurt în domeniul energiei ; prelucrarea şi agregarea datelor se fac conform metodologiei europene din domeniul energiei, indicatorii fiind astfel comparabili cu cei prezentaţi de ţările membre ale Uniunii Europene.
Efectivul salariaţilor. Câştigurile
salariale. Efectivul salariaţilor cuprinde
persoanele cu contract de muncă/raport de serviciu pe durată determinată sau nedeterminată (inclusiv lucrătorii sezonieri, managerul sau administratorul), existente în evidenţele unităţilor economico-sociale la sfârşitul perioadei de referinţă. Nu sunt cuprinşi salariaţii detaşaţi la lucru în străinătate şi cei care cumulează mai multe funcţii şi nu au funcţia de bază la unitatea raportoare. Pentru a evita dubla/multipla înregistrare se respectă definiţia din Codul fiscal (cu modificările şi completările ulterioare) referitoare la activitatea dependentă la funcţia de bază, respectiv „orice activitate desfăşurată în baza unui contract individual de muncă sau a unui statut special prevăzut de lege, declarată angajatorului ca funcţie de bază de către angajat; în cazul în care activitatea se desfăşoară pentru mai mulţi angajatori, angajatul este obligat să declare fiecăruia locul unde exercită funcţia pe care o consideră de bază”. Sunt excluse cadrele militare şi personalul asimilat (Ministerul Apărării Naţionale,
included physical quantity of electricity passing through the national territory.
Solid fossil fuels supply and deliveries, hydrocarbons supply and deliveries, fuel consumption in thermal power stations and fuel stocks in thermal power stations at the end of period.
The data regarding production,
consumption, deliveries and stocks areobtained from energy short term statistic surveys; the computation and aggregation of data are performed according to the European energy methodology, the indicators being fully complying with those presented by the Member Countries of the Eurupean Union.
Number of employees. Earnings. The number of employees includes
persons with definite or indefinite duration labour contract/agreement (including seasonal workers, managers or administrator) existent in the evidence of economic and social units at end of the reference period. There are not coveredemployees seconded to work abroad andthose who accumulate more functions andnot the basic function to the reporting unit. Avoiding the double/multiple registrationmeets the definition of the Fiscal Code (as amended and supplemented) regarding the activity dependent on the basic function, namely "any activity carried out under an individual labour contract or aspecial status provided by the law, statedby to the employer as basic function of the employee; if the work is performed forseveral employers, each employee isobliged to declare for each of them the place where he considers to carry out the basic function ". There are excluded military staff and similar (Ministry of National Defence, The Ministry of Internal Affairs, Romanian Intelligence Service
110
Ministerul Afacerilor Interne, Serviciul Român de Informaţii etc.).
Câştigul salarial nominal brut cuprinde salariile, respectiv drepturile în bani şi în natură cuvenite salariaţilor pentru munca efectiv prestată (inclusiv pentru timpul lucrat suplimentar) potrivit formei de salarizare aplicată, sporurile şi indemnizaţiile acordate ca procent din salariu sau în sume fixe, alte adaosuri la salarii potrivit legii, sumele plătite pentru timpul nelucrat (indemnizaţiile pentru concediile de odihnă şi studii, zile de sărbătoare şi alte zile libere, sumele plătite din fondul de salarii pentru concediile medicale), premiile, primele de vacanţă şi alte sume plătite din fondul de salarii conform actelor normative sau contractelor colective de muncă, sumele plătite din profitul net şi alte fonduri (inclusiv contravaloarea tichetelor de masă).
Câştigul salarial nominal net se
obţine prin scăderea din câştigul salarial nominal brut a: impozitului, contribuţiei salariaţilor pentru asigurările sociale de sănătate, contribuţiei individuale de asigurări sociale de stat şi a contribuţiei salariaţilor la bugetul asigurărilor pentru şomaj.
Câştigul salarial mediu lunar
reprezintă raportul dintre sumele plătite salariaţilor de către agenţii economici în luna de referinţă, indiferent pentru ce perioadă se cuvin, şi numărul mediu de salariaţi. Numărul mediu al salariaţilor reprezintă o medie aritmetică simplă calculată pe baza efectivelor zilnice ale salariaţilor din luna respectivă. Salariaţii care nu sunt angajaţi cu normă întreagă se includ în numărul mediu proporţional cu timpul de lucru prevăzut în contractul de muncă.În efectivul de salariaţi luat în calcul se includ numai persoanele care au fost plătite pentru luna respectivă. Nu se iau în considerare: salariaţii aflaţi în concediu fără plată, în grevă, detaşaţi la lucru în străinătate şi cei al căror contract de
etc.). The gross nominal earnings
comprises salaries, respectively money rights and rights in kind of employees for the effectively done work (including overtime), according to the salary type applied, benefits and indemnities granted as salary percentage or in fixed amounts, other legal rises of salary, amounts paid for the non-worked time (indemnities for rest and study leaves, holidays, other days-off, amounts paid from salary fund for medical leaves), prizes, holidays bonuses and other amounts paid from salary fund according to normative documents or collective labour contracts, amounts paid from the net profit and other funds (including the equivalent value of lunch tickets).
The net nominal earnings is obtained
subtracting from the gross nominal earnings the following: the tax on earnings, the contribution of employees to the health social insurance, the individual contribution to the state social insurance and the employees’ contribution to unemployment insurance budget.
. The monthly average earnings
represents the ratio between the amounts paid to the employees by economic operators in the reference month, no matter of the period and the average number of employees. Average number of employees' represents a simple arithmetic mean calculated based on daily numbers of employees in the respective month. Employees who are not full time employed are included in average number proportionally to work time stipulated in the labour contract. The number of employees includes only persons paid for the respective month. There are not taken into consideration: the employees under leave without pay, in strike, temporarily transferred to work abroad and that labour
111
muncă/raport de serviciu a fost suspendat contract/agreement whose was suspended
Începând cu luna iulie 2010 se aplică prevederile legale în vigoare, referitoare la impozitarea1 tichetelor de masă.
Începând cu luna ianuarie 2011 se aplică prevederile legale în vigoare referitoare la baza de calcul a contribuţiilor sociale individuale2, care se plafonează în limita a 5 câştiguri salariale medii brute stabilite prin legea bugetului asigurărilor sociale de stat.
Sursa datelor
Datele lunare privind câştigul salarial şiefectivul de salariaţi sunt obţinute printr-o cercetare statistică selectivă. Pentru dimensionarea eşantionului s-a luat în considerare obţinerea unor estimaţii ale principalelor caracteristici cercetate, care să fie afectate de erori în limita a +/-3% şi garantate cu o probabilitate de 95%. Începând cu luna ianuarie 2015 eşantionul cuprinde 22800 unităţi economico-sociale. Unităţile din „sectorul bugetar” sunt cuprinse exhaustiv în cercetare, excepţie făcând unităţile administraţiei publice locale pentru care datele la nivelul consiliilor locale comunale se culeg pe bază de eşantion reprezentativ la nivel de judeţ (cca. 770 de unităţi). Pentru sectorul economic, au fost incluse în cercetare unităţile cu 4 salariaţi şi peste, care reprezintă 93,10% din numărul total al salariaţilor din acest sector.
Obiectivul cercetării statistice lunare asupra câştigurilor salariale îl constituie evaluarea tendinţelor pe termen scurt ale câştigurilor salariale medii lunare şi orare pe total economie şi sectoare de activitate.
Datele sunt agregate după activitatea omogenă a unităţilor; aceasta înseamnă că pentru unităţile care desfăşoară mai multe activităţi (secundare) decât cea principală, activităţile secundare sunt cuprinse, fiecare, la activităţile economice
Starting with July 2010 there are applied the legal stipulations in force, regarding taxation1 of lunch tickets.
Since January 2011 there are applied the legal stipulations in force, regardingcalculation base of individual2 social contribution, limited to 5 gross average earnings set up by the law of state social insurance budget.
Data source
The monthly data regarding the earning and the number of employees are obtained by a statistical sampling survey. In view to set up the sample size, estimates of the main characteristics observed have been taken into account, which could be affected by errors of +/-3% at most and guaranteed with a probability of 95%. Since January 2015, the sample comprises 22800 economic and social units. Budgetary sector units are exhaustively included in the survey, except local public administration for which data at level of local communal councils are collected based on a sample reprsentative at level of county (about 770 units). For economic sector, units of 4 employees and over were included in the survey, covering 93.10% of total employees in this sector.
Objective of monthly statistical survey
on earnings is to evaluate short term trends of monthly average and hourly earnings per total economy and by activity sector.
Data are aggregated by homogeneous activity of units, meaning that units which develop more activities (secondary) than the main one, are included each of them in the economic activities according to the corresponding
1 Ordonanţa de Urgenţă nr. 58 din 26 iunie 2010 pentru modificarea şi completarea Legii nr. 571/2003 privind Codul fiscal şi alte măsuri financiar-fiscale. 1U.O. no. 58/26 June 2010 for the modification and completion of the Law 571/2003 on the fiscal Code and other fiscal financial measures. 2 OUG nr. 117/2010 pentru modificarea şi completarea Legii nr. 571/2003 privind Codul fiscal şi reglementarea unor măsuri financiar-fiscale 2G.U.O. no.117/2010 for the modification and completion of the Law no. 571/2003 on the Fiscal Code and regulation of some financial-fiscal measures
112
conform CAEN Rev.2 corespunzătoare. CANE Rev.2.
Comerţ internaţional cu bunuri Statisticile de comerţ internaţional cu
bunuri se stabilesc prin însumarea datelor din sistemele INTRASTAT şi EXTRASTAT:
- sistemul INTRASTAT: pentru comerţul intra-UE (schimburile de bunuri între România şi celelalte state membre ale Uniunii Europene)
- sistemul EXTRASTAT: pentru comerţul extra-UE (schimburile de bunuri între România şi statele care nu sunt membre ale Uniunii Europene).
• Sfera de cuprindere: Pentru comerţul intra-UE: se cuprind
expedierile de bunuri din România cu destinaţia alt stat membru UE şi introducerile de bunuri în România provenind din alt stat membru UE.
Expedierile din România includ: - bunuri în liberă circulaţie care
părăsesc teritoriul statistic al României cu destinaţia alt stat membru UE;
- bunuri care au fost plasate sub procedura vamală de prelucrare activă (în interiorul ţării) sau prelucrare sub control vamal în România şi care sunt destinate altor state membre.
Introducerile în România includ: - bunuri în liberă circulaţie într-un stat
membru UE care intră pe teritoriul statistic al României;
- bunuri care au fost plasate sub procedura vamală de prelucrare activă sau prelucrare sub control vamal în alt stat membru UE şi care intră pe teritoriul statistic al României.
Pentru comerţul extra-UE: se cuprind schimburile de bunuri între România şi statele nemembre UE, având ca obiect: importul direct de bunuri pentru consum, bunurile importate scoase din antrepozitele vamale sau zonele libere pentru a fi puse în consum, exportul de bunuri de origine naţională, precum şi exportul de bunuri importate, declarate pentru consumul
International trade in goods Statistics of international trade in
goods are set up amounting the data from INTRASTAT AND EXTRASTAT systems:
- INTRASTAT system: for intra EU
trade (exchanges of goods between Romania and other member states of European Union)
- EXTRASTAT system: for extra EU trade (exchanges of goods between Romania and non-member states of European Union).
• Coverage: Intra EU trade includes exits of goods
from Romania with the destination of another EU member state and entries of goods in Romania coming from another EU member state.
Deliveries from Romania include: - free circulation goods leaving the
statistical country of Romania with the destination of another EU member state;
- goods placed under customs procedure of inward processing (inside the country) or processing under customs control in Romania and are meant for other member states.
Entries in Romania include: - free circulation goods in one EU
member states entering the statistical territory of Romania;
- goods placed under customs procedure of inward processing or processing under customs control in another EU member state and which enter the statistical territory of Romania.
Extra UE trade includes exchanges of goods between Romania and EU non-member states having as object direct import of goods for consumption, imported goods taken out from customs warehouses or free zones to be put under consumption, export of national origin goods, as well as export of imported goods, declared for domestic consumption.
113
intern. Se cuprind de asemenea: - importurile temporare de bunuri
străine pentru prelucrare activă (în interiorul ţării);
- exporturile de produse compensatoare rezultate după prelucrarea activă;
- exporturile temporare de bunuri pentru prelucrare pasivă (prelucrare în alte ţări);
- importurile de produse compensatoare rezultate după prelucrarea în afara ţării şi bunurile importate sau exportate în sistemul de leasing financiar (la valoarea integrală a bunurilor).
Nu sunt cuprinse în comerţul
internaţional: bunurile în tranzit, bunurile temporar admise/scoase în/din ţară (cu excepţia celor pentru prelucrare), bunurile achiziţionate de organizaţii internaţionale pentru utilizări proprii în România, bunurile pentru şi după reparaţii şi piesele de schimb aferente.
• Bunurile ce fac obiectul schimburilor internaţionale sunt clasificate conform Nomenclatorului Combinat (NC). Datele pe secţiuni din Clasificarea Standard de Comerţ Internaţional (CSCI, Rev.4) se determină pe baza unui tabel de trecere între acest nomenclator şi Nomenclatorul Combinat.
• Valoarea bunurilor expediate/
exportate şi introduse/importate se stabileşte pe baza preţurilor efective FOB la expedieri/exporturi şi a preţurilor efective CIF la introduceri/importuri.
Preţul FOB (în limba engleză Free on Board - Liber la bord) reprezintă preţul la frontiera română, care include valoarea bunului, toate cheltuielile de transport până la punctul de îmbarcare, precum şi toate taxele suportate pentru ca bunul să fie încărcat la bord.
Preţul CIF (în limba engleză Cost, Insurance, Freight - Cost, Asigurare, Navlu) reprezintă preţul la frontiera
There are also included: - temporary imports of foreign goods
for inward processing (inside the country); - - exports of compensatory products
resulted from inward processing; - - temporary exports of goods for
outward processing (in other countries): - imports of compensatory products
resulted from processing outside the country and imported or exported goods under financial leasing (at integral value of goods).
International trade does not include:
transit goods, goods temporarily admitted/taken out/in the country (except for processing), goods purchased by international organizations for their own uses in Romania, goods for and after repairs and related spare parts.
• Goods object of international
exchanges are classified according to the Combined Nomenclature (CN). Data by sections from the Standard International Trade Classification (SITC Rev.4) are determined based on a passage table between this nomenclature and the Combined Nomenclature.
• Value of delivered/exported and
entered/imported goods is set up based on FOB actual prices for deliveries/exports and of CIF actual prices for entries/imports.
FOB price (in English free on board) represents price at Romanian border, including value of goods, all transport expenditure until the embarking point as well as all fees paid for the goods to be loaded on board.
CIF price (in English cost, insurance,
freight) represents price at Romanian border including both the components of
114
română, care cuprinde atât elementele componente ale preţului FOB, cât şi costurile asigurării şi transportului internaţional.
Datele valorice sunt exprimate în lei şi euro. Conversia datelor valorice exprimate în lei (colectate prin declaraţiile statistice Intrastat şi declaraţiile vamale), în euro, se face utilizând:
- cursul de schimb mediu lunar lei/euro
comunicat de Banca Naţională a României, pentru sistemul INTRASTAT
- cursul de schimb lei/euro comunicat de Banca Naţională a României pentru penultima zi de miercuri a lunii, pentru sistemul EXTRASTAT.
• Începând cu 1 ianuarie 2007, componenţa Uniunii Europene (UE 27) este următoarea: Austria, Belgia, Republica Cehă, Cipru, Danemarca, Estonia, Finlanda, Franţa, Germania, Grecia, Irlanda, Italia, Letonia, Lituania, Luxemburg, Malta, Marea Britanie, Olanda, Polonia, Portugalia, Slovacia, Slovenia, Spania, Suedia, Ungaria, Bulgaria, România.
Repartizarea pe ţări a schimburilor
internaţionale se determină astfel: - pentru comerţul INTRA-UE pe
baza principiului „ţara de destinaţie” (la expedieri) şi „ţara de expediţie” (la introduceri).
- pentru comerţul EXTRA-UE pe baza principiului „ţara de destinaţie” (la export) şi „ţara de origine” (la import, cu excepţia cazului în care ţara de origine este un stat membru UE-caz în care se ia în considerare ţara de expediţie).
Se consideră „ţara de destinaţie” ţara
în care bunurile vor fi consumate, „ţara de expediţie” ţara din care bunurile au fost expediate şi „ţara de origine” ţara în care a fost produs bunul sau în care bunul a suferit ultima transformare substanţială.
FOB price and the costs of international transport and insurance.
Value data are expressed in lei and
EURO. The conversion of value data expressed in lei (collected from INTRASTAT statistical declarations and customs declarations) in EURO, is done using:
- monthly average exchange rate lei/EURO communicated by the National Bank of Romania for INTRASTAT system;
- exchange rate lei/EURO communicated by the National Bank of Romania for the last one of Wednesday of the month for EXTRASTAT system.
• Starting with January 1, 2007, the components of the European Union (EU 27) are the following: Austria, Belgium, Czech Republic, Cyprus, Denmark, Estonia, Finland, France, Germany, Greece, Ireland, Italy, Latvia, Lithuania, Luxembourg, Malta, United Kingdom, Netherlands, Poland, Portugal, Slovakia, Slovenia, Espaine, Sweden, Hungary, Bulgaria, Romania.
The breakdown by countries of
international exchanges of goods is determined as follows:
- for intra EU trade based on the principle “destination country” (for exits) and “delivery country” (for entries)
- for extra EU trade based on the
principle “destination country” (for export) and “origin country” (for import, except origin country is EU member state when delivery country is taken into account).
“Destination country” is considered the country where goods will be consumed, “delivery country” is the country from which goods were delivered and “origin country” is the country where the goods were produced or where suffered the last important transformation.

115
Sursa datelor: • pentru comerţul INTRA-UE : - declaraţiile statistice Intrastat
colectate de către INS direct de la operatorii economici care au realizat un volum valoric al expedierilor intracomunitare de bunuri mai mare de 900.000 lei sau un volum al introducerilor intracomunitare de bunuri mai mare de 300.000 lei.
- declaraţiile vamale colectate şi prelucrate de către ANV, pentru comerţul intracomunitar privind bunuri pentru prelucrare internă sau prelucrare sub control vamal; bunuri care se mişcă din /către părţi ale teritoriului statistic al UE dar care nu aparţin teritoriului fiscal al UE.
• pentru comerţul EXTRA-UE: Autoritatea Naţională a Vămilor (ANV), care colectează şi prelucrează declaraţiile vamale de export şi import. Pentru energie electrică şi gaze naturale, datele sunt colectate pe formulare statistice de la societăţile importatoare/exportatoare de către Institutul Naţional de Statistică şi se transmit la ANV pentru prelucrare şi întregirea datelor obţinute din declaraţiile vamale.
Pentru comerţul intracomunitar se realizează estimări pentru:
- non-răspunsuri şi răspunsurile primite cu întârziere de la furnizorii de informaţii statistice
- comerţul realizat de către operatorii economici aflaţi sub pragul de asimilare
- valoarea statistică pentru tranzacţiile realizate de către operatorii economici aflaţi sub pragul de valoare statistică
Datele lunare comunicate operativ sunt susceptibile de rectificări succesive din partea INS/ANV.
Data source: • for intra EU trade : - INTRASTAT statistical declarations
collected by INS directly from economic units which achieved a value volume intra-community deliveries of goods higher than lei 900000 or a volume of intra-community entries of goods higher than lei 300000.
- customs declarations collected and
processed by National Authority of Customs (NAC) for intra-community trade regarding goods for internal processing or processing under customs control, goods from/to the parts of EU statistical territory which do not belong to EU fiscal territory.
• for extra EU trade : National Authority of Customs (NAC) which collects and processes export and import customs declarations. For electric energy and natural gas, data are collected on statistical forms from importing/exporting companies to the National Institute of Statistics and are sent to NAC for processing and completing the data obtained from customs declarations.
For intra-community trade there are
estimations for: - non-responses and responses
received with delay from suppliers of statistical information;
- trade of economic units under assimilation threshold;
- statistical value for transactions of economic units under statistical value threshold.
Monthly data currently communicated could be successively corrected by the NIS/NAC.