Embed Size (px)
Citation preview
•1
1
BullChartsBullScan Manager
a Tutorial
August 2007 (revised)
(c) Copyright August 2007 - Prepared by Robert Brain for Melbourne BullCharts User Group
2
Discussion Guidelines• One person to “lead” the discussion
(as a facilitator).• Everyone else is free to contribute
to the discussion, including:– Their view / understanding of the topic;– Any good interpretations of how to use it,
especially if they have resulted in a good trade.
•2
3
D I S C L A I M E RAny information presented or discussed as a
part of this presentation is only opinion, and is not advice,
and should not be acted upon. The particular financial requirements of the
viewer have not been taken into consideration.
One should always seek appropriate professional advice before
entering into financial or other arrangements.
4
BullScan — Agenda1. Introduction to BullCharts “scans”2. What can we “scan” for? - samples3. The Scan Definition4. The Scan Criteria5. Which securities?6. Running the Scan7. Interrupting the Scan8. Viewing the results9. Also note:-
•3
5
1. IntroductionBullCharts software can be used to do different
types of “scans”: 1. BullScan — To “Scan” through
a specific list of stocks to find those that meet certain “criteria”.
2. Market Scan — To “Scan” through market data for specific fundamental or pricing conditions (including on live data if you subscribe to the live data plan).
(NB: This presentation only covers BullScan, and not the Market Scan capabilities.)
6
First: Quick Demo• Start BullCharts• View the BullScan Manager
(menu option: Tools > BullScan Manager; or <F8> key)
• Note the on-screen tabs (at bottom):– Name, Category, Author
• Demo the “JB Rising Trend” scan.
(quick demo only - more details follow)
•4
7
2. What can we “scan” for?Let’s view some sample Scans
(ie. BullCharts-supplied Author Scans), and describe them in English:
1. Jim Berg — “JB Rising Trend”2. Nicholas Darvas’
“Broke Darvas Top in last 5 days”3. Alan Hull’s
“Hull Price Volume Breakout - Daily”4. Stan Weinstein — “Entering Stage 2 from 1”5. Leon Wilson — “New Highs”
8
Jim Berg — “JB Rising Trend”Using Jim Berg’s strategy, this supplied scan
looks for stocks with a “Rising Trend”,defined by the following criteria:
a) If the share price Close > the 34 bar EMA of the Close; AND
b) If the Close > the 34 bar EMA of the Closeof 5 bars ago.
What does the scan result look like?...
•5
9
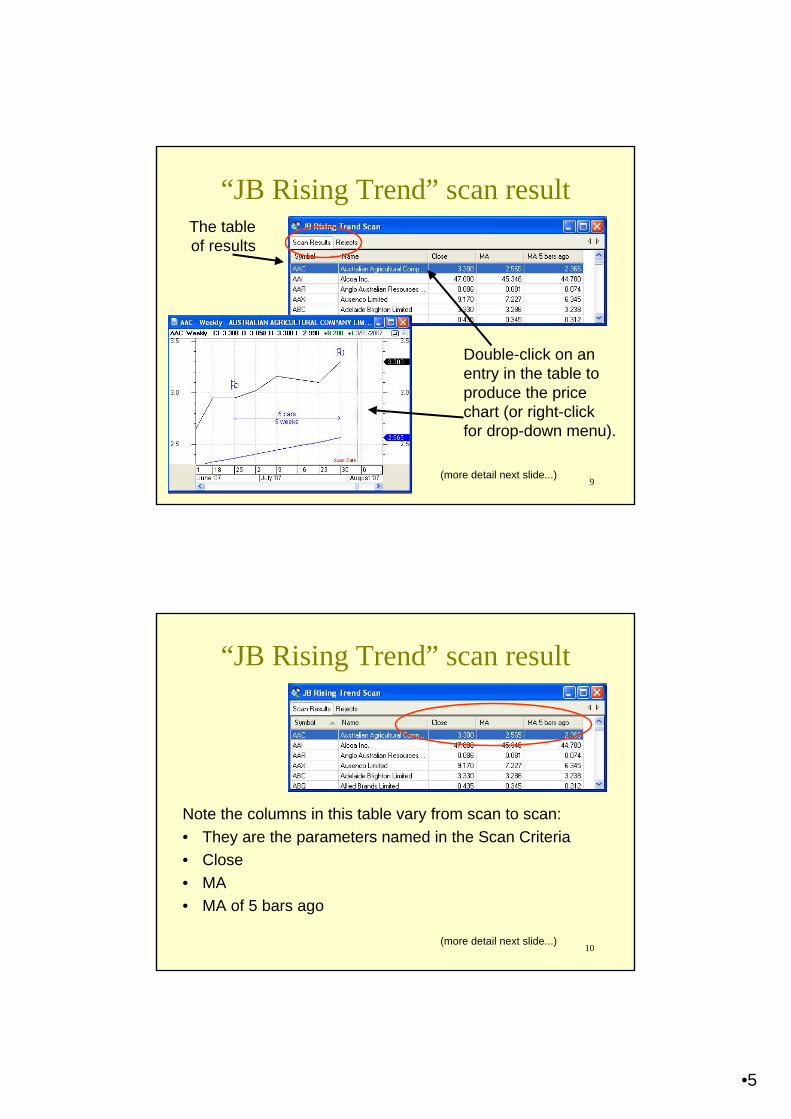
“JB Rising Trend” scan resultThe tableof results
Double-click on an entry in the table to produce the price chart (or right-click for drop-down menu).
(more detail next slide...)
10
“JB Rising Trend” scan result
Note the columns in this table vary from scan to scan:• They are the parameters named in the Scan Criteria• Close• MA• MA of 5 bars ago
(more detail next slide...)
•6
11
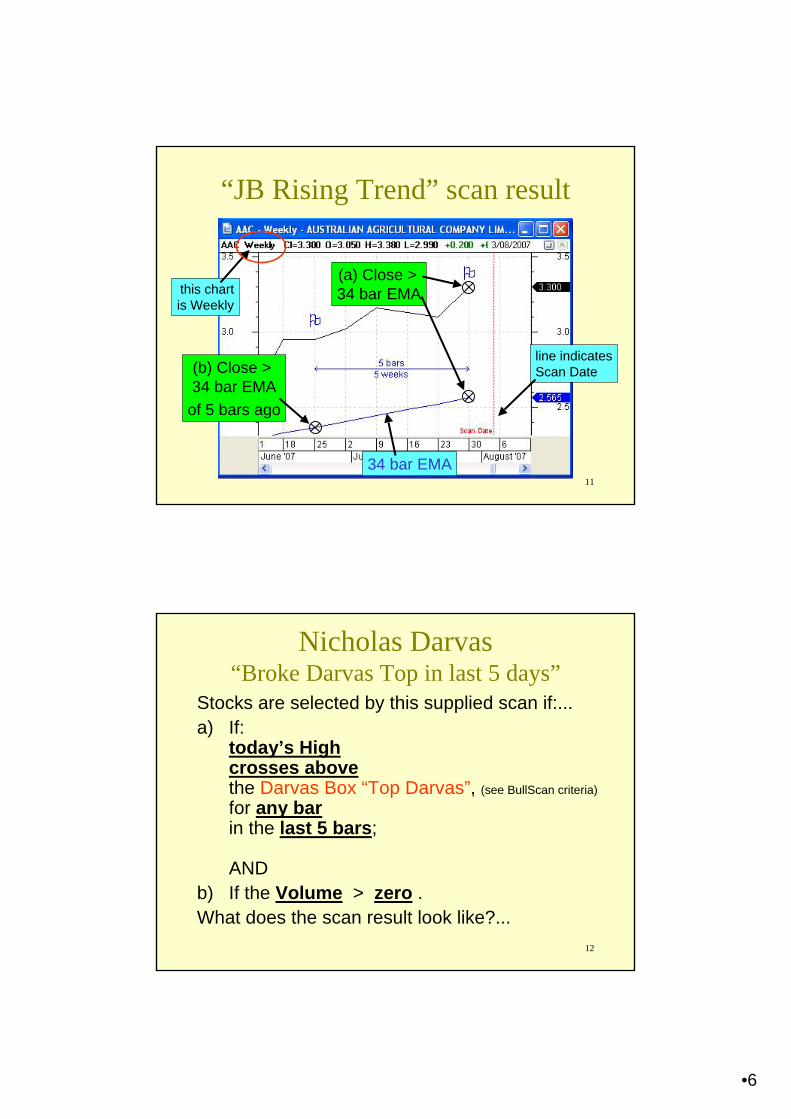
“JB Rising Trend” scan result
34 bar EMA
(a) Close > 34 bar EMA
(b) Close > 34 bar EMAof 5 bars ago
line indicatesScan Date
this chartis Weekly
12
Nicholas Darvas “Broke Darvas Top in last 5 days”
Stocks are selected by this supplied scan if:...a) If:
today’s Highcrosses abovethe Darvas Box “Top Darvas”, (see BullScan criteria)
for any barin the last 5 bars;
ANDb) If the Volume > zero . What does the scan result look like?...
•7
13
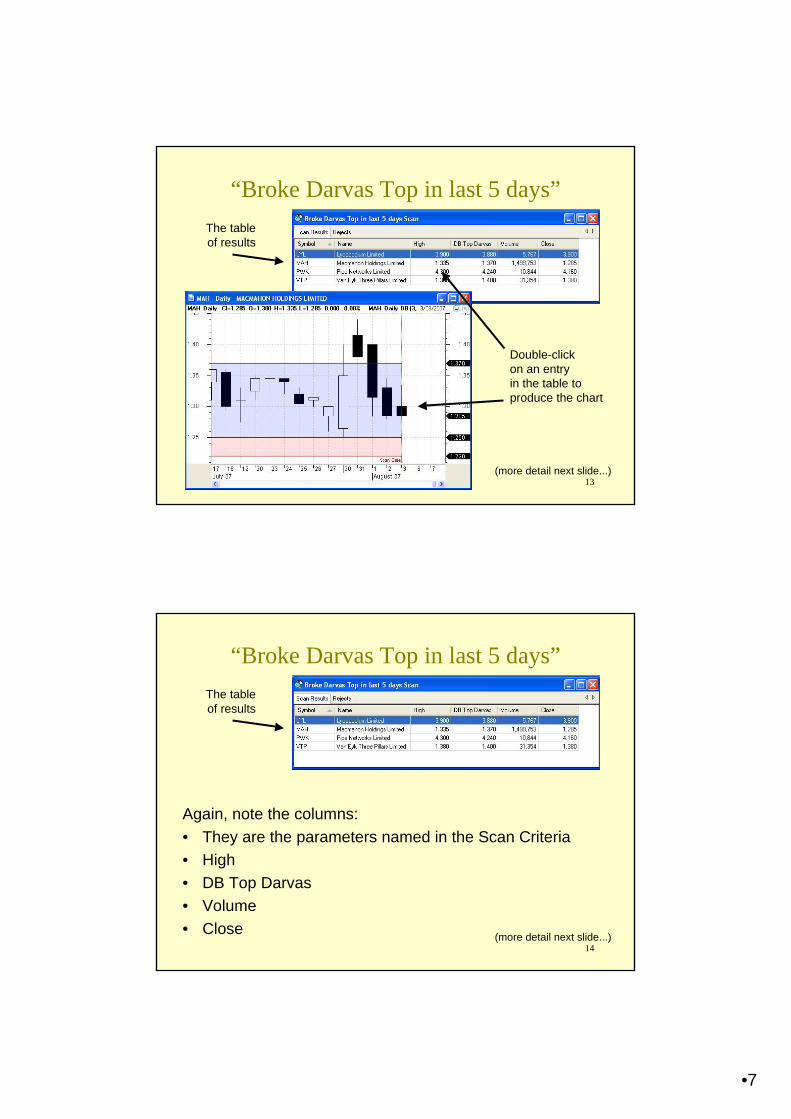
“Broke Darvas Top in last 5 days”The tableof results
Double-clickon an entry in the table to produce the chart
(more detail next slide...)
14
“Broke Darvas Top in last 5 days”
(more detail next slide...)
Again, note the columns:• They are the parameters named in the Scan Criteria• High• DB Top Darvas• Volume• Close
The tableof results
•8
15
“Broke Darvas Top in last 5 days”
16
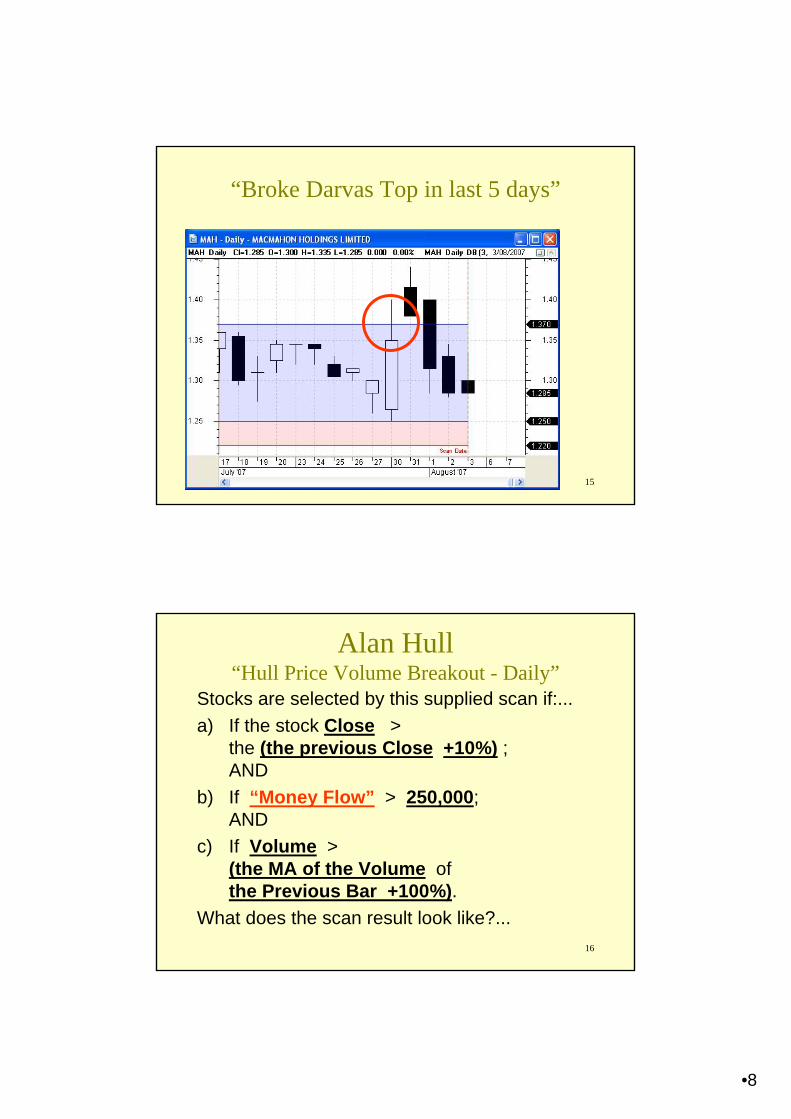
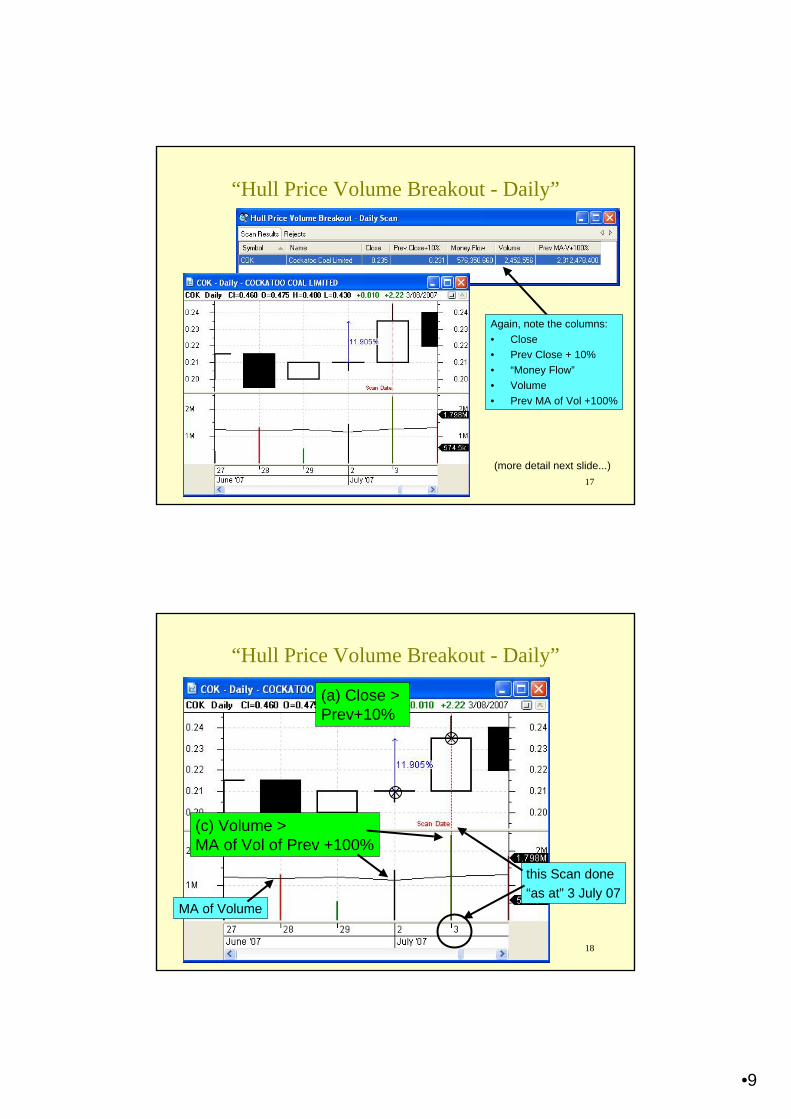
Alan Hull“Hull Price Volume Breakout - Daily”
Stocks are selected by this supplied scan if:...a) If the stock Close >
the (the previous Close +10%) ; AND
b) If “Money Flow” > 250,000;AND
c) If Volume > (the MA of the Volume ofthe Previous Bar +100%).
What does the scan result look like?...
•9
17
“Hull Price Volume Breakout - Daily”
(more detail next slide...)
Again, note the columns:• Close• Prev Close + 10%• “Money Flow”• Volume• Prev MA of Vol +100%
18
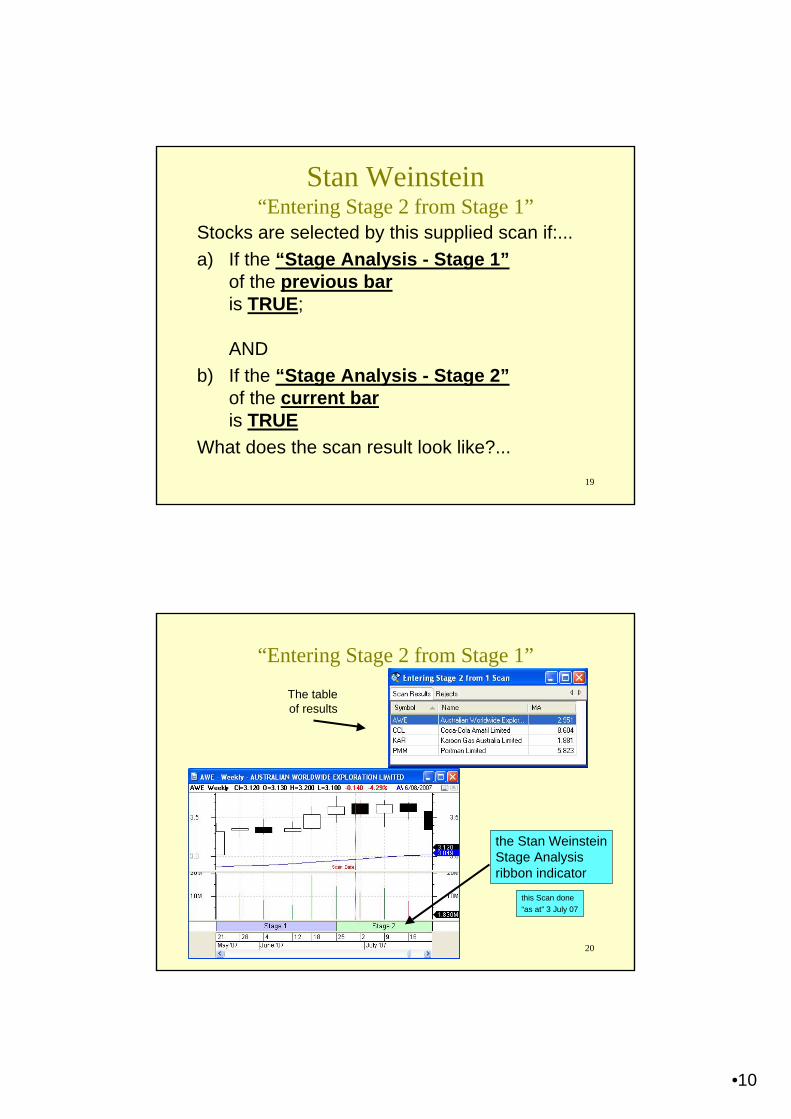
“Hull Price Volume Breakout - Daily”
this Scan done“as at” 3 July 07
MA of Volume
(a) Close > Prev+10%
(c) Volume > MA of Vol of Prev +100%
•10
19
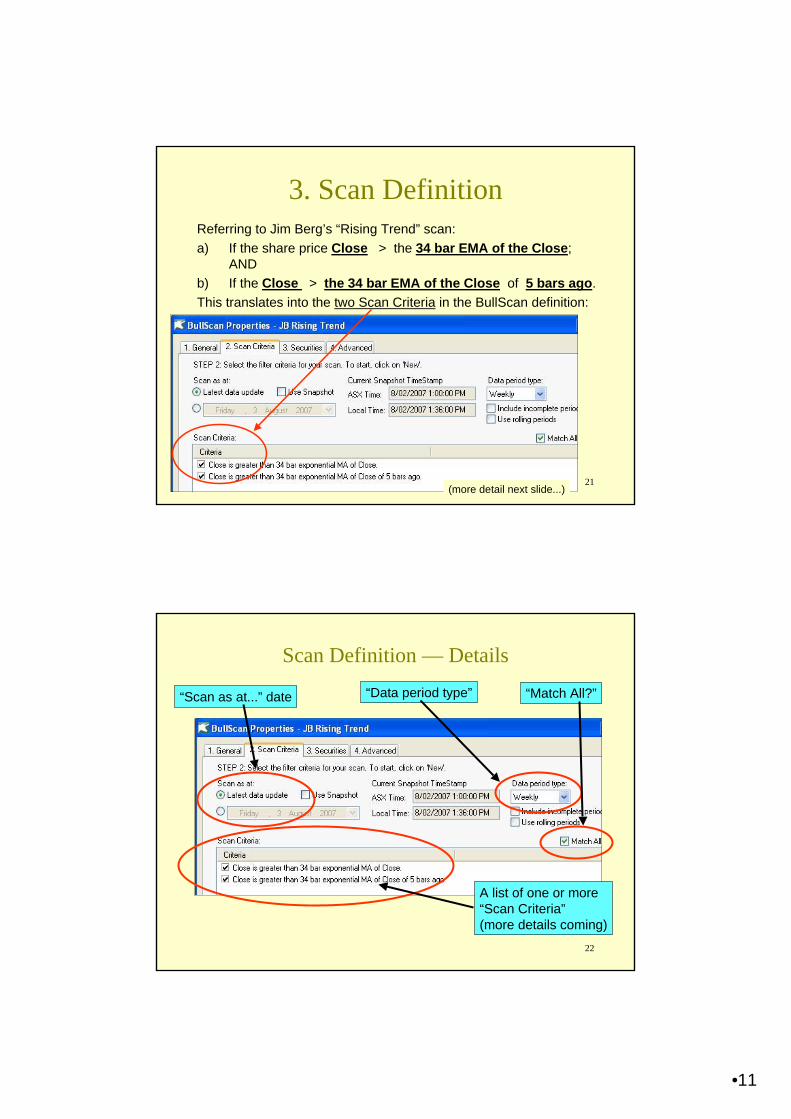
Stan Weinstein“Entering Stage 2 from Stage 1”
Stocks are selected by this supplied scan if:...a) If the “Stage Analysis - Stage 1”
of the previous baris TRUE;
ANDb) If the “Stage Analysis - Stage 2”
of the current baris TRUE
What does the scan result look like?...
20
“Entering Stage 2 from Stage 1”
this Scan done“as at” 3 July 07
the Stan WeinsteinStage Analysis ribbon indicator
The tableof results
•11
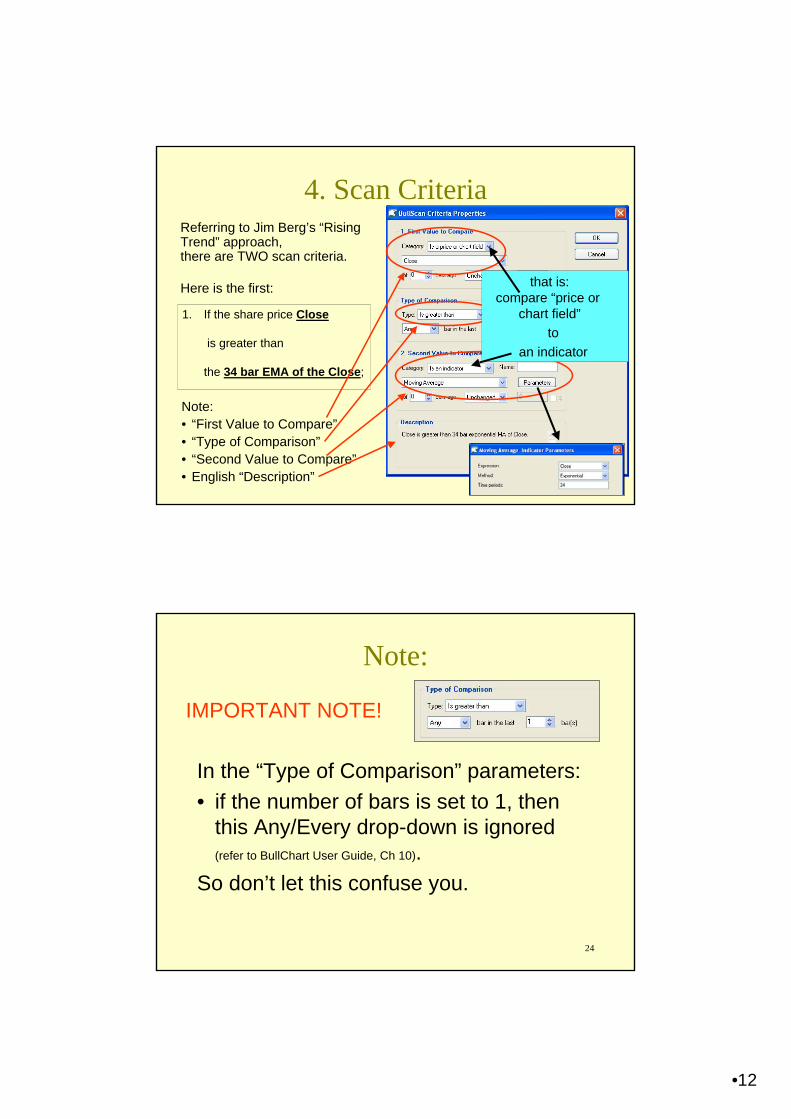
21
3. Scan DefinitionReferring to Jim Berg’s “Rising Trend” scan:a) If the share price Close > the 34 bar EMA of the Close;
ANDb) If the Close > the 34 bar EMA of the Close of 5 bars ago.This translates into the two Scan Criteria in the BullScan definition:
(more detail next slide...)
22
Scan Definition — Details
“Scan as at...” date “Data period type” “Match All?”
A list of one or more“Scan Criteria”(more details coming)
•12
23
4. Scan Criteria
1. If the share price Close
is greater than
the 34 bar EMA of the Close;
Referring to Jim Berg’s “Rising Trend” approach,there are TWO scan criteria.
Here is the first:
Note:• “First Value to Compare”• “Type of Comparison”• “Second Value to Compare”• English “Description”
that is: compare “price or
chart field” to
an indicator
24
Note:
In the “Type of Comparison” parameters:• if the number of bars is set to 1, then
this Any/Every drop-down is ignored(refer to BullChart User Guide, Ch 10).
So don’t let this confuse you.
IMPORTANT NOTE!
•13
25
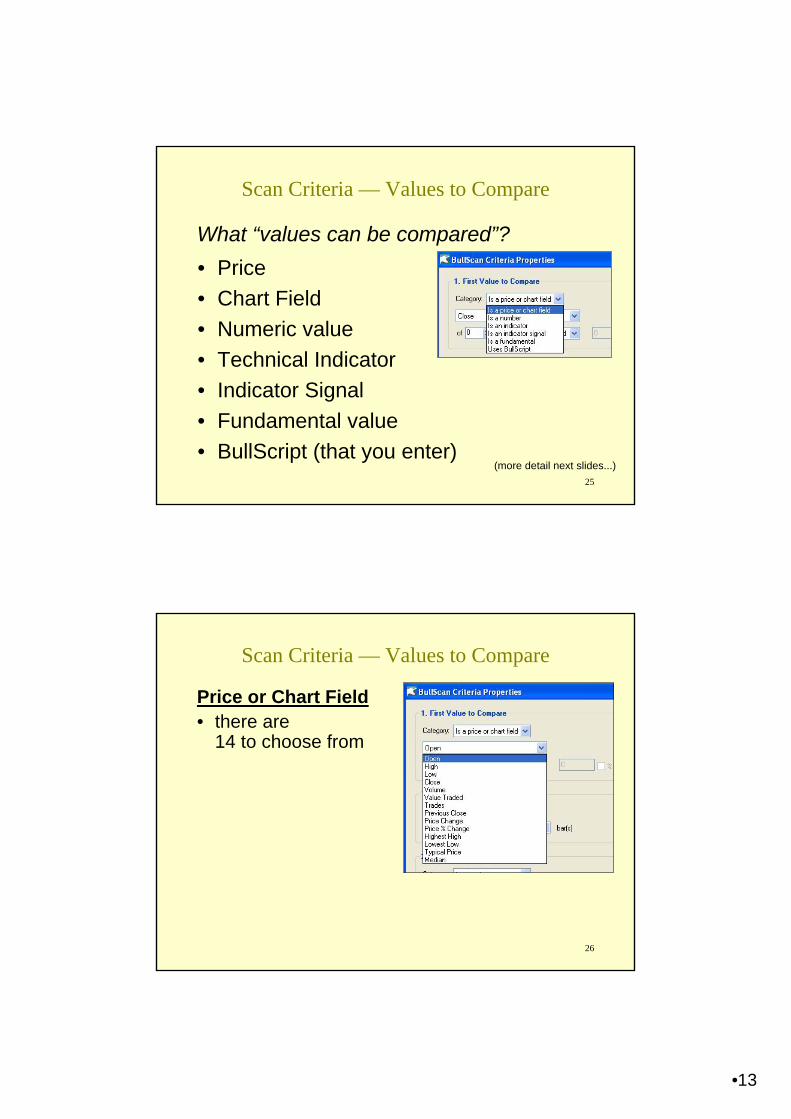
Scan Criteria — Values to Compare
What “values can be compared”?• Price• Chart Field• Numeric value• Technical Indicator• Indicator Signal• Fundamental value• BullScript (that you enter)
(more detail next slides...)
26
Scan Criteria — Values to Compare
Price or Chart Field• there are
14 to choose from
•14
27
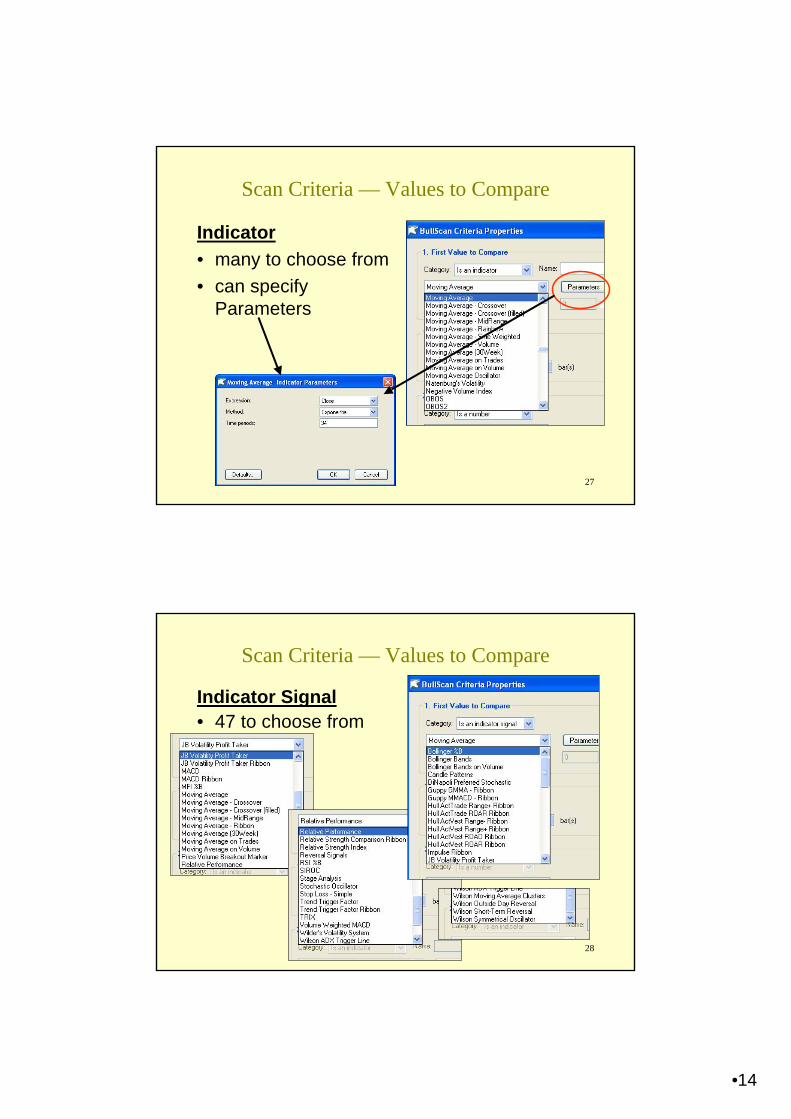
Scan Criteria — Values to Compare
Indicator• many to choose from• can specify
Parameters
28
Scan Criteria — Values to Compare
Indicator Signal• 47 to choose from
•15
29
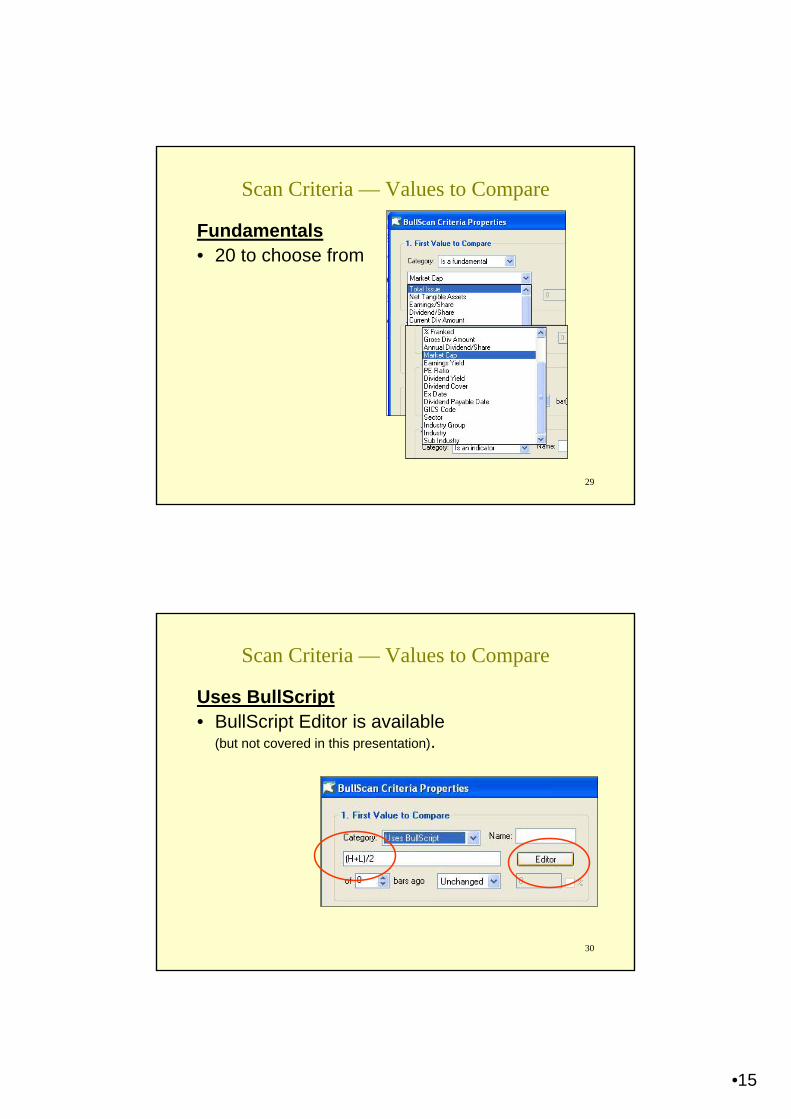
Scan Criteria — Values to Compare
Fundamentals• 20 to choose from
30
Scan Criteria — Values to Compare
Uses BullScript• BullScript Editor is available
(but not covered in this presentation).
•16
31
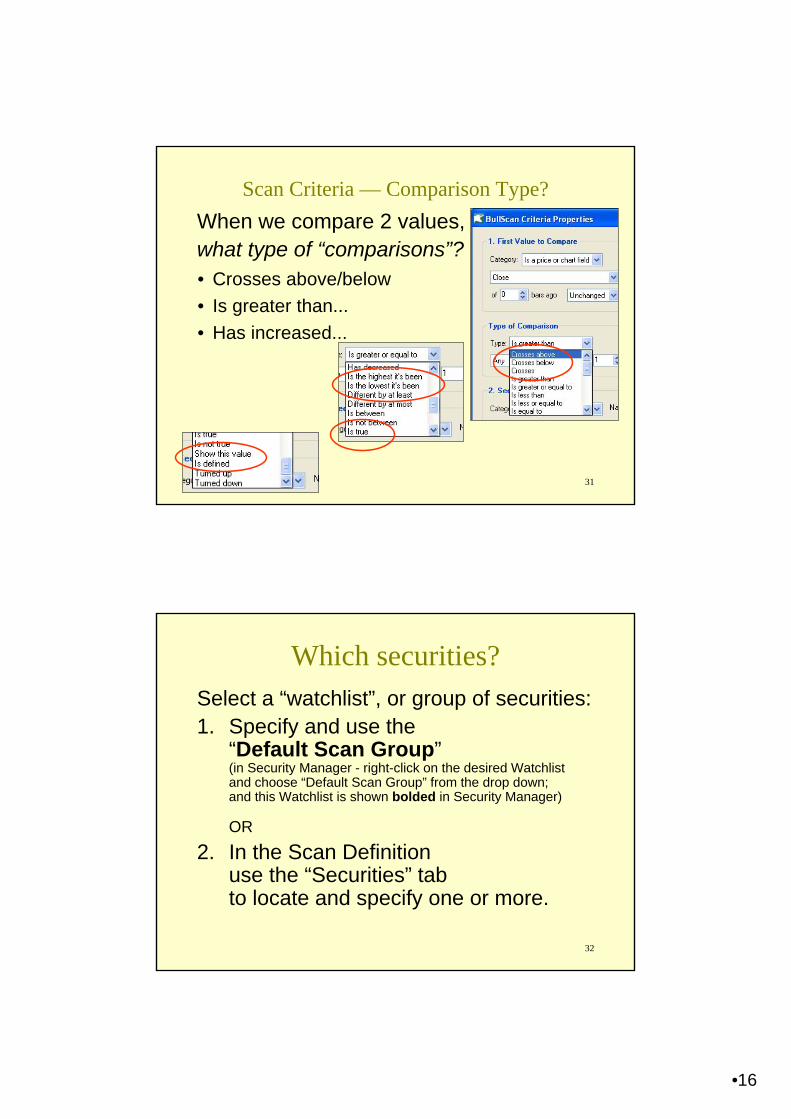
Scan Criteria — Comparison Type?When we compare 2 values,what type of “comparisons”?• Crosses above/below• Is greater than...• Has increased...
32
Which securities?Select a “watchlist”, or group of securities:1. Specify and use the
“Default Scan Group”(in Security Manager - right-click on the desired Watchlistand choose “Default Scan Group” from the drop down;and this Watchlist is shown bolded in Security Manager)
OR
2. In the Scan Definition use the “Securities” tab to locate and specify one or more.
•17
33
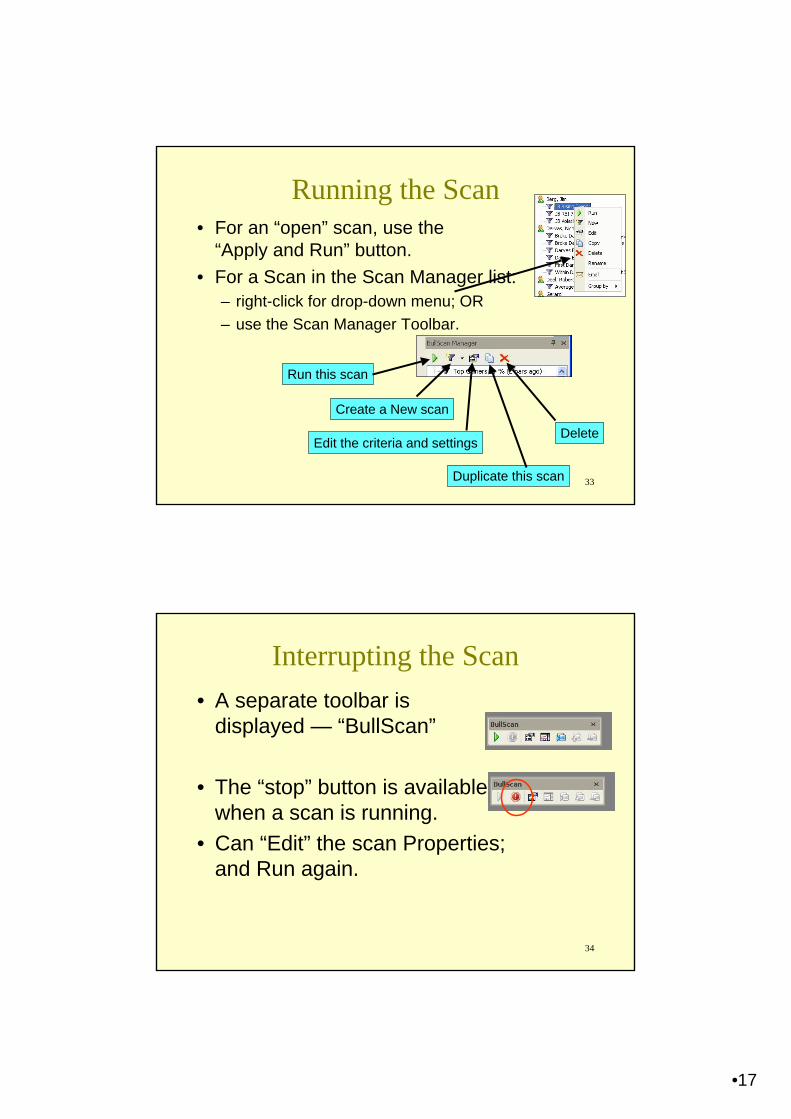
Running the Scan• For an “open” scan, use the
“Apply and Run” button.• For a Scan in the Scan Manager list:
– right-click for drop-down menu; OR– use the Scan Manager Toolbar.
Run this scan
Create a New scan
Duplicate this scan
Edit the criteria and settingsDelete
34
Interrupting the Scan• A separate toolbar is
displayed — “BullScan”
• The “stop” button is availablewhen a scan is running.
• Can “Edit” the scan Properties;and Run again.
•18
35
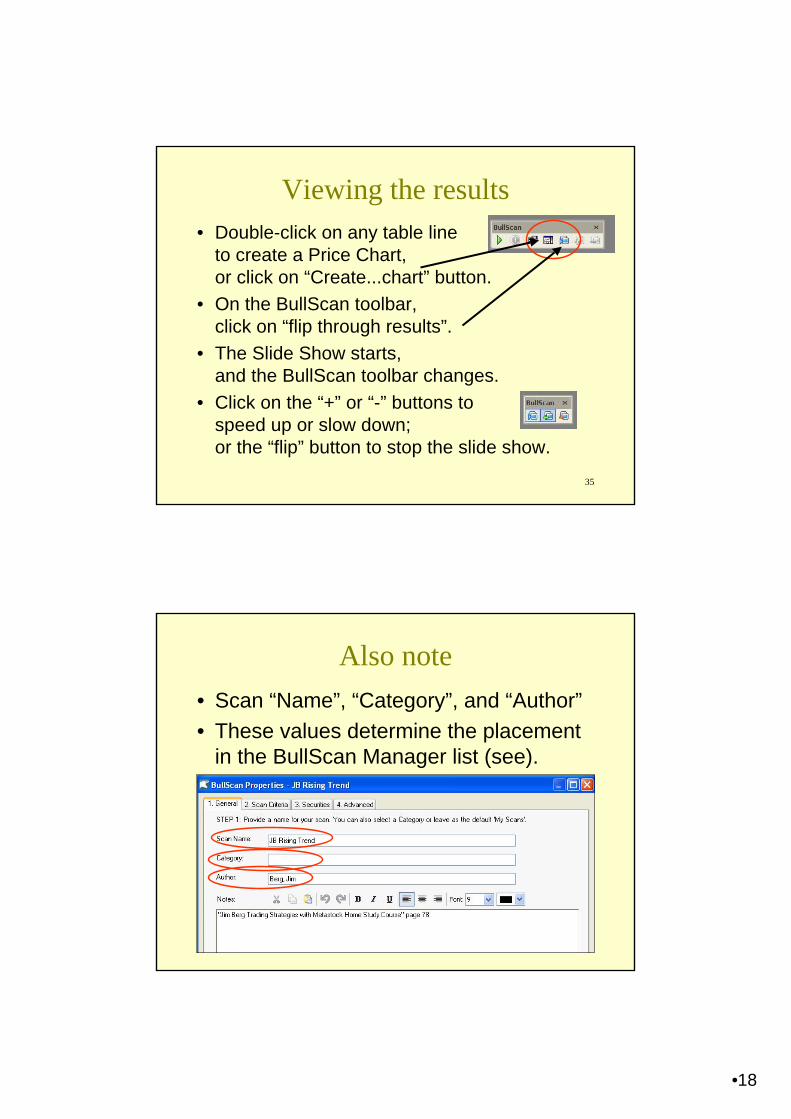
Viewing the results• Double-click on any table line
to create a Price Chart,or click on “Create...chart” button.
• On the BullScan toolbar,click on “flip through results”.
• The Slide Show starts,and the BullScan toolbar changes.
• Click on the “+” or “-” buttons tospeed up or slow down;or the “flip” button to stop the slide show.
36
Also note• Scan “Name”, “Category”, and “Author”• These values determine the placement
in the BullScan Manager list (see).
•19
37
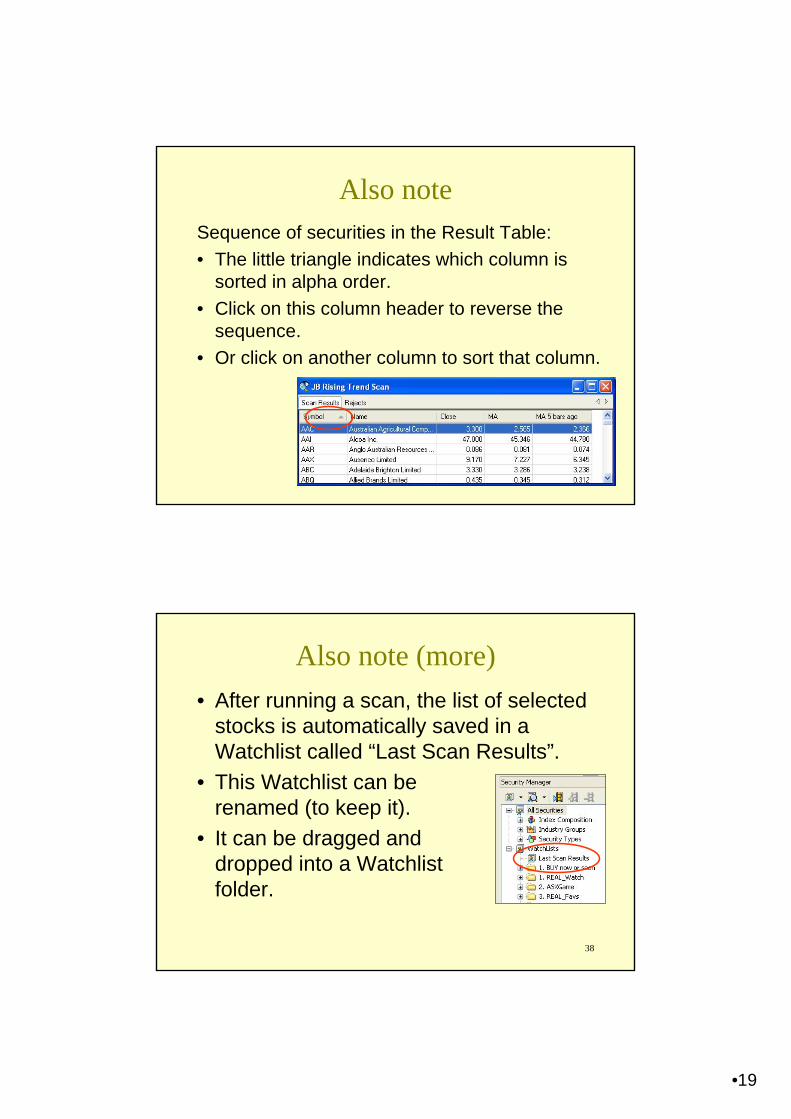
Also noteSequence of securities in the Result Table:• The little triangle indicates which column is
sorted in alpha order.• Click on this column header to reverse the
sequence.• Or click on another column to sort that column.
38
Also note (more)• After running a scan, the list of selected
stocks is automatically saved in a Watchlist called “Last Scan Results”.
• This Watchlist can berenamed (to keep it).
• It can be dragged anddropped into a Watchlistfolder.
•20
39
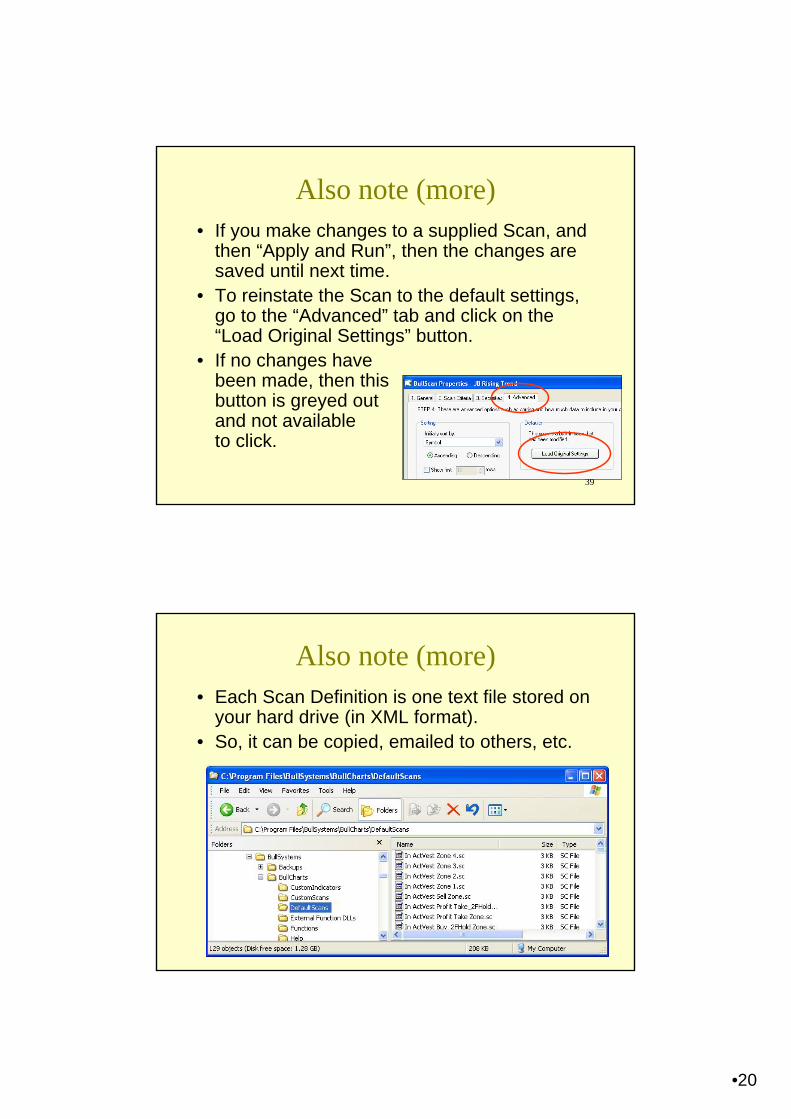
Also note (more)• If you make changes to a supplied Scan, and
then “Apply and Run”, then the changes are saved until next time.
• To reinstate the Scan to the default settings, go to the “Advanced” tab and click on the “Load Original Settings” button.
• If no changes have been made, then this button is greyed out and not available to click.
40
Also note (more)• Each Scan Definition is one text file stored on
your hard drive (in XML format).• So, it can be copied, emailed to others, etc.
•21
41
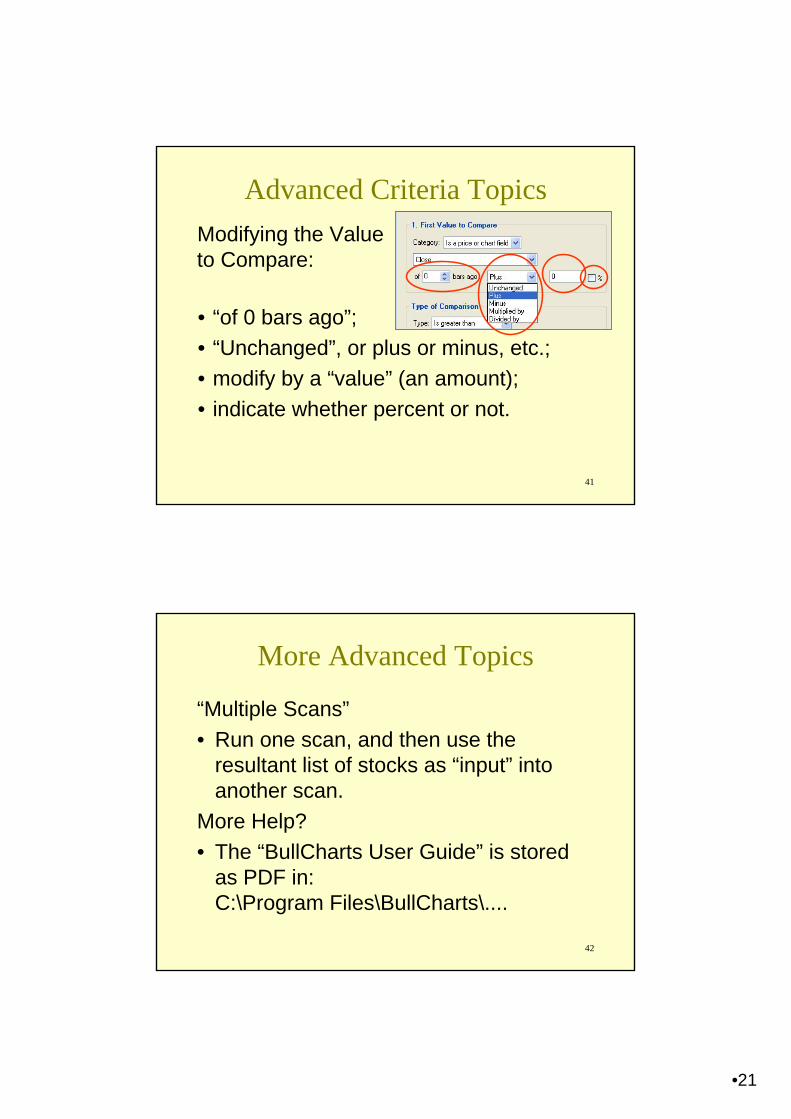
Advanced Criteria TopicsModifying the Value to Compare:
• “of 0 bars ago”;• “Unchanged”, or plus or minus, etc.;• modify by a “value” (an amount);• indicate whether percent or not.
42
More Advanced Topics
“Multiple Scans”• Run one scan, and then use the
resultant list of stocks as “input” into another scan.
More Help?• The “BullCharts User Guide” is stored
as PDF in: C:\Program Files\BullCharts\....
•22
43
Summary• BullScan Manager and scans.• Very powerful; but• basic scans are easy to create and
modify; and• more can be done.
• (eg. BullScript in scans - not covered here)
44
Further commentsor
observations?