Embed Size (px)
Citation preview

Journal of Supply Chain Management, Volume 3, Issue 5, 2020; www.grandmarkpublishers.com
BULLWHIP EFFECT ON INVENTORY MANAGEMENT IN KENYAS’ PARASTATALS
AT NEW KENYA COOPERATIVE CREAMERIES LIMITED
Sostanis Okoth, Dr Pamela Getuno
2020

1
Journal of Supply Chain Management, Volume 3, Issue 5, 2020; www.grandmarkpublishers.com
BULLWHIP EFFECT ON INVENTORY MANAGEMENT IN KENYAS’ PARASTATALS
AT NEW KENYA COOPERATIVE CREAMERIES LIMITED
1A student in Master in Procurement and Logistics Jomo Kenyatta University of
Agriculture and Technology
2Senior Lecturer in the College of Human Resource Management of Jomo Kenyatta
University of Agriculture and Technology
Abstract
The dairy sector had suffered so much due to lack of commitment to timely funding of materials
procurement, poor material planning, poor inventory control, purchasing problems, quality
control problems; stores control problems, material movement and surplus disposal problems.
Lack of integrated inventory management has affected performance at New KCC hence reduced
profits in the downstream chain hence leading to loss of chain profits. New KCC has been
affected by poor inventory management related cases leading to low performance which caused
erratic deliveries in the firm, late deliveries and inflexibility hence affecting customer satisfaction
within their downstream chain. The study seeks to establish the Bullwhip effect on inventory
management of the New Kenya Cooperative Creameries Limited. The specific objectives are to
establish the effect of demand forecast updating, order batching, price fluctuations, shortage
gaming and rationing on the inventory management at the New Kenya Cooperative Creameries
Limited. The study used Institutional theory which influences organizational outcomes by
imposing constrains on firms’ operations. The Supply Chain Operations Reference theory
provides a unique framework that links performance metrics, processes, best practices, and people
into a unified structure. Theory of Change provides a comprehensive picture of the early- and
intermediate-term changes in a given institution. Dynamic Capability theory helps identify the
factors likely to impact enterprise performance. This study used a descriptive research design. The
target population of this study are the 303 employees of New Kenya Cooperative Creameries
Limited based in the head office in Nairobi City, Nairobi County. The sampling frame was sales
and marketing; procurement; directors, finance, communication, supply chain, transport managers
& supervisors; and production managers & supervisors at the New Kenya Cooperative
Creameries Limited head office in Nairobi and stratified sampling technique was used. The study
utilized primary data and data was collected using questionnaires as data collection instrument.
The study carried out a pilot study to test reliability and validity of the data collected. The study
selected a pilot group of 10 individuals from the target population. Data analysis was done with
the use of SPSS version 23 and presented using percentages, tabulations, means and other central
tendencies. Content analysis was used to analysed the qualitative data. The relationship between
the four independent variables and the dependent variables was tested using multiple regression
analysis and the significance of the relationship was tested using ANOVA analysis. The Study
opines that demand forecast updating, order batching, price fluctuations, shortage gaming and
rationing significantly affects inventory management at the New Kenya Cooperative Creameries
Limited.

2
Journal of Supply Chain Management, Volume 3, Issue 5, 2020; www.grandmarkpublishers.com
1 INTRODUCTION
The Bullwhip Effect is an observed phenomenon in forecast-driven distribution channels. The
effect indicates a lack of synchronization among supply chain members. Even a slight change in
customer sales ripples backward in the form of amplified oscillations upstream, resembling the
result of a flick of a bullwhip handle (Lee, Padmanabhan & Whang, 2016). The concept has its
roots in Forrester's Industrial Dynamics (Forrester, 2011). Since customer demand is rarely
perfectly stable, businesses must forecast demand in order to properly position inventory.
Variability coupled with time delays in the transmission of information up the supply chain and
time delays in manufacturing and shipping goods down the supply chain create the Bullwhip
Effect (Lee, Padmanabhan & Whang, 2016).
Wisner and Leong (2011) define inventory management is the process of efficiently overseeing
the constant flow of units into and out of an existing inventory. This process usually involves
controlling the transfer in of units in order to prevent the inventory from becoming too high, or
dwindling to levels that could put the operation of the company into jeopardy. Agus and Noor
(2010) proper inventory management also seeks to control the costs associated with the inventory,
both from the perspective of the total value of goods included and the tax burden generated by the
cumulative value of the inventory.
Managing inventory efficiently has become an important operational weapon for products and
service firms wishing to survive the competitive pressures. Most of these firms hold inventory so
as to meet their customers’ needs. Inventory therefore constitutes the most significant part of
current assets of these firms and because of the relative largeness of inventories maintained by the
firms, a considerable amount of fund is being committed to holding inventory (Sharma, 2016). It
thus becomes essential to deploy cutting-edge techniques to manage inventories so as to avoid
lost sales, costs of changing production rates, overtime costs, sub-contracting, unnecessary cost of
sales and backorder penalties during periods of peak demand (Chen, Murray & Owen,
2015).Inventory management has enabled firms to have adequate quantities of high quality items
available to serve customer needs, while also minimize the costs of carrying inventory (Brigham
& Gapenski, 2013). Many firms have not yet established how much to invest in inventories and
the right inventory levels to hold so as satisfy customers. Too much inventory consumes physical
space, creates a financial burden, and increases the possibility of damage, spoilage and loss. On
the other hand, too little inventory often disrupts manufacturing operations, and increases the
likelihood of poor customer service. Effort must be made by management to decide on the
optimum investment in inventory since it costs more money to tie down capital in excess
inventory (Lysons & Farrington, 2016).
The Research Problem
Mutwol (2015) studied the impact of the collapse of KCC and found that the sector had suffered
so much due to lack of commitment to timely funding of materials procurement, poor material
planning, poor inventory control, purchasing problems, quality control problems, stores control
problems, material movement and surplus disposal problems. Lack of integrated inventory

3
Journal of Supply Chain Management, Volume 3, Issue 5, 2020; www.grandmarkpublishers.com
management has affected performance at New KCC hence reduced profits in the downstream
chain hence leading to loss of chain profits (Otieno, 2016). In 2014 New KCC was affected by
poor inventory management related cases leading to low performance which caused erratic
deliveries in the firm, late deliveries and inflexibility hence affecting customer satisfaction within
their downstream chain (Mutwol, 2015). The volumes of milk in Kenya increased from 5 billion
in year 2015 to 5.4 billion litres in the country in the year 2016 New KCC (2016) thus there is
need for proper management in the industry.
Initially the problem that faced companies was the bullwhip effect which is variation in demand
and goods produced for stocking in large warehouses. This might not have been a good strategy
since it was prone to too much inventory against unforecasted demand (Christopher, 2015). The
excess inventory would easily lead to higher inventory holding costs and risks including possible
obsolescence. However, today the reversed bullwhip effect seems to be the major problem facing
firms. (Stock, Greis, & Kasarda, 2014). Effective management of bullwhip effect and hence
inventory management can lead to a reduction in cost, resulting in a significant saving. A
potential 6% saving on total cost through effective inventory management is achievable (Barratt,
2014). Studies have been done on the effect of bullwhip on inventory management; Buchmeister,
Pavlinjek and Palcic (2015) studied bullwhip effect problem in supply chains in Slovenia and
deduced increasing variability of production orders and stocks up the supply chain. The effect
indicated a lack of synchronization among supply chain members because of corrupt key
information about actual demand. Locally, Otieno, Ondiek and Odhiambo (2012) attempted to
find out factors causing reversed bullwhip effect on the supply chains of Kenyan firms and
suggested that capacity constraint was the major factor contributing to supply chain inefficiency.
The supply chain was inefficient because of capacity challenges and government intervention.
The above studies have been done in different contexts and thus this study seeks to fill the gap by
focusing on the bullwhip effect on inventory management in Kenya’s’ parastatals with reference
to New Kenya Cooperative Creameries Limited.
Objectives of the Study
The main objective of the study was to examine the Bullwhip effect on inventory management of
the New Kenya Cooperative Creameries Limited. The specific objectives were:-
To establish the effect of demand forecast updating on inventory management at the New Kenya
Cooperative Creameries Limited.
To assess the effect of order batching on inventory management at the New Kenya Cooperative
Creameries Limited.
To analyze the effect of price fluctuations on inventory management at the New Kenya
Cooperative Creameries Limited.
To determine the effect of shortage gaming and rationing on inventory management at the New
Kenya Cooperative Creameries Limited.
LITERATURE REVIEW

4
Journal of Supply Chain Management, Volume 3, Issue 5, 2020; www.grandmarkpublishers.com
Theoretical Review
Institutional Theory
The institutional environment is defined as an entity that lies outside the boundaries of the
organization. It influences organizational outcomes by imposing constrains on firms’ operations
and demanding adaptation of firms’ processes in order to survive. Institutional theory is
recognized through the pressures of social, cultural, political, and legal sector as main factors
influencing the operation of organizations (Yang & Sheu, 2011). Furusten, (2013) indicated that
according to the institutional approach under organizational field, there are three mechanisms of
pressures by which imitations (isomorphism) in structure and processes between organizations are
motivated: coercive, mimetic, and normative. Coercive isomorphism derives from formal and
informal pressures carried out on organizations by other organizations upon which they depend.
Such forces can be exerted through persuasion, invitation to join shared behavioral models, laws
and regulations, and government mandates.
Supply Chain Operations Reference Theory
The Supply Chain Operations Reference model provides a unique framework that links
performance metrics, processes, best practices, and people into a unified structure (Lysons &
Farrington, 2016). The framework supports communication between supply chain partners and
enhances the effectiveness of supply chain management, technology, and related supply chain
improvement activities. Business value, whether real or perceived, is derived from the
predictability and sustainability of business outcomes (Lysons & Farrington, 2016). Value is
articulated by measuring what is being managed. The SCOR model helps refine strategy, define
structure (including human capital), manage processes, and measure performance (Larsson,
2008).
An organization’s annual strategic priorities are manifest in SCOR’s vertical process integration.
Organizations that have applied SCOR to help with supply chain problem solving, process
improvement, process redesign, or business process engineering, have demonstrated that SCOR is
an effective enabler for aligning an organization’s portfolio of improvement projects with
strategic goals and objectives. SCOR processes extend from your supplier’s supplier to your
customer’s customer. This includes all customer interactions from order entry through paid
invoice; all product (physical material and service) transactions, including equipment, supplies,
spare parts, software, etc.; and all market interactions, from understanding aggregate demand to
the fulfillment of each order (Lee et al., 2016).
Theory of Change
Andreson (2015) states that a theory of change (TOC) is the product of a series of critical-
thinking exercises that provides a comprehensive picture of the early- and intermediate-term
changes in a given community that are needed to reach a long-term goal articulated by the
community or the government. Government initiatives are sometimes planned without an explicit
understanding of the early and intermediate steps required for long-term changes to occur;

5
Journal of Supply Chain Management, Volume 3, Issue 5, 2020; www.grandmarkpublishers.com
therefore, many assumptions about the change process need to be examined for program planning
or evaluation planning to be most effective. A TOC creates an honest picture of the steps required
to reach a goal. It provides an opportunity for stakeholders to assess what they can influence,
what impact they can have, and whether it is realistic to expect to reach their goal with the time
and resources they have available (Andreson, 2015)According to Clark and Dana (2012) theory of
Change is a specific type of methodology for planning, participation, and evaluation that is used
in the philanthropy, non-profit and government sectors to promote social change. Theory of
Change defines long-term goals and then maps backward to identify necessary preconditions.
Dynamic Capability Theory
Dynamic capability is defined as the firm’s ability to integrate, build and reconfigure internal and
external competences to address rapidly changing environments to attain new and innovative
forms of competitive advantage (Teece et al., 2010). The Dynamic Capabilities Framework helps
identify the factors likely to impact enterprise performance. It is gradually developing into a
(interdisciplinary) theory of the modern corporation (Teece, 2010). Dynamic capabilities have
lent value to the RBV arguments as they transform what is essentially a static view into one that
can encompass competitive advantage in a dynamic context (Barney, 2008). Dynamic capabilities
are “the capacity of an organization to purposefully create, extend or modify its resource base”
(Hunt & Kern, 2012).
Teece (2010) recognizes that dynamic capabilities help sustain firm’s evolutionary fitness by
enabling the creation, extension and modification of its resource base thereby creating long-run
competitive success. While some see dynamic capabilities as the key to competitive advantage
(Teece et al., 2010), others seem to doubt that there is actually such a thing. Dynamic capabilities
can usefully be thought of as belonging to three clusters of activities and adjustments: Firstly,
identification and assessment of an opportunity (sensing); secondly, mobilization of resources to
address an opportunity and to capture value from doing so (seizing); and thirdly continued
renewal (transforming). These activities are required if the firm is to sustain itself as markets and
technologies change (Teece, 2010).

6
Journal of Supply Chain Management, Volume 3, Issue 5, 2020; www.grandmarkpublishers.com
.
Dependent Variable
Independent variables
Empirical Review
The section deliberates on the review of the existing empirical literatures on implementation of
water projects.
Demand Forecast Updating
According to a study by Whang et al., (2012) on analyzing the Bullwhip Effects in Supply Chains
at P&G, concluded that every company in a supply chain usually does product forecasting for its
production scheduling, capacity planning, inventory control, and material requirements planning.
Forecasting is often based on the order history from the company's immediate customers. The
outcomes of the beer game are the consequence of many behavioral factors, such as the players'
Demand Forecasting Updating
Capacity planning
Facility planning
Inventory levels
selection
Order Batching
Correlated ordering
Random ordering
Balanced ordering
Price Fluctuations
Product demand
Product Supply
Current economic
conditions
Shortage Gaming & Rationing
Promotions
Free Return Policy
Anticipated price
change
Inventory
Management
Efficiency
Effectiveness
Customer
Satisfaction

7
Journal of Supply Chain Management, Volume 3, Issue 5, 2020; www.grandmarkpublishers.com
perceptions and mistrust. An important factor is each player's thought process in projecting the
demand pattern based on what he or she observes.
A study by Caroll and Rao (2014) while attempting to establish the causes and remedies of
Bullwhip Effect in supply chains established that when a downstream operation places an order,
the upstream manager processes that piece of information as a signal about future product
demand. Based on this signal, the upstream manager readjusts his or her demand forecasts and, in
turn, the orders placed with the suppliers of the upstream operation. With exponential smoothing,
future demands are continuously updated as the new daily demand data become available. The
order you send to the supplier reflects the amount you need to replenish the stocks to meet the
requirements of future demands, as well as the necessary safety stocks. The future demands and
the associated safety stocks are updated using the smoothing technique. With long lead times, it is
not uncommon to have weeks of safety stocks.
Order Batching
A study by Ryan (2011) titled “Analysis of Inventory Models with Limited Demand Information”
concluded that in a supply chain, most companies’ batches or accumulate demands before issuing
an order. Instead of ordering frequently, companies may order weekly, biweekly or even monthly.
There are many reasons for ordering in batches. For example, a company might order a full truck
or container load from its supplier to receive a quantity discount and minimize transport costs.
Many manufacturers order from their suppliers after they ran their material requirements planning
(MRP) systems. These (MRP) systems often run once a month, resulting in a highly erratic stream
of orders.According to Sterman (2010) study on misperceptions of feedback in a dynamic
decision-making experiment stated that when a company faces periodic ordering by its
downstream neighbor, it sees a higher variability in demand than the downstream neighbor itself.
Periodic ordering amplifies variability and therefore contributed to the bullwhip effect. This effect
is small if all customers' order cycles were spread out evenly throughout time in a deterministic
way. Unfortunately, orders are more likely to be randomly spread out or worse, to be correlated.
When order cycles are correlated, most customers order at more or less the same time. This results
in even higher peaks and higher variability.
Price Fluctuations
According to Wilck (2013) study on the bullwhip effect on inventory management established
that companies often buy items in advance of requirements. This forward buying" results from
price fluctuations due to special promotions like price discounts, quantity discounts and coupons.
The result is that companies buy in quantities that do not affect their immediate needs. They often
buy in bigger quantities and stock up for the future. If the cost of holding inventory is less than
the price difference, buying in advance may well be a rational decision. However, when
companies buy more than needed and wait until their inventory is depleted, the variation of the
buying quantities is much bigger than the variation of the consumption rate, which leads to the
bullwhip effect.A study by Lee et al., (2012) study on the Bullwhip Effect in supply chains gave
an example of sale and order patterns of chicken noodle soup from shows how high-low buying
practices can lead to high variability in shipments from manufacturer to distributors. Such wide

8
Journal of Supply Chain Management, Volume 3, Issue 5, 2020; www.grandmarkpublishers.com
swings often force companies to run their factories overtime at certain times and to be idle at
others. Alternatively, companies may have to build huge piles of inventory to anticipate on big
swings in demand. On the other hand, if the manufacturer would not do price discounting, a
competitor who does, might take over its business. Thus, order batching leads to the bullwhip
effect and the effect is the strongest when the periods in which retailers place their orders are
correlated. The effect is weaker, when these periods are random and the weakest if they are
evenly distributed in time. If the order periods can be balanced completely, that is, if N is a
multiple of R, the bullwhip effect due to order batching does not occur.
Shortage Gaming and Rationing
According to Hunt & Kern (2012), study on seasonal and cyclical behaviour of farm gate milk
prices stated that when product demand exceeds supply, a manufacturer often rations its product
to customers. For example, the manufacturer then allocates its products in proportion to the
amount ordered by the different retailers. Retailers often anticipate on potential shortages by
exaggerating their real needs when they order. If demand drops later, this led to small orders and
cancellations.
A study by Graves (2009), titled: A single-item inventory model for a non stationary demand
process; states that manufacturing & service operations management call this overreaction by
customers, rationing and shortage gaming. This ‘’gaming" results in misleading information on
the product's real demand. To illustrate the effects of rationing gaming on the variance
amplification, consider a supply chain consisting of a manufacturer, multiple wholesalers, and
multiple retailers. If the manufacturer appears to be in short of supply, wholesalers played the
rationing game to get a large share of the supply.
A study by Fransoo & Wouters (2010) on measuring the bullwhip effect in the supply chain
concluded that assessing a possibility of the wholesaler not getting enough from the manufacturer,
retailers also play the rationing game. The effect is that demand and its variance are amplified as
one moves up the supply chain. In practice, there are many examples of this rationing and
shortage gaming. One example is the shortage of DRAM chips in the 1980's. In the computer
industry, orders for these chips grew fast, not because a growth in customer demand, but because
of anticipation. Customers placed duplicate orders with multiple suppliers and bought from the
first one that could deliver, then cancelled all other duplicate orders.
Inventory Management
According to a study by Ledman (2011) on the effect of information technology in amelioration
of bullwhip effect in supply chain in the dairy industry it was deduced that the integration of
information technology allows for the efficient transmission of information throughout the supply
chain which in-turn facilitates supply chain integration for amelioration of bullwhip effect. These
analyses of dairy industry retail outlets and suppliers is deliberated in terms of common strategic
diffusion of the central supply chain distribution (CscD) system, supply chain structure, supply
chain information technology, inventory management, expansion to African countries, improved
efficiency and effect of order variability.Armstrong and Green (2015) study on the influence of
Transaction Cost Economics and the Resource-based View on the Outsourcing Process states that

9
Journal of Supply Chain Management, Volume 3, Issue 5, 2020; www.grandmarkpublishers.com
in the retail perspective, the retailers must constantly look beyond the organisational boundaries
to evaluate and integrate the resources and capabilities of their suppliers and customers. To a
certain extent, this approach created superior value and a competitive advantage that companies
might sustain over time. Competitive advantage implies the creation of a system that has a unique
advantage over competitors to create customer value in an efficient and sustainable way.
Methodology
The study employed both qualitative and quantitative data analysis methods. Qualitative research
provided insights and understanding while quantitative data was used to generalize those insights
to a population pattern. Quantitative data was edited, summarized and coded for easy
classification in order to facilitate interpretation of the data expressed in the form of figures, tables
and charts. The data was analyzed using SPSS. Qualitative data was analyzed by content analysis.
ANOVA was used to test the significance of the fitted model. Data was presented in the form of
charts, tables and figures. Qualitative methods of data analysis were adopted to analyze the study
variables. To minimize subjectivity and make it possible to measure qualitative data the Likert
scale method and open-ended questions was used. The numbers in the Likert scale were ordered
such that they showed the absence or presence of the measurable characteristic (Kothari and
Gang, 2014). This mix of information was important as it gave out wide array of information in
regards to the study.
Further, Pearson's product moment correlation analysis and it's a powerful technique for exploring
the relationship among variables was used. Correlation coefficient was also used to analyze the
strength of the relations between variables. In addition, to know the strength of the variable
association, a correlation coefficient was also calculated.
A sequence of multiple regression analysis was used because they provide estimates of net effects
and explanatory power. Analysis of variance (ANOVA) was used to test the significance of the
model. R2 was used in this research to measure the extent of goodness of fit of the regression
model. The multiple linear was used to estimate the coefficient was as follows:
Y = α + β0 + β1X1 + β2X2 + β3 X3 + β4 X4 + є
Where: α = Constant Term; β1 = Demand Forecasting Updating coefficient; β2 = Order Batching
coefficient; β3 = Price Fluctuations coefficient; β4 = Shortage Gaming and Rationing coefficient;
Y = Inventory Management; X1 = Demand Forecasting Updating; X2 = Order Batching; X3 =
Price Fluctuations; X4 = Shortage Gaming and Rationing
Results
Test of Multicollinearity
Multicollinearity is a measurable marvel in which at least two indicator variables in a different
relapse model are profoundly connected, the bothersome circumstance where the relationships
among the autonomous factors are solid. A lot of factors are impeccably 103 multicollinear if
there exists at least one accurate direct relationship among a portion of the factors. Resistance of
the variable and the VIF esteem were utilized where esteems more than 0.2 for resilience and
qualities under 10 for VIF implies that there is no multicollinearity. For numerous relapses to be

10
Journal of Supply Chain Management, Volume 3, Issue 5, 2020; www.grandmarkpublishers.com
pertinent there ought not be solid relationship among factors. Insights used to quantify
multicollinearity incorporate resilience and fluctuation swelling factor. From the discoveries, the
factors had a resilience esteems >0.2 and VIF values <10 as appeared in table 1 show that there is
no multicollinearity among the autonomous factors.
Table 1: Multicollinearity test for Tolerance and VIF
Study Variable Collinearity Statistics
Tolerance VIF
Demand Forecasting Updating 0.621 1.612
Order Batching 0.530 1.887
Price Fluctuations 0.568 1.759
Shortage gaming and Rationing 0.548 1.826
Inventory Management 0.542 1.846
Multiple Linear Regressions for all Variables
To assess the model fit, a coefficient of determination was conducted by the study. The adjusted
R Square, usually known as the coefficient of multiple determinations, embodies a percentage of
variance in the dependent variable explained together or differently by the independent variables.
From the model fit, we got an average adjusted coefficient of determination (R Square) of 0.884
signifying that 78.4% of the variations in implementation of water projects could be described by
the independent variables under the study (OB: Demand Forecasting Updating DFU: Price
Fluctuations PF : and Shortage gaming and Rationing SGR). The difference of 11.6% is
attributed by other factors that are exclusive of this study
Table 2 Multiple Linear Regressions
Model R R Square Adjusted R Square Std. Error of the
Estimate
1 .891 .794 .884 .317
Table 3 ANOVA for Multiple Regression Analysis
Model Sum of Squares df Mean Square F Sig.
1
Regression 26.481 5 5.296 7.23 0.004
Residual 158.217 216 0.732
Total 184.698 221
The ANOVA test is used to determine whether the model is important in predicting the Inventory
Management. At 0.05 level of significance the ANOVA test indicated that in this model the
11
Journal of Supply Chain Management, Volume 3, Issue 5, 2020; www.grandmarkpublishers.com
independent variables namely; Oder batching OB: Demand Forecasting Updating DFU: Price
Fluctuations PF : and Shortage gaming and Rationing SGR were predictors of and Inventory
Management IM as indicated by significance value=0.005 which is less than 0.05 level of
significance (p=0.001<0.05).
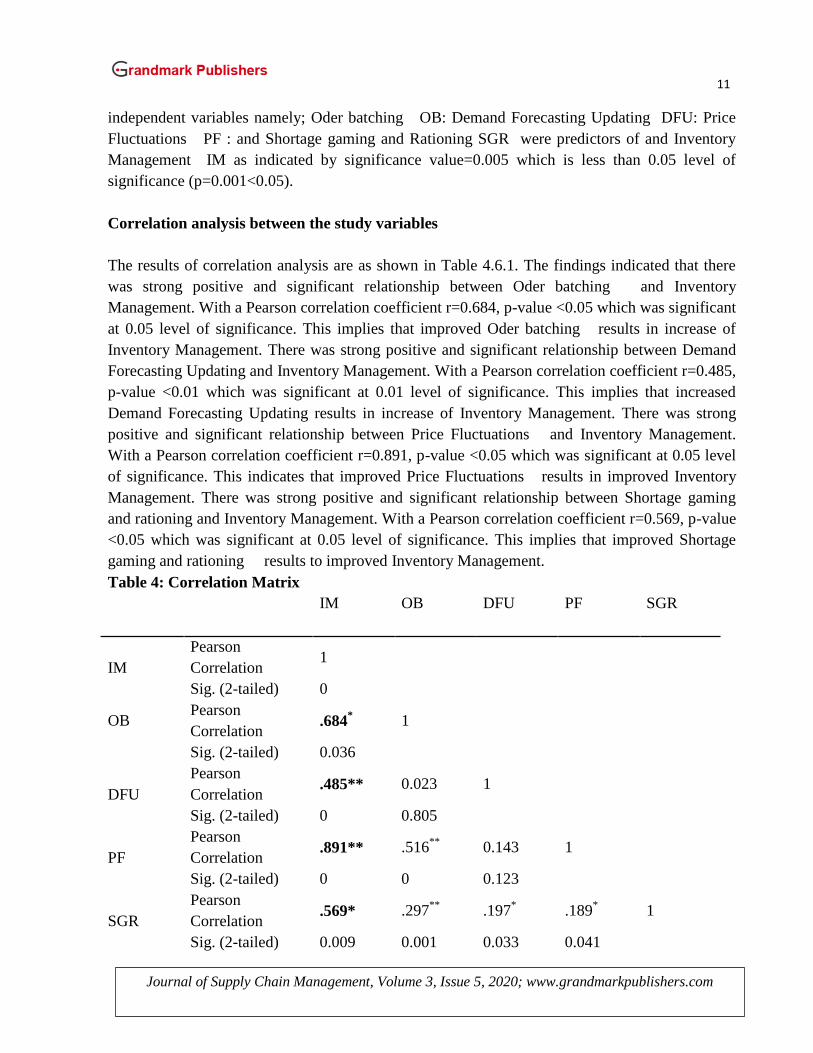
Correlation analysis between the study variables
The results of correlation analysis are as shown in Table 4.6.1. The findings indicated that there
was strong positive and significant relationship between Oder batching and Inventory
Management. With a Pearson correlation coefficient r=0.684, p-value <0.05 which was significant
at 0.05 level of significance. This implies that improved Oder batching results in increase of
Inventory Management. There was strong positive and significant relationship between Demand
Forecasting Updating and Inventory Management. With a Pearson correlation coefficient r=0.485,
p-value <0.01 which was significant at 0.01 level of significance. This implies that increased
Demand Forecasting Updating results in increase of Inventory Management. There was strong
positive and significant relationship between Price Fluctuations and Inventory Management.
With a Pearson correlation coefficient r=0.891, p-value <0.05 which was significant at 0.05 level
of significance. This indicates that improved Price Fluctuations results in improved Inventory
Management. There was strong positive and significant relationship between Shortage gaming
and rationing and Inventory Management. With a Pearson correlation coefficient r=0.569, p-value
<0.05 which was significant at 0.05 level of significance. This implies that improved Shortage
gaming and rationing results to improved Inventory Management.
Table 4: Correlation Matrix
IM OB DFU PF SGR
IM
Pearson
Correlation 1
Sig. (2-tailed) 0
OB Pearson
Correlation .684
* 1
Sig. (2-tailed) 0.036
DFU
Pearson
Correlation .485** 0.023 1
Sig. (2-tailed) 0 0.805
PF
Pearson
Correlation .891** .516
** 0.143 1
Sig. (2-tailed) 0 0 0.123
SGR
Pearson
Correlation .569* .297
** .197
* .189
* 1
Sig. (2-tailed) 0.009 0.001 0.033 0.041

12
Journal of Supply Chain Management, Volume 3, Issue 5, 2020; www.grandmarkpublishers.com
The study concludes by stating that community participation had a strong positive relationship on
successful implementation of water projects. In order to aid in community participation, local
community should participate in implementation decision making matters of the project,
volunteer in implementation activities, identification of water projects of their preference and
community should be selected into water committees. The study results are consistent with
stakeholder’s theory that stresses that in every project exists a group of individuals with interest
which management should endeavor to take care of.
Conclusion
In the examination of the influence of Oder batching, the study concluded that the Oder batching
have a significant influence on Inventory Management. The study also concluded that a unit
increase in Oder batching on their own results in an increase in on Inventory Management.
In the examination of the effect of Demand Forecasting Updating, the study concluded that the
use of Demand Forecasting Updating have a significant influence on Inventory Management. The
study also concluded that a unit increase in the use of Demand Forecasting Updating on its own
results in an increase in Inventory Management.
In the assessment of the influence of Price Fluctuations, the study concluded that the use of Price
Fluctuations has a significant influence on Inventory Management. The study also concluded
that a unit increase in the Price Fluctuations on its own results in an increase in Inventory
Management.
Finally, in the examination of the influence of Shortage gaming and rationing, the study
concluded that Shortage gaming and rationing has a significant influence on Inventory
Management. A unit increase in Shortage gaming and rationing on its own results in an increase
in Inventory Management.
Recommendations
The researcher has suggested pertinent recommendation citing information from theoretical
review and the study findings in line with specific objectives of the study. The main objectives
were Oder batching, Price Fluctuations Shortage gaming and rationing and Demand Forecasting
Updating and their Influence in Inventory Management.
In the context of Oder batching, the study recommends that emphasis be placed on only
framework development that is fool proof. This will ensure that the employees in the procurement
department can competently perform their duties within the department.
In the context of use of Price Fluctuations, the study recommends that more emphasis be put on
collection of information and monitoring price fluctuations using computers for ease of access to
information and for transparency purposes. Within the context of Demand Forecasting Updating,
the research recommends that forecasting models should be put in place to arrest unexpected
demand surge.
Finally, in the context of Shortage gaming and rationing, the research recommends the
implementation of the Shortage gaming and rationing policy which advocates for fair rationing in

13
Journal of Supply Chain Management, Volume 3, Issue 5, 2020; www.grandmarkpublishers.com
every Inventory management. This will guarantee that not only specific people get inventory from
new KCC.
Areas for Further Research
The researcher suggests further research to be conducted to investigate other factors which
influenced Inventory Management for example, environmental factors like infrastructure,
facilities and location. Other scholars could also evaluate external factors that influence Inventory
Management in the other state corporations. Finally, the study suggests for further studies an
examination of determinants of effective inventory management in selected State Corporations in
Kenya.
REFERENCES
Agus, A., & Noor, Z. (2010). Supply chain management and performance: an
empirical study, University of Malaysia, Singapore.
Akcaoz, H., Kizilay, H., & Ozcatalbas, O. (2009). Risk management strategies in dairy farming:
A case study in Turkey. Journal of Animal and Veterinary Advances, 8(5), 949-958.
Ali, J., & Kapoor, S. (2008). Farmers’ perception on risks in fruits and vegetables production:
An empirical study of Uttar Pradesh. Agricultural Economic Research Review, 2(6), 948-
64.
Andreson, A. (2015) An Introduction to Theory of Change. An article from the Evaluation
Exchange, Aspen Institute Roundtable on Community Change, published by the Harvard
Family Research Project, 11 (2), 45-69.
American Psychological Association (2003). Publication Manual of the American psychological
association (5th edition).
Armstrong J., & Green K (2015). Demand Forecasting: Evidence-based Methods. Monash
University, Department of Econometrics and Business Statistics, pp. 17.
Baganha M., & Cohen M.,(2008). The stabilizing effect of inventory in supply chains.
Operations Research; 2(4), 72–83.
Barney, J. B. (2008). Gaining and Sustaining Competitive Advantage. Addison – Wesley
Publishing Company, New York
Barratt, M. (2014). "Understanding the meaning of collaboration in the supply chain", Supply
Chain Management: An International Journal, Vol. 9 No.1, pp.30-43.

14
Journal of Supply Chain Management, Volume 3, Issue 5, 2020; www.grandmarkpublishers.com
Boute, R. N., Lambrecht, M. R., & Van Houdt, B. (2011). Performance evaluation of a
production/inventory system with periodic review and endogenous lead times. Naval
Research Logistics, 54(4) 462–473.
Brigham, E., & Gapenski, L. (2013). Intermediate Financial Management, Pearson, New York.
Brown, S. 2012. The Effects of a Modified Dairy Security Act of 2011 on Dairy Markets. Report
published by the Integrated Policy Group (IPGr), Division of Applied Social Sciences,
College of Agriculture, Food and Natural Resources (CAFNR), University of Missouri,
April.
Buchmeister, Pavlinjek and Palcic (2015). Bullwhip effect problem in supply chains in Slovenia.
Advances in Production Engineering & Management Journal; Vol 1, pp. 45-55.
Buzzell R. (2011), "The Costly Bargain of Trade Promotion," Harvard Business Review, 6 (8),
141-148
Cachon, G. P., Taylor, R., Glen, M. and Schmidt, N. (2007). In search of the bullwhip effect.
Caplin, S. (2009), ''The Variability of Aggregate Demand with (S,s) Inventory Policies,"
Econometrica, 3rd edition, 5 (9), 1396-1409. Cornell University Press.
Carroll, V., & Rao, A.G. (2014). Implications of Salesforce Productivity, Heterogeneity and
Demotivation: A Navy Recruiter Case Study. Management Science, 32 (11) 1371 - 1388.
Chen, H., Murray, F., & Owen, W. (2015). What actually happened to the inventories of
American companies between 1981 and 2000? Management Science, 51, 7, 1015-31.
Chen, L., & Lee H., (2014). Bullwhip Effect Measurement and Its Implications. Fuqua School of
Business, Duke University, Durham, NC 27708, pp. 12 – 22
Chent, F., Drezner, Z., Jennifer, K., & Simchi-Levi, D. (2012); The Bullwhip Effect: Managerial
Insights On The Impact Of Forecasting And Information On Variability In A Supply
Chain: Department Of Decision Sciences National University Of Singapore
Christopher, M. & Towill, D. (2013). An integrated model for design of agile supply chains.
International Journal of Physical Distribution &Logistics Management.31 (4), 235-46.
Christopher, M. (2015). The agile supply chain: competing in volatile markets. Industrial
Marketing Management, vol.29, n.1, p.37-44.
Cox, A. (2009). "Power, value and supply chain management", Supply Chain Management: An
International Journal, 4 (4), 167 – 175.

15
Journal of Supply Chain Management, Volume 3, Issue 5, 2020; www.grandmarkpublishers.com
Dimitrios, P. (2015). The effect of inventory management on firm performance. International
journal of productivity and performance management, Vol 3, pp. 57-62.
Eisenhardt, K.M., & Martin, J.A. (2000), Dynamic Capabilities: What Are They? Strategic
Management Journal, 21(10), 1105-1121.
Eroglu, C., & Hofer, C. (2011). Lean, leaner, too lean? The inventory-performance link revisited.
Journal of Operations Management, 29, 356–369.
Forrester, J. W. (2011). Industrial dynamics, MIT Press, Cambridge.
Fransoo, J., & Wouters M, (2010). Measuring the bullwhip effect in the supply chain. Supply
Chain Management, 2 (8), 78–89.


![Supply Chain Visibility removing Bullwhip Effect and …Accenture] Supply chain... · Supply Chain Visibility removing Bullwhip Effect and Inventory-Values, challenges and opportunities](https://img.pdfslide.net/doc/110x75/5a7871be7f8b9a87198b5d4e/supply-chain-visibility-removing-bullwhip-effect-and-accenture-supply-chain.jpg)