Embed Size (px)
Citation preview
BURDEKIN REGIONBurdekin catchment water quality targets
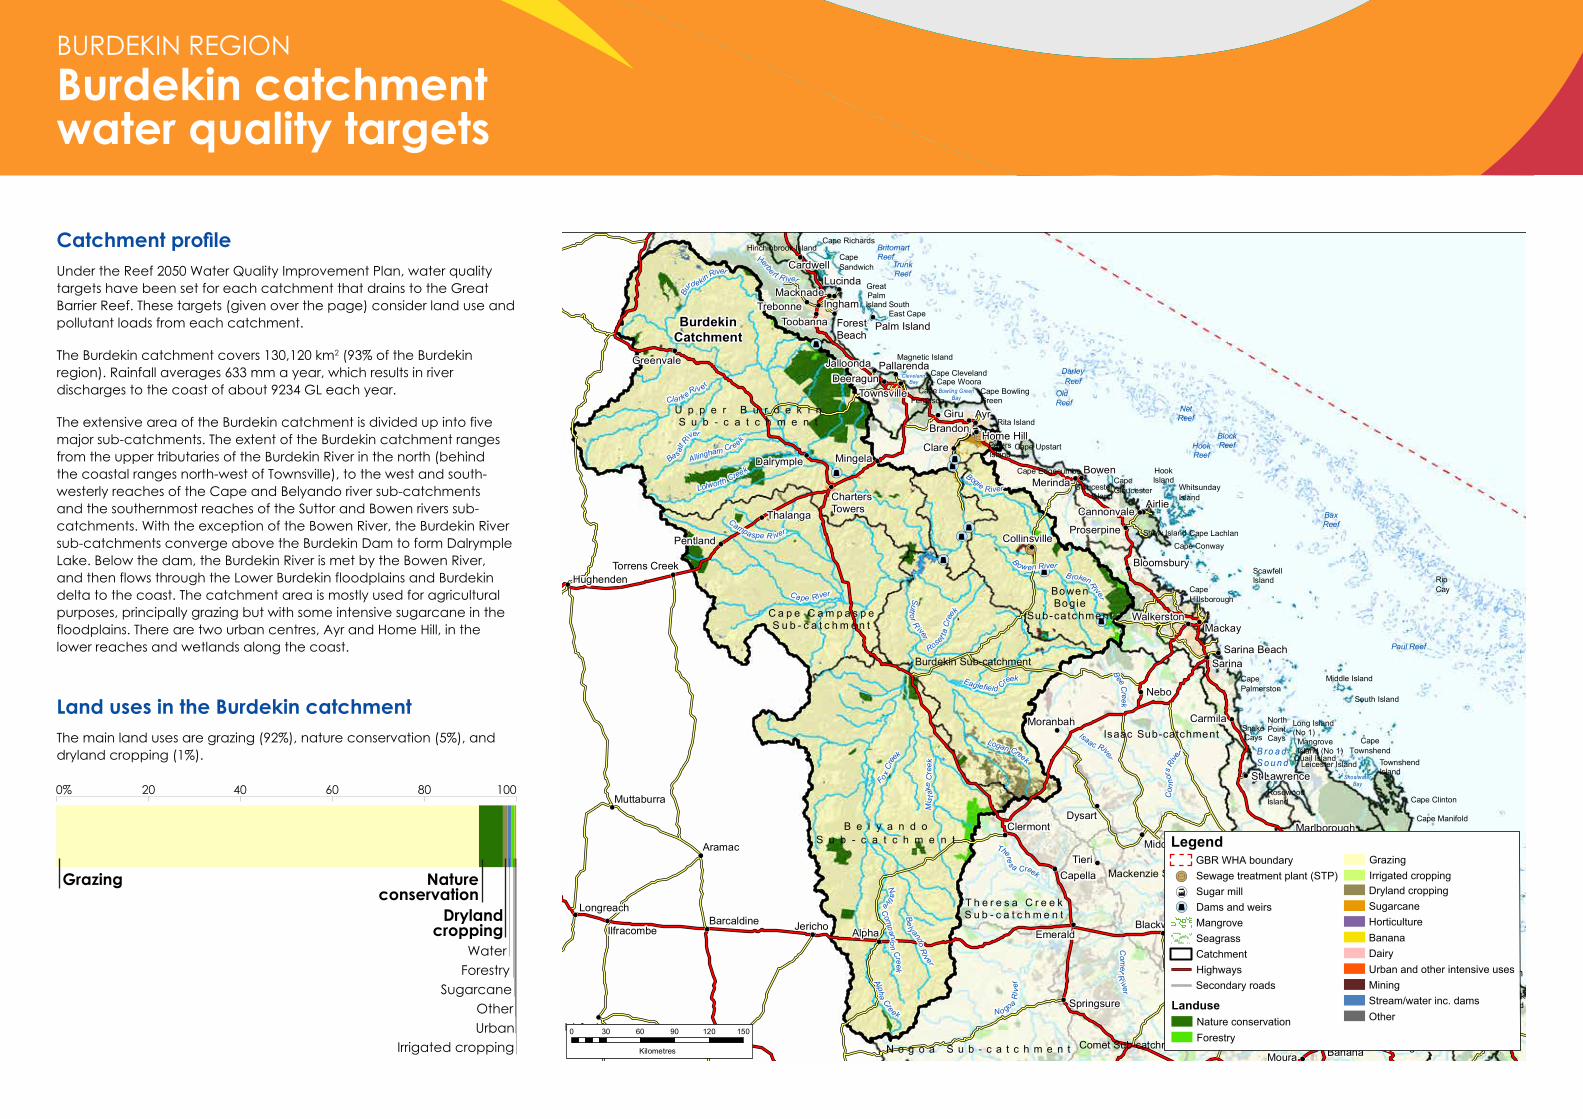
Catchment profileUnder the Reef 2050 Water Quality Improvement Plan, water quality targets have been set for each catchment that drains to the Great Barrier Reef. These targets (given over the page) consider land use and pollutant loads from each catchment.
The Burdekin catchment covers 130,120 km2 (93% of the Burdekin region). Rainfall averages 633 mm a year, which results in river discharges to the coast of about 9234 GL each year.
The extensive area of the Burdekin catchment is divided up into five major sub-catchments. The extent of the Burdekin catchment ranges from the upper tributaries of the Burdekin River in the north (behind the coastal ranges north-west of Townsville), to the west and south-westerly reaches of the Cape and Belyando river sub-catchments and the southernmost reaches of the Suttor and Bowen rivers sub-catchments. With the exception of the Bowen River, the Burdekin River sub-catchments converge above the Burdekin Dam to form Dalrymple Lake. Below the dam, the Burdekin River is met by the Bowen River, and then flows through the Lower Burdekin floodplains and Burdekin delta to the coast. The catchment area is mostly used for agricultural purposes, principally grazing but with some intensive sugarcane in the floodplains. There are two urban centres, Ayr and Home Hill, in the lower reaches and wetlands along the coast.
20 40 60 80 100
Grazing Natureconservation
Drylandcropping
Water
SugarcaneForestry
OtherUrban
Irrigated cropping
0%
Land uses in the Burdekin catchmentThe main land uses are grazing (92%), nature conservation (5%), and dryland cropping (1%).
B e l y a n d oS u b - c a t c h m e n t
Bo we nBo gie
Su b-catchme nt
Burdekin Sub-catchment
C a p e C a m p a s p eS u b - c a t c h m e n t
U p p e r B u r d e k i nS u b - c a t c h m e n t
Comet Sub-catchment
DawsonSub-catchment
Fitzroy Sub-catchment
Isaac Sub-catchment
Mackenzie Sub-catchment
N o g o a S u b - c a t c h m e n t
T h e r e s a C r e e kS u b - c a t c h m e n t
BritomartReef
TrunkReef
HookReef
NetReef
DarleyReef
OldReef
BlockReef
BaxReef
Paul Reef
Hinchinbrook Island
HookIsland
PetersIsland
Rita Island
GloucesterIsland
WhitsundayIsland
Magnetic Island
GreatPalmIsland
ScawfellIsland
Shaw Island
MangroveIsland (No 1)
Long Island(No 1)
South Island
Middle Island
RosewoodIsland
Quail Island TownshendIsland
Curtis Island
HummockHill Island
Facing Island
Great Keppel(Wop-pa) Island
Leicester Island
BalaclavaIsland (No 1)
BalaclavaIsland (No 2)
CasuarinaIsland
RipCay
NorthPointCays
SnakeCays
Cape BowlingGreen
Cape Cleveland
CapeHillsborough
CapeCapricorn
Cape Conway
Cape Clinton
CapeKeppel
CapeGloucester
CapeSandwich
CapePalmerston
Cape Richards
Cape Edgecumbe
Cape Manifold
CapeTownshend
Cape Upstart
CapeFerguson
Cape Woora
SouthEast Cape
Cape Lachlan
ClevelandBay
Bowling GreenBay
B r o a dS o u n d
ShoalwaterBay
ForestBeach
Palm Island
Lucinda
InghamToobanna
TrebonneMacknade
Gladstone
Yeppoon
Emu Park
TannumSands
Miriam ValeBororen
Calliope
Proserpine
Mackay
Townsville
Bowen
Mount Morgan
Hughenden
Thalanga
Muttaburra
Ayr
Pallarenda
Giru
Mingela
JalloondaDeeragun
BrandonHome Hill
Clare
Collinsville
Merinda
Airlie
Bloomsbury
Walkerston
Nebo
SarinaSarina Beach
Alpha Emerald
Springsure
Rockhampton
Clermont
St Lawrence
Marlborough
Moranbah
Dysart
Middlemount
Capella
BlackwaterDingo
Bluff
Woorabinda
BananaBiloela
ThangoolMoura
Greenvale
Torrens Creek
Pentland
Dalrymple
Isisford
Aramac
Ilfracombe Jericho
Blackall
LongreachBarcaldine
Cardwell
Keppel Sands
Mount LarcomBoyne Island
ChartersTowers Cannonvale
Carmila
Tieri
Duaringa
Baralaba
Gracemere
BurdekinCatchment
Eaglefield Creek
B rokenR
iver
Con
nors
Rive
r
Fo xC
reek
BeeC
reek
Roset t
aC
re
ek
Bogie
River
Logan Creek
B owen River
AlphaCreek
Allingham Cr eek
Callide Cr eek
Pla
netC
reek
DawsonR
i ver
Cla rk eRive r
Com
etR
iverBa
salt R
iver
Campa spe R iver
Mim
osa Creek
Mis
take
Cre
e k
Herbe rt R iver
Lolworth Creek
NativeC
omp
anion
Creek
Theres a Creek
Belyando
River
Isaac River
Fitzroy River
Cape River
No goaR
i ver
Mackenz ieRiver
Suttor R
iver
Bu
rdekinRiver
0 30 60 90 120 150
Kilometres
C:\WORKING\3_WORK\Nyssa\GBR catchments map_A4P_v03_Jeremy_Edit_Burdekin.mxd23 August 2017
Page of
LanduseNature conservationForestry
GrazingIrrigated croppingDryland croppingSugarcaneHorticultureBananaDairyUrban and other intensive usesMiningStream/water inc. damsOther
Legend
!(T
MangroveSeagrass
Sewage treatment plant (STP)Sugar mill(B
[
Ý
Z Dams and weirs
GBR WHA boundary
CatchmentHighwaysSecondary roads
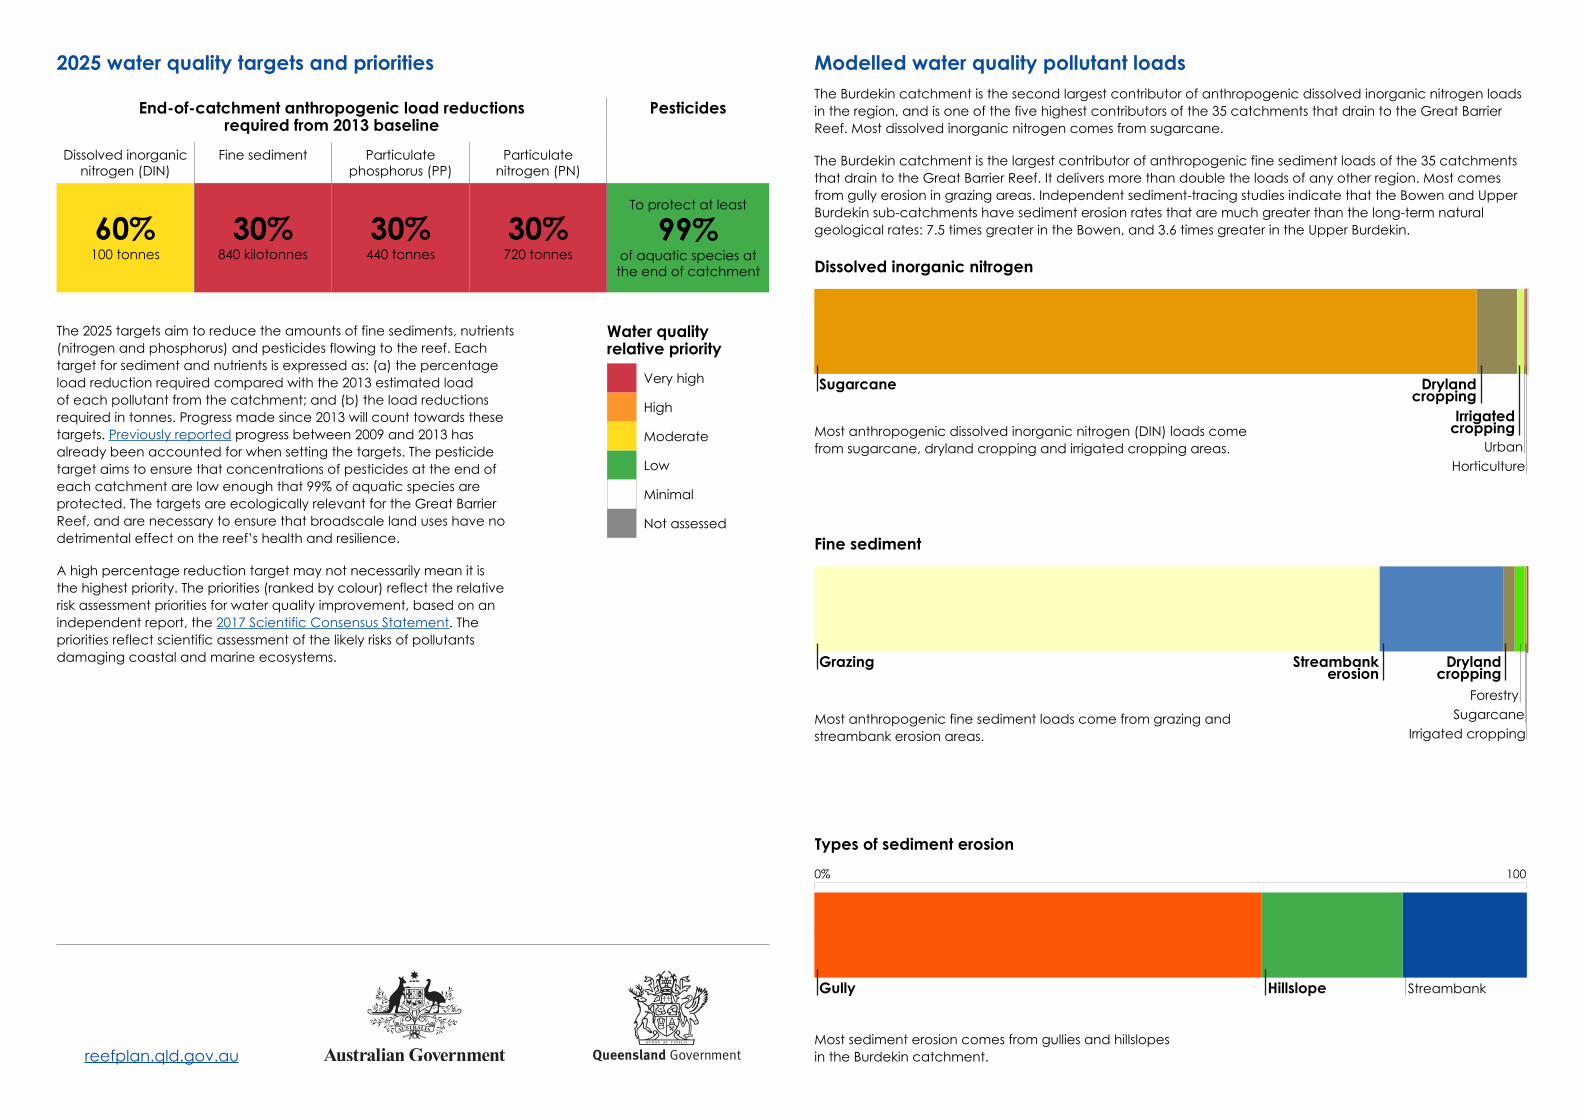
Modelled water quality pollutant loadsThe Burdekin catchment is the second largest contributor of anthropogenic dissolved inorganic nitrogen loads in the region, and is one of the five highest contributors of the 35 catchments that drain to the Great Barrier Reef. Most dissolved inorganic nitrogen comes from sugarcane.
The Burdekin catchment is the largest contributor of anthropogenic fine sediment loads of the 35 catchments that drain to the Great Barrier Reef. It delivers more than double the loads of any other region. Most comes from gully erosion in grazing areas. Independent sediment-tracing studies indicate that the Bowen and Upper Burdekin sub-catchments have sediment erosion rates that are much greater than the long-term natural geological rates: 7.5 times greater in the Bowen, and 3.6 times greater in the Upper Burdekin.
reefplan.qld.gov.au
2025 water quality targets and priorities
End-of-catchment anthropogenic load reductions required from 2013 baseline
Pesticides
Dissolved inorganic nitrogen (DIN)
Fine sediment Particulate phosphorus (PP)
Particulate nitrogen (PN)
60% 100 tonnes
30% 840 kilotonnes
30% 440 tonnes
30% 720 tonnes
To protect at least
99% of aquatic species at the end of catchment
The 2025 targets aim to reduce the amounts of fine sediments, nutrients (nitrogen and phosphorus) and pesticides flowing to the reef. Each target for sediment and nutrients is expressed as: (a) the percentage load reduction required compared with the 2013 estimated load of each pollutant from the catchment; and (b) the load reductions required in tonnes. Progress made since 2013 will count towards these targets. Previously reported progress between 2009 and 2013 has already been accounted for when setting the targets. The pesticide target aims to ensure that concentrations of pesticides at the end of each catchment are low enough that 99% of aquatic species are protected. The targets are ecologically relevant for the Great Barrier Reef, and are necessary to ensure that broadscale land uses have no detrimental effect on the reef’s health and resilience.
A high percentage reduction target may not necessarily mean it is the highest priority. The priorities (ranked by colour) reflect the relative risk assessment priorities for water quality improvement, based on an independent report, the 2017 Scientific Consensus Statement. The priorities reflect scientific assessment of the likely risks of pollutants damaging coastal and marine ecosystems.
Water quality relative priority
Very high
High
Moderate
Low
Minimal
Not assessed
Most anthropogenic dissolved inorganic nitrogen (DIN) loads come from sugarcane, dryland cropping and irrigated cropping areas.
Dissolved inorganic nitrogen
HorticultureUrban
Sugarcane Drylandcropping
Irrigatedcropping
Most anthropogenic fine sediment loads come from grazing and streambank erosion areas.
Fine sediment
Grazing Streambankerosion
Drylandcropping
SugarcaneIrrigated cropping
Forestry
Most sediment erosion comes from gullies and hillslopes in the Burdekin catchment.
Types of sediment erosion
Gully Hillslope Streambank
0% 100