Embed Size (px)
DESCRIPTION
It is estimated that roughly in the world 10 percent or 650 million people live with disability while India consist 26.8 million(Census 2011) & 58th round of National Sample Survey (NSS), 2002 (18.5million) indicates that around 2 percent of country’s population suffers from disability. The overreaching aim of this paper is to estimate the prevalence of disability with its type and assess the changes of proportionate disabled population during pre-independence and post-independence period. The paper essentially explains the manifold increase in the prevalence of disability in post independence period due to the adaption of new definition. To analyze the prevalence of disability The Standardized Index of Diversity (SID) which was developed by Lieberson (1969) and Rowland (2003) and further given in K.M. Ponnapalli and F.Ram (2010). Paper outcome be said that blindness which continues fluctuated from the colonial periods in India. Concentration of disabled females is more with speech and
Citation preview

31
Journal of Multidisciplinary
Research in Healthcare Vol-2, No-1
October 2015 pp. 31–54
DOI: 10.15415/jmrh.2015.21003
Burden of Disability in India (1881–2011)
*KalOsONa Paul, sHRestHa saHa
Ph.D Research Scholar tata Institute of social sciences (tIss). Mumbai – 400088
*Email: [email protected]
Received: august 09, 2015| Revised: august 20, 2015| accepted:september 18, 2015
Published online: October 05, 2015 the author(s) 2015. this article is published with open access at www.chitkara.edu.in/publications.
Abstract It is estimated that roughly in the world 10 percent or 650 million people live with disability while India consist 26.8 million(Census 2011) & 58th round of National sample survey (Nss), 2002 (18.5million) indicates that around 2 percent of country’s population suffers from disability. the overreaching aim of this paper is to estimate the prevalence of disability with its type and assess the changes of proportionate disabled population during pre-independence and post-independence period. the paper essentially explains the manifold increase in the prevalence of disability in post independence period due to the adaption of new definition. to analyze the prevalence of disability the standardized Index of Diversity (sID) which was developed by lieberson (1969) and Rowland (2003) and further given in K.M. Ponnapalli and F.Ram (2010). Paper outcome be said that blindness which continues fluctuated from the colonial periods in India. Concentration of disabled females is more with speech and, hearing whereas males movement and mental disabilities. sIDD index values indicates that all the states and districts have experienced a rising seeing disability and movement disability, but 2011 reveal that prevalence of hearing and movement disability gradually growing. this index reveals that North-east states like sikkim; Nagaland & Manipur districts are disabled population are direct effect on curvature of economic. However, there is a need for the much detailed investigation of the demography of disability which could provide insights into the problem and suggest the efforts that are needed to tackle the issue
Keyword: Definition, Disability or Infirmity, Definitional Issues, types of disability, sIDD index.
Kalosona Paul, shrestha saha
32
IntroDuctIon
Disability itself is a huge term, covering multidimensional impairments, activity limitations and participation restrictions. Impairment is a problem in body function or structure; an activity limitation is a difficulty encountered by an individual in executing a task or action; while a participation restriction is a problem experienced by an individual in involvement in life situations. thus disability is a complex phenomenon, reflecting an interaction between features of a person’s body and features of the society in which he or she lives. “Disabled people are not only the most deprived human beings in the developing world, they also the most neglected”[22].
Roughly 10 percent of the population in the world or 650 million people live with disability [11]. there is a marked asymmetry in burden of disability shared by developed and developing countries with the latter accounting for almost 80 percent of the total disabled population. asia alone constitutes at least 400 million people with disabilities. Not only people with disabilities but also their families and communities are affected by disability [11]
Nss (National sample survey) of 36th, 47th and 58th round has provided data on disabled population. the 36th round (1981) of Nss data has introduced the demographic status of the disabled population. the 36th round, the Nss data covered only three types of disabilities. It included visual, communication (i.e. hearing and/or speech) and locomotors, whereas in 47th round of Nss the mental disability has been included as one of the type along with the previous three. In the 47th NssO survey, the objective was to provide the incidence and prevalence of disability in the country. In India, the official figures provided by Census 2011 (26.8 million) and 2002 (18.5 million) indicate that around 2 percent of country’s population suffers from disability [10-17]. these figures account for 3.2 percent of the total disabled in the world.
according to 2001 census 21 million people were disabled which has increased to 26 million in 2011 census [9-10]. the number of people with disabilities is expected to increase. the reasons are complex and multifaceted and largely due to health, demographic, and development factors.
a study examined the differences in employment and wages between males with and without disabilities in rural tamil Nadu, the authors concluded that “employment gap between individuals with and without disability is not explained by differences in human capital and productivity, and may result from differential returns to characteristics and from discrimination in access to employment” [13,15]. another search done disability index of education, skill development and employment, based on National sample survey and
Burden of Disability in India
(1881–2011)
33
Census 2001 data presents a gloomy picture of the life of the disabled in India. also there is a concern regarding the unawareness about the various facilities that are available for the disabled population. People with disabilities are the largest minority group in the world. as a group they are starved of services and facilities available to the non-disabled and, consequently, they are the least nourished, the least healthy, the least educated, and the least employed. they have a long history of neglect, isolation, segregation, poverty, deprivation, charity and even pity [12, 19].
the gender differences in disability may arise due to two set of factors. One set may constitute a different factor that affects males and females differently which further results in gender bias in disability. For example, comparatively a higher proportion of males, employed in more hazardous blue-collared occupations which are more prone to locomotors disability due to high probability of mechanical accidents. another set constitutes same factors but affecting two sexes differently due to physiological and social factors and resulting in different disability rates among males and females [14, 20].
Historical Perspective
• the question on disability was canvassed in all the Censuses since 1872 to 1931 [1-7].
• the question on disability was not canvassed in the Censuses from 1941 to 1971.
• In Census 1981, information on three types of disability was collected [8]
• the question was dropped in Census 1991 • the question was again included and information on five types of
disability was collected, 2001[9]• the information on eight types of disability has been collected in
2011 [10]
Definition of various types of Disabilities
Seeing disability: In 2001 census a person who cannot see at all or has blurred vision even with the help of spectacles has been considered as visually disabled person. a person may have blurred vision and had no occasion to test whether his eyesight would improve by using spectacles - such persons were also treated as visually disabled. In 2011 census, enumerator applies a simple test to ascertain blurred vision that people included in seeing disability [9-10].

Kalosona Paul, shrestha saha
34
Hearing disability: In 2001 census, a person who cannot hear at all (deaf), or can hear only loud sounds was considered to have hearing disability. In 2011 census, Persons using hearing aid have been treated as disabled. Persons having problem in hearing through one ear although the other ear is functioning normally was considered having hearing disability in Census 2001. But in Census 2011, such persons were not considered as disabled [9, 10].
Speech disability: according to 2001 census, a person who is dumb or whose speech is not understood by a listener of normal comprehension was considered to have speech disability. Persons who stammer but whose speech is comprehensible were not classified as disabled by speech, In 2011 census, a person who speaks single words and is not able to speak in sentences was specifically mentioned to be treated as speech disabled [9,10].
Movement Disability: In 2001 census, a person, who lacks limbs or is unable to use the limbs normally, was considered to have movement disability. If any part of the body is deformed, the person was also treated as disabled and covered under this category. a person, who cannot move without the aid of another person or without the aid of stick, also treated as disabled. similarly, a person who is unable to move or pick up any small article placed near, also treated as disabled in movement. a person, who may not be able to move normally because of problems of joints like arthritis and has to invariably limp while moving, too was considered to have movement disability, but in 2011 census, specifically mention of the following information related to movement disability (Paralytic persons), able to walk with the help of aid, permanent problems of joints/muscles, Have stiffness or tightness in movement or have loose, involuntary movements of the body or have fragile bones, difficulty balancing and coordinating body movement, loss of sensation in body due to paralysis, leprosy etc and deformity of body like hunch back or are dwarf [9,10].
Mental disability: a person who lacks comprehension appropriate of age was categorized as mentally disabled. this would not mean, however, that if a person is not able to comprehend studies appropriate age and is failing to qualify examination, he considered mentally disabled. Mentally retarded and insane persons were treated as mentally disabled. a mentally disabled person generally has to depend on his family members for performing daily routine. 2011 census, divides mental disabilities into two categories one mental retardation and mental illness [9, 10].

Burden of Disability in India
(1881–2011)
35
Mental retardation: Mental retardation or intellectual disability exists in children whose brains do not develop properly or function within normal range [10].
Mental illness: Mental illness is any disease or condition that influences the way a person thinks, feels, behaves, or relates to others and to his or her surroundings [9, 10].
Any other disability: new category introduced at census 2011 to ensure complete coverage of disability. that disability which are not listed in question, in such cases where information was not sure about type of disability this option of reporting as any other disability [10].
Multiple disabilities: a person suffering from at least three type of disability was reported as multiple disabilities [10].
objectives
1. to study trends and pattern of different type of disabilities in India (1881-2011).
2. to explore the disabled worker-non worker status of India for last two decades (1991-2001 & 2001-11)
3. to assess the Disability status among males and females in state level of India using the standardized Index of Diversity of Disability (sIDD).
Data Source
the primary source of the data used in the present paper is the various censuses, conducted during the pre-independence and post-independence period in India. In alignment with the objectives of the study, the data of disability from the censuses conducted during the period 1881-1931 are used for the analysis pre independence time period. the disability returns of 2001-11 censuses are utilized for the analysis of the present day disability situation in the country.
Methodology
1. to understand the changes in the definitions of disability and its impact on the disability data, the definitions of different types of disabilities have been examined from the census reports of pre-independence (1881 to 1931), then projection 1941 to 1991 and post-independence era (2011).
Kalosona Paul, shrestha saha
36
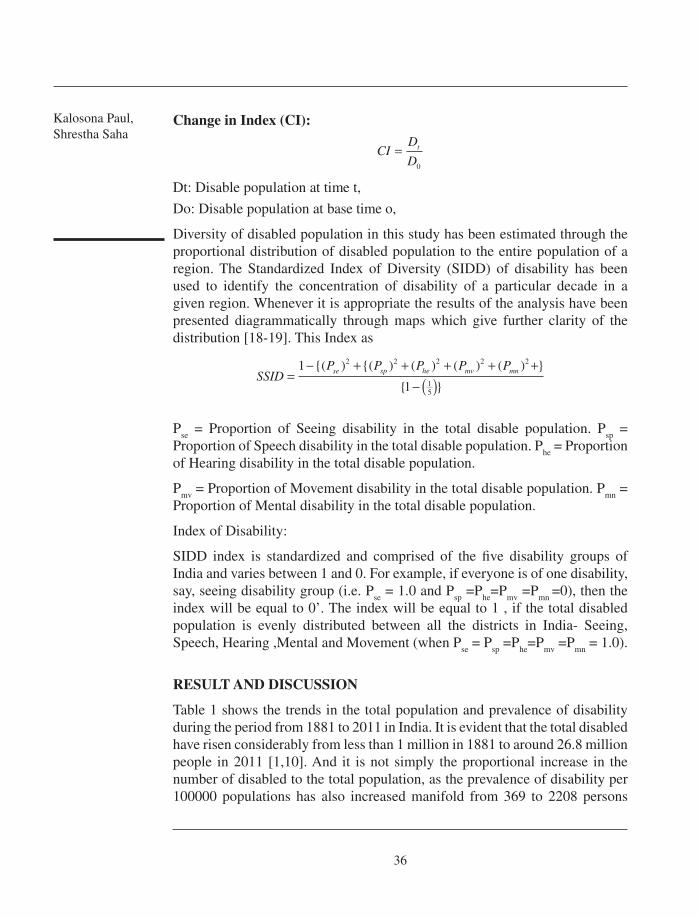
change in Index (cI):
CID
Dt=0
Dt: Disable population at time t,
Do: Disable population at base time o,
Diversity of disabled population in this study has been estimated through the proportional distribution of disabled population to the entire population of a region. the standardized Index of Diversity (sIDD) of disability has been used to identify the concentration of disability of a particular decade in a given region. Whenever it is appropriate the results of the analysis have been presented diagrammatically through maps which give further clarity of the distribution [18-19]. this Index as
SSIDP P P P Pse sp he mv mn=
− + + + + +− ( )
1
1
2 2 2 2 2
15
{( ) {( ) ( ) ( ) ( ) }
{ }
Pse = Proportion of seeing disability in the total disable population. P
sp =
Proportion of speech disability in the total disable population. Phe
= Proportion of Hearing disability in the total disable population.
Pmv
= Proportion of Movement disability in the total disable population. Pmn
= Proportion of Mental disability in the total disable population.
Index of Disability:
sIDD index is standardized and comprised of the five disability groups of India and varies between 1 and 0. For example, if everyone is of one disability, say, seeing disability group (i.e. P
se = 1.0 and P
sp =P
he=P
mv =P
mn =0), then the
index will be equal to 0’. the index will be equal to 1 , if the total disabled population is evenly distributed between all the districts in India- seeing, speech, Hearing ,Mental and Movement (when P
se = P
sp =P
he=P
mv =P
mn = 1.0).
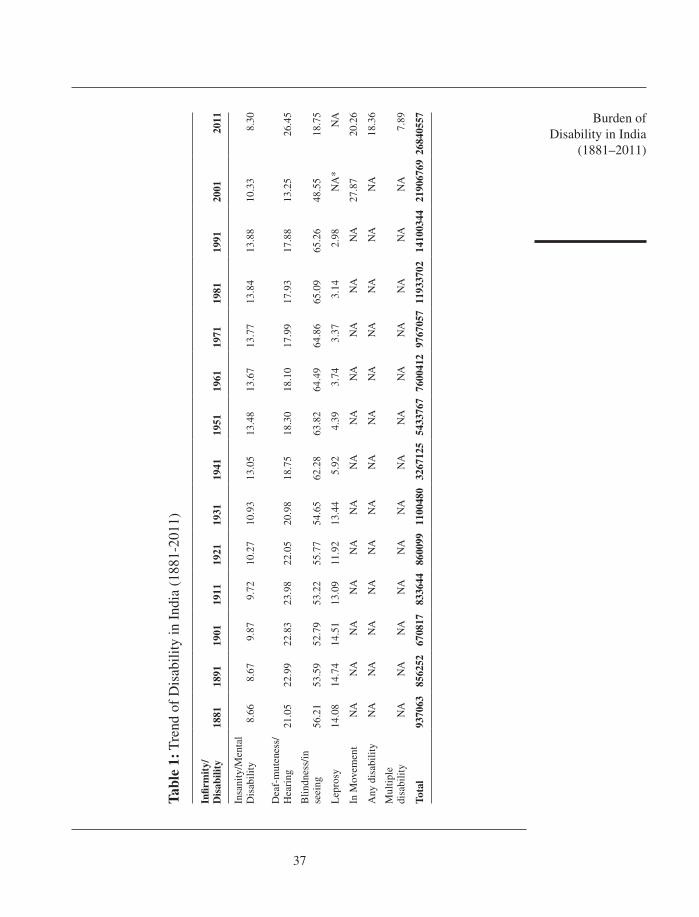
rESult AnD DIScuSSIon
table 1 shows the trends in the total population and prevalence of disability during the period from 1881 to 2011 in India. It is evident that the total disabled have risen considerably from less than 1 million in 1881 to around 26.8 million people in 2011 [1,10]. and it is not simply the proportional increase in the number of disabled to the total population, as the prevalence of disability per 100000 populations has also increased manifold from 369 to 2208 persons
Burden of Disability in India
(1881–2011)
37
tabl
e 1:
tre
nd o
f D
isab
ility
in I
ndia
(18
81-2
011)
Infir
mit
y/D
isab
ility
1881
1891
1901
1911
1921
1931
1941
1951
1961
1971
1981
1991
2001
2011
Insa
nity
/Men
tal
Dis
abili
ty8.
668.
679.
879.
7210
.27
10.9
313
.05
13.4
813
.67
13.7
713
.84
13.8
810
.33
8.30
Dea
f-m
uten
ess/
Hea
ring
21.0
522
.99
22.8
323
.98
22.0
520
.98
18.7
518
.30
18.1
017
.99
17.9
317
.88
13.2
526
.45
Blin
dnes
s/in
se
eing
56.2
153
.59
52.7
953
.22
55.7
754
.65
62.2
863
.82
64.4
964
.86
65.0
965
.26
48.5
518
.75
lep
rosy
14.0
814
.74
14.5
113
.09
11.9
213
.44
5.92
4.39
3.74
3.37
3.14
2.98
Na
*N
a
In M
ovem
ent
Na
Na
Na
Na
Na
Na
Na
Na
Na
Na
Na
Na
27.8
720
.26
any
dis
abili
tyN
aN
aN
aN
aN
aN
aN
aN
aN
aN
aN
aN
aN
a18
.36
Mul
tiple
di
sabi
lity
Na
Na
Na
Na
Na
Na
Na
Na
Na
Na
Na
Na
Na
7.89
tota
l93
7063
8562
5267
0817
8336
4486
0099
1100
480
3267
125
5433
767
7600
412
9767
057
1193
3702
1410
0344
2190
6769
2684
0557

Kalosona Paul, shrestha saha
38
across all types of disabilities during the corresponding period (1881-2011). the statements made by the British colonial census commissioners emphasize the under-enumeration of disabled population (Census of India 1931). While the fluctuating trends in the number of disabled and disability prevalence during the colonial period (1881-1931) could be attributed to the embryonic stage of census operation in India and, the lack of understanding and participation of individual perceptions, both on the part of census enumerators and respondents. this indeed is one but not the only reason of this surge from pre- independence times to 2011 census, as the under-enumeration is prevalent in 2001 & 2011census data. the change Index clearly indicates that prevalence of hearing or Deaf-muteness still high (26.45%). But trends of Blindness or seeing infirmity have declined in the latest decade (18.75%). the first time census of India (2011) has introduced any disability (18.36%) and multiple disabilities (7.89%).
this is percentage change in the total number of disabled over the period of time in relation to the 1881 census. It is computed by dividing the total number of disabled in each successive census by the disabled people recorded in 1881 census and then multiplying it by 100. since the numerator and denominator are same in 1881, thus the value equals to 100. table 2 depict that prevalence of all types of disability have been dramatically risen (29th times fold in 2011) through change index techniques.
Sex differentials in Disability
table 5 shows the trends in the ratio of disabled females per 1000 disabled males during 1911-2011. In general, the prevalence of disability among females is less during pre-independence but, last decade of twenty century and first decade of twenty first century shows more increase of disability among females was compared to their male counterparts. On an average, the prevalence of mental disability and deaf-muteness among females around 650 females per 1000 males and 700 females per 1000 males, respectively during the corresponding year. as for blindness, the ratio of females to male stands fluctuated from 1911-2011; it rises in 1921 and 1931 and declines to 855 females per 1000 males in 2001 and again increase to 907 in 2011. Other prevalence disability likes hearing, speech, movement & mental all types of female disability ratio increases as compared male counterparts. although analysis of trends in female-male ratio in leprosy and movement disability between pre-independence and post-independence times is not possible due to change in the disability categories in census over period of time the fact that prevalence of leprosy and locomotor disability is also much less among

Burden of Disability in India
(1881–2011)
39
tabl
e 2:
Cha
nge
in I
ndex
(18
81 =
100
)
Infir
mit
y/D
isab
ility
1881
1891
1901
1911
1921
1931
1941
1951
1961
1971
1981
1991
2001
2011
Insa
nity
/Men
tal
Dis
abili
ty10
092
8210
010
914
852
690
312
8116
5820
3524
1327
9027
47
Dea
f-m
uten
ess/
Hea
ring
100
100
7810
196
117
311
504
698
891
1085
1278
1472
3600
Blin
dnes
s/in
see
ing
100
8767
8491
114
386
658
931
1203
1475
1747
2019
955
lep
rosy
100
9674
8378
112
146
181
215
250
284
318
Na
Na
In M
ovem
ent
Na
Na
Na
Na
Na
Na
Na
Na
Na
Na
Na
Na
100
89
any
dis
abili
tyN
aN
aN
aN
aN
aN
aN
aN
aN
aN
aN
aN
aN
a10
0
Mul
tiple
dis
abili
tyN
aN
aN
aN
aN
aN
aN
aN
aN
aN
aN
aN
aN
a10
0
tota
l10
091
7289
9211
734
958
081
110
4212
7415
0523
3828
64
Sour
ces
of D
ata:
Gen
eral
Rep
ort o
n th
e C
ensu
s of
Ind
ia *
NA
: D
ata
Not
Ava
ilab
le
Not
e:
•T
he d
ata
on d
isab
ilit
y fo
r 19
81 c
ensu
s is
not
pre
sent
ed, a
s th
e ca
tego
ries
of d
isab
led
are
not a
ppro
pria
te fo
r in
fere
ntia
l pur
pose
. •
The
ear
lier
cen
suse
s (1
881-
1931
) di
d no
t col
lect
info
rmat
ion
on “
loco
mot
or d
isab
ilit
y‟.
•T
he B
riti
sh I
ndia
n ce
nsus
es, t
he c
ensu
s of
201
1 pr
ovid
es d
ata
for
hear
ing
and
spee
ch d
isab
ilit
ies,
sep
arat
ely.
How
ever
, in
this
tabl
e th
ey h
ave
been
clu
bbed
to
geth
er fo
r in
fere
ntia
l pur
pose
. •
The
cen
sus
of 2
001
& 2
011
does
not
col
lect
info
rmat
ion
on le
pros
y. •
The
Cen
sus
2011
firs
t tim
e in
clud
es tw
o an
othe
r ca
tego
ries
like
Any
tips
dis
abil
ity
& M
ulti
ple
disa
bili
ty.

Kalosona Paul, shrestha saha
40
table 3: Change of Index of type of disability from 1881-2011
Year/Infirmity
Insanity/Mental Disability
Deaf-muteness
Blindness/in seeing leprosy In
Movementtotal Disable
1881 100 100 100 100 – 100
1891 92 100 87 96 – 91
1901 82 78 67 74 – 72
1911 100 101 84 83 – 89
1921 109 96 91 78 – 92
1931 148 117 114 112 – 117
1941 526 311 386 146 – 349
1951 903 504 658 181 – 580
1961 1281 698 931 215 – 811
1971 1658 891 1203 250 – 1042
1981 2035 1085 1475 284 – 1274
1991 2413 1278 1747 318 – 1505
2001 2790 1472 2019 353 100 2388
2011 2746 2571 955 – 2864
Sources: RGI report of Census of India
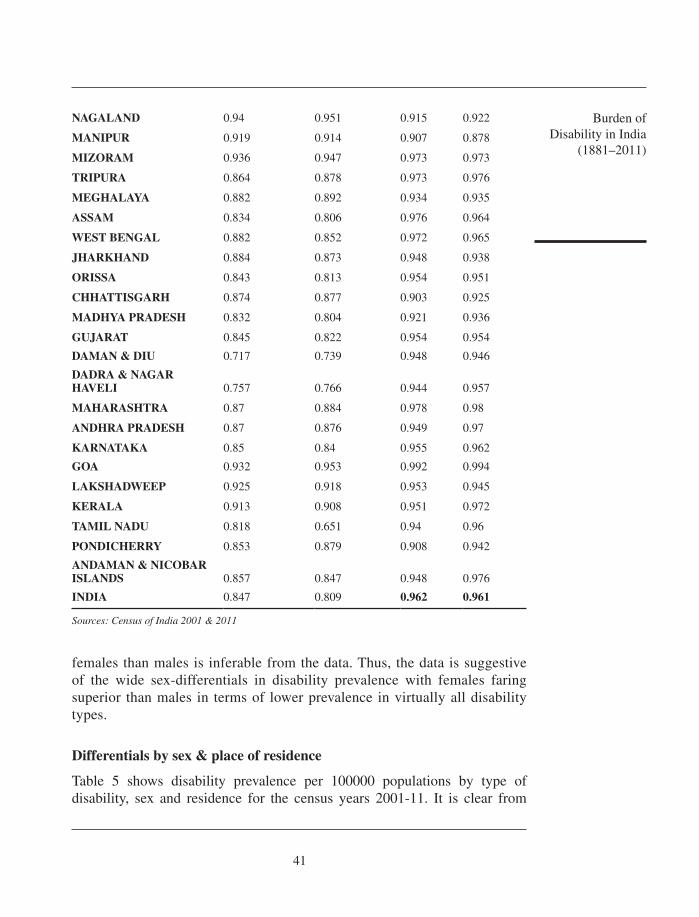
table 4: Comparative analysis of sIDD index in India (2001-2011)
States & uts
census 2001 census 2011
Male Female Male Female
JAMMu & KASHMIr 0.641 0.593 0.958 0.951
HIMAcHAl PrADESH 0.898 0.877 0.957 0.954
PunJAB 0.862 0.843 0.941 0.934
cHAnDIGArH 0.793 0.768 0.946 0.955
uttArAncHAl 0.884 0.85 0.964 0.957
HArYAnA 0.854 0.817 0.942 0.93
DElHI 0.815 0.786 0.932 0.94
rAJAStHAn 0.793 0.753 0.926 0.912
uttAr PrADESH 0.805 0.739 0.947 0.919
BIHAr 0.811 0.734 0.944 0.912
SIKKIM 0.813 0.822 0.906 0.92
ArunAcHAl PrADESH 0.551 0.733 0.918 0.895
Burden of Disability in India
(1881–2011)
41
females than males is inferable from the data. thus, the data is suggestive of the wide sex-differentials in disability prevalence with females faring superior than males in terms of lower prevalence in virtually all disability types.
Differentials by sex & place of residence
table 5 shows disability prevalence per 100000 populations by type of disability, sex and residence for the census years 2001-11. It is clear from
nAGAlAnD 0.94 0.951 0.915 0.922
MAnIPur 0.919 0.914 0.907 0.878
MIZorAM 0.936 0.947 0.973 0.973
trIPurA 0.864 0.878 0.973 0.976
MEGHAlAYA 0.882 0.892 0.934 0.935
ASSAM 0.834 0.806 0.976 0.964
WESt BEnGAl 0.882 0.852 0.972 0.965
JHArKHAnD 0.884 0.873 0.948 0.938
orISSA 0.843 0.813 0.954 0.951
cHHAttISGArH 0.874 0.877 0.903 0.925
MADHYA PrADESH 0.832 0.804 0.921 0.936
GuJArAt 0.845 0.822 0.954 0.954
DAMAn & DIu 0.717 0.739 0.948 0.946
DADrA & nAGAr HAVElI 0.757 0.766 0.944 0.957
MAHArASHtrA 0.87 0.884 0.978 0.98
AnDHrA PrADESH 0.87 0.876 0.949 0.97
KArnAtAKA 0.85 0.84 0.955 0.962
GoA 0.932 0.953 0.992 0.994
lAKSHADWEEP 0.925 0.918 0.953 0.945
KErAlA 0.913 0.908 0.951 0.972
tAMIl nADu 0.818 0.651 0.94 0.96
PonDIcHErrY 0.853 0.879 0.908 0.942
AnDAMAn & nIcoBAr ISlAnDS 0.857 0.847 0.948 0.976
InDIA 0.847 0.809 0.962 0.961
Sources: Census of India 2001 & 2011

Kalosona Paul, shrestha saha
42
the figures that there are wide differentials in the disability prevalence by sex and residence across all types of disabilities in two decadal periods (1991-2001 and 2001-11). In general, males have higher prevalence of disability as compared to females. It appears that only disability of seeing & movement is rapidly falling down but other types of disability shows to be continuously rising in 2011. Its reveals that females are less susceptible to disabilities than males, as is seen in table 5 as well. However, the position of females in Indian society and the social ritual-stigma attached with disability, which may lead to concealment of the disability among females cannot be ruled out and may also arguably be cited as one reason among others for the lower prevalence. In rural areas, the higher prevalence of communicable diseases and, mother’s anemia coupled with micro-nutrient deficiencies in childhood which cause disabilities along with the dismal state of medical facilities may explain the higher disability prevalence in rural hinterland [21].
District level scenario
the analysis reveals that in North-east states like sikkim; Nagaland & Manipur the disabled population is not evenly distributed as compared to rest of the states in India. a fig 1 show that is overall state level scenario (Maharashtra, Jammu & Kashmir and andhra Pradesh high prevalence states) and Fig 2a and 2B reveal the distribution and prevalence of different type
table 5: prevalence of disability among females per 1000 disabled males by type of disability in India, 2001-11
Disability 1911 1921 1931 2001 2011
leprosy 346 380 371 – –
Deaf-muteness 676 660 677 – –
Blindness/in seeing 999 1046 1112 855 907
In-Hearing – – – 873 894
In-speech – – – 742 780
In-Movement – – – 564 613
Mental – – – 671 –
Mental-Retardation – – – – 729
Mental-Illness – – – – 739
any-Other – – – – 806
Multiple-Disability – – – – 820
Source: Census of India, 1911, 1921, 1931, 2001 & 2011

Burden of Disability in India
(1881–2011)
43
tabl
e 6:
Dis
abili
ty p
reva
lenc
e/10
0000
pop
ulat
ion
by ty
pes,
res
iden
ce a
nd s
ex in
Ind
ia, 2
001-
11
Dis
abili
tyto
tal
rur
alu
rban
MF
MF
MF
2001
2011
2001
2011
2001
2011
2001
2011
2001
2011
2001
2011
In s
eein
g10
7742
498
840
811
0742
610
1241
410
0341
892
339
2
In h
eari
ng12
743
011
840
814
441
713
139
783
457
8443
2
In s
peec
h17
718
014
114
918
717
214
714
015
219
812
516
9
In m
ovem
ent
733
541
444
352
780
585
465
378
616
443
386
294
Men
tal d
isab
ility
255
–18
3–
249
–17
9–
269
–19
5–
Men
tal-
Ret
arda
tion
–14
0–
108
–13
8–
107
–14
3–
111
Men
tal-
Illn
ess
–67
–52
–66
–52
–68
–52
any
-Oth
er–
438
–37
4–
427
–36
1–
461
–40
4
Mul
tiple
-Dis
abili
ty–
187
–16
2–
202
–17
8–
153
–12
8
tota
l23
6924
0518
7420
1324
6624
3419
3420
2721
2223
4217
1419
83
Sour
ce:
Cen
sus
of I
ndia
, 200
1 &
201
1

Kalosona Paul, shrestha saha
44
Figure 1. Proportion of Disability in India, 2011
Figure 2A. Disability Distribution of Population, Districts in India, 2001 (total)source: RGI, 2001. Census of India
Burden of Disability in India
(1881–2011)
45
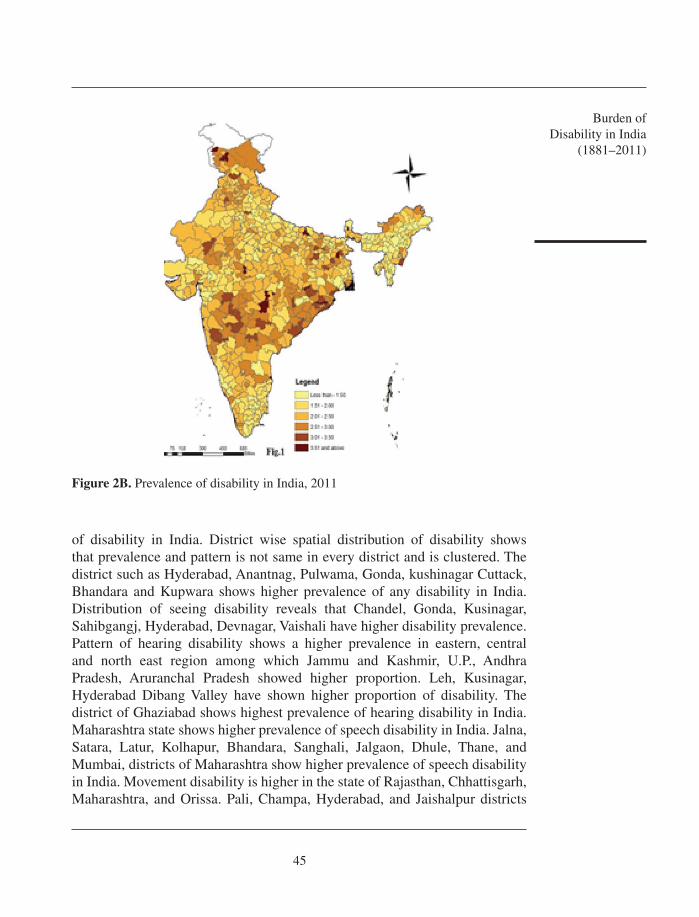
of disability in India. District wise spatial distribution of disability shows that prevalence and pattern is not same in every district and is clustered. the district such as Hyderabad, anantnag, Pulwama, Gonda, kushinagar Cuttack, Bhandara and Kupwara shows higher prevalence of any disability in India. Distribution of seeing disability reveals that Chandel, Gonda, Kusinagar, sahibgangj, Hyderabad, Devnagar, Vaishali have higher disability prevalence. Pattern of hearing disability shows a higher prevalence in eastern, central and north east region among which Jammu and Kashmir, u.P., andhra Pradesh, aruranchal Pradesh showed higher proportion. leh, Kusinagar, Hyderabad Dibang Valley have shown higher proportion of disability. the district of Ghaziabad shows highest prevalence of hearing disability in India. Maharashtra state shows higher prevalence of speech disability in India. Jalna, satara, latur, Kolhapur, Bhandara, sanghali, Jalgaon, Dhule, thane, and Mumbai, districts of Maharashtra show higher prevalence of speech disability in India. Movement disability is higher in the state of Rajasthan, Chhattisgarh, Maharashtra, and Orissa. Pali, Champa, Hyderabad, and Jaishalpur districts
Figure 2B. Prevalence of disability in India, 2011
Kalosona Paul, shrestha saha
46
show higher prevalence of movement disability in India. Cuttack, Kottam, Puri, Bhandara, Imphal, Kollam and Jagdish nagar, show higher prevalence of Mental retardation in India. Higher mental illness disability is concentrated in Pulvama, Kohicode, Kottam, anantnag, Bandipur, Idukki, trissur and truvanatapuram district. Multiple disabilities are higher in anantnag, Kollam, Pulvama, Cuttack, Pali and Delhi district in India. In short a higher prevalence of different type of disability is found in the district such as Hyderabad, Gonda, Cuttack, Kottam, and anantnag. the scenario reveals district wise variation in disability of India. However, there is a need for the much detailed investigation of the demography of disability which could provide insights into the problem and suggest the efforts that are needed to tackle the issue.
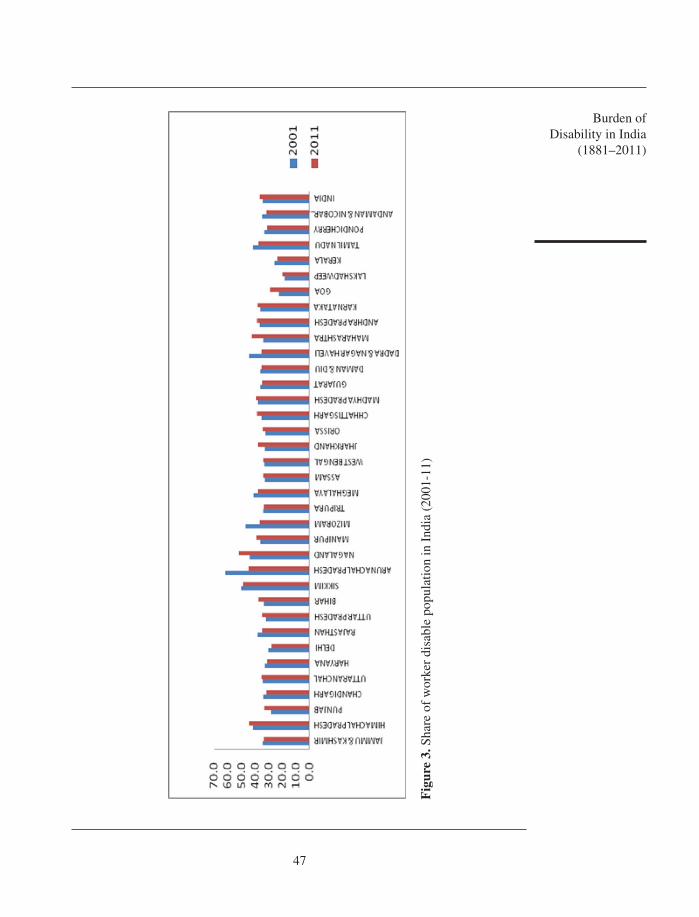
the contribution of disabled population as workers is 34.5% in 2001. this share has increase in 2011 (36.3%). the share of disabled male in workforce participation is higher (44.8% in 2001 and 47.2% in 2011 census) compare to disabled female (20.5% in 2001 and 22.6% in 2011 census). Most of the North eastern states i.e. arunachal Pradesh (61.9%), sikkim (50%), Mizoram (46.7%) and Meghalaya (41%) have shown higher work participation rate of disabled population than other states of India in census 2001 developed states have shown lower work participation rate of disabled population. this same scenario has also seen in the 2011 census year for male and female population. Fig 3 & 4 can give an idea about decadal decline (2001-11) in the share of disabled working population. It shows highest changes occurred in Nagaland and Manipur district which has direct effects on our curvature of economic line.
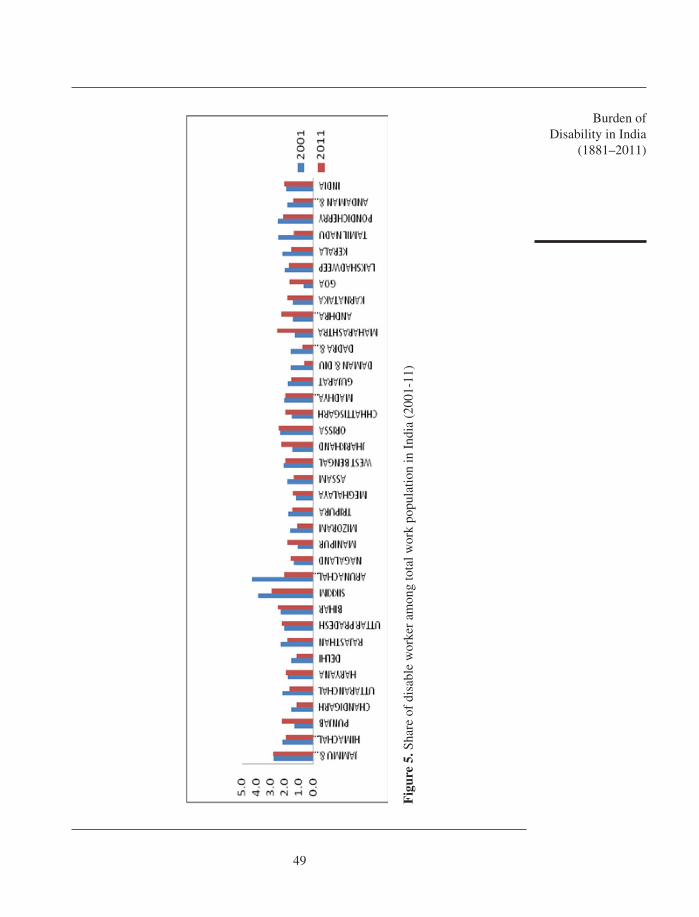
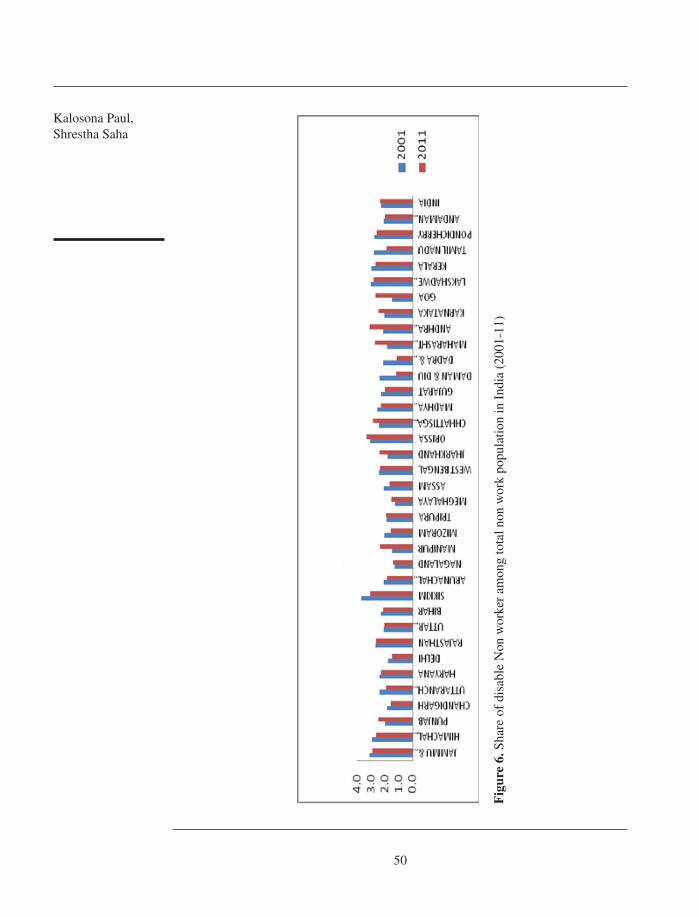
Fig 5 & 6 display the percentage of work participation of disabled worker among the total working population. Result revel that work force participation of disabled population have increased very slowly. In 2001 census, there are 1.9 % disabled engaged in different work of total worker, while in 2011 the proportion has increased to 2% of total worker. according 2001 census, arunachal Pradesh (4.3%), sikkim, Jammu & Kashmir, tamil Nadu and Rajasthan have contributed more than 2percent disabled working population to the total workers. While in 2011, sikkim, Jammu & Kashmir, Bihar, Maharashtra and Orissa have contributed higher disabled working population. lower percentage contributed by Goa (0.7%), Manipur, Meghalaya, Maharashtra and Punjab. In 2001 census Maharashtra was the fifth lowest state in terms of disabled working population in 2011 the state ranked as the 4th lowest disabled working population contributing state. sex wise variation shows that male disabled population are more engaged in work force participation as compare to female. Results also find that female workforce participation has increased continuously. Only tamil
Burden of Disability in India
(1881–2011)
47
Fig
ure
3. s
hare
of
wor
ker
disa
ble
popu
latio
n in
Ind
ia (
2001
-11)

Kalosona Paul, shrestha saha
48
Fig
ure
4. s
hare
of
Non
-wor
ker
disa
ble
popu
latio
n in
Ind
ia (
2001
-11)
Burden of Disability in India
(1881–2011)
49
Fig
ure
5. s
hare
of
disa
ble
wor
ker
amon
g to
tal w
ork
popu
latio
n in
Ind
ia (
2001
-11)
Kalosona Paul, shrestha saha
50
Fig
ure
6. s
hare
of
disa
ble
Non
wor
ker
amon
g to
tal n
on w
ork
popu
latio
n in
Ind
ia (
2001
-11)

Burden of Disability in India
(1881–2011)
51
Nadu states shows higher (2.9%) contribution in a working group of disabled women compared to male. One major variation is seen in the 2011 census that where work participation rate of women has increased. Most of states reveal that both disabled sexes had equal participation in working class.
the Male proportion of non-working disabled population is becoming higher compared to female from one decade to another. In 2001 and 2011 census year, there is the same prevalence rate of non-working disabled population of total non-worker population of India that is 2.3%. If we compare 2001 to 2011 census, sikkim (3.7% higher prevalence in all states), Jammu & Kashmir and Orissa (3.1%), Kerala and Himachal Pradesh (3%) contributing higher percentage of non-worker disabled population, but in 2011 census the situation has been changed for some states. assam, uttar Pradesh & tripura (above 3%) are highly included in non- working disabled states. less prevalence occurred in Punjab, West Bengal and Gujarat.
concluSIonS AnD rEcoMMEnDAtIon
the foregoing discussion reveals that the changes in the definition of disability in successive censuses in India have a significant bearing on the disability estimates since colonial times. although there may have been under-enumeration of disabled population in the pre- independence censuses, adoption of wider definition of disability (all types) in 2011 census explains the manifold increase in the prevalence of disability in India when compared to the pre- independence times. Furthermore, comparison of the percent distribution of the disabled by type of disability, which has by and large remained the same from British times till today, indicates that disability data provided in census have a significant comparative advantage census after census. this in turn, provides useful insights into the problem from policy viewpoint. total disabled population have risen considerably from less than 1 million in 1881 to around 26.8 million in 2011 and the prevalence of disability populations has also increased from 369 to 2208 persons per 100000 population across all types of disabilities during the corresponding period (1881-2011). It may safely be said that blindness which continues fluctuated from the colonial periods in India, so that, needs relatively more programmatic interventions, not to sideline the policy emphasis needed for other disabilities.
another important fact that emerges is that in general, prevalence of disability among females is lower than their male counterparts for all types of disabilities throughout the entire period studied. However, analysis of percent distribution of the disabled across disability types by sex suggests that while the concentration of females is more for vision, speech and, hearing as compared to
Kalosona Paul, shrestha saha
52
males, the opposite holds true in the case of movement and mental disabilities, for the reasons explained above. It appears that only disability of seeing & movement rapidly falling down but other types of disability have been rising continuously. Its reveals that female are less susceptible to disabilities than males. so, the position of females in Indian society and existing social ritual-stigma attached with their life. this analysis also brings out the fact that the proportion of mental disability is higher in state of Kerala and lower in uttar Pradesh. Higher proportion of mental disability could be traced in the isolation due to the great volume of Gulf migration.
sIDD index values indicates that all the states and districts have experienced a rising seeing disability and movement disability, but 2011 census clear that prevalence of hearing & movement disability gradually rising. this analysis also reveals that disability distribution of population, districts in India and with the predominant of disability by each state in respect to working and non- working status. there is also some variation in prevalence of disability between working and non- working population. this index reveals that North-east states like sikkim; Nagaland & Manipur disabled population are proportionately lives disability and anantnag, Pulwama, Gonda, kushinagar Cuttack, Bhandara and Kupwara districts are higher prone zone of any disability in India. In census 2001 developed states have shown lower work participation rate of disabled population. this scenario has also seen in the 2011 census year for male and female population. It shows highest changes occurred in Nagaland and Manipur district which has directly effect on our curvature of economic line.
In recent times, the tactical importance of India has grown considerably in the international arena and gossips that India may emerge as the next global superpower are wide-mouthed. However, as mentioned above India consist 26.8 million disabled populations [10] which is not a healthy indicator. However, there is a need for the much detailed investigation of the demography of disability which could provide insights into the problem and suggest the efforts that are needed to tackle the issue.
AcKnoWlEDGEMEnt
We are extremely grateful for the help and support from everyone including our friends and parents. Our immense thanks goes to all the authors and resource persons whose journal we used. My special thanks goes to the reviewers for their valuable comments and suggestions.
Burden of Disability in India
(1881–2011)
53
rEFErEncES
[1] Census of India. 1891. General Report on the Census of India. Reprinted in 1995, Manas Publication, New Delhi.
[2] Census of India. 1911. General tables. Part 2. superintendent Government Printing, Calcutta.
[3] Census of India. 1911. Report on the Census of India. Vol. 1, Part 1, superintendent Government Printing, Calcutta.
[4] Census of India. 1921. General tables. Part 2. superintendent Government Printing, Calcutta.
[5] Census of India, 1921. Report on the Census of India. Vol.1, Part 1, superintendent Government Printing, Calcutta.
[6] Census of India. 1931. General tables. Vol.1, Part 2, Reprinted in 1996, Gyan Publishing House, New Delhi.
[7] Census of India. 1931. Report on the Census of India. Vol. 1, Reprinted in 1996, Gya Publishing House, Delhi.
[8] Census of India. 1981. the Physically Handicapped: Report and tables. Registrar General and Census Commissioner, New Delhi, India.
[9] Census of India. 2001. the First Report on Disability. Registrar General and Census Commissioner, New Delhi, India.
[10] Census of India. 2011. the First Report on Disability. Registrar General and Census Commissioner, New Delhi, India.
[11] edmonds*, l. J. (2005). Mainstreaming community based rehabilitation in primary health care in Bosnia-Herzegovina. Disability & society, 20(3), 293–309. http://dx.doi.org/10.1080/09687590500060711
[12] elwan, ann. 1999. Poverty and Disability: a survey of literature. social Protection Discussion Paper series, World Bank.
[13] Ghai, anita. 2002. Disabled Women: an excluded agenda of Indian Feminism. Hypatia, Vol. 17 (3): 49–66. http://dx.doi.org/10.1111/j.1527-2001.2002.tb00941.x
[14] Harriss, WB. 1999. On to a loser: Disability in India. In essays on India’s social sector in Honour of s. Guhan, eds. B. Harriss-White and s. subramanian, 135–163. sage Publications, New Delhi.
[15] Mitra, s. and sambamoorthi, u. 2008. Disability and the Rural labour Market in India: evidence for Males in tamil Nadu. World Development, Vol. 36 (5), 934–952. http://dx.doi.org/10.1016/j.worlddev.2007.04.022
[16] Mishra, a K and Gupta, R. 2006. Disability Index: a Measure of Deprivation among Disabled. economic and Political Weekly, Vol. 41 (38):4026–4029.
[17] National sample survey Organization, 2002. Report No 485: Disabled Persons in India 58th Round. Ministry of statistics and Programme Implementation, Government of India.
[18] Ponnapalli, K.M, and Ram, F. 2010 ‘Religious taxonomy of states and Districts in India: an analysis using a standardized Index of Diversity (sID) of Religion’, IIPs Working Paper 2, pp.1–20.

Kalosona Paul, shrestha saha
54
[19] Rowland, Donald t. 2003. Demographic Methods and Concepts, New York: Oxford university Press.
[20] singh, s. (1999). Gender dimension of physical disability. economic and Political Weekly, 1958–1958.
[21] World Bank. 2007. “People with Disabilities in India: from communities to Outcomes” Human Development unit south asian Region. the World Bank.
[22] World Health Organization. 2002. “World Report of Disability”. Geneva, switzerland: Department of Gender and Women’s Health, WHO.
[23] World Health Organization. 2012. “World Report of Disability”. Geneva, switzerland: Department of Gender and Women’s Health, WHO.