Embed Size (px)
Citation preview

College of Liberal Arts and SciencesBureau of Economic and Business Research
Florida Estimates of Population
2018

Florida Estimates of Population 2018
April 1, 2018
Bureau of Economic and Business Research College of Liberal Arts and Sciences
University of Florida 720 SW 2nd Avenue, Suite 150
P.O. Box 117148 Gainesville, Florida 32611-7148
Phone: (352) 392-0171 Fax: (888) 534-2404www.bebr.ufl.edu
Copyright © 2018 by the University of Florida

University of Florida W. Kent Fuchs, President
College of Liberal Arts and Sciences
Dave Richardson, Dean
Bureau of Economic and Business Research Christopher McCarty, Director
Population Program
Stefan Rayer, Population Program Director Richard Doty, GIS Coordinator/Research Demographer
Suzanne Roulston-Doty, GIS Project Manager/Research Demographer Stanley K. Smith, Professor Emeritus Jason Teisinger, GIS Project Manager Ying Wang, Research Demographer

Table of Contents
Methodology _____________________________________________________________________________ 1
Table 1. Estimates of Population by County and City in Florida, 2018 _________________________________ 5
Table 2. Components of Population Change for Counties in Florida, 2010 to 2018 ______________________ 19
Table 3. Population and Population Change for Counties in Florida, 1990 to 2018 ______________________ 21
Table 4. Population and Population Change for Metropolitan Statistical Areas in Florida, 1990 to 2018 _____ 23
Table 5. Population Change by Decade for Regional Planning Councils in Florida, 1990 to 2018 ____________ 25
Table 6. Rank of Florida Counties by Population Size in 2018 and Population Distribution, 1990 to 2018 ____ 27
Table 7. Rank of Florida Counties by Percent Change in Population, 2010 to 2018 ______________________ 29
Figure 1. Percent Change in Population, 2010 to 2018 ____________________________________________ 30
Table 8. Rank of Florida Counties by Population Change, 2010 to 2018 _______________________________ 31
Figure 2. Population Change, 2010 to 2018 _____________________________________________________ 32
Table 9. Rank of Top 100 Cities in Florida by Population Size, 2000 to 2018 ____________________________ 33
Table 10. Rank of Top 100 Cities in Florida by Percent Change in Population, 2010 to 2018 _______________ 35
Table 11. Rank of Top 100 Cities in Florida by Population Change, 2010 to 2018 ________________________ 36
Table 12. Age Distribution (Percentage) of the Population of Florida and Its Counties, 1990 to 2017 ________ 37
Table 13. Rank of Florida Counties by Percent of Population Aged 17 and Younger, 2017 _________________ 41
Figure 3. Percent of Population Aged 17 and Younger, 2017 ________________________________________ 42
Table 14. Rank of Florida Counties by Percent of Population Aged 65 and Older, 2017 ___________________ 43
Figure 4. Percent of Population Aged 65 and Older, 2017 __________________________________________ 44
Table 15. Rank of Florida Counties by Percent of Black Population, 2017 ______________________________ 45
Figure 5. Black Population as Percent of Total Population, 2017 _____________________________________ 46
Table 16. Rank of Florida Counties by Percent of Hispanic Population, 2017 ___________________________ 47
Figure 6. Hispanic Population as Percent of Total Population, 2017 __________________________________ 48
Table 17. Population per Square Mile for Florida Counties, 2000 to 2018 _____________________________ 49
Figure 7. Population per Square Mile, 2018 _____________________________________________________ 51
Table 18. Location of Florida Cities ____________________________________________________________ 52

1 Florida Estimates of Population 2018 Bureau of Economic and Business Research, University of Florida
Methodology for Florida Estimates of Population: April 1, 2018
Guidelines for Population Estimates This report provides population estimates for Florida and each of its counties and incorporated cities, as of April 1, 2018. These estimates were prepared under a contractual agreement between the Florida Legisla-ture and the Bureau of Economic and Business Re-search (BEBR) at the University of Florida. The basic guidelines for producing population estimates were established by the 1972 Florida Legislature in Chapter 23, Section 23.019, Florida Statutes, entitled “Popula-tion census determination.” These guidelines have been revised several times since 1972, the most re-cent being Section 186.901 of the 2014 Florida Stat-utes, which states: (1) The Office of Economic and Demographic Research shall annually provide to the Executive Office of the Governor population estimates of local governmental units as of April 1 of each year, utilizing accepted sta-tistical practices. The population of local governments provided by the Office of Economic and Demographic Research shall apply to any revenue sharing formula with local governments under the provisions of ss. 218.20-218.26, part II of chapter 218. The Office of Economic and Demographic Research shall addition-ally provide the Executive Office of the Governor pop-ulation estimates for municipal annexations or consolidations occurring during the period April 1 through February 28, and the Executive Office of the Governor shall include these estimates in its certifica-tion to the Department of Revenue for the annual rev-enue-sharing calculation. (2) (a) Population shall be computed as the number of residents, employing the same general guidelines used by the United States Bureau of the Census. (b) For the purpose of revenue-sharing distribution formulas and distribution proportions for the local government half-cent sales tax, inmates and patients residing in institutions operated by the Federal Gov-ernment, the Department of Corrections, the Depart-ment of Health, or the Department of Children and Families shall not be considered to be residents of the
governmental unit in which the institutions are lo-cated. (c) Nothing herein shall be construed to prohibit the separate determination of any categories of persons, whether resident or nonresident. (3) In cases of annexation or consolidation, local gov-ernments shall be required to submit to the Executive Office of the Governor, within 30 days following an-nexation or consolidation, a statement as to the pop-ulation census effect of the action. (4) Estimates of inmates and patients pursuant to par-agraph (2)(b) shall be separately stated in population reports issued pursuant to this section. It should be noted that these estimates refer solely to permanent residents of the state of Florida. According to Census Bureau guidelines, one’s permanent resi-dence is the place one lives and sleeps most of the time. Consequently, temporary residents such as tourists and snowbirds are not included in these esti-mates. Many places in Florida have large numbers of temporary residents during certain times of the year, making their total de facto populations much larger than their permanent resident populations.
Estimation Methodology The Bureau of Economic and Business Research (BEBR) makes population estimates for every county and subcounty area in Florida, with subcounty areas defined as incorporated cities, towns and villages, and the unincorporated balance of each county. County estimates are calculated as the sum of the subcounty estimates for each county, and the state estimate is calculated as the sum of the county estimates. The estimates refer solely to permanent residents of Flor-ida; they do not include seasonal or other types of temporary residents. The estimates are produced using the housing unit

Bureau of Economic and Business Research, University of Florida Florida Estimates of Population 2018 2
method, in which changes in population are based on changes in occupied housing units (or households). This is the most commonly used method for making local population estimates in the United States be-cause it can utilize a wide variety of data sources, can be applied at any level of geography, and can produce estimates that are at least as accurate as those pro-duced by any other method. The foundation of the housing unit method is the fact that almost everyone lives in some type of housing structure, whether a traditional single family unit, an apartment, a mobile home, a college dormitory, or a state prison. The population of any geographic area can be calculated as the number of occupied housing units (households) times the average number of per-sons per household (PPH), plus the number of persons living in group quarters such as college dormitories, military barracks, nursing homes, and prisons: Pt = (Ht x PPHt) + GQt where Pt is the population at time t, Ht is the number of occupied housing units at time t, PPHt is the aver-age number of persons per household at time t, and GQt is the group quarters population at time t. Esti-mates of the number of people without permanent living quarters (e.g., the homeless population) are in-cluded in estimates of the group quarters population. This is an identity, not an estimate. If these three components were known exactly, the total population would also be known. The problem, of course, is that these components are almost never known exactly. Rather, they must be estimated from various data sources, using one or more of several possible tech-niques. In this report, we describe the data and tech-niques used to develop population estimates for Florida’s counties and subcounty areas for April 1, 2018. Households Census definitions require a person to be counted as an inhabitant of his/her usual place of residence, which is generally construed to mean the place where she/he lives and sleeps most of the time. This place is not necessarily the same as one’s legal or voting resi-
dence. A household is the person or group of people occupying a housing unit; by definition, the number of occupied housing units is the same as the number of households. Households refer solely to permanent residents and a housing unit is classified as vacant even when it is continuously occupied, if all the occu-pants are temporary residents staying only for a few days, weeks, or months. BEBR uses three different data sources to estimate the number of households in Florida. Our primary data source is active residential electric customers. We collect these data from each of the state’s 54 elec-tric utility companies. Households can be estimated by constructing a ratio of households to active resi-dential electric customers using data from the most recent census year (e.g., 2010) and multiplying that ratio times the number of active residential customers in some later year (e.g., 2018). This procedure as-sumes that no changes have occurred in electric com-pany bookkeeping practices, in the vacancy rate of active residential electric customers, or in the propor-tion of those customers who are permanent resi-dents. Although changes do occur, they are generally small. In some places we adjust the household/elec-tric customer ratio to account for changes in the va-cancy rate or the proportion of housing units occupied by permanent residents. We sometimes filter electric customer data to exclude customers using less than 200 kWh per month. We be-lieve these “limited use” customers represent sea-sonal or other part-time residents or vacant units, and excluding them may give a more accurate measure of permanent residents. These data are not available for all areas of the state, but in places in which the data are available and appear to be reliable we may use them in conjunction with other data sources. Our second data source is residential building permits, as collected and distributed by the U.S. Department of Commerce. The housing inventory in 2018 for a city or county that issues building permits can be esti-mated by adding permits issued since 2010 to the units counted in the 2010 census and subtracting units lost to destruction, demolition, or conversion to other uses. The time lag between the issuance of a permit and the completion of a unit is assumed to be three

3 Florida Estimates of Population 2018 Bureau of Economic and Business Research, University of Florida
months for single-family units and fifteen months for multifamily units. Building permits are not issued for mobile homes, but proxies can be derived from rec-ords of shipments to mobile home dealers in Florida. Creating a housing inventory for an entire county re-quires complete permit data for every permitting agency within the county. Although such data are not always available, coverage is sufficient in most Florida cities and counties to provide useful information. There are no readily available data sources providing comprehensive up-to-date information on occupancy rates that are as reliable as those produced by the lat-est decennial census. Accurate information can be obtained through special censuses or large sample surveys, but in most instances these methods are too expensive to be feasible. A common solution is to use the occupancy rates reported in the most recent cen-sus. This is the procedure we follow in most places, but in some places we make adjustments to account for factors reflecting changes in occupancy rates over time. These factors may include data from the U.S. Census Bureau’s American Community Survey (ACS) showing upward or downward trends over time since the last decennial census, changes in the proportion of seasonal population, etc. The product of the inventory figure and the occupancy rate provides an estimate of the number of house-holds. There are several potential problems with this estimate. Time lags between the issuance of permits and the completion of units may vary from place to place and from year to year. The proportion of per-mits resulting in completed units is usually unknown. Data on demolitions and conversions are incomplete and data on mobile homes must be estimated indi-rectly. Reliable estimates of changes in occupancy rates are generally unavailable. Certificate-of-occu-pancy data can eliminate problems related to comple-tion rates and time lags but not those related to occupancy rates, demolitions, and conversions. Alt-hough these problems limit the usefulness of the data in some places, building permit data often provide reasonably accurate estimates of households. Our third data source for estimates is the number of homestead exemptions by county reported by the Florida Department of Revenue. Households can be
estimated by constructing a ratio of households to ex-emptions using data from the most recent census year (e.g., 2010) and multiplying that ratio times the num-ber of exemptions in some later year (e.g., 2018). An important advantage of these data is that they cover only housing units occupied by permanent residents, thereby excluding the impact of seasonal and other non-permanent residents. The primary disadvantage is that the data do not include households occupied by renters or other non-homeowners, but those households often change at a similar rate to the households with homestead exemptions. Homestead exemption data is also available from each county’s property appraiser at the property parcel level, which can be summarized by subcounty areas. We some-times use these data in places where our other pri-mary data sources show differing trends. Electric customer, building permit, and homestead ex-emption data all provide useful information regarding changes in households. Previous research on BEBR population estimates has shown that household esti-mates based on electric customer data are—on aver-age—more accurate than those based on building permit and other data. However, we use our profes-sional judgment to decide which data source(s) to use in each specific county and subcounty area. In many instances, we use averages of estimates from more than one data source. We also sometimes use GIS-based property parcel data (along with year built in-formation and detailed land use codes from the Flor-ida Department of Revenue) to evaluate which data source is best for a particular place. Persons per Household The second component of the housing unit method is the average number of persons per household (PPH). Florida’s PPH dropped steadily from 3.22 in 1950 to 2.46 in 1990 but then leveled off, remaining constant between 1990 and 2000 before rising to 2.48 in 2010. There is a substantial amount of variation among local areas in Florida, with values in 2010 ranging from 2.1 to 3.1 for counties and from less than 1.4 to more than 4.0 for subcounty areas. PPH values have risen over time in some cities and counties and declined in oth-ers.

Bureau of Economic and Business Research, University of Florida Florida Estimates of Population 2018 4
For each county and subcounty area, we base our PPH estimates on the local PPH value in the most recent census (e.g., 2010) and the county-level change in PPH since that census (as measured by the American Com-munity Survey). In some instances, we use the local change in the mix of single-family, multifamily, and mobile home units since the last census, and/or indi-rect indicators of changes in PPH to adjust the esti-mates (e.g., changes in racial composition). Again, we use our professional judgment to decide which data sources and techniques to use in each county and sub-county area. Group Quarters Population The household population is calculated as the product of households and PPH. To obtain an estimate of the total population, we must add an estimate of the group quarters population. In most places, we esti-mate the group quarters population by assuming that it accounts for the same proportion of total popula-tion in 2018 as it did in 2010. For example, if the group quarters population accounted for 2% of the total population in 2010, we assume that it accounted for 2% in 2018. In places where there are large group quarters facilities, we collect data directly from the administrators of those facilities and add those esti-mates to the other group quarters population. In-mates in state and federal institutions are accounted for separately in all local areas; these data are availa-ble from the Federal Bureau of Prisons, the Florida De-partment of Corrections, the Florida Department of Veteran Affairs, the Florida Agency for Persons with Disabilities, the Florida Department of Health, the Florida Department of Juvenile Justice and the Florida Department of Children and Families. The total pop-ulation estimate is made by adding the estimate of the group quarters population to the estimate of the household population.
Conclusion
The population estimates produced by BEBR are calculated by multiplying the number of households by the average number of persons per household and adding the number of persons living in group quarters. This methodology is conceptually simple but effective. It utilizes data that are available for all local areas, its components respond rapidly to population movements, and it can be applied systematically and uniformly everywhere in the state. A comparison of population estimates with census results for 1980, 1990, 2000, and 2010 showed the BEBR estimates to be quite accurate, especially when compared to other sets of estimates. We believe the housing unit method is the most effective method for making city and county population estimates in Florida and that it produces reliable estimates that provide a solid foundation for budgeting, planning, and analysis.
Note
The population numbers for 1990 and 2000 shown in this report include all official corrections made by the U.S. Census Bureau. Corrections for 2010 include all corrections received from the Census Bureau’s Count Question Resolution program through February 11, 2014. Consequently, the census numbers for some cit-ies or counties may differ from those published previ-ously.
Acknowledgement
Funding for these estimates was provided by the Flor-ida Legislature.
5 Florida Estimates of Population 2018 Bureau of Economic and Business Research, University of Florida
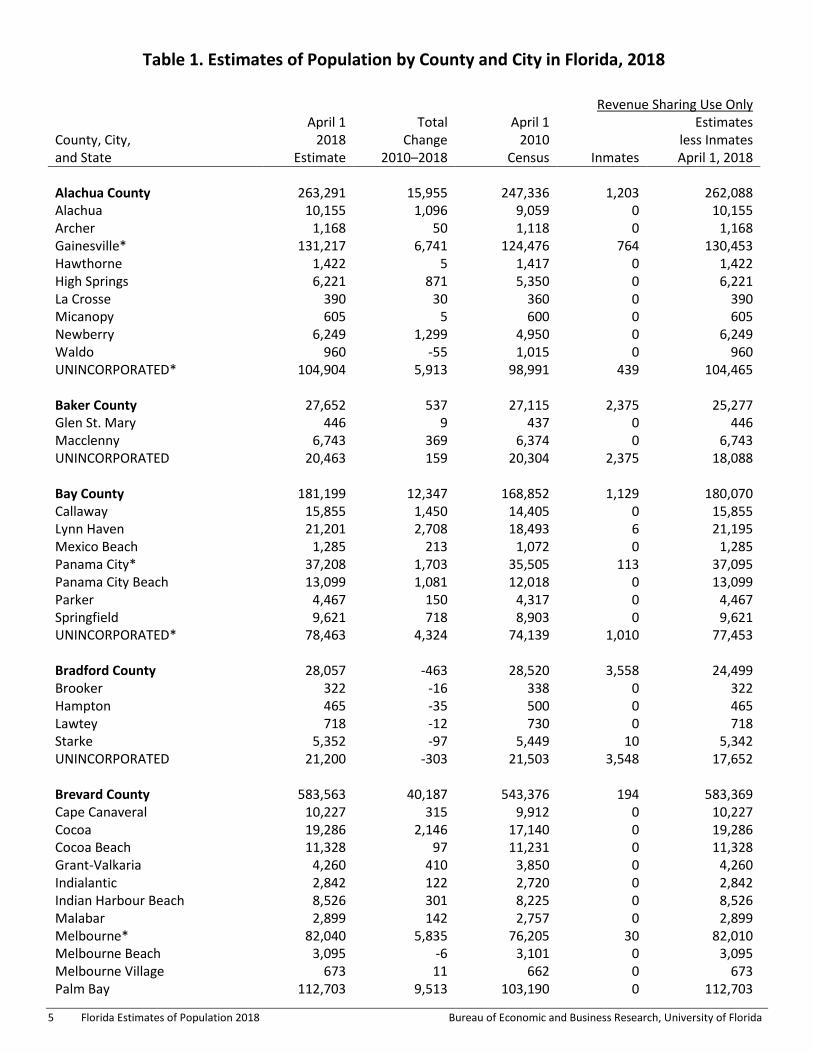
Table 1. Estimates of Population by County and City in Florida, 2018
Revenue Sharing Use Only
April 1 Total April 1 Estimates County, City, 2018 Change 2010 less Inmates and State Estimate 2010–2018 Census Inmates April 1, 2018
Alachua County 263,291 15,955 247,336 1,203 262,088 Alachua 10,155 1,096 9,059 0 10,155 Archer 1,168 50 1,118 0 1,168 Gainesville* 131,217 6,741 124,476 764 130,453 Hawthorne 1,422 5 1,417 0 1,422 High Springs 6,221 871 5,350 0 6,221 La Crosse 390 30 360 0 390 Micanopy 605 5 600 0 605 Newberry 6,249 1,299 4,950 0 6,249 Waldo 960 -55 1,015 0 960 UNINCORPORATED* 104,904 5,913 98,991 439 104,465
Baker County 27,652 537 27,115 2,375 25,277 Glen St. Mary 446 9 437 0 446 Macclenny 6,743 369 6,374 0 6,743 UNINCORPORATED 20,463 159 20,304 2,375 18,088
Bay County 181,199 12,347 168,852 1,129 180,070 Callaway 15,855 1,450 14,405 0 15,855 Lynn Haven 21,201 2,708 18,493 6 21,195 Mexico Beach 1,285 213 1,072 0 1,285 Panama City* 37,208 1,703 35,505 113 37,095 Panama City Beach 13,099 1,081 12,018 0 13,099 Parker 4,467 150 4,317 0 4,467 Springfield 9,621 718 8,903 0 9,621 UNINCORPORATED* 78,463 4,324 74,139 1,010 77,453
Bradford County 28,057 -463 28,520 3,558 24,499 Brooker 322 -16 338 0 322 Hampton 465 -35 500 0 465 Lawtey 718 -12 730 0 718 Starke 5,352 -97 5,449 10 5,342 UNINCORPORATED 21,200 -303 21,503 3,548 17,652
Brevard County 583,563 40,187 543,376 194 583,369 Cape Canaveral 10,227 315 9,912 0 10,227 Cocoa 19,286 2,146 17,140 0 19,286 Cocoa Beach 11,328 97 11,231 0 11,328 Grant-Valkaria 4,260 410 3,850 0 4,260 Indialantic 2,842 122 2,720 0 2,842 Indian Harbour Beach 8,526 301 8,225 0 8,526 Malabar 2,899 142 2,757 0 2,899 Melbourne* 82,040 5,835 76,205 30 82,010 Melbourne Beach 3,095 -6 3,101 0 3,095 Melbourne Village 673 11 662 0 673 Palm Bay 112,703 9,513 103,190 0 112,703
Bureau of Economic and Business Research, University of Florida Florida Estimates of Population 2018 6
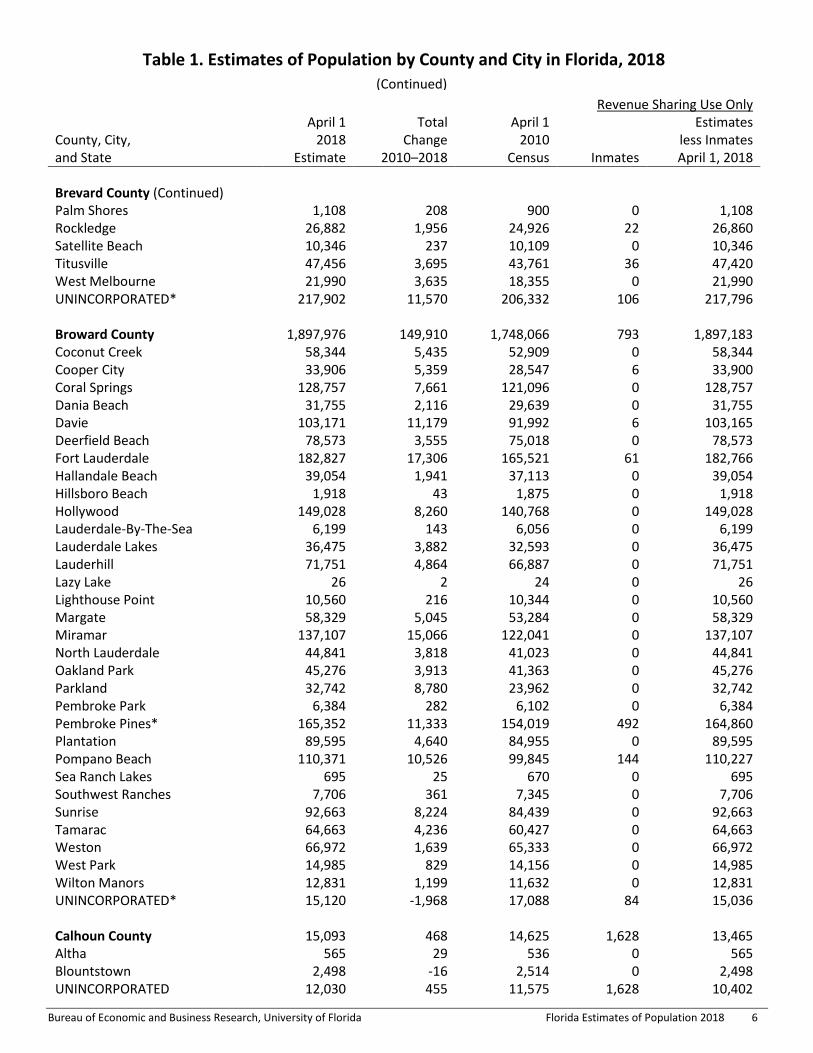
Table 1. Estimates of Population by County and City in Florida, 2018
Revenue Sharing Use Only
April 1 Total April 1 Estimates County, City, 2018 Change 2010 less Inmates and State Estimate 2010–2018 Census Inmates April 1, 2018
Brevard County (Continued) Palm Shores 1,108 208 900 0 1,108 Rockledge 26,882 1,956 24,926 22 26,860 Satellite Beach 10,346 237 10,109 0 10,346 Titusville 47,456 3,695 43,761 36 47,420 West Melbourne 21,990 3,635 18,355 0 21,990 UNINCORPORATED* 217,902 11,570 206,332 106 217,796
Broward County 1,897,976 149,910 1,748,066 793 1,897,183 Coconut Creek 58,344 5,435 52,909 0 58,344 Cooper City 33,906 5,359 28,547 6 33,900 Coral Springs 128,757 7,661 121,096 0 128,757 Dania Beach 31,755 2,116 29,639 0 31,755 Davie 103,171 11,179 91,992 6 103,165 Deerfield Beach 78,573 3,555 75,018 0 78,573 Fort Lauderdale 182,827 17,306 165,521 61 182,766 Hallandale Beach 39,054 1,941 37,113 0 39,054 Hillsboro Beach 1,918 43 1,875 0 1,918 Hollywood 149,028 8,260 140,768 0 149,028 Lauderdale-By-The-Sea 6,199 143 6,056 0 6,199 Lauderdale Lakes 36,475 3,882 32,593 0 36,475 Lauderhill 71,751 4,864 66,887 0 71,751 Lazy Lake 26 2 24 0 26 Lighthouse Point 10,560 216 10,344 0 10,560 Margate 58,329 5,045 53,284 0 58,329 Miramar 137,107 15,066 122,041 0 137,107 North Lauderdale 44,841 3,818 41,023 0 44,841 Oakland Park 45,276 3,913 41,363 0 45,276 Parkland 32,742 8,780 23,962 0 32,742 Pembroke Park 6,384 282 6,102 0 6,384 Pembroke Pines* 165,352 11,333 154,019 492 164,860 Plantation 89,595 4,640 84,955 0 89,595 Pompano Beach 110,371 10,526 99,845 144 110,227 Sea Ranch Lakes 695 25 670 0 695 Southwest Ranches 7,706 361 7,345 0 7,706 Sunrise 92,663 8,224 84,439 0 92,663 Tamarac 64,663 4,236 60,427 0 64,663 Weston 66,972 1,639 65,333 0 66,972 West Park 14,985 829 14,156 0 14,985 Wilton Manors 12,831 1,199 11,632 0 12,831 UNINCORPORATED* 15,120 -1,968 17,088 84 15,036
Calhoun County 15,093 468 14,625 1,628 13,465 Altha 565 29 536 0 565 Blountstown 2,498 -16 2,514 0 2,498 UNINCORPORATED 12,030 455 11,575 1,628 10,402
(Continued)

7 Florida Estimates of Population 2018 Bureau of Economic and Business Research, University of Florida
Table 1. Estimates of Population by County and City in Florida, 2018
Revenue Sharing Use Only
April 1 Total April 1 Estimates County, City, 2018 Change 2010 less Inmates and State Estimate 2010–2018 Census Inmates April 1, 2018
Charlotte County 177,987 18,009 159,978 1,242 176,745 Punta Gorda 19,487 2,846 16,641 0 19,487 UNINCORPORATED 158,500 15,163 143,337 1,242 157,258
Citrus County 145,721 4,485 141,236 142 145,579 Crystal River 3,333 225 3,108 0 3,333 Inverness 7,380 170 7,210 0 7,380 UNINCORPORATED 135,008 4,090 130,918 142 134,866
Clay County 212,034 21,169 190,865 0 212,034 Green Cove Springs 7,813 905 6,908 0 7,813 Keystone Heights 1,364 14 1,350 0 1,364 Orange Park 8,630 218 8,412 0 8,630 Penney Farms 766 17 749 0 766 UNINCORPORATED 193,461 20,015 173,446 0 193,461
Collier County 367,347 45,827 321,520 24 367,323 Everglades 408 8 400 0 408 Marco Island 17,094 681 16,413 0 17,094 Naples 20,344 807 19,537 0 20,344 UNINCORPORATED 329,501 44,331 285,170 24 329,477
Columbia County 69,721 2,190 67,531 4,011 65,710 Fort White 552 -15 567 0 552 Lake City 12,322 276 12,046 333 11,989 UNINCORPORATED 56,847 1,929 54,918 3,678 53,169
DeSoto County 35,520 658 34,862 2,234 33,286 Arcadia 7,673 36 7,637 0 7,673 UNINCORPORATED 27,847 622 27,225 2,234 25,613
Dixie County 16,489 67 16,422 1,671 14,818 Cross City 1,696 -32 1,728 0 1,696 Horseshoe Beach 171 2 169 0 171 UNINCORPORATED 14,622 97 14,525 1,671 12,951
Duval County 952,861 88,598 864,263 598 952,263 Atlantic Beach 13,570 915 12,655 0 13,570 Baldwin 1,419 -6 1,425 0 1,419 Jacksonville 907,093 85,309 821,784 598 906,495 Jacksonville Beach 23,494 2,132 21,362 0 23,494 Neptune Beach 7,285 248 7,037 0 7,285
(Continued)
Bureau of Economic and Business Research, University of Florida Florida Estimates of Population 2018 8
Table 1. Estimates of Population by County and City in Florida, 2018
Revenue Sharing Use Only
April 1 Total April 1 Estimates County, City, 2018 Change 2010 less Inmates and State Estimate 2010–2018 Census Inmates April 1, 2018
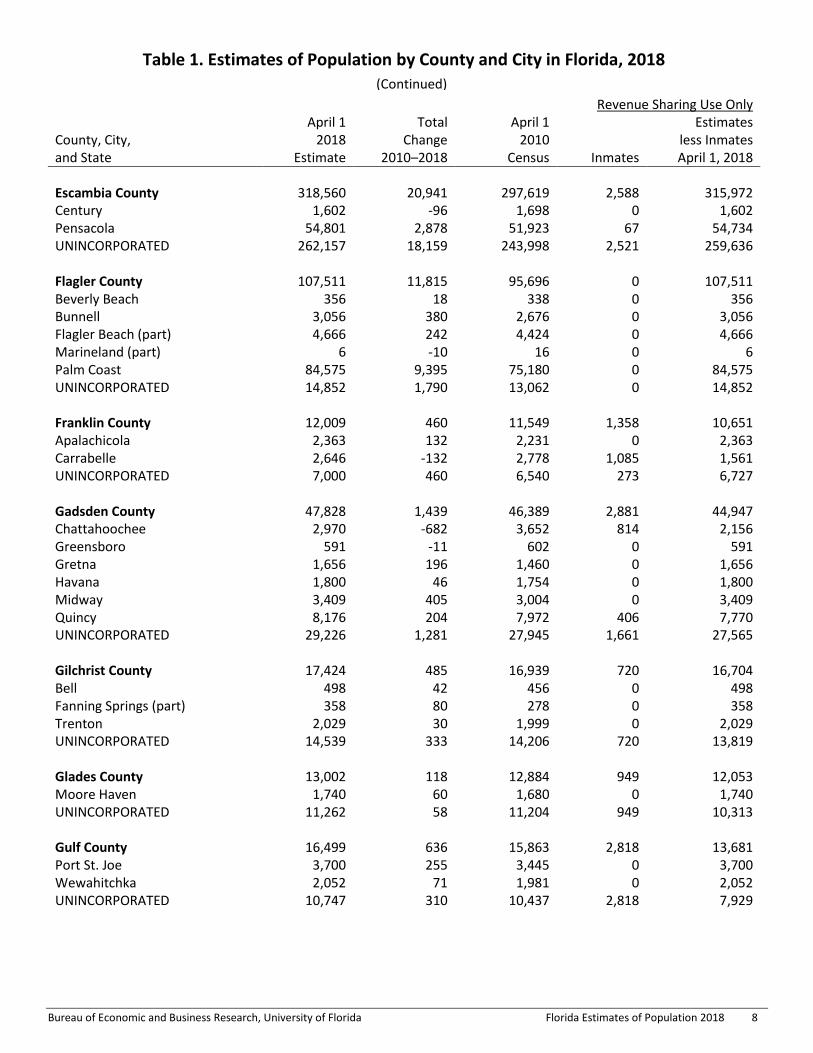
Escambia County 318,560 20,941 297,619 2,588 315,972 Century 1,602 -96 1,698 0 1,602 Pensacola 54,801 2,878 51,923 67 54,734 UNINCORPORATED 262,157 18,159 243,998 2,521 259,636
Flagler County 107,511 11,815 95,696 0 107,511 Beverly Beach 356 18 338 0 356 Bunnell 3,056 380 2,676 0 3,056 Flagler Beach (part) 4,666 242 4,424 0 4,666 Marineland (part) 6 -10 16 0 6 Palm Coast 84,575 9,395 75,180 0 84,575 UNINCORPORATED 14,852 1,790 13,062 0 14,852
Franklin County 12,009 460 11,549 1,358 10,651 Apalachicola 2,363 132 2,231 0 2,363 Carrabelle 2,646 -132 2,778 1,085 1,561 UNINCORPORATED 7,000 460 6,540 273 6,727
Gadsden County 47,828 1,439 46,389 2,881 44,947 Chattahoochee 2,970 -682 3,652 814 2,156 Greensboro 591 -11 602 0 591 Gretna 1,656 196 1,460 0 1,656 Havana 1,800 46 1,754 0 1,800 Midway 3,409 405 3,004 0 3,409 Quincy 8,176 204 7,972 406 7,770 UNINCORPORATED 29,226 1,281 27,945 1,661 27,565
Gilchrist County 17,424 485 16,939 720 16,704 Bell 498 42 456 0 498 Fanning Springs (part) 358 80 278 0 358 Trenton 2,029 30 1,999 0 2,029 UNINCORPORATED 14,539 333 14,206 720 13,819
Glades County 13,002 118 12,884 949 12,053 Moore Haven 1,740 60 1,680 0 1,740 UNINCORPORATED 11,262 58 11,204 949 10,313
Gulf County 16,499 636 15,863 2,818 13,681 Port St. Joe 3,700 255 3,445 0 3,700 Wewahitchka 2,052 71 1,981 0 2,052 UNINCORPORATED 10,747 310 10,437 2,818 7,929
(Continued)
9 Florida Estimates of Population 2018 Bureau of Economic and Business Research, University of Florida
Table 1. Estimates of Population by County and City in Florida, 2018
Revenue Sharing Use Only
April 1 Total April 1 Estimates County, City, 2018 Change 2010 less Inmates and State Estimate 2010–2018 Census Inmates April 1, 2018
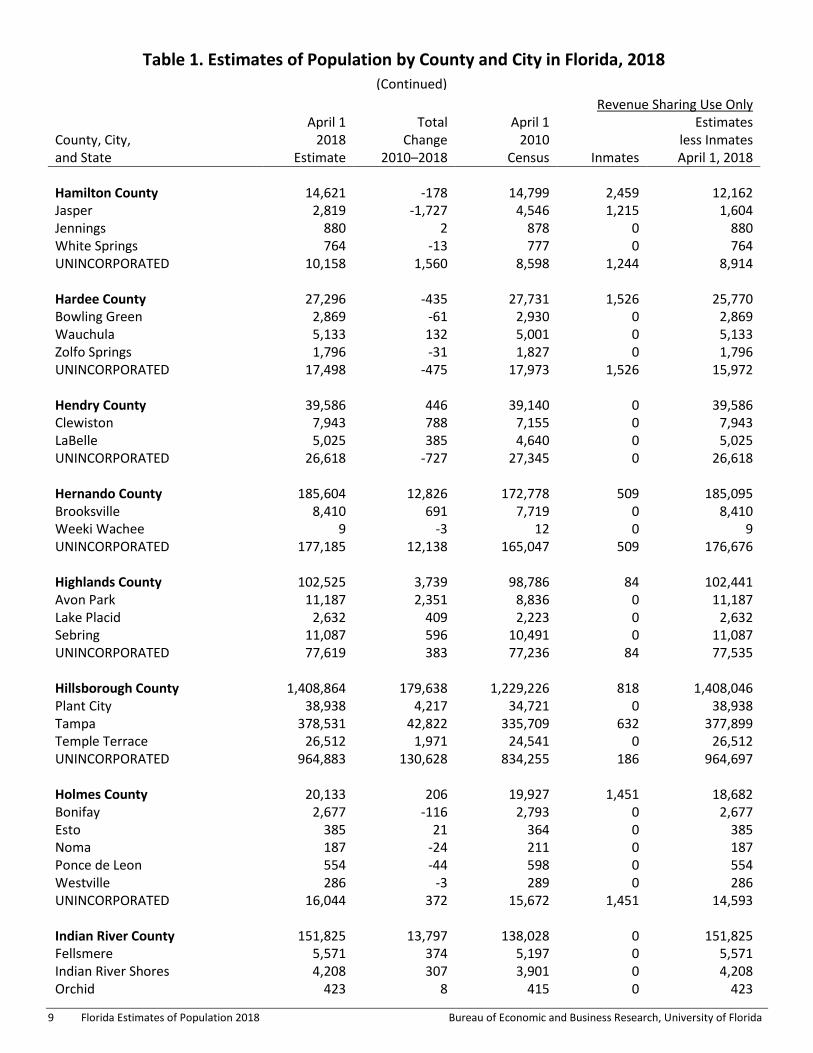
Hamilton County 14,621 -178 14,799 2,459 12,162 Jasper 2,819 -1,727 4,546 1,215 1,604 Jennings 880 2 878 0 880 White Springs 764 -13 777 0 764 UNINCORPORATED 10,158 1,560 8,598 1,244 8,914
Hardee County 27,296 -435 27,731 1,526 25,770 Bowling Green 2,869 -61 2,930 0 2,869 Wauchula 5,133 132 5,001 0 5,133 Zolfo Springs 1,796 -31 1,827 0 1,796 UNINCORPORATED 17,498 -475 17,973 1,526 15,972
Hendry County 39,586 446 39,140 0 39,586 Clewiston 7,943 788 7,155 0 7,943 LaBelle 5,025 385 4,640 0 5,025 UNINCORPORATED 26,618 -727 27,345 0 26,618
Hernando County 185,604 12,826 172,778 509 185,095 Brooksville 8,410 691 7,719 0 8,410 Weeki Wachee 9 -3 12 0 9 UNINCORPORATED 177,185 12,138 165,047 509 176,676
Highlands County 102,525 3,739 98,786 84 102,441 Avon Park 11,187 2,351 8,836 0 11,187 Lake Placid 2,632 409 2,223 0 2,632 Sebring 11,087 596 10,491 0 11,087 UNINCORPORATED 77,619 383 77,236 84 77,535
Hillsborough County 1,408,864 179,638 1,229,226 818 1,408,046 Plant City 38,938 4,217 34,721 0 38,938 Tampa 378,531 42,822 335,709 632 377,899 Temple Terrace 26,512 1,971 24,541 0 26,512 UNINCORPORATED 964,883 130,628 834,255 186 964,697
Holmes County 20,133 206 19,927 1,451 18,682 Bonifay 2,677 -116 2,793 0 2,677 Esto 385 21 364 0 385 Noma 187 -24 211 0 187 Ponce de Leon 554 -44 598 0 554 Westville 286 -3 289 0 286 UNINCORPORATED 16,044 372 15,672 1,451 14,593
Indian River County 151,825 13,797 138,028 0 151,825 Fellsmere 5,571 374 5,197 0 5,571 Indian River Shores 4,208 307 3,901 0 4,208 Orchid 423 8 415 0 423
(Continued)

Bureau of Economic and Business Research, University of Florida Florida Estimates of Population 2018 10
Table 1. Estimates of Population by County and City in Florida, 2018
Revenue Sharing Use Only
April 1 Total April 1 Estimates County, City, 2018 Change 2010 less Inmates and State Estimate 2010–2018 Census Inmates April 1, 2018
Indian River County (Continued) Sebastian 24,630 2,701 21,929 0 24,630 Vero Beach* 16,274 1,051 15,223 0 16,274 UNINCORPORATED* 100,719 9,356 91,363 0 100,719
Jackson County 50,435 689 49,746 7,313 43,122 Alford 495 6 489 0 495 Bascom 125 4 121 0 125 Campbellton 215 -15 230 0 215 Cottondale 889 -44 933 0 889 Graceville 2,182 -96 2,278 0 2,182 Grand Ridge 981 89 892 0 981 Greenwood 696 10 686 0 696 Jacob City 242 -8 250 0 242 Malone 2,193 105 2,088 1,688 505 Marianna 7,621 1,519 6,102 1,485 6,136 Sneads 1,893 44 1,849 0 1,893 UNINCORPORATED 32,903 -925 33,828 4,140 28,763
Jefferson County 14,733 -28 14,761 1,110 13,623 Monticello 2,412 -94 2,506 0 2,412 UNINCORPORATED 12,321 66 12,255 1,110 11,211
Lafayette County 8,501 -369 8,870 1,407 7,094 Mayo 1,208 -29 1,237 0 1,208 UNINCORPORATED 7,293 -340 7,633 1,407 5,886
Lake County* 342,917 45,870 297,047 1,012 341,905 Astatula 1,908 98 1,810 0 1,908 Clermont 38,906 10,164 28,742 0 38,906 Eustis 21,039 2,481 18,558 0 21,039 Fruitland Park 8,963 4,885 4,078 0 8,963 Groveland 16,407 7,678 8,729 0 16,407 Howey-in-the-Hills 1,499 401 1,098 0 1,499 Lady Lake 14,960 1,034 13,926 0 14,960 Leesburg 23,297 3,180 20,117 0 23,297 Mascotte 5,829 728 5,101 0 5,829 Minneola 12,348 2,945 9,403 0 12,348 Montverde 1,846 383 1,463 0 1,846 Mount Dora 14,536 2,166 12,370 0 14,536 Tavares 17,353 3,402 13,951 0 17,353 Umatilla 4,081 625 3,456 0 4,081 UNINCORPORATED* 159,945 5,700 154,245 1,012 158,933
(Continued)

11 Florida Estimates of Population 2018 Bureau of Economic and Business Research, University of Florida
Table 1. Estimates of Population by County and City in Florida, 2018
Revenue Sharing Use Only
April 1 Total April 1 Estimates County, City, 2018 Change 2010 less Inmates and State Estimate 2010–2018 Census Inmates April 1, 2018
Lee County 713,903 95,149 618,754 285 713,618 Bonita Springs* 51,181 7,324 43,857 5 51,176 Cape Coral 180,204 25,899 154,305 29 180,175 Estero** 31,806 31,806 0 0 31,806 Fort Myers 81,868 19,570 62,298 70 81,798 Fort Myers Beach 6,406 129 6,277 0 6,406 Sanibel 6,701 232 6,469 0 6,701 UNINCORPORATED* 355,737 10,189 345,548 181 355,556
Leon County 292,332 16,845 275,487 1,207 291,125 Tallahassee 192,381 11,005 181,376 1,207 191,174 UNINCORPORATED 99,951 5,840 94,111 0 99,951
Levy County 41,054 253 40,801 0 41,054 Bronson 1,133 20 1,113 0 1,133 Cedar Key 714 12 702 0 714 Chiefland 2,224 -21 2,245 0 2,224 Fanning Springs (part) 501 15 486 0 501 Inglis 1,292 -33 1,325 0 1,292 Otter Creek 122 -12 134 0 122 Williston 2,943 175 2,768 0 2,943 Yankeetown 504 2 502 0 504 UNINCORPORATED 31,621 95 31,526 0 31,621
Liberty County 8,915 550 8,365 1,776 7,139 Bristol 950 -46 996 0 950 UNINCORPORATED 7,965 596 7,369 1,776 6,189
Madison County 19,473 249 19,224 1,661 17,812 Greenville 797 -46 843 32 765 Lee 338 -14 352 0 338 Madison* 3,081 32 3,049 0 3,081 UNINCORPORATED* 15,257 277 14,980 1,629 13,628
Manatee County 377,826 54,993 322,833 198 377,628 Anna Maria 1,599 96 1,503 0 1,599 Bradenton 56,157 6,611 49,546 41 56,116 Bradenton Beach 1,194 23 1,171 0 1,194 Holmes Beach 3,934 98 3,836 0 3,934 Longboat Key (part) 2,428 30 2,398 0 2,428 Palmetto 13,307 701 12,606 48 13,259 UNINCORPORATED 299,207 47,434 251,773 109 299,098
(Continued)

Bureau of Economic and Business Research, University of Florida Florida Estimates of Population 2018 12
Table 1. Estimates of Population by County and City in Florida, 2018
Revenue Sharing Use Only
April 1 Total April 1 Estimates County, City, 2018 Change 2010 less Inmates and State Estimate 2010–2018 Census Inmates April 1, 2018
Marion County* 353,898 22,595 331,303 5,473 348,425 Belleview 5,152 660 4,492 6 5,146 Dunnellon 1,805 72 1,733 0 1,805 McIntosh 453 1 452 0 453 Ocala 60,042 3,727 56,315 160 59,882 Reddick 547 41 506 0 547 UNINCORPORATED* 285,899 18,094 267,805 5,307 280,592
Martin County 155,556 9,238 146,318 2,061 153,495 Indiantown*** 6,707 6,707 0 0 6,707 Jupiter Island 826 9 817 0 826 Ocean Breeze 163 -192 355 0 163 Sewall's Point 2,078 82 1,996 0 2,078 Stuart 16,425 832 15,593 24 16,401 UNINCORPORATED 129,357 1,800 127,557 2,037 127,320
Miami-Dade County* 2,779,322 282,865 2,496,457 9,798 2,769,524 Aventura 37,790 2,028 35,762 0 37,790 Bal Harbour 2,920 407 2,513 0 2,920 Bay Harbor Islands 5,908 280 5,628 0 5,908 Biscayne Park 3,218 163 3,055 0 3,218 Coral Gables* 50,631 3,855 46,776 0 50,631 Cutler Bay 45,373 5,087 40,286 0 45,373 Doral* 68,244 22,535 45,709 0 68,244 El Portal 2,140 -185 2,325 0 2,140 Florida City 13,076 1,831 11,245 24 13,052 Golden Beach 935 16 919 0 935 Hialeah* 238,906 14,239 224,667 0 238,906 Hialeah Gardens 23,614 1,870 21,744 0 23,614 Homestead* 73,863 13,354 60,509 18 73,845 Indian Creek 84 -2 86 0 84 Islandia**** 0 -18 18 Key Biscayne 12,887 543 12,344 0 12,887 Medley 842 4 838 0 842 Miami* 481,333 81,825 399,508 2,933 478,400 Miami Beach* 92,502 4,724 87,778 0 92,502 Miami Gardens* 113,628 6,462 107,166 0 113,628 Miami Lakes 31,118 1,757 29,361 12 31,106 Miami Shores 10,784 291 10,493 0 10,784 Miami Springs 14,192 383 13,809 0 14,192 North Bay Village 8,981 1,844 7,137 0 8,981 North Miami* 63,517 4,605 58,912 0 63,517 North Miami Beach 45,612 4,089 41,523 0 45,612 Opa-locka 18,017 2,798 15,219 0 18,017 Palmetto Bay* 24,144 736 23,408 0 24,144 Pinecrest 18,490 267 18,223 0 18,490
(Continued)

13 Florida Estimates of Population 2018 Bureau of Economic and Business Research, University of Florida
Table 1. Estimates of Population by County and City in Florida, 2018
Revenue Sharing Use Only
April 1 Total April 1 Estimates County, City, 2018 Change 2010 less Inmates and State Estimate 2010–2018 Census Inmates April 1, 2018
Miami-Dade County* (Continued) South Miami 12,664 1,007 11,657 0 12,664 Sunny Isles Beach 22,505 1,673 20,832 0 22,505 Surfside 5,934 190 5,744 0 5,934 Sweetwater 21,499 8,000 13,499 0 21,499 Virginia Gardens 2,433 58 2,375 0 2,433 West Miami 7,806 1,841 5,965 0 7,806 UNINCORPORATED* 1,203,732 94,308 1,109,424 6,811 1,196,921
Monroe County 73,940 850 73,090 0 73,940 Islamorada, Village of Islands 5,990 -129 6,119 0 5,990 Key Colony Beach 758 -39 797 0 758 Key West 24,509 -140 24,649 0 24,509 Layton 182 -2 184 0 182 Marathon 8,235 -62 8,297 0 8,235 UNINCORPORATED 34,266 1,222 33,044 0 34,266
Nassau County 82,748 9,434 73,314 72 82,676 Callahan 1,305 182 1,123 0 1,305 Fernandina Beach 12,761 1,274 11,487 24 12,737 Hilliard 2,990 -96 3,086 0 2,990 UNINCORPORATED 65,692 8,074 57,618 48 65,644
Okaloosa County 198,152 17,330 180,822 1,377 196,775 Cinco Bayou 404 21 383 0 404 Crestview 25,001 4,023 20,978 0 25,001 Destin 13,289 984 12,305 0 13,289 Fort Walton Beach 20,830 1,323 19,507 0 20,830 Laurel Hill 551 14 537 0 551 Mary Esther 3,971 120 3,851 0 3,971 Niceville 14,508 1,759 12,749 0 14,508 Shalimar 817 100 717 0 817 Valparaiso 5,284 248 5,036 0 5,284 UNINCORPORATED 113,497 8,738 104,759 1,377 112,120
Okeechobee County 41,120 1,124 39,996 2,370 38,750 Okeechobee 5,561 -60 5,621 0 5,561 UNINCORPORATED 35,559 1,184 34,375 2,370 33,189
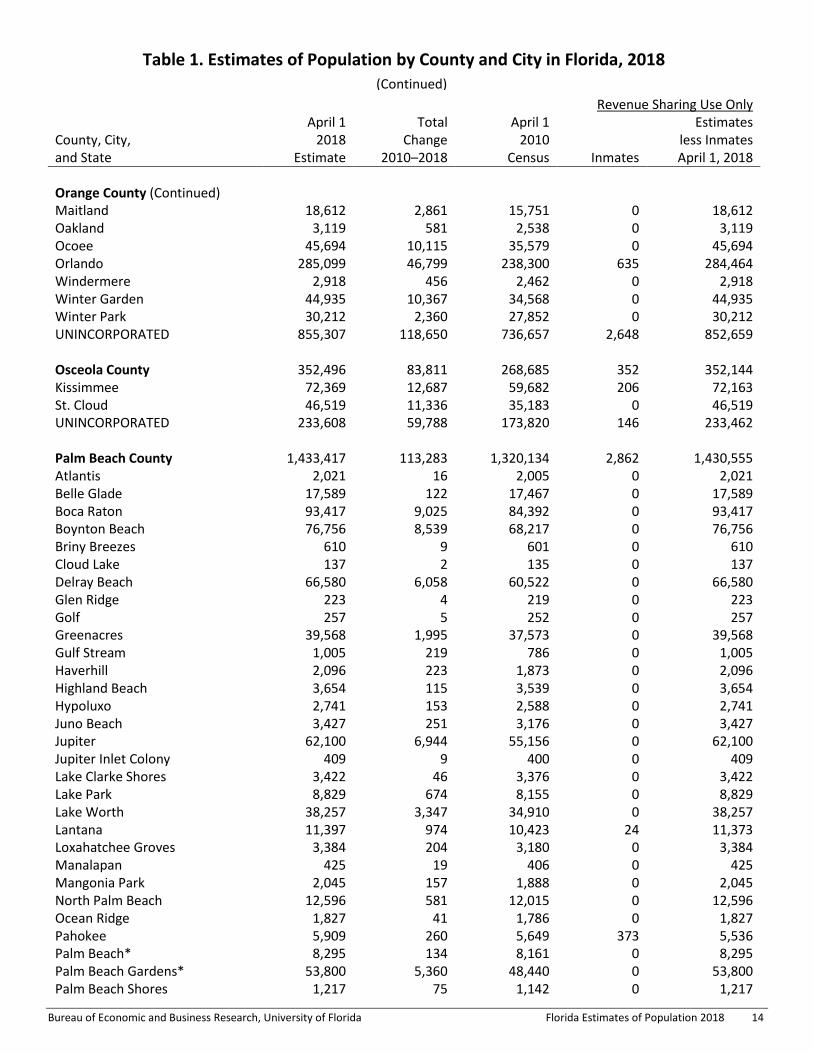
Orange County 1,349,597 203,641 1,145,956 3,314 1,346,283 Apopka 51,676 10,134 41,542 0 51,676 Bay Lake 22 -25 47 0 22 Belle Isle 6,944 956 5,988 0 6,944 Eatonville 2,323 164 2,159 31 2,292 Edgewood 2,712 209 2,503 0 2,712 Lake Buena Vista 24 14 10 0 24
(Continued)
Bureau of Economic and Business Research, University of Florida Florida Estimates of Population 2018 14
Table 1. Estimates of Population by County and City in Florida, 2018
Revenue Sharing Use Only
April 1 Total April 1 Estimates County, City, 2018 Change 2010 less Inmates and State Estimate 2010–2018 Census Inmates April 1, 2018
Orange County (Continued) Maitland 18,612 2,861 15,751 0 18,612 Oakland 3,119 581 2,538 0 3,119 Ocoee 45,694 10,115 35,579 0 45,694 Orlando 285,099 46,799 238,300 635 284,464 Windermere 2,918 456 2,462 0 2,918 Winter Garden 44,935 10,367 34,568 0 44,935 Winter Park 30,212 2,360 27,852 0 30,212 UNINCORPORATED 855,307 118,650 736,657 2,648 852,659
Osceola County 352,496 83,811 268,685 352 352,144 Kissimmee 72,369 12,687 59,682 206 72,163 St. Cloud 46,519 11,336 35,183 0 46,519 UNINCORPORATED 233,608 59,788 173,820 146 233,462
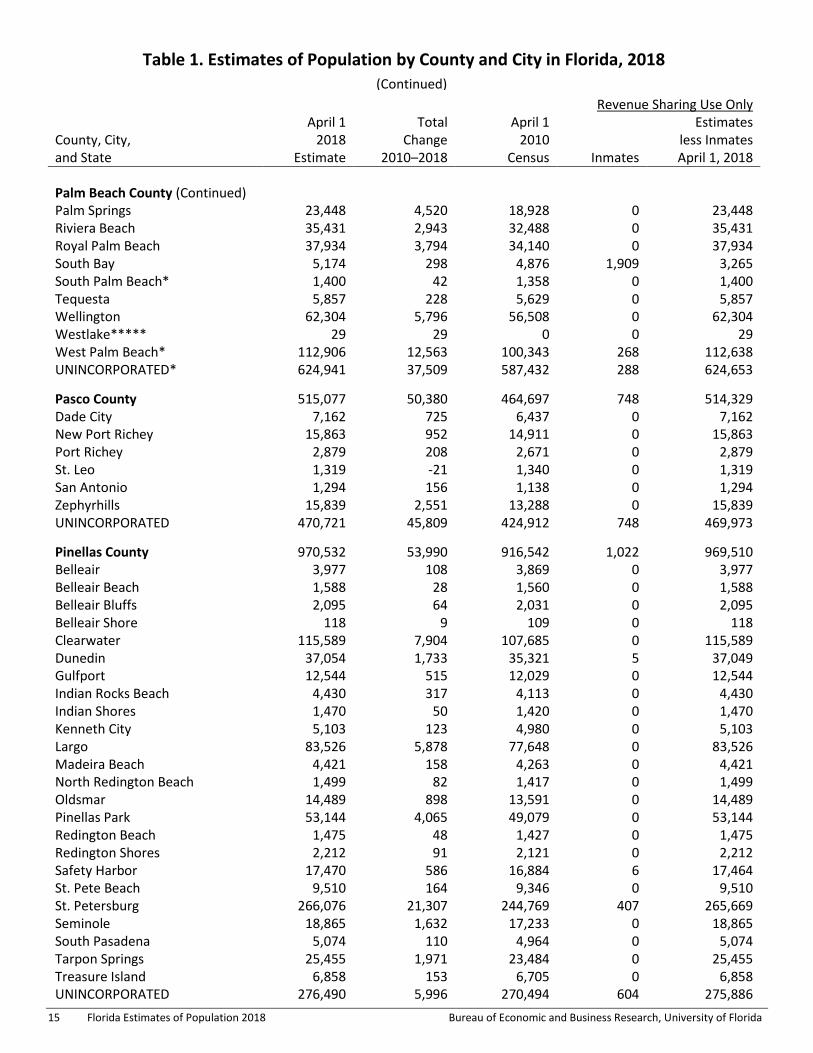
Palm Beach County 1,433,417 113,283 1,320,134 2,862 1,430,555 Atlantis 2,021 16 2,005 0 2,021 Belle Glade 17,589 122 17,467 0 17,589 Boca Raton 93,417 9,025 84,392 0 93,417 Boynton Beach 76,756 8,539 68,217 0 76,756 Briny Breezes 610 9 601 0 610 Cloud Lake 137 2 135 0 137 Delray Beach 66,580 6,058 60,522 0 66,580 Glen Ridge 223 4 219 0 223 Golf 257 5 252 0 257 Greenacres 39,568 1,995 37,573 0 39,568 Gulf Stream 1,005 219 786 0 1,005 Haverhill 2,096 223 1,873 0 2,096 Highland Beach 3,654 115 3,539 0 3,654 Hypoluxo 2,741 153 2,588 0 2,741 Juno Beach 3,427 251 3,176 0 3,427 Jupiter 62,100 6,944 55,156 0 62,100 Jupiter Inlet Colony 409 9 400 0 409 Lake Clarke Shores 3,422 46 3,376 0 3,422 Lake Park 8,829 674 8,155 0 8,829 Lake Worth 38,257 3,347 34,910 0 38,257 Lantana 11,397 974 10,423 24 11,373 Loxahatchee Groves 3,384 204 3,180 0 3,384 Manalapan 425 19 406 0 425 Mangonia Park 2,045 157 1,888 0 2,045 North Palm Beach 12,596 581 12,015 0 12,596 Ocean Ridge 1,827 41 1,786 0 1,827 Pahokee 5,909 260 5,649 373 5,536 Palm Beach* 8,295 134 8,161 0 8,295 Palm Beach Gardens* 53,800 5,360 48,440 0 53,800 Palm Beach Shores 1,217 75 1,142 0 1,217
(Continued)
15 Florida Estimates of Population 2018 Bureau of Economic and Business Research, University of Florida
Table 1. Estimates of Population by County and City in Florida, 2018
Revenue Sharing Use Only
April 1 Total April 1 Estimates County, City, 2018 Change 2010 less Inmates and State Estimate 2010–2018 Census Inmates April 1, 2018
Palm Beach County (Continued) Palm Springs 23,448 4,520 18,928 0 23,448 Riviera Beach 35,431 2,943 32,488 0 35,431 Royal Palm Beach 37,934 3,794 34,140 0 37,934 South Bay 5,174 298 4,876 1,909 3,265 South Palm Beach* 1,400 42 1,358 0 1,400 Tequesta 5,857 228 5,629 0 5,857 Wellington 62,304 5,796 56,508 0 62,304 Westlake***** 29 29 0 0 29 West Palm Beach* 112,906 12,563 100,343 268 112,638 UNINCORPORATED* 624,941 37,509 587,432 288 624,653
Pasco County 515,077 50,380 464,697 748 514,329 Dade City 7,162 725 6,437 0 7,162 New Port Richey 15,863 952 14,911 0 15,863 Port Richey 2,879 208 2,671 0 2,879 St. Leo 1,319 -21 1,340 0 1,319 San Antonio 1,294 156 1,138 0 1,294 Zephyrhills 15,839 2,551 13,288 0 15,839 UNINCORPORATED 470,721 45,809 424,912 748 469,973
Pinellas County 970,532 53,990 916,542 1,022 969,510 Belleair 3,977 108 3,869 0 3,977 Belleair Beach 1,588 28 1,560 0 1,588 Belleair Bluffs 2,095 64 2,031 0 2,095 Belleair Shore 118 9 109 0 118 Clearwater 115,589 7,904 107,685 0 115,589 Dunedin 37,054 1,733 35,321 5 37,049 Gulfport 12,544 515 12,029 0 12,544 Indian Rocks Beach 4,430 317 4,113 0 4,430 Indian Shores 1,470 50 1,420 0 1,470 Kenneth City 5,103 123 4,980 0 5,103 Largo 83,526 5,878 77,648 0 83,526 Madeira Beach 4,421 158 4,263 0 4,421 North Redington Beach 1,499 82 1,417 0 1,499 Oldsmar 14,489 898 13,591 0 14,489 Pinellas Park 53,144 4,065 49,079 0 53,144 Redington Beach 1,475 48 1,427 0 1,475 Redington Shores 2,212 91 2,121 0 2,212 Safety Harbor 17,470 586 16,884 6 17,464 St. Pete Beach 9,510 164 9,346 0 9,510 St. Petersburg 266,076 21,307 244,769 407 265,669 Seminole 18,865 1,632 17,233 0 18,865 South Pasadena 5,074 110 4,964 0 5,074 Tarpon Springs 25,455 1,971 23,484 0 25,455 Treasure Island 6,858 153 6,705 0 6,858 UNINCORPORATED 276,490 5,996 270,494 604 275,886
(Continued)

Bureau of Economic and Business Research, University of Florida Florida Estimates of Population 2018 16
Table 1. Estimates of Population by County and City in Florida, 2018
Revenue Sharing Use Only
April 1 Total April 1 Estimates County, City, 2018 Change 2010 less Inmates and State Estimate 2010–2018 Census Inmates April 1, 2018
Polk County 673,028 70,933 602,095 3,155 669,873 Auburndale 16,246 2,739 13,507 0 16,246 Bartow 19,342 2,044 17,298 158 19,184 Davenport 5,602 2,714 2,888 0 5,602 Dundee 4,662 945 3,717 0 4,662 Eagle Lake 2,574 319 2,255 0 2,574 Fort Meade 5,993 367 5,626 0 5,993 Frostproof 3,130 138 2,992 0 3,130 Haines City* 24,298 3,738 20,560 0 24,298 Highland Park 258 28 230 0 258 Hillcrest Heights 253 -1 254 0 253 Lake Alfred 5,950 935 5,015 0 5,950 Lake Hamilton 1,380 149 1,231 0 1,380 Lakeland 105,586 8,164 97,422 0 105,586 Lake Wales 15,791 1,566 14,225 0 15,791 Mulberry 3,865 48 3,817 0 3,865 Polk City 2,088 526 1,562 0 2,088 Winter Haven 42,828 8,954 33,874 0 42,828 UNINCORPORATED* 413,182 37,560 375,622 2,997 410,185
Putnam County 72,981 -1,383 74,364 481 72,500 Crescent City 1,553 -24 1,577 0 1,553 Interlachen 1,339 -64 1,403 0 1,339 Palatka 10,649 91 10,558 0 10,649 Pomona Park 871 -41 912 0 871 Welaka 712 11 701 0 712 UNINCORPORATED 57,857 -1,356 59,213 481 57,376
St. Johns County 238,742 48,703 190,039 156 238,586 Hastings****** 0 -580 580 0 0 Marineland (part) 2 2 0 0 2 St. Augustine 14,021 1,046 12,975 0 14,021 St. Augustine Beach 6,713 537 6,176 0 6,713 UNINCORPORATED 218,006 47,698 170,308 156 217,850
St. Lucie County 302,432 24,643 277,789 138 302,294 Fort Pierce 43,326 1,736 41,590 52 43,274 Port St. Lucie 185,843 21,240 164,603 6 185,837 St. Lucie Village 634 44 590 0 634 UNINCORPORATED 72,629 1,623 71,006 80 72,549
Santa Rosa County 174,887 23,515 151,372 4,807 170,080 Gulf Breeze 5,849 86 5,763 0 5,849 Jay 521 -12 533 0 521 Milton 10,186 1,360 8,826 60 10,126 UNINCORPORATED 158,331 22,081 136,250 4,747 153,584
(Continued)
17 Florida Estimates of Population 2018 Bureau of Economic and Business Research, University of Florida
Table 1. Estimates of Population by County and City in Florida, 2018
Revenue Sharing Use Only
April 1 Total April 1 Estimates County, City, 2018 Change 2010 less Inmates and State Estimate 2010–2018 Census Inmates April 1, 2018
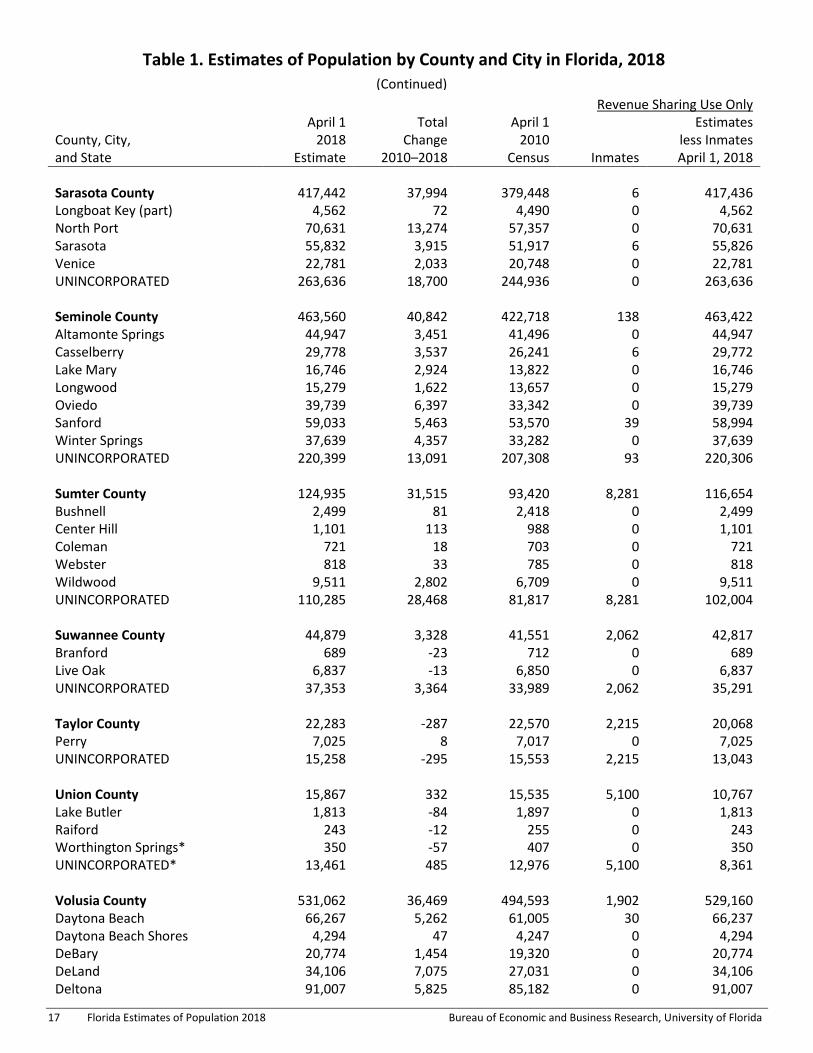
Sarasota County 417,442 37,994 379,448 6 417,436 Longboat Key (part) 4,562 72 4,490 0 4,562 North Port 70,631 13,274 57,357 0 70,631 Sarasota 55,832 3,915 51,917 6 55,826 Venice 22,781 2,033 20,748 0 22,781 UNINCORPORATED 263,636 18,700 244,936 0 263,636
Seminole County 463,560 40,842 422,718 138 463,422 Altamonte Springs 44,947 3,451 41,496 0 44,947 Casselberry 29,778 3,537 26,241 6 29,772 Lake Mary 16,746 2,924 13,822 0 16,746 Longwood 15,279 1,622 13,657 0 15,279 Oviedo 39,739 6,397 33,342 0 39,739 Sanford 59,033 5,463 53,570 39 58,994 Winter Springs 37,639 4,357 33,282 0 37,639 UNINCORPORATED 220,399 13,091 207,308 93 220,306
Sumter County 124,935 31,515 93,420 8,281 116,654 Bushnell 2,499 81 2,418 0 2,499 Center Hill 1,101 113 988 0 1,101 Coleman 721 18 703 0 721 Webster 818 33 785 0 818 Wildwood 9,511 2,802 6,709 0 9,511 UNINCORPORATED 110,285 28,468 81,817 8,281 102,004
Suwannee County 44,879 3,328 41,551 2,062 42,817 Branford 689 -23 712 0 689 Live Oak 6,837 -13 6,850 0 6,837 UNINCORPORATED 37,353 3,364 33,989 2,062 35,291
Taylor County 22,283 -287 22,570 2,215 20,068 Perry 7,025 8 7,017 0 7,025 UNINCORPORATED 15,258 -295 15,553 2,215 13,043
Union County 15,867 332 15,535 5,100 10,767 Lake Butler 1,813 -84 1,897 0 1,813 Raiford 243 -12 255 0 243 Worthington Springs* 350 -57 407 0 350 UNINCORPORATED* 13,461 485 12,976 5,100 8,361
Volusia County 531,062 36,469 494,593 1,902 529,160 Daytona Beach 66,267 5,262 61,005 30 66,237 Daytona Beach Shores 4,294 47 4,247 0 4,294 DeBary 20,774 1,454 19,320 0 20,774 DeLand 34,106 7,075 27,031 0 34,106 Deltona 91,007 5,825 85,182 0 91,007
(Continued)

Bureau of Economic and Business Research, University of Florida Florida Estimates of Population 2018 18
Table 1. Estimates of Population by County and City in Florida, 2018
Revenue Sharing Use Only
April 1 Total April 1 Estimates County, City, 2018 Change 2010 less Inmates and State Estimate 2010–2018 Census Inmates April 1, 2018
Volusia County (Continued) Edgewater 23,319 2,569 20,750 0 23,319 Flagler Beach (part) 60 0 60 0 60 Holly Hill 11,958 299 11,659 0 11,958 Lake Helen 2,752 128 2,624 0 2,752 New Smyrna Beach 26,407 3,943 22,464 0 26,407 Oak Hill 1,997 205 1,792 0 1,997 Orange City 11,720 1,121 10,599 0 11,720 Ormond Beach 41,140 3,003 38,137 6 41,134 Pierson 1,760 24 1,736 0 1,760 Ponce Inlet 3,111 79 3,032 0 3,111 Port Orange 61,009 4,961 56,048 0 61,009 South Daytona 12,703 451 12,252 0 12,703 UNINCORPORATED 116,678 23 116,655 1,866 114,812 Wakulla County 31,943 1,167 30,776 2,448 29,495 St. Marks 277 -16 293 0 277 Sopchoppy 473 16 457 0 473 UNINCORPORATED 31,193 1,167 30,026 2,448 28,745
Walton County 67,656 12,613 55,043 1,551 66,105 DeFuniak Springs 5,481 304 5,177 0 5,481 Freeport 3,845 2,058 1,787 0 3,845 Paxton 610 -34 644 0 610 UNINCORPORATED 57,720 10,285 47,435 1,551 56,169
Washington County 25,129 233 24,896 2,215 22,914 Caryville 293 -118 411 0 293 Chipley 3,506 -99 3,605 0 3,506 Ebro 238 -32 270 0 238 Vernon 751 64 687 0 751 Wausau 375 -8 383 0 375 UNINCORPORATED 19,966 426 19,540 2,215 17,751
Florida* 20,840,568 2,039,236 18,801,332 119,036 20,721,532 Incorporated* 10,556,970 1,103,789 9,453,181 18,873 10,538,097 Unincorporated* 10,283,598 935,447 9,348,151 100,163 10,183,435
* Includes US Census Bureau corrections as of February 11, 2014.
** The Village of Estero was incorporated on December 31, 2014.
*** The Village of Indiantown was incorporated on December 31, 2017.
**** The City of Islandia was disincorporated on March 6, 2012.
***** The City of Westlake was incorporated on June 20, 2016.
****** The City of Hastings was disincorporated on February 28, 2018.
(Continued)

19 Florida Estimates of Population 2018 Bureau of Economic and Business Research, University of Florida
Table 2. Components of Population Change for Counties in Florida, 2010 to 2018
Total Components of Change
Percent of Change Due to—
State and Change Natural Net Natural Net
County 2010–2018 Births Deaths Increase Migration Increase Migration
FLORIDA* 2,039,236 1,748,679 1,478,343 270,336 1,768,900
13.3 86.7
Alachua 15,955 23,018 14,550 8,468 7,487
53.1 46.9
Baker 537 2,738 1,883 855 -318
100.0 0.0
Bay 12,347 18,282 14,380 3,902 8,445
31.6 68.4
Bradford -463 2,454 2,354 100 -563
0.0 100.0
Brevard 40,187 41,179 53,485 -12,306 52,493
0.0 100.0
Broward 149,910 174,540 116,944 57,596 92,314
38.4 61.6
Calhoun 468 1,140 1,307 -167 635
0.0 100.0
Charlotte 18,009 8,190 19,407 -11,217 29,226
0.0 100.0
Citrus 4,485 8,394 19,465 -11,071 15,556
0.0 100.0
Clay 21,169 17,106 12,810 4,296 16,873
20.3 79.7
Collier 45,827 25,888 24,570 1,318 44,509
2.9 97.1
Columbia 2,190 6,449 6,131 318 1,872
14.5 85.5
DeSoto 658 3,065 2,513 552 106
83.9 16.1
Dixie 67 1,239 1,697 -458 525
0.0 100.0
Duval 88,598 102,062 61,095 40,967 47,631
46.2 53.8
Escambia 20,941 31,194 25,393 5,801 15,140
27.7 72.3
Flagler 11,815 6,485 9,485 -3,000 14,815
0.0 100.0
Franklin 460 841 1,026 -185 645
0.0 100.0
Gadsden 1,439 4,573 3,675 898 541
62.4 37.6
Gilchrist 485 1,520 1,485 35 450
7.2 92.8
Glades 118 548 881 -333 451
0.0 100.0
Gulf 636 985 1,405 -420 1,056
0.0 100.0
Hamilton -178 1,261 1,130 131 -309
0.0 100.0
Hardee -435 3,147 1,661 1,486 -1,921
0.0 100.0
Hendry 446 4,732 2,227 2,505 -2,059
100.0 0.0
Hernando 12,826 12,111 20,430 -8,319 21,145
0.0 100.0
Highlands 3,739 7,298 11,859 -4,561 8,300
0.0 100.0
Hillsborough 179,638 135,048 78,857 56,191 123,447
31.3 68.7
Holmes 206 1,598 2,017 -419 625
0.0 100.0
Indian River 13,797 10,096 15,080 -4,984 18,781
0.0 100.0
Jackson 689 4,008 4,652 -644 1,333
0.0 100.0
Jefferson -28 1,041 1,295 -254 226
100.0 0.0
Lafayette -369 602 591 11 -380
0.0 100.0

Bureau of Economic and Business Research, University of Florida Florida Estimates of Population 2018 20
Table 2. Components of Population Change for Counties in Florida, 2010 to 2018 (Continued)
Total Components of Change
Percent of Change Due to—
State and Change Natural Net Natural Net
County 2010–2018 Births Deaths Increase Migration Increase Migration
Lake* 45,870 25,080 29,856 -4,776 50,646
0.0 100.0
Lee 95,149 51,947 51,952 -5 95,154
0.0 100.0
Leon 16,845 24,411 14,181 10,230 6,615
60.7 39.3
Levy 253 3,187 4,241 -1,054 1,307
0.0 100.0
Liberty 550 647 521 126 424
22.9 77.1
Madison 249 1,631 1,769 -138 387
0.0 100.0
Manatee 54,993 27,452 29,304 -1,852 56,845
0.0 100.0
Marion* 22,595 27,327 37,519 -10,192 32,787
0.0 100.0
Martin 9,238 9,777 14,639 -4,862 14,100
0.0 100.0
Miami-Dade* 282,865 253,227 152,110 101,117 181,748
35.7 64.3
Monroe 850 5,831 5,564 267 583
31.4 68.6
Nassau 9,434 6,232 6,067 165 9,269
1.7 98.3
Okaloosa 17,330 21,658 13,266 8,392 8,938
48.4 51.6
Okeechobee 1,124 4,226 3,434 792 332
70.5 29.5
Orange 203,641 128,618 58,748 69,870 133,771
34.3 65.7
Osceola 83,811 32,314 15,710 16,604 67,207
19.8 80.2
Palm Beach 113,283 115,071 110,726 4,345 108,938
3.8 96.2
Pasco 50,380 39,201 45,759 -6,558 56,938
0.0 100.0
Pinellas 53,990 67,754 91,964 -24,210 78,200
0.0 100.0
Polk 70,933 59,868 50,382 9,486 61,447
13.4 86.6
Putnam -1,383 6,741 7,694 -953 -430
68.9 31.1
St. Johns 48,703 16,071 13,793 2,278 46,425
4.7 95.3
St. Lucie 24,643 24,097 23,674 423 24,220
1.7 98.3
Santa Rosa 23,515 14,824 10,520 4,304 19,211
18.3 81.7
Sarasota 37,994 23,084 42,074 -18,990 56,984
0.0 100.0
Seminole 40,842 36,241 25,240 11,001 29,841
26.9 73.1
Sumter 31,515 3,715 12,093 -8,378 39,893
0.0 100.0
Suwannee 3,328 3,710 4,372 -662 3,990
0.0 100.0
Taylor -287 1,899 1,931 -32 -255
11.1 88.9
Union 332 1,299 1,730 -431 763
0.0 100.0
Volusia 36,469 38,433 52,837 -14,404 50,873
0.0 100.0
Wakulla 1,167 2,611 2,044 567 600
48.6 51.4
Walton 12,613 5,739 4,588 1,151 11,462
9.1 90.9
Washington 233 1,924 2,301 -377 610
0.0 100.0
* Includes US Census Bureau corrections as of February 11, 2014.

21 Florida Estimates of Population 2018 Bureau of Economic and Business Research, University of Florida
Table 3. Population and Population Change for Counties in Florida, 1990 to 2018
Percent Change
State and Population 2010 2000 1990
County 2018 2010 2000 1990 to 2018 to 2010 to 2000
FLORIDA* 20,840,568 18,801,332 15,982,824 12,938,071 10.8 17.6 23.5
Alachua 263,291 247,336 217,955 181,596 6.5 13.5 20.0
Baker 27,652 27,115 22,259 18,486 2.0 21.8 20.4
Bay 181,199 168,852 148,217 126,994 7.3 13.9 16.7
Bradford 28,057 28,520 26,088 22,515 -1.6 9.3 15.9
Brevard 583,563 543,376 476,230 398,978 7.4 14.1 19.4
Broward 1,897,976 1,748,066 1,623,018 1,255,531 8.6 7.7 29.3
Calhoun 15,093 14,625 13,017 11,011 3.2 12.4 18.2
Charlotte 177,987 159,978 141,627 110,975 11.3 13.0 27.6
Citrus 145,721 141,236 118,085 93,513 3.2 19.6 26.3
Clay 212,034 190,865 140,814 105,986 11.1 35.5 32.9
Collier 367,347 321,520 251,377 152,099 14.3 27.9 65.3
Columbia 69,721 67,531 56,513 42,613 3.2 19.5 32.6
DeSoto 35,520 34,862 32,209 23,865 1.9 8.2 35.0
Dixie 16,489 16,422 13,827 10,585 0.4 18.8 30.6
Duval 952,861 864,263 778,879 672,971 10.3 11.0 15.7
Escambia 318,560 297,619 294,410 262,798 7.0 1.1 12.0
Flagler 107,511 95,696 49,832 28,701 12.3 92.0 73.6
Franklin 12,009 11,549 9,829 8,967 4.0 17.5 9.6
Gadsden 47,828 46,389 45,087 41,116 3.1 2.9 9.7
Gilchrist 17,424 16,939 14,437 9,667 2.9 17.3 49.3
Glades 13,002 12,884 10,576 7,591 0.9 21.8 39.3
Gulf 16,499 15,863 14,560 11,504 4.0 8.9 26.6
Hamilton 14,621 14,799 13,327 10,930 -1.2 11.0 21.9
Hardee 27,296 27,731 26,938 19,499 -1.6 2.9 38.2
Hendry 39,586 39,140 36,210 25,773 1.1 8.1 40.5
Hernando 185,604 172,778 130,802 101,115 7.4 32.1 29.4
Highlands 102,525 98,786 87,366 68,432 3.8 13.1 27.7
Hillsborough 1,408,864 1,229,226 998,948 834,054 14.6 23.1 19.8
Holmes 20,133 19,927 18,564 15,778 1.0 7.3 17.7
Indian River 151,825 138,028 112,947 90,208 10.0 22.2 25.2
Jackson 50,435 49,746 46,755 41,375 1.4 6.4 13.0
Jefferson 14,733 14,761 12,902 11,296 -0.2 14.4 14.2
Lafayette 8,501 8,870 7,022 5,578 -4.2 26.3 25.9

Bureau of Economic and Business Research, University of Florida Florida Estimates of Population 2018 22
Table 3. Population and Population Change for Counties in Florida, 1990 to 2018 (Continued)
Percent Change
State and Population 2010 2000 1990
County 2018 2010 2000 1990 to 2018 to 2010 to 2000
Lake* 342,917 297,047 210,527 152,104 15.4 41.1 38.4
Lee 713,903 618,754 440,888 335,113 15.4 40.3 31.6
Leon 292,332 275,487 239,452 192,493 6.1 15.0 24.4
Levy 41,054 40,801 34,450 25,912 0.6 18.4 32.9
Liberty 8,915 8,365 7,021 5,569 6.6 19.1 26.1
Madison 19,473 19,224 18,733 16,569 1.3 2.6 13.1
Manatee 377,826 322,833 264,002 211,707 17.0 22.3 24.7
Marion* 353,898 331,303 258,916 194,835 6.8 28.0 32.9
Martin 155,556 146,318 126,731 100,900 6.3 15.5 25.6
Miami-Dade* 2,779,322 2,496,457 2,253,779 1,937,194 11.3 10.8 16.3
Monroe 73,940 73,090 79,589 78,024 1.2 -8.2 2.0
Nassau 82,748 73,314 57,663 43,941 12.9 27.1 31.2
Okaloosa 198,152 180,822 170,498 143,777 9.6 6.1 18.6
Okeechobee 41,120 39,996 35,910 29,627 2.8 11.4 21.2
Orange 1,349,597 1,145,956 896,344 677,491 17.8 27.8 32.3
Osceola 352,496 268,685 172,493 107,728 31.2 55.8 60.1
Palm Beach 1,433,417 1,320,134 1,131,191 863,503 8.6 16.7 31.0
Pasco 515,077 464,697 344,768 281,131 10.8 34.8 22.6
Pinellas 970,532 916,542 921,495 851,659 5.9 -0.5 8.2
Polk 673,028 602,095 483,924 405,382 11.8 24.4 19.4
Putnam 72,981 74,364 70,423 65,070 -1.9 5.6 8.2
St. Johns 238,742 190,039 123,135 83,829 25.6 54.3 46.9
St. Lucie 302,432 277,789 192,695 150,171 8.9 44.2 28.3
Santa Rosa 174,887 151,372 117,743 81,608 15.5 28.6 44.3
Sarasota 417,442 379,448 325,961 277,776 10.0 16.4 17.3
Seminole 463,560 422,718 365,199 287,521 9.7 15.8 27.0
Sumter 124,935 93,420 53,345 31,577 33.7 75.1 68.9
Suwannee 44,879 41,551 34,844 26,780 8.0 19.2 30.1
Taylor 22,283 22,570 19,256 17,111 -1.3 17.2 12.5
Union 15,867 15,535 13,442 10,252 2.1 15.6 31.1
Volusia 531,062 494,593 443,343 370,737 7.4 11.6 19.6
Wakulla 31,943 30,776 22,863 14,202 3.8 34.6 61.0
Walton 67,656 55,043 40,601 27,759 22.9 35.6 46.3
Washington 25,129 24,896 20,973 16,919 0.9 18.7 24.0
* Includes US Census Bureau corrections as of February 11, 2014.
23 Florida Estimates of Population 2018 Bureau of Economic and Business Research, University of Florida
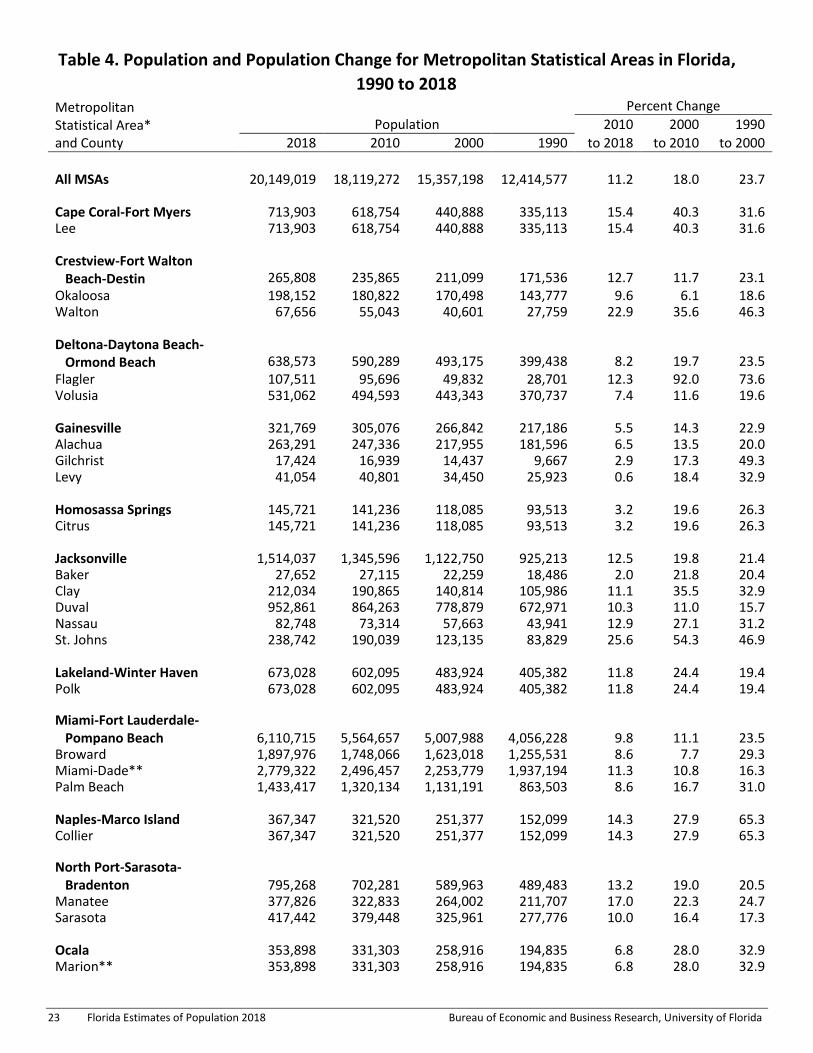
Table 4. Population and Population Change for Metropolitan Statistical Areas in Florida,
1990 to 2018 Metropolitan Statistical Area* and County
Percent Change
Population 2010 2000 1990
2018 2010 2000 1990 to 2018 to 2010 to 2000
All MSAs 20,149,019 18,119,272 15,357,198 12,414,577 11.2 18.0 23.7
Cape Coral-Fort Myers 713,903 618,754 440,888 335,113 15.4 40.3 31.6 Lee 713,903 618,754 440,888 335,113 15.4 40.3 31.6
Crestview-Fort Walton Beach-Destin 265,808 235,865 211,099 171,536 12.7 11.7 23.1 Okaloosa 198,152 180,822 170,498 143,777 9.6 6.1 18.6 Walton 67,656 55,043 40,601 27,759 22.9 35.6 46.3
Deltona-Daytona Beach- Ormond Beach 638,573 590,289 493,175 399,438 8.2 19.7 23.5 Flagler 107,511 95,696 49,832 28,701 12.3 92.0 73.6 Volusia 531,062 494,593 443,343 370,737 7.4 11.6 19.6
Gainesville 321,769 305,076 266,842 217,186 5.5 14.3 22.9 Alachua 263,291 247,336 217,955 181,596 6.5 13.5 20.0 Gilchrist 17,424 16,939 14,437 9,667 2.9 17.3 49.3 Levy 41,054 40,801 34,450 25,923 0.6 18.4 32.9
Homosassa Springs 145,721 141,236 118,085 93,513 3.2 19.6 26.3 Citrus 145,721 141,236 118,085 93,513 3.2 19.6 26.3
Jacksonville 1,514,037 1,345,596 1,122,750 925,213 12.5 19.8 21.4 Baker 27,652 27,115 22,259 18,486 2.0 21.8 20.4 Clay 212,034 190,865 140,814 105,986 11.1 35.5 32.9 Duval 952,861 864,263 778,879 672,971 10.3 11.0 15.7 Nassau 82,748 73,314 57,663 43,941 12.9 27.1 31.2 St. Johns 238,742 190,039 123,135 83,829 25.6 54.3 46.9
Lakeland-Winter Haven 673,028 602,095 483,924 405,382 11.8 24.4 19.4 Polk 673,028 602,095 483,924 405,382 11.8 24.4 19.4
Miami-Fort Lauderdale- Pompano Beach 6,110,715 5,564,657 5,007,988 4,056,228 9.8 11.1 23.5 Broward 1,897,976 1,748,066 1,623,018 1,255,531 8.6 7.7 29.3 Miami-Dade** 2,779,322 2,496,457 2,253,779 1,937,194 11.3 10.8 16.3 Palm Beach 1,433,417 1,320,134 1,131,191 863,503 8.6 16.7 31.0 Naples-Marco Island 367,347 321,520 251,377 152,099 14.3 27.9 65.3 Collier 367,347 321,520 251,377 152,099 14.3 27.9 65.3
North Port-Sarasota- Bradenton 795,268 702,281 589,963 489,483 13.2 19.0 20.5 Manatee 377,826 322,833 264,002 211,707 17.0 22.3 24.7 Sarasota 417,442 379,448 325,961 277,776 10.0 16.4 17.3
Ocala 353,898 331,303 258,916 194,835 6.8 28.0 32.9 Marion** 353,898 331,303 258,916 194,835 6.8 28.0 32.9

Bureau of Economic and Business Research, University of Florida Florida Estimates of Population 2018 24
Table 4. Population and Population Change for Metropolitan Statistical Areas in Florida,
1990 to 2018 (Continued) Metropolitan Statistical Area* and County
Percent Change
Population 2010 2000 1990
2018 2010 2000 1990 to 2018 to 2010 to 2000
Orlando-Kissimmee-Sanford 2,508,570 2,134,406 1,644,563 1,224,844 17.5 29.8 34.3 Lake** 342,917 297,047 210,527 152,104 15.4 41.1 38.4 Orange 1,349,597 1,145,956 896,344 677,491 17.8 27.8 32.3 Osceola 352,496 268,685 172,493 107,728 31.2 55.8 60.1 Seminole 463,560 422,718 365,199 287,521 9.7 15.8 27.0
Palm Bay-Melbourne- Titusville 583,563 543,376 476,230 398,978 7.4 14.1 19.4 Brevard 583,563 543,376 476,230 398,978 7.4 14.1 19.4
Panama City 181,199 168,852 148,217 126,994 7.3 13.9 16.7 Bay 181,199 168,852 148,217 126,994 7.3 13.9 16.7
Pensacola-Ferry Pass-Brent 493,447 448,991 412,153 344,406 9.9 8.9 19.7 Escambia 318,560 297,619 294,410 262,798 7.0 1.1 12.0 Santa Rosa 174,887 151,372 117,743 81,608 15.5 28.6 44.3
Port St. Lucie 457,988 424,107 319,426 251,071 8.0 32.8 27.2 Martin 155,556 146,318 126,731 100,900 6.3 15.5 25.6 St. Lucie 302,432 277,789 192,695 150,171 8.9 44.2 28.3
Punta Gorda 177,987 159,978 141,627 110,975 11.3 13.0 27.6 Charlotte 177,987 159,978 141,627 110,975 11.3 13.0 27.6
Sebastian-Vero Beach 151,825 138,028 112,947 90,208 10.0 22.2 25.2 Indian River 151,825 138,028 112,947 90,208 10.0 22.2 25.2
Sebring-Avon Park 102,525 98,786 87,366 68,432 3.8 13.1 27.7 Highlands 102,525 98,786 87,366 68,432 3.8 13.1 27.7
Tallahassee 386,836 367,413 320,304 259,107 5.3 14.7 23.6 Gadsden 47,828 46,389 45,087 41,116 3.1 2.9 9.7 Jefferson 14,733 14,761 12,902 11,296 -0.2 14.4 14.2 Leon 292,332 275,487 239,452 192,493 6.1 15.0 24.4 Wakulla 31,909 30,776 22,863 14,202 3.7 34.6 61.0
Tampa-St. Petersburg- Clearwater 3,080,077 2,783,243 2,396,013 2,067,959 10.7 16.2 15.9 Hernando 185,604 172,778 130,802 101,115 7.4 32.1 29.4 Hillsborough 1,408,864 1,229,226 998,948 834,054 14.6 23.1 19.8 Pasco 515,077 464,697 344,768 281,131 10.8 34.8 22.6 Pinellas 970,532 916,542 921,495 851,659 5.9 -0.5 8.2
The Villages 124,935 93,420 53,345 31,577 33.7 75.1 68.9 Sumter 124,935 93,420 53,345 31,577 33.7 75.1 68.9
* Based on the September 14, 2018 US Office of Management and Budget MSA definitions, (OMB Bulletin No. 18-04). ** Includes US Census Bureau corrections as of February 11, 2014.

25 Florida Estimates of Population 2018 Bureau of Economic and Business Research, University of Florida
Table 5. Population and Population Change for Regional Planning Councils In Florida,
1990 to 2018 State, Regional Percent Change
Planning Council* Population 2010 2000 1990
and County 2018 2010 2000 1990 to 2018 to 2010 to 2000
FLORIDA** 20,840,568 18,801,332 15,982,824 12,938,071 10.8 17.6 23.5
Apalachee 489,787 467,561 411,486 337,533 4.8 13.6 21.9 Calhoun 15,093 14,625 13,017 11,011 3.2 12.4 18.2 Franklin 12,009 11,549 9,829 8,967 4.0 17.5 9.6 Gadsden 47,828 46,389 45,087 41,116 3.1 2.9 9.7
Gulf 16,499 15,863 14,560 11,504 4.0 8.9 26.6 Jackson 50,435 49,746 46,755 41,375 1.4 6.4 13.0 Jefferson 14,733 14,761 12,902 11,296 -0.2 14.4 14.2 Leon 292,332 275,487 239,452 192,493 6.1 15.0 24.4 Liberty 8,915 8,365 7,021 5,569 6.6 19.1 26.1 Wakulla 31,943 30,776 22,863 14,202 3.8 34.6 61.0
Central Florida 879,489 803,470 666,347 546,805 9.5 20.6 21.9 DeSoto 35,520 34,862 32,209 23,865 1.9 8.2 35.0 Hardee 27,296 27,731 26,938 19,499 -1.6 2.9 38.2 Highlands 102,525 98,786 87,366 68,432 3.8 13.1 27.7 Okeechobee 41,120 39,996 35,910 29,627 2.8 11.4 21.2
Polk 673,028 602,095 483,924 405,382 11.8 24.4 19.4
East Central Florida 3,748,130 3,265,795 2,617,481 2,026,136 14.8 24.8 29.2 Brevard 583,563 543,376 476,230 398,978 7.4 14.1 19.4 Lake** 342,917 297,047 210,527 152,104 15.4 41.1 38.4 Orange 1,349,597 1,145,956 896,344 677,491 17.8 27.8 32.3 Osceola 352,496 268,685 172,493 107,728 31.2 55.8 60.1 Seminole 463,560 422,718 365,199 287,521 9.7 15.8 27.0 Sumter 124,935 93,420 53,345 31,577 33.7 75.1 68.9 Volusia 531,062 494,593 443,343 370,737 7.4 11.6 19.6
North Central Florida 915,558 871,401 728,810 574,943 5.1 19.6 26.8 Alachua 263,291 247,336 217,955 181,596 6.5 13.5 20.0 Bradford 28,057 28,520 26,088 22,515 -1.6 9.3 15.9 Columbia 69,721 67,531 56,513 42,613 3.2 19.5 32.6 Dixie 16,489 16,422 13,827 10,585 0.4 18.8 30.6 Gilchrist 17,424 16,939 14,437 9,667 2.9 17.3 49.3 Hamilton 14,621 14,799 13,327 10,930 -1.2 11.0 21.9 Lafayette 8,501 8,870 7,022 5,578 -4.2 26.3 25.9 Levy 41,054 40,801 34,450 25,912 0.6 18.4 32.9 Madison 19,473 19,224 18,733 16,569 1.3 2.6 13.1 Marion** 353,898 331,303 258,916 194,835 6.8 28.0 32.9 Suwannee 44,879 41,551 34,844 26,780 8.0 19.2 30.1 Taylor 22,283 22,570 19,256 17,111 -1.3 17.2 12.5 Union 15,867 15,535 13,442 10,252 2.1 15.6 31.1
Bureau of Economic and Business Research, University of Florida Florida Estimates of Population 2018 26
Table 5. Population and Population Change for Regional Planning Councils In Florida,
1990 to 2018 (Continued) State, Regional Percent Change
Planning Council* Population 2010 2000 1990
and County 2018 2010 2000 1990 to 2018 to 2010 to 2000
Northeast Florida 1,694,529 1,515,656 1,243,005 1,018,984 11.8 21.9 22.0 Baker 27,652 27,115 22,259 18,486 2.0 21.8 20.4 Clay 212,034 190,865 140,814 105,986 11.1 35.5 32.9 Duval 952,861 864,263 778,879 672,971 10.3 11.0 15.7 Flagler 107,511 95,696 49,832 28,701 12.3 92.0 73.6 Nassau 82,748 73,314 57,663 43,941 12.9 27.1 31.2
Putnam 72,981 74,364 70,423 65,070 -1.9 5.6 8.2 St. Johns 238,742 190,039 123,135 83,829 25.6 54.3 46.9
South Florida 4,751,238 4,317,613 3,956,386 3,270,749 10.0 9.1 21.0 Broward 1,897,976 1,748,066 1,623,018 1,255,531 8.6 7.7 29.3 Miami-Dade** 2,779,322 2,496,457 2,253,779 1,937,194 11.3 10.8 16.3 Monroe 73,940 73,090 79,589 78,024 1.2 -8.2 2.0
Southwest Florida 1,729,267 1,531,724 1,206,639 909,327 12.9 26.9 32.7 Charlotte 177,987 159,978 141,627 110,975 11.3 13.0 27.6
Collier 367,347 321,520 251,377 152,099 14.3 27.9 65.3 Glades 13,002 12,884 10,576 7,591 0.9 21.8 39.3 Hendry 39,586 39,140 36,210 25,773 1.1 8.1 40.5 Lee 713,903 618,754 440,888 335,113 15.4 40.3 31.6 Sarasota 417,442 379,448 325,961 277,776 10.0 16.4 17.3
Tampa Bay 3,603,624 3,247,312 2,778,100 2,373,179 11.0 16.9 17.1 Citrus 145,721 141,236 118,085 93,513 3.2 19.6 26.3 Hernando 185,604 172,778 130,802 101,115 7.4 32.1 29.4 Hillsborough 1,408,864 1,229,226 998,948 834,054 14.6 23.1 19.8 Manatee 377,826 322,833 264,002 211,707 17.0 22.3 24.7 Pasco 515,077 464,697 344,768 281,131 10.8 34.8 22.6
Pinellas 970,532 916,542 921,495 851,659 5.9 -0.5 8.2
Treasure Coast 2,043,230 1,882,269 1,563,564 1,204,782 8.6 20.4 29.8 Indian River 151,825 138,028 112,947 90,208 10.0 22.2 25.2 Martin 155,556 146,318 126,731 100,900 6.3 15.5 25.6 Palm Beach 1,433,417 1,320,134 1,131,191 863,503 8.6 16.7 31.0 St. Lucie 302,432 277,789 192,695 150,171 8.9 44.2 28.3
West Florida 985,716 898,531 811,006 675,633 9.7 10.8 20.0 Bay 181,199 168,852 148,217 126,994 7.3 13.9 16.7 Escambia 318,560 297,619 294,410 262,798 7.0 1.1 12.0 Holmes 20,133 19,927 18,564 15,778 1.0 7.3 17.7 Okaloosa 198,152 180,822 170,498 143,777 9.6 6.1 18.6 Santa Rosa 174,887 151,372 117,743 81,608 15.5 28.6 44.3 Walton 67,656 55,043 40,601 27,759 22.9 35.6 46.3 Washington 25,129 24,896 20,973 16,919 0.9 18.7 24.0 * During the 2015 Legislative Session, Chapter 2015-30, L.O.F., (CS/CS/SB 1216) designated 10 Regional Planning Councils (RPCs) and their respective county government memberships. The Withlacoochee RPC was dissolved and the five counties within that council were reassigned into three other councils.
** Includes US Census Bureau corrections as of February 11, 2014.

27 Florida Estimates of Population 2018 Bureau of Economic and Business Research, University of Florida
Table 6. Rank of Florida Counties by Population Size in 2018 and Population Distribution,
1990 to 2018
State Population Percent of State Population
Rank and County 2018 2010 2000 1990 2018 2010 2000 1990
FLORIDA* 20,840,568 18,801,332 15,982,824 12,938,071 100.00 100.00 100.00 100.00
1 Miami-Dade* 2,779,322 2,496,457 2,253,779 1,937,194 13.34 13.28 14.10 14.97
2 Broward 1,897,976 1,748,066 1,623,018 1,255,531 9.11 9.30 10.15 9.70
3 Palm Beach 1,433,417 1,320,134 1,131,191 863,503 6.88 7.02 7.08 6.67
4 Hillsborough 1,408,864 1,229,226 998,948 834,054 6.76 6.54 6.25 6.45
5 Orange 1,349,597 1,145,956 896,344 677,491 6.48 6.10 5.61 5.24
6 Pinellas 970,532 916,542 921,495 851,659 4.66 4.87 5.77 6.58
7 Duval 952,861 864,263 778,879 672,971 4.57 4.60 4.87 5.20
8 Lee 713,903 618,754 440,888 335,113 3.43 3.29 2.76 2.59
9 Polk 673,028 602,095 483,924 405,382 3.23 3.20 3.03 3.13
10 Brevard 583,563 543,376 476,230 398,978 2.80 2.89 2.98 3.08
11 Volusia 531,062 494,593 443,343 370,737 2.55 2.63 2.77 2.87
12 Pasco 515,077 464,697 344,768 281,131 2.47 2.47 2.16 2.17
13 Seminole 463,560 422,718 365,199 287,521 2.22 2.25 2.28 2.22
14 Sarasota 417,442 379,448 325,961 277,776 2.00 2.02 2.04 2.15
15 Manatee 377,826 322,833 264,002 211,707 1.81 1.72 1.65 1.64
16 Collier 367,347 321,520 251,377 152,099 1.76 1.71 1.57 1.18
17 Marion* 353,898 331,303 258,916 194,835 1.70 1.76 1.62 1.51
18 Osceola 352,496 268,685 172,493 107,728 1.69 1.43 1.08 0.83
19 Lake* 342,917 297,047 210,527 152,104 1.65 1.58 1.32 1.18
20 Escambia 318,560 297,619 294,410 262,798 1.53 1.58 1.84 2.03
21 St. Lucie 302,432 277,789 192,695 150,171 1.45 1.48 1.21 1.16
22 Leon 292,332 275,487 239,452 192,493 1.40 1.47 1.50 1.49
23 Alachua 263,291 247,336 217,955 181,596 1.26 1.32 1.36 1.40
24 St. Johns 238,742 190,039 123,135 83,829 1.15 1.01 0.77 0.65
25 Clay 212,034 190,865 140,814 105,986 1.02 1.02 0.88 0.82
26 Okaloosa 198,152 180,822 170,498 143,777 0.95 0.96 1.07 1.11
27 Hernando 185,604 172,778 130,802 101,115 0.89 0.92 0.82 0.78
28 Bay 181,199 168,852 148,217 126,994 0.87 0.90 0.93 0.98
29 Charlotte 177,987 159,978 141,627 110,975 0.85 0.85 0.89 0.86
30 Santa Rosa 174,887 151,372 117,743 81,608 0.84 0.81 0.74 0.63
31 Martin 155,556 146,318 126,731 100,900 0.75 0.78 0.79 0.78
32 Indian River 151,825 138,028 112,947 90,208 0.73 0.73 0.71 0.70
33 Citrus 145,721 141,236 118,085 93,513 0.70 0.75 0.74 0.72
34 Sumter 124,935 93,420 53,345 31,577 0.60 0.50 0.33 0.24
35 Flagler 107,511 95,696 49,832 28,701 0.52 0.51 0.31 0.22

Bureau of Economic and Business Research, University of Florida Florida Estimates of Population 2018 28
Table 6. Rank of Florida Counties by Population Size in 2018 and Population Distribution, 1990 to 2018 (Continued)
State Population Percent of State Population
Rank and County 2018 2010 2000 1990 2018 2010 2000 1990
36 Highlands 102,525 98,786 87,366 68,432 0.49 0.53 0.55 0.53
37 Nassau 82,748 73,314 57,663 43,941 0.40 0.39 0.36 0.34
38 Monroe 73,940 73,090 79,589 78,024 0.35 0.39 0.50 0.60
39 Putnam 72,981 74,364 70,423 65,070 0.35 0.40 0.44 0.50
40 Columbia 69,721 67,531 56,513 42,613 0.33 0.36 0.35 0.33
41 Walton 67,656 55,043 40,601 27,759 0.32 0.29 0.25 0.21
42 Jackson 50,435 49,746 46,755 41,375 0.24 0.26 0.29 0.32
43 Gadsden 47,828 46,389 45,087 41,116 0.23 0.25 0.28 0.32
44 Suwannee 44,879 41,551 34,844 26,780 0.22 0.22 0.22 0.21
45 Okeechobee 41,120 39,996 35,910 29,627 0.20 0.21 0.22 0.23
46 Levy 41,054 40,801 34,450 25,912 0.20 0.22 0.22 0.20
47 Hendry 39,586 39,140 36,210 25,773 0.19 0.21 0.23 0.20
48 DeSoto 35,520 34,862 32,209 23,865 0.17 0.19 0.20 0.18
49 Wakulla 31,943 30,776 22,863 14,202 0.15 0.16 0.14 0.11
50 Bradford 28,057 28,520 26,088 22,515 0.13 0.15 0.16 0.17
51 Baker 27,652 27,115 22,259 18,486 0.13 0.14 0.14 0.14
52 Hardee 27,296 27,731 26,938 19,499 0.13 0.15 0.17 0.15
53 Washington 25,129 24,896 20,973 16,919 0.12 0.13 0.13 0.13
54 Taylor 22,283 22,570 19,256 17,111 0.11 0.12 0.12 0.13
55 Holmes 20,133 19,927 18,564 15,778 0.10 0.11 0.12 0.12
56 Madison 19,473 19,224 18,733 16,569 0.09 0.10 0.12 0.13
57 Gilchrist 17,424 16,939 14,437 9,667 0.08 0.09 0.09 0.07
58 Gulf 16,499 15,863 14,560 11,504 0.08 0.08 0.09 0.09
59 Dixie 16,489 16,422 13,827 10,585 0.08 0.09 0.09 0.08
60 Union 15,867 15,535 13,442 10,252 0.08 0.08 0.08 0.08
61 Calhoun 15,093 14,625 13,017 11,011 0.07 0.08 0.08 0.09
62 Jefferson 14,733 14,761 12,902 11,296 0.07 0.08 0.08 0.09
63 Hamilton 14,621 14,799 13,327 10,930 0.07 0.08 0.08 0.08
64 Glades 13,002 12,884 10,576 7,591 0.06 0.07 0.07 0.06
65 Franklin 12,009 11,549 9,829 8,967 0.06 0.06 0.06 0.07
66 Liberty 8,915 8,365 7,021 5,569 0.04 0.04 0.04 0.04
67 Lafayette 8,501 8,870 7,022 5,578 0.04 0.05 0.04 0.04
* Includes US Census Bureau corrections as of February 11, 2014.

29 Florida Estimates of Population 2018 Bureau of Economic and Business Research, University of Florida
Table 7. Rank of Florida Counties by Percent Change in Population, 2010 to 2018
State and County
Percent Change
Population State and County
Percent Change
Population
Rank 2018 2010 Rank 2018 2010
10.8 20,840,568 18,801,332
34 Liberty 6.6 8,915 8,365
1 33.7 124,935 93,420 35 Alachua 6.5 263,291 247,336
2 31.2 352,496 268,685 36 Martin 6.3 155,556 146,318
3 25.6 238,742 190,039 37 Leon 6.1 292,332 275,487
4 22.9 67,656 55,043 38 Pinellas 5.9 970,532 916,542
5 17.8 1,349,597 1,145,956 39 Gulf 4.0 16,499 15,863
6 17.0 377,826 322,833 40 Franklin 4.0 12,009 11,549
7 15.5 174,887 151,372 41 Wakulla 3.8 31,943 30,776
8 15.4 342,917 297,047 42 Highlands 3.8 102,525 98,786
9 15.4 713,903 618,754 43 Columbia 3.2 69,721 67,531
10 14.6 1,408,864 1,229,226 44 Calhoun 3.2 15,093 14,625
11 14.3 367,347 321,520 45 Citrus 3.2 145,721 141,236
12 12.9 82,748 73,314 46 Gadsden 3.1 47,828 46,389
13 12.3 107,511 95,696 47 Gilchrist 2.9 17,424 16,939
14 11.8 673,028 602,095 48 Okeechobee 2.8 41,120 39,996
15
FLORIDA*
Sumter Osceola
St. Johns Walton Orange
Manatee Santa Rosa Lake*
Lee
Hillsborough
Collier Nassau Flagler
Polk
Miami-Dade*
Dade*
11.3 2,779,322 2,496,457 49 Union 2.1 15,867 15,535
16 Charlotte 11.3 177,987 159,978 50 Baker 2.0 27,652 27,115
17 Clay 11.1 212,034 190,865 51 DeSoto 1.9 35,520 34,862
18 Pasco 10.8 515,077 464,697 52 Jackson 1.4 50,435 49,746
19 Duval 10.3 952,861 864,263 53 Madison 1.3 19,473 19,224
20 Sarasota 10.0 417,442 379,448 54 Monroe 1.2 73,940 73,090
21 Indian River 10.0 151,825 138,028 55 Hendry 1.1 39,586 39,140
22 Seminole 9.7 463,560 422,718 56 Holmes 1.0 20,133 19,927
23 Okaloosa 9.6 198,152 180,822 57 Washington 0.9 25,129 24,896
24 St. Lucie 8.9 302,432 277,789 58 Glades 0.9 13,002 12,884
25 Palm Beach 8.6 1,433,417 1,320,134 59 Levy 0.6 41,054 40,801
26 Broward 8.6 1,897,976 1,748,066 60 Dixie 0.4 16,489 16,422
27 Suwannee 8.0 44,879 41,551 61 Jefferson -0.2 14,733 14,761
28 Hernando 7.4 185,604 172,778 62 Hamilton -1.2 14,621 14,799
29 Brevard 7.4 583,563 543,376 63 Taylor -1.3 22,283 22,570
30 Volusia 7.4 531,062 494,593 64 Hardee -1.6 27,296 27,731
31 Bay 7.3 181,199 168,852 65 Bradford -1.6 28,057 28,520
32 Escambia 7.0 318,560 297,619 66 Putnam -1.9 72,981 74,364
33 Marion* 6.8 353,898 331,303 67 Lafayette -4.2 8,501 8,870
* Includes US Census Bureau corrections as of February 11, 2014.

Bureau of Economic and Business Research, University of Florida Florida Estimates of Population 2018 30
Figure 1. Percent Change in Population, 2010 to 2018
31 Florida Estimates of Population 2018 Bureau of Economic and Business Research, University of Florida
Table 8. Rank of Florida Counties by Population Change, 2010 to 2018
State Population State Population
Rank and County Change 2018 2010 Rank and County Change 2018 2010
FLORIDA* 2,039,236 20,840,568 18,801,332
34 Flagler 11,815 107,511 95,696
1 Miami-Dade* 282,865 2,779,322 2,496,457 35 Nassau 9,434 82,748 73,314
2 Orange 203,641 1,349,597 1,145,956 36 Martin 9,238 155,556 146,318
3 Hillsborough 179,638 1,408,864 1,229,226 37 Citrus 4,485 145,721 141,236
4 Broward 149,910 1,897,976 1,748,066 38 Highlands 3,739 102,525 98,786
5 Palm Beach 113,283 1,433,417 1,320,134 39 Suwannee 3,328 44,879 41,551
6 Lee 95,149 713,903 618,754 40 Columbia 2,190 69,721 67,531
7 Duval 88,598 952,861 864,263 41 Gadsden 1,439 47,828 46,389
8 Osceola 83,811 352,496 268,685 42 Wakulla 1,167 31,943 30,776
9 Polk 70,933 673,028 602,095 43 Okeechobee 1,124 41,120 39,996
10 Manatee 54,993 377,826 322,833 44 Monroe 850 73,940 73,090
11 Pinellas 53,990 970,532 916,542 45 Jackson 689 50,435 49,746
12 Pasco 50,380 515,077 464,697 46 DeSoto 658 35,520 34,862
13 St. Johns 48,703 238,742 190,039 47 Gulf 636 16,499 15,863
14 Lake* 45,870 342,917 297,047 48 Liberty 550 8,915 8,365
15 Collier 45,827 367,347 321,520 49 Baker 537 27,652 27,115
16 Seminole 40,842 463,560 422,718 50 Gilchrist 485 17,424 16,939
17 Brevard 40,187 583,563 543,376 51 Calhoun 468 15,093 14,625
18 Sarasota 37,994 417,442 379,448 52 Franklin 460 12,009 11,549
19 Volusia 36,469 531,062 494,593 53 Hendry 446 39,586 39,140
20 Sumter 31,515 124,935 93,420 54 Union 332 15,867 15,535
21 St. Lucie 24,643 302,432 277,789 55 Levy 253 41,054 40,801
22 Santa Rosa 23,515 174,887 151,372 56 Madison 249 19,473 19,224
23 Marion* 22,595 353,898 331,303 57 Washington 233 25,129 24,896
24 Clay 21,169 212,034 190,865 58 Holmes 206 20,133 19,927
25 Escambia 20,941 318,560 297,619 59 Glades 118 13,002 12,884
26 Charlotte 18,009 177,987 159,978 60 Dixie 67 16,489 16,422
27 Okaloosa 17,330 198,152 180,822 61 Jefferson -28 14,733 14,761
28 Leon 16,845 292,332 275,487 62 Hamilton -178 14,621 14,799
29 Alachua 15,955 263,291 247,336 63 Taylor -287 22,283 22,570
30 Indian River 13,797 151,825 138,028 64 Lafayette -369 8,501 8,870
31 Hernando 12,826 185,604 172,778 65 Hardee -435 27,296 27,731
32 Walton 12,613 67,656 55,043 66 Bradford -463 28,057 28,520
33 Bay 12,347 181,199 168,852 67 Putnam -1,383 72,981 74,364
* Includes US Census Bureau corrections as of February 11, 2014.

Bureau of Economic and Business Research, University of Florida Florida Estimates of Population 2018 32
Figure 2. Population Change, 2010 to 2018

33 Florida Estimates of Population 2018 Bureau of Economic and Business Research, University of Florida
Table 9. Rank of Top 100 Cities in Florida by Population Size, 2000 to 2018
Percent Change
Population Rank 2010 2000 City 2018 2010 2000 2018 2010 2000 to 2018 to 2010
Jacksonville 907,093 821,784 735,617 1 1 1 10.4 11.7 Miami* 481,333 399,508 362,470 2 2 2 20.5 10.2 Tampa 378,531 335,709 303,447 3 3 3 12.8 10.6 Orlando 285,099 238,300 185,951 4 5 6 19.6 28.2 St. Petersburg 266,076 244,769 248,232 5 4 4 8.7 -1.4 Hialeah* 238,906 224,667 226,419 6 6 5 6.3 -0.8 Tallahassee 192,381 181,376 150,624 7 7 8 6.1 20.4 Port St. Lucie 185,843 164,603 88,769 8 9 15 12.9 85.4 Fort Lauderdale 182,827 165,521 152,397 9 8 7 10.5 8.6 Cape Coral 180,204 154,305 102,286 10 10 13 16.8 50.9 Pembroke Pines* 165,352 154,019 137,427 11 11 10 7.4 12.1 Hollywood 149,028 140,768 139,368 12 12 9 5.9 1.0 Miramar 137,107 122,041 72,739 13 14 25 12.3 67.8 Gainesville* 131,217 124,476 95,447 14 13 14 5.4 30.4 Coral Springs 128,757 121,096 117,549 15 15 11 6.3 3.0 Clearwater 115,589 107,685 108,789 16 16 12 7.3 -1.0 Miami Gardens* 113,628 107,166 (X) 17 17 (X) 6.0 (X) West Palm Beach* 112,906 100,343 82,103 18 19 19 12.5 22.2 Palm Bay 112,703 103,190 79,413 19 18 20 9.2 29.9 Pompano Beach 110,371 99,845 78,191 20 20 22 10.5 27.7 Lakeland 105,586 97,422 78,452 21 21 21 8.4 24.2 Davie 103,171 91,992 75,720 22 22 23 12.2 21.5 Boca Raton 93,417 84,392 74,764 23 27 24 10.7 12.9 Sunrise 92,663 84,439 85,787 24 26 17 9.7 -1.6 Miami Beach* 92,502 87,778 87,933 25 23 16 5.4 -0.2 Deltona 91,007 85,182 69,543 26 24 27 6.8 22.5 Plantation 89,595 84,955 82,934 27 25 18 5.5 2.4 Palm Coast 84,575 75,180 32,732 28 30 62 12.5 129.7 Largo 83,526 77,648 69,371 29 28 28 7.6 11.9 Melbourne* 82,040 76,205 71,382 30 29 26 7.7 6.8 Fort Myers 81,868 62,298 48,208 31 35 41 31.4 29.2 Deerfield Beach 78,573 75,018 64,585 32 31 29 4.7 16.2 Boynton Beach 76,756 68,217 60,389 33 32 31 12.5 13.0 Homestead* 73,863 60,509 31,909 34 38 64 22.1 89.6 Kissimmee 72,369 59,682 47,814 35 40 42 21.3 24.8 Lauderhill 71,751 66,887 57,585 36 33 34 7.3 16.2 North Port 70,631 57,357 22,797 37 42 80 23.1 151.6 Doral* 68,244 45,709 (X) 38 56 (X) 49.3 (X) Weston 66,972 65,333 49,286 39 34 40 2.5 32.6 Delray Beach 66,580 60,522 60,020 40 37 32 10.0 0.8 Daytona Beach 66,267 61,005 64,112 41 36 30 8.6 -4.8 Tamarac 64,663 60,427 55,588 42 39 36 7.0 8.7 North Miami* 63,517 58,912 59,880 43 41 33 7.8 -1.6 Wellington 62,304 56,508 38,216 44 43 53 10.3 47.9 Jupiter 62,100 55,156 39,328 45 46 51 12.6 40.2 Port Orange 61,009 56,048 45,823 46 45 44 8.9 22.3 Ocala 60,042 56,315 45,943 47 44 43 6.6 22.6 Sanford 59,033 53,570 38,291 48 47 52 10.2 39.9 Coconut Creek 58,344 52,909 43,566 49 49 46 10.3 21.4 Margate 58,329 53,284 53,909 50 48 37 9.5 -1.2 Bradenton 56,157 49,546 49,504 51 52 39 13.3 0.1 Sarasota 55,832 51,917 52,715 52 51 38 7.5 -1.5

Bureau of Economic and Business Research, University of Florida Florida Estimates of Population 2018 34
Table 9. Rank of Top 100 Cities in Florida by Population Size, 2000 to 2018
(Continued) Percent Change
Population Rank 2010 2000 City 2018 2010 2000 2018 2010 2000 to 2018 to 2010
Pensacola 54,801 51,923 56,255 53 50 35 5.5 -7.7 Palm Beach Gardens* 53,800 48,440 35,058 54 54 59 11.1 38.2 Pinellas Park 53,144 49,079 45,658 55 53 45 8.3 7.5 Apopka 51,676 41,542 26,642 56 60 72 24.4 55.9 Bonita Springs* 51,181 43,857 32,797 57 57 61 16.7 33.7 Coral Gables* 50,631 46,776 42,249 58 55 47 8.2 10.7 Titusville 47,456 43,761 40,670 59 58 50 8.4 7.6 St. Cloud 46,519 35,183 20,074 60 73 88 32.2 75.3 Ocoee 45,694 35,579 24,391 61 70 77 28.4 45.9 North Miami Beach 45,612 41,523 40,786 62 61 49 9.8 1.8 Cutler Bay 45,373 40,286 (X) 63 65 (X) 12.6 (X) Oakland Park 45,276 41,363 30,966 64 63 66 9.5 33.6 Altamonte Springs 44,947 41,496 41,200 65 62 48 8.3 0.7 Winter Garden 44,935 34,568 14,351 66 76 111 30.0 140.9 North Lauderdale 44,841 41,023 32,264 67 64 63 9.3 27.1 Fort Pierce 43,326 41,590 37,516 68 59 54 4.2 10.9 Winter Haven 42,828 33,874 26,487 69 78 73 26.4 27.9 Ormond Beach 41,140 38,137 36,301 70 66 56 7.9 5.1 Oviedo 39,739 33,342 26,316 71 79 74 19.2 26.7 Greenacres 39,568 37,573 27,569 72 67 71 5.3 36.3 Hallandale Beach 39,054 37,113 34,282 73 68 60 5.2 8.3 Plant City 38,938 34,721 29,760 74 75 69 12.1 16.7 Clermont 38,906 28,742 9,338 75 85 156 35.4 207.8 Lake Worth 38,257 34,910 35,133 76 74 58 9.6 -0.6 Royal Palm Beach 37,934 34,140 21,523 77 77 81 11.1 58.6 Aventura 37,790 35,762 25,267 78 69 76 5.7 41.5 Winter Springs 37,639 33,282 30,860 79 80 67 13.1 7.8 Panama City* 37,208 35,505 36,417 80 71 55 4.8 -2.5 Dunedin 37,054 35,321 35,691 81 72 57 4.9 -1.0 Lauderdale Lakes 36,475 32,593 31,705 82 81 65 11.9 2.8 Riviera Beach 35,431 32,488 29,884 83 82 68 9.1 8.7 DeLand 34,106 27,031 20,904 84 88 86 26.2 29.3 Cooper City 33,906 28,547 27,914 85 86 70 18.8 2.3 Parkland 32,742 23,962 13,835 86 93 115 36.6 73.2 Estero** 31,806 (X) (X) 87 (X) (X) (X) (X) Dania Beach 31,755 29,639 20,061 88 83 89 7.1 47.7 Miami Lakes 31,118 29,361 (X) 89 84 (X) 6.0 (X) Winter Park 30,212 27,852 24,090 90 87 78 8.5 15.6 Casselberry 29,778 26,241 23,438 91 89 79 13.5 12.0 Rockledge 26,882 24,926 20,170 92 90 87 7.8 23.6 Temple Terrace 26,512 24,541 20,918 93 92 85 8.0 17.3 New Smyrna Beach 26,407 22,464 20,048 94 96 90 17.6 12.1 Tarpon Springs 25,455 23,484 21,003 95 94 82 8.4 11.8 Crestview 25,001 20,978 14,766 96 100 109 19.2 42.1 Sebastian 24,630 21,929 16,181 97 97 99 12.3 35.5 Key West 24,509 24,649 25,478 98 91 75 -0.6 -3.3 Haines City* 24,298 20,560 13,174 99 104 120 18.2 56.1 Palmetto Bay* 24,144 23,408 (X) 100 95 (X) 3.1 (X) (X) Not incorporated at that time.
* Includes US Census Bureau corrections as of February 11, 2014.
** The City of Estero was incorporated on December 31, 2014.

35 Florida Estimates of Population 2018 Bureau of Economic and Business Research, University of Florida
Table 10. Rank of Top 100 Cities in Florida by Percent Change in Population, 2010 to 2018
Percent Change
Population Percent Change
Population Rank City 2018 2010 Rank City 2018 2010
1 Lake Buena Vista 140.0 24 10 51 Maitland 18.2 18,612 15,751 2 Fruitland Park 119.8 8,963 4,078 52 Umatilla 18.1 4,081 3,456 3 Freeport 115.2 3,845 1,787 53 New Smyrna Beach 17.6 26,407 22,464 4 Davenport 94.0 5,602 2,888 54 Mount Dora 17.5 14,536 12,370 5 Groveland 88.0 16,407 8,729 55 Punta Gorda 17.1 19,487 16,641 6 Sweetwater 59.3 21,499 13,499 56 Cape Coral 16.8 180,204 154,305 7 Doral* 49.3 68,244 45,709 57 Bonita Springs* 16.7 51,181 43,857 8 Wildwood 41.8 9,511 6,709 58 Florida City 16.3 13,076 11,245 9 Parkland 36.6 32,742 23,962 59 High Springs 16.3 6,221 5,350
10 Howey-in-the-Hills 36.5 1,499 1,098 60 Callahan 16.2 1,305 1,123 11 Clermont 35.4 38,906 28,742 61 Bal Harbour 16.2 2,920 2,513 12 Polk City 33.7 2,088 1,562 62 Belle Isle 16.0 6,944 5,988 13 St. Cloud 32.2 46,519 35,183 63 Leesburg 15.8 23,297 20,117 14 Fort Myers 31.4 81,868 62,298 64 Milton 15.4 10,186 8,826 15 Minneola 31.3 12,348 9,403 65 Belleview 14.7 5,152 4,492 16 West Miami 30.9 7,806 5,965 66 Lynn Haven 14.6 21,201 18,493 17 Winter Garden 30.0 44,935 34,568 67 Mascotte 14.3 5,829 5,101 18 Ocoee 28.4 45,694 35,579 68 Bunnell 14.2 3,056 2,676 19 Gulf Stream 27.9 1,005 786 69 Eagle Lake 14.1 2,574 2,255 20 Avon Park 26.6 11,187 8,836 70 Shalimar 13.9 817 717 21 Winter Haven 26.4 42,828 33,874 71 Niceville 13.8 14,508 12,749 22 Newberry 26.2 6,249 4,950 72 San Antonio 13.7 1,294 1,138 23 Montverde 26.2 1,846 1,463 73 Midway 13.5 3,409 3,004 24 DeLand 26.2 34,106 27,031 74 Casselberry 13.5 29,778 26,241 25 North Bay Village 25.8 8,981 7,137 75 Gretna 13.4 1,656 1,460 26 Dundee 25.4 4,662 3,717 76 Eustis 13.4 21,039 18,558 27 Marianna 24.9 7,621 6,102 77 Bradenton 13.3 56,157 49,546 28 Apopka 24.4 51,676 41,542 78 Green Cove Springs 13.1 7,813 6,908 29 Tavares 24.4 17,353 13,951 79 Winter Springs 13.1 37,639 33,282 30 Palm Springs 23.9 23,448 18,928 80 Port St. Lucie 12.9 185,843 164,603 31 North Port 23.1 70,631 57,357 81 Tampa 12.8 378,531 335,709 32 Palm Shores 23.1 1,108 900 82 Cutler Bay 12.6 45,373 40,286 33 Oakland 22.9 3,119 2,538 83 Jupiter 12.6 62,100 55,156 34 Homestead* 22.1 73,863 60,509 84 Cocoa 12.5 19,286 17,140 35 Kissimmee 21.3 72,369 59,682 85 West Palm Beach* 12.5 112,906 100,343 36 Lake Mary 21.2 16,746 13,822 86 Boynton Beach 12.5 76,756 68,217 37 Miami* 20.5 481,333 399,508 87 Palm Coast 12.5 84,575 75,180 38 Auburndale 20.3 16,246 13,507 88 Fanning Springs 12.4 859 764 39 Mexico Beach 19.9 1,285 1,072 89 Edgewater 12.4 23,319 20,750 40 West Melbourne 19.8 21,990 18,355 90 Miramar 12.3 137,107 122,041 41 Orlando 19.6 285,099 238,300 91 Sebastian 12.3 24,630 21,929 42 Zephyrhills 19.2 15,839 13,288 92 Highland Park 12.2 258 230 43 Oviedo 19.2 39,739 33,342 93 Davie 12.2 103,171 91,992 44 Crestview 19.2 25,001 20,978 94 Plant City 12.1 38,938 34,721 45 Cooper City 18.8 33,906 28,547 95 Lake Hamilton 12.1 1,380 1,231 46 Lake Alfred 18.6 5,950 5,015 96 Alachua 12.1 10,155 9,059 47 Windermere 18.5 2,918 2,462 97 Lauderdale Lakes 11.9 36,475 32,593 48 Lake Placid 18.4 2,632 2,223 98 Haverhill 11.9 2,096 1,873 49 Opa-locka 18.4 18,017 15,219 99 Longwood 11.9 15,279 13,657 50 Haines City* 18.2 24,298 20,560 100 Bartow 11.8 19,342 17,298
* Includes US Census Bureau corrections as of February 11, 2014.

Bureau of Economic and Business Research, University of Florida Florida Estimates of Population 2018 36
Table 11. Rank of Top 100 Cities in Florida by Population Change, 2010 to 2018 Population Population Rank City Change 2018 2010 Rank City Change 2018 2010
85,309 907,093 821,784 51 Sanford 5,463 59,033 53,570 81,825 481,333 399,508 52 Coconut Creek 5,435 58,344 52,909 46,799 285,099 238,300 53 Palm Beach Gardens* 5,360 53,800 48,440 42,822 378,531 335,709 54 Cooper City 5,359 33,906 28,547 25,899 180,204 154,305 55 Daytona Beach 5,262 66,267 61,005 22,535 68,244 45,709 56 Cutler Bay 5,087 45,373 40,286 21,307 266,076 244,769 57 Margate 5,045 58,329 53,284 21,240 185,843 164,603 58 Port Orange 4,961 61,009 56,048 19,570 81,868 62,298 59 Fruitland Park 4,885 8,963 4,078 17,306 182,827 165,521 60 Lauderhill 4,864 71,751 66,887 15,066 137,107 122,041 61 Miami Beach* 4,724 92,502 87,778 14,239 238,906 224,667 62 Plantation 4,640 89,595 84,955 13,354 73,863 60,509 63 North Miami* 4,605 63,517 58,912 13,274 70,631 57,357 64 Palm Springs 4,520 23,448 18,928 12,687 72,369 59,682 65 Winter Springs 4,357 37,639 33,282 12,563 112,906 100,343 66 Tamarac 4,236 64,663 60,427 11,336 46,519 35,183 67 Plant City 4,217 38,938 34,721
Pines*
11,333 165,352 154,019 68 North Miami Beach 4,089 45,612 41,523 11,179 103,171 91,992 69 Pinellas Park 4,065 53,144 49,079 11,005 192,381 181,376 70 Crestview 4,023 25,001 20,978 10,526 110,371 99,845 71 New Smyrna Beach 3,943 26,407 22,464 10,367 44,935 34,568 72 Sarasota 3,915 55,832 51,917 10,164 38,906 28,742 73 Oakland Park 3,913 45,276 41,363 10,134 51,676 41,542 74 Lauderdale Lakes 3,882 36,475 32,593 10,115 45,694 35,579 75 Coral Gables* 3,855 50,631 46,776 9,513 112,703 103,190 76 North Lauderdale 3,818 44,841 41,023 9,395 84,575 75,180 77 Royal Palm Beach 3,794 37,934 34,140 9,025 93,417 84,392 78 Haines City* 3,738 24,298 20,560 8,954 42,828 33,874 79 Ocala 3,727 60,042 56,315 8,780 32,742 23,962 80 Titusville 3,695 47,456 43,761 8,539 76,756 68,217 81 West Melbourne 3,635 21,990 18,355 8,260 149,028 140,768 82 Deerfield Beach 3,555 78,573 75,018 8,224 92,663 84,439 83 Casselberry 3,537 29,778 26,241 8,164 105,586 97,422 84 Altamonte Springs 3,451 44,947 41,496 8,000 21,499 13,499 85 Tavares 3,402 17,353 13,951 7,904 115,589 107,685 86 Lake Worth 3,347 38,257 34,910 7,678 16,407 8,729 87 Leesburg 3,180 23,297 20,117 7,661 128,757 121,096 88 Ormond Beach 3,003 41,140 38,137 7,324 51,181 43,857 89 Minneola 2,945 12,348 9,403 7,075 34,106 27,031 90 Riviera Beach 2,943 35,431 32,488 6,944 62,100 55,156 91 Lake Mary 2,924 16,746 13,822 6,741 131,217 124,476 92 Pensacola 2,878 54,801 51,923 6,611 56,157 49,546 93 Maitland 2,861 18,612 15,751 6,462 113,628 107,166 94 Punta Gorda 2,846 19,487 16,641 6,397 39,739 33,342 95 Wildwood 2,802 9,511 6,709 6,058 66,580 60,522 96 Opa-locka 2,798 18,017 15,219 5,878 83,526 77,648 97 Auburndale 2,739 16,246 13,507 5,835 82,040 76,205 98 Davenport 2,714 5,602 2,888 5,825 91,007 85,182 99 Lynn Haven 2,708 21,201 18,493
1 Jacksonville2 Miami*3 Orlando4 Tampa5 Cape Coral6 Doral*7 St. Petersburg8 Port St. Lucie9 Fort Myers
10 Fort Lauderdale11 Miramar12 Hialeah 13 Homestead*14 North Port15 Kissimmee16 West Palm Beach*17 St. Cloud18 Pembroke Pines*19 Davie20 Tallahassee21 Pompano Beach 22 Winter Garden23 Clermont24 Apopka25 Ocoee26 Palm Bay27 Palm Coast28 Boca Raton29 Winter Haven30 Parkland31 Boynton Beach32 Hollywood33 Sunrise34 Lakeland35 Sweetwater36 Clearwater37 Groveland38 Coral Springs39 Bonita Springs*40 DeLand41 Jupiter42 Gainesville*43 Bradenton44 Miami Gardens* 45 Oviedo46 Delray Beach47 Largo48 Melbourne*49 Deltona50 Wellington 5,796 62,304 56,508 100 Sebastian 2,701 24,630 21,929
* Includes US Census Bureau corrections as of February 11, 2014.

37 Florida Estimates of Population 2018 Bureau of Economic and Business Research, University of Florida
Table 12. Age Distribution (Percentage) of the Population of Florida and Its Counties, 1990 to 2017
State Population State Population
and County 2017 2010 2000 1990 and County 2017 2010 2000 1990
FLORIDA 0–17 20.4 21.3 22.8 22.3 Citrus 0–17 14.9 15.9 17.2 17.7
18–44 33.6 34.4 36.9 39.8 18–44 21.4 21.9 23.7 26.8
45–64 26.4 27.0 22.7 19.7 45–64 29.5 30.3 26.9 24.3
65+ 19.5 17.3 17.6 18.2 65+ 34.3 31.9 32.2 31.2
Alachua 0–17 17.6 17.9 20.2 21.9 Clay 0–17 24.6 26.3 28.0 28.9
18–44 47.9 48.4 50.9 54.3 18–44 33.7 34.2 38.2 43.7
45–64 20.8 22.9 19.3 14.5 45–64 27.0 27.8 24.0 18.9
65+ 13.7 10.8 9.6 9.2 65+ 14.7 11.7 9.8 8.4
Baker 0–17 24.1 26.0 27.5 30.7 Collier 0–17 18.5 19.5 19.9 20.1
18–44 36.2 36.7 40.6 44.1 18–44 27.6 28.0 31.2 35.3
45–64 26.6 26.4 22.7 17.4 45–64 25.6 26.1 24.5 21.9
65+ 13.1 10.9 9.2 7.8 65+ 28.2 26.4 24.5 22.7
Bay 0–17 21.6 22.0 24.0 25.6 Columbia 0–17 21.3 22.5 25.4 28.1
18–44 34.7 35.4 38.8 42.3 18–44 33.2 33.9 36.7 38.5
45–64 27.0 28.1 23.7 20.2 45–64 27.0 28.2 24.0 20.2
65+ 16.7 14.5 13.4 11.9 65+ 18.4 15.4 14.0 13.2
Bradford 0–17 20.2 19.8 21.9 24.1 DeSoto 0–17 21.6 22.5 22.7 24.0
18–44 34.9 37.6 41.6 44.2 18–44 35.5 35.8 37.9 36.9
45–64 27.0 28.2 23.5 19.6 45–64 24.1 23.8 20.5 19.8
65+ 18.0 14.4 12.9 12.1 65+ 18.8 17.9 19.0 19.2
Brevard 0–17 18.6 19.8 22.0 22.0 Dixie 0–17 17.9 19.1 22.1 24.6
18–44 28.8 29.4 33.9 39.9 18–44 29.3 30.3 34.6 36.7
45–64 29.8 30.4 24.3 21.5 45–64 30.2 31.2 26.2 24.2
65+ 22.9 20.4 19.9 16.6 65+ 22.6 19.3 17.1 14.5
Broward 0–17 21.2 22.4 23.6 20.6 Duval 0–17 22.9 23.5 26.3 26.0
18–44 34.8 35.6 38.6 40.2 18–44 37.9 38.9 42.0 46.0
45–64 27.7 27.7 21.7 18.6 45–64 25.5 26.4 21.2 17.4
65+ 16.3 14.3 16.1 20.7 65+ 13.7 11.1 10.5 10.6
Calhoun 0–17 20.6 21.4 23.2 26.2 Escambia 0–17 21.5 21.6 23.5 25.4
18–44 34.4 36.0 40.5 39.9 18–44 36.1 37.2 41.1 43.3
45–64 27.0 27.2 22.3 19.5 45–64 25.4 26.8 22.0 19.5
65+ 18.0 15.4 14.0 14.5 65+ 17.0 14.4 13.3 11.9
Charlotte 0–17 13.3 14.3 15.7 15.7 Flagler 0–17 18.6 19.9 17.9 19.2
18–44 20.7 21.2 23.3 26.9 18–44 27.9 26.9 25.1 29.6
45–64 29.2 30.4 26.4 23.8 45–64 26.0 28.7 28.3 25.8
65+ 36.9 34.1 34.7 33.6 65+ 27.4 24.5 28.6 25.4

Bureau of Economic and Business Research, University of Florida Florida Estimates of Population 2018 38
Table 12. Age Distribution (Percentage) of the Population of Florida and Its Counties, 1990 to 2017 (Continued)
State Population State Population
and County 2017 2010 2000 1990 and County 2017 2010 2000 1990
Franklin 0–17 17.3 17.1 20.2 24.1 Highlands 0–17 17.4 18.2 19.2 18.9
18–44 34.1 36.2 32.6 33.6 18–44 23.7 24.3 25.6 26.0
45–64 27.6 29.3 29.5 24.6 45–64 25.1 25.3 22.2 21.9
65+ 21.1 17.4 17.7 17.7 65+ 33.8 32.2 33.0 33.2
Gadsden 0–17 22.2 24.2 26.4 29.8 Hillsborough 0–17 23.4 23.9 25.3 24.4
18–44 33.8 33.6 38.4 39.5 18–44 38.2 38.8 41.0 44.8
45–64 27.6 28.6 23.0 18.1 45–64 24.9 25.4 21.7 18.6
65+ 16.4 13.6 12.2 12.5 65+ 13.5 11.8 12.0 12.2
Gilchrist 0–17 20.1 21.4 24.4 25.2 Holmes 0–17 20.4 21.5 23.1 25.0
18–44 31.7 33.9 39.1 40.4 18–44 32.0 33.6 38.1 38.1
45–64 27.6 27.8 22.9 20.8 45–64 27.5 27.7 24.0 21.2
65+ 20.7 16.9 13.6 13.6 65+ 20.1 17.2 14.8 15.7
Glades 0–17 17.9 18.8 22.1 24.6 Indian River 0–17 17.6 18.8 19.2 19.5
18–44 32.2 33.7 34.6 31.2 18–44 25.4 25.9 28.3 31.8
45–64 25.7 26.0 24.5 24.8 45–64 27.3 28.1 23.3 21.6
65+ 24.2 21.5 18.8 19.3 65+ 29.7 27.2 29.2 27.1
Gulf 0–17 15.7 16.2 19.9 24.8 Jackson 0–17 19.1 19.9 22.3 25.0
18–44 35.0 37.4 39.8 37.2 18–44 35.4 36.2 39.3 40.5
45–64 29.2 30.0 25.4 22.9 45–64 27.1 28.2 23.8 19.7
65+ 20.0 16.3 14.9 15.2 65+ 18.4 15.7 14.6 14.9
Hamilton 0–17 19.1 19.7 23.5 29.0 Jefferson 0–17 18.0 18.6 22.7 29.1
18–44 36.4 39.4 42.5 42.3 18–44 30.2 32.6 37.1 37.2
45–64 27.1 27.8 22.8 17.3 45–64 31.0 32.3 25.7 19.0
65+ 17.4 13.1 11.2 11.4 65+ 20.8 16.5 14.5 14.8
Hardee 0–17 26.8 27.7 27.6 29.4 Lafayette 0–17 21.2 20.1 21.7 24.9
18–44 36.6 37.4 39.3 36.5 18–44 39.4 43.4 44.7 45.2
45–64 22.5 22.0 19.2 19.0 45–64 24.3 24.3 21.3 18.9
65+ 14.2 12.9 13.9 15.1 65+ 15.1 12.2 12.4 11.0
Hendry 0–17 27.9 27.8 30.0 31.7 Lake 0–17 19.8 20.8 20.3 20.0
18–44 35.9 38.6 41.6 39.0 18–44 27.9 28.3 29.5 30.5
45–64 22.7 22.1 18.3 18.5 45–64 26.7 26.7 23.8 22.1
65+ 13.5 11.5 10.1 10.9 65+ 25.6 24.2 26.4 27.4
Hernando 0–14 18.5 19.8 18.9 18.5 Lee 0–17 18.8 19.5 19.6 19.7
15–44 26.6 26.6 25.8 27.3 18–44 29.7 29.7 30.1 34.0
45–64 27.0 27.9 24.4 23.6 45–64 26.1 27.3 24.8 21.7
65+ 27.9 25.8 30.9 30.6 65+ 25.4 23.5 25.4 24.6

39 Florida Estimates of Population 2018 Bureau of Economic and Business Research, University of Florida
Table 12. Age Distribution (Percentage) of the Population of Florida and Its Counties, 1990 to 2017 (Continued)
State Population State Population
and County 2017 2010 2000 1990 and County 2017 2010 2000 1990
Leon 0–17 19.2 19.6 21.3 22.6 Nassau 0–17 20.2 21.7 25.0 27.2
18–44 46.6 48.0 50.4 54.2 18–44 29.4 31.1 36.0 41.5
45–64 21.5 23.0 20.0 15.1 45–64 29.4 30.9 26.3 21.2
65+ 12.7 9.4 8.3 8.2 65+ 20.9 16.2 12.6 10.1
Levy 0–17 19.7 21.1 23.6 24.4 Okaloosa 0–17 21.9 22.3 24.7 26.0
18–44 28.4 28.8 31.9 34.2 18–44 35.3 36.0 40.7 45.4
45–64 29.3 30.6 26.6 22.6 45–64 26.4 27.7 22.4 19.4
65+ 22.6 19.4 17.9 18.8 65+ 16.4 13.9 12.1 9.2
Liberty 0–17 20.7 21.2 21.8 24.3 Okeechobee 0–17 22.9 24.0 25.2 27.4
18–44 40.1 41.1 47.0 46.0 18–44 34.2 34.2 36.5 36.3
45–64 27.0 27.1 21.0 18.5 45–64 24.7 24.9 21.9 20.3
65+ 12.2 10.6 10.2 11.2 65+ 18.2 17.0 16.3 16.0
Madison 0–17 21.4 21.8 25.3 27.7 Orange 0–17 23.1 23.6 25.3 24.0
18–44 32.6 34.2 37.5 39.7 18–44 41.6 42.6 44.7 48.1
45–64 27.0 28.2 22.7 18.6 45–64 23.8 24.1 20.0 17.3
65+ 19.0 15.8 14.6 14.0 65+ 11.5 9.7 10.0 10.6
Manatee 0–17 19.6 20.5 20.7 19.3 Osceola 0–17 24.7 26.2 26.8 25.3
18–44 27.8 28.6 31.2 33.0 18–44 36.6 37.6 40.2 41.8
45–64 26.9 27.6 23.3 19.8 45–64 25.7 25.2 21.6 19.0
65+ 25.7 23.3 24.9 28.0 65+ 13.0 11.0 11.4 13.8
Marion 0–17 18.4 19.4 21.4 22.3 Palm Beach 0–17 19.5 20.4 21.3 19.8
18–44 26.6 27.6 30.2 34.0 18–44 31.2 31.6 33.5 37.0
45–64 26.6 27.3 23.9 21.7 45–64 26.0 26.4 22.0 19.0
65+ 28.4 25.8 24.5 22.0 65+ 23.3 21.6 23.2 24.2
Martin 0–17 16.1 17.6 18.6 17.7 Pasco 0–17 20.4 21.2 20.2 18.0
18–44 25.1 25.4 28.2 33.2 18–44 30.6 30.7 30.0 29.4
45–64 29.0 29.7 24.9 21.8 45–64 26.4 27.4 23.1 20.4
65+ 29.8 27.3 28.2 27.3 65+ 22.6 20.7 26.8 32.2
Miami–Dade 0–17 20.7 21.9 24.8 24.3 Pinellas 0–17 16.9 17.8 19.3 17.9
18–44 37.1 38.5 40.1 41.5 18–44 29.2 30.3 33.8 36.0
45–64 26.4 25.6 21.7 20.3 45–64 29.6 30.8 24.5 20.2
65+ 15.8 14.1 13.3 13.9 65+ 24.2 21.2 22.5 25.9
Monroe 0–17 14.6 15.1 17.1 17.5 Polk 0–17 22.6 23.5 24.4 24.3
18–44 31.2 32.5 37.4 43.0 18–44 32.2 32.8 34.7 37.0
45–64 32.3 35.4 30.9 23.7 45–64 25.1 25.6 22.5 20.3
65+ 22.0 17.1 14.6 15.8 65+ 20.1 18.0 18.3 18.4

Bureau of Economic and Business Research, University of Florida Florida Estimates of Population 2018 40
Table 12. Age Distribution (Percentage) of the Population of Florida and Its Counties, 1990 to 2017 (Continued)
State Population State Population
and County 2017 2010 2000 1990 and County 2017 2010 2000 1990
Putnam 0–17 21.7 22.6 24.6 25.6 Suwannee 0–17 21.2 22.7 24.0 26.6
18–44 28.8 29.3 31.9 34.6 18–44 31.7 30.7 33.6 34.8
45–64 28.0 29.2 25.1 22.0 45–64 26.1 27.7 25.4 21.8
65+ 21.5 18.9 18.5 17.8 65+ 21.0 18.9 16.9 16.8
St. Johns 0–17 21.7 23.1 23.1 22.5 Taylor 0–17 19.5 19.7 24.6 28.3
18–44 31.1 31.0 34.6 40.0 18–44 32.5 35.5 36.6 37.7
45–64 28.4 30.2 26.4 21.2 45–64 27.7 29.2 24.8 20.7
65+ 18.8 15.7 15.9 16.3 65+ 20.3 15.6 14.1 13.3
St. Lucie 0–17 21.1 22.3 22.6 23.2 Union 0–17 17.7 19.4 21.8 25.7
18–44 30.8 31.0 31.7 35.7 18–44 38.6 38.8 48.5 50.4
45–64 26.6 26.7 23.0 20.2 45–64 31.5 31.9 22.2 16.5
65+ 21.5 19.9 22.7 20.8 65+ 12.2 10.0 7.5 7.5
Santa Rosa 0–17 22.4 23.9 26.6 27.2 Volusia 0–17 18.2 18.9 20.3 19.8
18–44 34.6 34.5 38.3 42.9 18–44 29.7 30.8 33.5 37.3
45–64 27.8 28.7 24.1 20.4 45–64 28.5 29.3 24.2 20.2
65+ 15.2 12.9 11.0 9.5 65+ 23.6 21.1 22.1 22.7
Sarasota 0–17 14.9 15.7 16.2 15.8 Wakulla 0–17 21.8 22.5 25.6 28.3
18–44 23.8 24.1 26.7 30.3 18–44 36.3 37.4 39.3 39.6
45–64 27.3 29.0 25.6 21.8 45–64 28.1 29.3 24.7 20.5
65+ 34.1 31.2 31.5 32.1 65+ 13.7 10.8 10.3 11.5
Seminole 0–17 21.8 23.0 25.4 25.5 Walton 0–17 20.4 20.6 21.7 23.9
18–44 36.8 37.0 40.4 45.3 18–44 32.3 33.1 35.6 35.7
45–64 26.7 28.0 23.6 19.0 45–64 28.8 30.1 26.9 24.1
65+ 14.8 12.0 10.6 10.3 65+ 18.5 16.2 15.8 16.4
Sumter 0–17 8.6 9.1 16.1 22.4 Washington 0–17 20.3 21.2 23.4 25.4
18–44 16.6 18.6 29.2 33.2 18–44 34.3 35.5 36.3 35.0
45–64 22.7 28.9 27.3 22.2 45–64 27.9 27.9 24.7 22.1
65+ 52.0 43.4 27.4 22.3 65+ 17.5 15.4 15.7 17.6
Note: Percentages may not add to 100 percent due to rounding.

41 Florida Estimates of Population 2018 Bureau of Economic and Business Research, University of Florida
Table 13. Rank of Florida Counties by Percent of Population Aged 17 and Younger, 2017
State Aged 17 and Younger State Aged 17 and Younger
Rank and County Percent Number Rank and County Percent Number
FLORIDA 20.4 4,180,677
34 Nassau 20.2 16,255
1 Hendry 27.9 10,915 35 Bradford 20.2 5,575
2 Hardee 26.8 7,345 36 Gilchrist 20.1 3,454
3 Osceola 24.7 83,477 37 Lake 19.8 65,516
4 Clay 24.6 51,327 38 Levy 19.7 8,085
5 Baker 24.1 6,547 39 Manatee 19.6 72,398
6 Hillsborough 23.4 322,402 40 Palm Beach 19.5 276,372
7 Orange 23.1 304,021 41 Taylor 19.5 4,354
8 Duval 22.9 214,321 42 Leon 19.2 55,305
9 Okeechobee 22.9 9,401 43 Jackson 19.1 9,628
10 Polk 22.6 149,434 44 Hamilton 19.1 2,794
11 Santa Rosa 22.4 38,289 45 Lee 18.8 131,001
12 Gadsden 22.2 10,695 46 Flagler 18.6 19,600
13 Okaloosa 21.9 42,882 47 Brevard 18.6 106,902
14 Wakulla 21.8 6,971 48 Collier 18.5 66,218
15 Seminole 21.8 99,126 49 Hernando 18.5 33,632
16 St. Johns 21.7 49,843 50 Marion 18.4 64,358
17 Putnam 21.7 15,865 51 Volusia 18.2 95,035
18 DeSoto 21.6 7,699 52 Jefferson 18.0 2,627
19 Bay 21.6 38,568 53 Glades 17.9 2,347
20 Escambia 21.5 67,303 54 Dixie 17.9 2,999
21 Madison 21.4 4,143 55 Union 17.7 2,830
22 Columbia 21.3 14,715 56 Alachua 17.6 45,754
23 Broward 21.2 397,910 57 Indian River 17.6 26,201
24 Lafayette 21.2 1,800 58 Highlands 17.4 17,742
25 Suwannee 21.2 9,453 59 Franklin 17.3 2,102
26 St. Lucie 21.1 62,866 60 Pinellas 16.9 162,840
27 Miami-Dade 20.7 567,469 61 Martin 16.1 24,568
28 Liberty 20.7 1,802 62 Gulf 15.7 2,566
29 Calhoun 20.6 3,091 63 Citrus 14.9 21,362
30 Holmes 20.4 4,128 64 Sarasota 14.9 60,488
31 Pasco 20.4 103,054 65 Monroe 14.6 11,228
32 Walton 20.4 13,298 66 Charlotte 13.3 22,923
33 Washington 20.3 5,072 67 Sumter 8.6 10,386
Bureau of Economic and Business Research, University of Florida Florida Estimates of Population 2018 42
Figure 3. Percent of Population Aged 17 and Younger, 2017

43 Florida Estimates of Population 2018 Bureau of Economic and Business Research, University of Florida
Table 14. Rank of Florida Counties by Percent of Population Aged 65 and Older, 2017
State Aged 65 and Older State Aged 65 and Older
Rank and County Percent Number Rank and County Percent Number
FLORIDA 19.5 4,000,170
34 Gulf 20.0 3,257
1 Sumter 52.0 62,769 35 Madison 19.0 3,679
2 Charlotte 36.9 63,669 36 St. Johns 18.8 43,209
3 Citrus 34.3 49,266 37 DeSoto 18.8 6,688
4 Sarasota 34.1 138,827 38 Walton 18.5 12,111
5 Highlands 33.8 34,504 39 Jackson 18.4 9,295
6 Martin 29.8 45,552 40 Columbia 18.4 12,689
7 Indian River 29.7 44,221 41 Okeechobee 18.2 7,500
8 Marion 28.4 99,214 42 Calhoun 18.0 2,702
9 Collier 28.2 100,952 43 Bradford 18.0 4,963
10 Hernando 27.9 50,801 44 Washington 17.5 4,373
11 Flagler 27.4 28,862 45 Hamilton 17.4 2,551
12 Manatee 25.7 94,662 46 Escambia 17.0 53,325
13 Lake 25.6 84,828 47 Bay 16.7 29,933
14 Lee 25.4 177,331 48 Gadsden 16.4 7,920
15 Pinellas 24.2 233,270 49 Okaloosa 16.4 31,984
16 Glades 24.2 3,168 50 Broward 16.3 304,630
17 Volusia 23.6 123,596 51 Miami-Dade 15.8 434,269
18 Palm Beach 23.3 329,279 52 Santa Rosa 15.2 26,017
19 Brevard 22.9 131,708 53 Lafayette 15.1 1,277
20 Levy 22.6 9,273 54 Seminole 14.8 67,081
21 Pasco 22.6 114,315 55 Clay 14.7 30,641
22 Dixie 22.6 3,776 56 Hardee 14.2 3,883
23 Monroe 22.0 16,897 57 Duval 13.7 128,728
24 St. Lucie 21.5 64,110 58 Alachua 13.7 35,686
25 Putnam 21.5 15,748 59 Wakulla 13.7 4,361
26 Franklin 21.1 2,562 60 Hillsborough 13.5 186,281
27 Suwannee 21.0 9,368 61 Hendry 13.5 5,270
28 Nassau 20.9 16,838 62 Baker 13.1 3,573
29 Jefferson 20.8 3,034 63 Osceola 13.0 43,912
30 Gilchrist 20.7 3,559 64 Leon 12.7 36,541
31 Taylor 20.3 4,534 65 Union 12.2 1,942
32 Polk 20.1 132,831 66 Liberty 12.2 1,061
33 Holmes 20.1 4,053 67 Orange 11.5 151,461

Bureau of Economic and Business Research, University of Florida Florida Estimates of Population 2018 44
Figure 4. Percent of Population Aged 65 and Older, 2017

45 Florida Estimates of Population 2018 Bureau of Economic and Business Research, University of Florida
Table 15. Rank of Florida Counties by Percent of Black Population, 2017
State Black Population State Black Population
Rank and County Percent Number Rank and County Percent Number
FLORIDA 17.6 3,599,724
34 Lafayette 12.9 1,096
1 Gadsden 55.7 26,889 35 Flagler 12.8 13,445
2 Madison 39.3 7,615 36 Suwannee 12.8 5,706
3 Jefferson 35.6 5,206 37 Volusia 12.4 65,021
4 Hamilton 34.0 4,992 38 Clay 12.2 25,429
5 Leon 32.5 93,629 39 Bay 12.1 21,701
6 Duval 32.2 301,524 40 Brevard 11.7 67,308
7 Broward 30.5 572,179 41 Pinellas 11.5 110,568
8 Jackson 27.5 13,885 42 Lake 11.4 37,679
9 Escambia 24.7 77,442 43 Glades 11.2 1,468
10 Orange 23.9 313,588 44 Okaloosa 10.8 21,021
11 Union 23.1 3,682 45 Highlands 10.3 10,567
12 Alachua 21.8 56,727 46 Manatee 10.0 36,725
13 St. Lucie 21.2 63,027 47 Levy 9.8 4,010
14 Taylor 20.1 4,473 48 Indian River 9.8 14,526
15 Miami-Dade 19.1 524,876 49 Lee 9.5 66,652
16 Bradford 19.1 5,276 50 Dixie 9.5 1,585
17 Palm Beach 19.0 269,240 51 Okeechobee 9.0 3,702
18 Hillsborough 18.7 257,884 52 Sumter 8.3 9,997
19 Columbia 18.7 12,878 53 Hardee 7.8 2,151
20 Liberty 17.4 1,518 54 Collier 7.6 27,167
21 Gulf 17.2 2,805 55 Charlotte 6.8 11,669
22 Putnam 16.6 12,179 56 Nassau 6.7 5,382
23 Polk 16.3 107,818 57 Monroe 6.6 5,107
24 Washington 15.3 3,827 58 Santa Rosa 6.5 11,151
25 Baker 14.7 3,997 59 Holmes 6.3 1,276
26 Wakulla 14.3 4,570 60 Hernando 6.3 11,392
27 Osceola 14.2 47,839 61 St. Johns 6.2 14,210
28 Calhoun 13.7 2,057 62 Pasco 6.1 30,656
29 Marion 13.5 47,110 63 Martin 6.0 9,181
30 Seminole 13.3 60,328 64 Walton 5.9 3,845
31 Hendry 13.2 5,174 65 Sarasota 5.4 21,981
32 DeSoto 13.2 4,704 66 Gilchrist 5.0 861
33 Franklin 13.1 1,589 67 Citrus 3.5 4,962

Bureau of Economic and Business Research, University of Florida Florida Estimates of Population 2018 46
Figure 5. Black Population as Percent of Total Population, 2017

47 Florida Estimates of Population 2018 Bureau of Economic and Business Research, University of Florida
Table 16. Rank of Florida Counties by Percent of Hispanic Population, 2017
State Hispanic Population State Hispanic Population
Rank and County Percent Number Rank and County Percent Number
FLORIDA 25.4 5,204,657
34 Brevard 9.9 57,135
1 Miami-Dade 67.5 1,852,323 35 Pinellas 9.9 95,180
2 Hendry 54.8 21,388 36 Sarasota 9.9 40,182
3 Osceola 52.0 175,599 37 Clay 9.5 19,807
4 Hardee 44.2 12,113 38 Alachua 9.3 24,243
5 DeSoto 33.1 11,780 39 Okaloosa 8.9 17,471
6 Orange 30.6 402,351 40 Levy 8.3 3,413
7 Collier 29.2 104,216 41 Charlotte 7.3 12,589
8 Broward 28.7 537,895 42 St. Johns 7.1 16,351
9 Hillsborough 28.5 393,326 43 Walton 7.0 4,552
10 Okeechobee 26.4 10,862 44 Liberty 6.8 596
11 Glades 24.9 3,261 45 Bay 6.8 12,113
12 Monroe 23.1 17,772 46 Gilchrist 6.7 1,159
13 Lee 22.4 156,691 47 Escambia 6.5 20,378
14 Polk 22.1 146,425 48 Leon 6.2 17,709
15 Palm Beach 22.0 311,718 49 Columbia 5.8 3,981
16 Seminole 20.1 91,375 50 Sumter 5.6 6,726
17 Highlands 20.0 20,408 51 Calhoun 5.5 829
18 St. Lucie 18.7 55,673 52 Madison 5.4 1,040
19 Manatee 18.0 66,278 53 Santa Rosa 5.3 9,027
20 Lake 14.9 49,376 54 Citrus 5.3 7,576
21 Martin 14.4 22,054 55 Jackson 5.2 2,643
22 Pasco 14.4 72,586 56 Union 5.2 823
23 Lafayette 14.0 1,184 57 Franklin 5.1 618
24 Indian River 13.3 19,770 58 Gulf 5.0 822
25 Marion 13.2 46,158 59 Nassau 4.4 3,543
26 Volusia 12.9 67,629 60 Jefferson 4.4 639
27 Hernando 12.6 22,844 61 Wakulla 3.9 1,247
28 Suwannee 10.6 4,746 62 Taylor 3.6 802
29 Hamilton 10.5 1,533 63 Bradford 3.5 975
30 Putnam 10.3 7,544 64 Washington 3.2 811
31 Flagler 10.3 10,831 65 Dixie 3.2 540
32 Duval 10.2 95,506 66 Holmes 2.6 518
33 Gadsden 10.0 4,820 67 Baker 2.1 584

Bureau of Economic and Business Research, University of Florida Florida Estimates of Population 2018 48
Figure 6. Hispanic Population as Percent of Total Population, 2017
49 Florida Estimates of Population 2018 Bureau of Economic and Business Research, University of Florida
Table 17. Population Per Square Mile for Florida Counties, 2000 to 2018
Land area in 2010
(sq. miles)
State Population Per Square Mile County Ranking
and County 2018 2010 2000 2018 2010 2000
FLORIDA* 53,625 389 351 298
Pinellas 274 3,542 3,347 3,366 1 1 1
Broward 1,210 1,569 1,445 1,342 2 2 2
Seminole 309 1,500 1,367 1,181 3 3 4
Orange 903 1,495 1,268 992 4 5 6
Miami-Dade* 1,898 1,464 1,316 1,188 5 4 3
Hillsborough 1,020 1,381 1,205 979 6 6 7
Duval 762 1,250 1,134 1,022 7 7 5
Lee 785 909 789 562 8 8 10
Sarasota 556 751 683 586 9 9 8
Palm Beach 1,970 728 670 574 10 10 9
Pasco 747 690 622 462 11 11 12
Brevard 1,016 574 535 469 12 12 11
St. Lucie 572 529 486 337 13 13 17
Manatee 743 509 435 355 14 16 16
Escambia 656 486 453 448 15 14 13
Volusia 1,101 482 449 403 16 15 14
Leon 667 438 413 359 17 17 15
St. Johns 601 397 316 205 18 21 26
Hernando 473 392 366 277 19 18 18
Polk 1,798 374 335 269 20 19 19
Lake* 938 366 317 224 21 20 24
Clay 604 351 316 233 22 22 22
Indian River 503 302 274 225 23 24 23
Alachua 875 301 283 249 24 23 20
Martin 543 286 269 233 25 25 21
Osceola 1,327 266 202 130 26 30 31
Charlotte 680 262 235 208 27 27 25
Citrus 582 250 243 203 28 26 27
Bay 758 239 223 195 29 28 28
Sumter 547 228 171 98 30 33 35
Marion* 1,585 223 209 163 31 29 30
Flagler 485 222 197 103 32 31 34
Okaloosa 930 213 194 183 33 32 29
Collier 1,998 184 161 126 34 34 32
Santa Rosa 1,012 173 150 116 35 35 33

Bureau of Economic and Business Research, University of Florida Florida Estimates of Population 2018 50
Table 17. Population Per Square Mile for Florida Counties, 2000 to 2018 (Continued)
Land area in 2010
(sq. miles)
State Population Per Square Mile County Ranking
and County 2018 2010 2000 2018 2010 2000
Nassau 649 128 113 89 36 36 37
Highlands 1,017 101 97 86 37 38 40
Putnam 728 100 102 97 38 37 36
Bradford 294 95 97 89 39 39 38
Gadsden 516 93 90 87 40 40 39
Columbia 798 87 85 71 41 41 42
Monroe 983 75 74 81 42 42 41
Walton 1,038 65 53 39 43 47 50
Suwannee 689 65 60 51 44 44 45
Union 244 65 64 55 45 43 43
DeSoto 637 56 55 51 46 45 46
Jackson 918 55 54 51 47 46 44
Okeechobee 769 53 52 47 48 48 47
Wakulla 606 53 51 38 49 49 53
Gilchrist 350 50 48 41 50 50 49
Baker 585 47 46 38 51 51 52
Washington 583 43 43 36 52 53 54
Hardee 638 43 43 42 53 52 48
Holmes 479 42 42 39 54 54 51
Levy 1,118 37 36 31 55 55 56
Hendry 1,153 34 34 31 56 56 55
Gulf 564 29 28 26 57 58 59
Hamilton 514 28 29 26 58 57 58
Madison 696 28 28 27 59 59 57
Calhoun 567 27 26 23 60 60 60
Jefferson 598 25 25 22 61 61 61
Dixie 705 23 23 20 62 62 62
Franklin 535 22 22 18 63 64 64
Taylor 1,043 21 22 18 64 63 63
Glades 806 16 16 13 65 66 65
Lafayette 543 16 16 13 66 65 66
Liberty 836 11 10 8 67 67 67
* Includes US Census Bureau corrections as of February 11, 2014.

51 Florida Estimates of Population 2018 Bureau of Economic and Business Research, University of Florida
Figure 7. Population per Square Mile, 2018

Table 18. Location of Florida Cities
Bureau of Economic and Business Research, University of Florida Florida Estimates of Population 2018 52
City County
Alachua
Alachua Alford Jackson Altamonte Springs Seminole Altha Calhoun Anna Maria Manatee Apalachicola Franklin Apopka Orange Arcadia DeSoto Archer Alachua Astatula Lake Atlantic Beach Duval Atlantis Palm Beach Auburndale Polk Aventura Miami-Dade Avon Park Highlands Bal Harbour Miami-Dade Baldwin Duval Bartow Polk Bascom Jackson Bay Harbor Islands Miami-Dade Bay Lake Orange Bell Gilchrist Belle Glade Palm Beach Belle Isle Orange Belleair Pinellas Belleair Beach Pinellas Belleair Bluffs Pinellas Belleair Shore Pinellas Belleview Marion Beverly Beach Flagler Biscayne Park Miami-Dade Blountstown Calhoun Boca Raton Palm Beach Bonifay Holmes Bonita Springs Lee Bowling Green Hardee Boynton Beach Palm Beach Bradenton Manatee Bradenton Beach Manatee Branford Suwannee Briny Breezes Palm Beach Bristol Liberty Bronson Levy Brooker Bradford Brooksville Hernando
City County
Bunnell Flagler Bushnell Sumter Callahan Nassau Callaway Bay Campbellton Jackson Cape Canaveral Brevard Cape Coral Lee Carrabelle Franklin Caryville Washington Casselberry Seminole Cedar Key Levy Center Hill Sumter Century Escambia Chattahoochee Gadsden Chiefland Levy Chipley Washington Cinco Bayou Okaloosa Clearwater Pinellas Clermont Lake Clewiston Hendry Cloud Lake Palm Beach Cocoa Brevard Cocoa Beach Brevard Coconut Creek Broward Coleman Sumter Cooper City Broward Coral Gables Miami-Dade Coral Springs Broward Cottondale Jackson Crescent City Putnam Crestview Okaloosa Cross City Dixie Crystal River Citrus Cutler Bay Miami-Dade Dade City Pasco Dania Beach Broward Davenport Polk Davie Broward Daytona Beach Volusia Daytona Beach Shores Volusia DeBary Volusia Deerfield Beach Broward DeFuniak Springs Walton DeLand Volusia Delray Beach Palm Beach

Table 18. Location of Florida Cities (Continued)
53 Florida Estimates of Population 2018 Bureau of Economic and Business Research, University of Florida
City County
Deltona Volusia Destin Okaloosa Doral Miami-Dade Dundee Polk Dunedin Pinellas Dunnellon Marion Eagle Lake Polk Eatonville Orange Ebro Washington Edgewater Volusia Edgewood Orange El Portal Miami-Dade Estero* Lee Esto Holmes Eustis Lake Everglades Collier Fanning Springs Gilchrist/Levy Fellsmere Indian River Fernandina Beach Nassau Flagler Beach Flagler/Volusia Florida City Miami-Dade Fort Lauderdale Broward Fort Meade Polk Fort Myers Lee Fort Myers Beach Lee Fort Pierce St. Lucie Fort Walton Beach Okaloosa Fort White Columbia Freeport Walton Frostproof Polk Fruitland Park Lake Gainesville Alachua Glen Ridge Palm Beach Glen St. Mary Baker Golden Beach Miami-Dade Golf Palm Beach Graceville Jackson Grand Ridge Jackson Grant-Valkaria Brevard Green Cove Springs Clay Greenacres Palm Beach Greensboro Gadsden Greenville Madison Greenwood Jackson Gretna Gadsden
City County
Groveland Lake Gulf Breeze Santa Rosa Gulf Stream Palm Beach Gulfport Pinellas Haines City Polk Hallandale Beach Broward Hampton Bradford Hastings** St. Johns Havana Gadsden Haverhill Palm Beach Hawthorne Alachua Hialeah Miami-Dade Hialeah Gardens Miami-Dade High Springs Alachua Highland Beach Palm Beach Highland Park Polk Hillcrest Heights Polk Hilliard Nassau Hillsboro Beach Broward Holly Hill Volusia Hollywood Broward Holmes Beach Manatee Homestead Miami-Dade Horseshoe Beach Dixie Howey-in-the-Hills Lake Hypoluxo Palm Beach Indialantic Brevard Indian Creek Miami-Dade Indian Harbour Beach Brevard Indian River Shores Indian River Indian Rocks Beach Pinellas Indian Shores Pinellas Indiantown*** Martin Inglis Levy Interlachen Putnam
Inverness Citrus Islamorada, Village of Islands Monroe Islandia**** Miami-Dade Jacksonville Duval Jacksonville Beach Duval
Jacob City Jackson Jasper Hamilton Jay Santa Rosa Jennings Hamilton Juno Beach Palm Beach

Table 18. Location of Florida Cities (Continued)
Bureau of Economic and Business Research, University of Florida Florida Estimates of Population 2018 54
City County
Jupiter Palm Beach Jupiter Inlet Colony Palm Beach Jupiter Island Martin Kenneth City Pinellas Key Biscayne Miami-Dade
Key Colony Beach Monroe Key West Monroe Keystone Heights Clay Kissimmee Osceola La Crosse Alachua
LaBelle Hendry Lady Lake Lake Lake Alfred Polk Lake Buena Vista Orange Lake Butler Union
Lake City Columbia Lake Clarke Shores Palm Beach Lake Hamilton Polk Lake Helen Volusia Lakeland Polk
Lake Mary Seminole Lake Park Palm Beach Lake Placid Highlands Lake Wales Polk Lake Worth Palm Beach
Lantana Palm Beach Largo Pinellas Lauderdale Lakes Broward Lauderdale-By-The-Sea Broward Lauderhill Broward
Laurel Hill Okaloosa Lawtey Bradford Layton Monroe Lazy Lake Broward Lee Madison
Leesburg Lake Lighthouse Point Broward Live Oak Suwannee Longboat Key Manatee/Sarasota Longwood Seminole
Loxahatchee Groves Palm Beach Lynn Haven Bay Macclenny Baker Madeira Beach Pinellas Madison Madison
City County
Maitland Orange Malabar Brevard Malone Jackson Manalapan Palm Beach Mangonia Park Palm Beach
Marathon Monroe Marco Island Collier Margate Broward Marianna Jackson Marineland Flagler/St. Johns
Mary Esther Okaloosa Mascotte Lake Mayo Lafayette McIntosh Marion Medley Miami-Dade
Melbourne Brevard Melbourne Beach Brevard Melbourne Village Brevard Mexico Beach Bay Miami Miami-Dade
Miami Beach Miami-Dade Miami Gardens Miami-Dade Miami Lakes Miami-Dade Miami Shores Miami-Dade Miami Springs Miami-Dade
Micanopy Alachua Midway Gadsden Milton Santa Rosa Minneola Lake Miramar Broward
Monticello Jefferson Montverde Lake Moore Haven Glades Mount Dora Lake Mulberry Polk
Naples Collier Neptune Beach Duval New Port Richey Pasco New Smyrna Beach Volusia Newberry Alachua
Niceville Okaloosa Noma Holmes North Bay Village Miami-Dade North Lauderdale Broward North Miami Miami-Dade

Table 18. Location of Florida Cities (Continued)
55 Florida Estimates of Population 2018 Bureau of Economic and Business Research, University of Florida
City County
North Miami Beach Miami-Dade North Palm Beach Palm Beach North Port Sarasota North Redington Beach Pinellas Oak Hill Volusia
Oakland Orange Oakland Park Broward Ocala Marion Ocean Breeze Martin Ocean Ridge Palm Beach
Ocoee Orange Okeechobee Okeechobee Oldsmar Pinellas Opa-locka Miami-Dade Orange City Volusia
Orange Park Clay Orchid Indian River Orlando Orange Ormond Beach Volusia Otter Creek Levy
Oviedo Seminole Pahokee Palm Beach Palatka Putnam Palm Bay Brevard Palm Beach Palm Beach
Palm Beach Gardens Palm Beach Palm Beach Shores Palm Beach Palm Coast Flagler Palm Shores Brevard Palm Springs Palm Beach
Palmetto Manatee Palmetto Bay Miami-Dade Panama City Bay Panama City Beach Bay Parker Bay
Parkland Broward Paxton Walton Pembroke Park Broward Pembroke Pines Broward Penney Farms Clay
Pensacola Escambia Perry Taylor Pierson Volusia Pinecrest Miami-Dade Pinellas Park Pinellas
City County
Plant City Hillsborough Plantation Broward Polk City Polk Pomona Park Putnam Pompano Beach Broward
Ponce de Leon Holmes Ponce Inlet Volusia Port Orange Volusia Port Richey Pasco Port St. Joe Gulf
Port St. Lucie St. Lucie Punta Gorda Charlotte Quincy Gadsden Raiford Union Reddick Marion
Redington Beach Pinellas Redington Shores Pinellas Riviera Beach Palm Beach Rockledge Brevard Royal Palm Beach Palm Beach
Safety Harbor Pinellas St. Augustine St. Johns St. Augustine Beach St. Johns St. Cloud Osceola St. Leo Pasco
St. Lucie Village St. Lucie St. Marks Wakulla St. Pete Beach Pinellas St. Petersburg Pinellas San Antonio Pasco
Sanford Seminole Sanibel Lee Sarasota Sarasota Satellite Beach Brevard Sea Ranch Lakes Broward
Sebastian Indian River Sebring Highlands Seminole Pinellas Sewall's Point Martin Shalimar Okaloosa
Sneads Jackson Sopchoppy Wakulla South Bay Palm Beach South Daytona
Volusia South Miami Miami-Dade
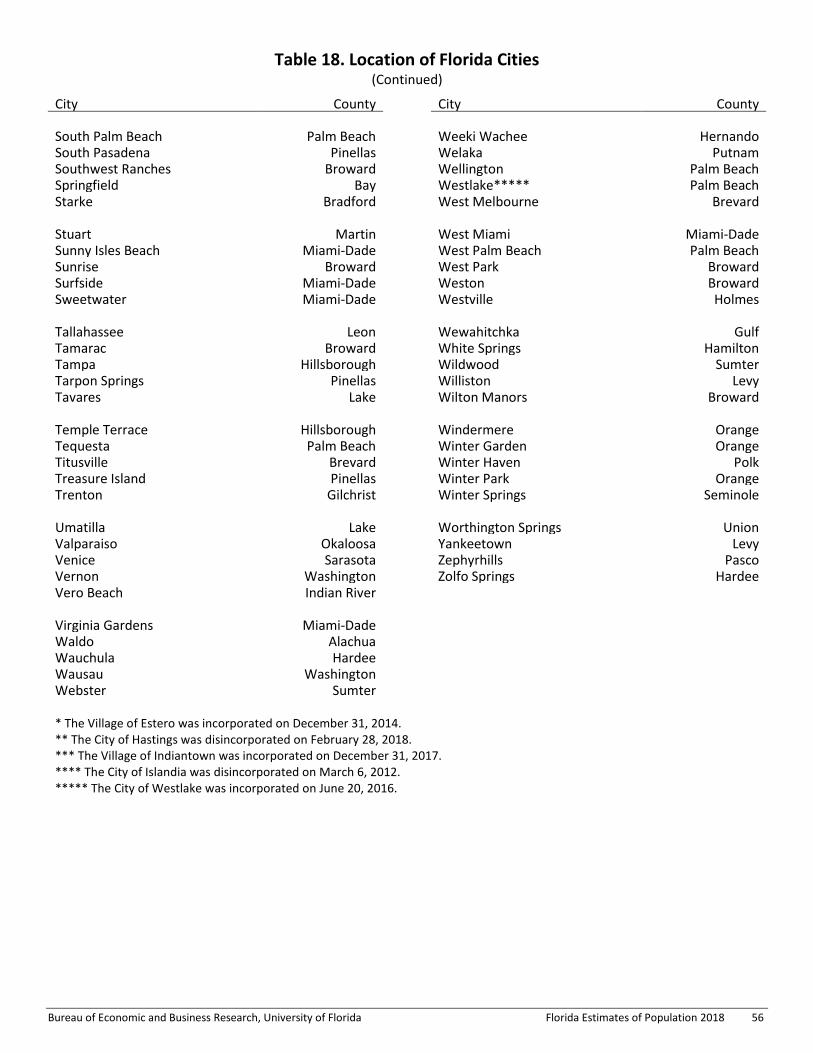
Table 18. Location of Florida Cities (Continued)
Bureau of Economic and Business Research, University of Florida Florida Estimates of Population 2018 56
City County
South Palm Beach Palm Beach South Pasadena Pinellas Southwest Ranches Broward Springfield Bay Starke Bradford
Stuart Martin Sunny Isles Beach Miami-Dade Sunrise Broward Surfside Miami-Dade Sweetwater Miami-Dade
Tallahassee Leon Tamarac Broward Tampa Hillsborough Tarpon Springs Pinellas Tavares Lake
Temple Terrace Hillsborough Tequesta Palm Beach Titusville Brevard Treasure Island Pinellas Trenton Gilchrist
Umatilla Lake Valparaiso Okaloosa Venice Sarasota Vernon Washington Vero Beach Indian River
Virginia Gardens Miami-Dade Waldo Alachua Wauchula Hardee Wausau Washington Webster Sumter
City County
Weeki Wachee Hernando Welaka Putnam Wellington Palm Beach Westlake***** Palm Beach West Melbourne Brevard
West Miami Miami-Dade West Palm Beach Palm Beach West Park Broward Weston Broward Westville Holmes
Wewahitchka Gulf White Springs Hamilton Wildwood Sumter Williston Levy Wilton Manors Broward
Windermere Orange Winter Garden Orange Winter Haven Polk Winter Park Orange Winter Springs Seminole
Worthington Springs
Union Yankeetown Levy Zephyrhills Pasco Zolfo Springs Hardee
* The Village of Estero was incorporated on December 31, 2014. ** The City of Hastings was disincorporated on February 28, 2018. *** The Village of Indiantown was incorporated on December 31, 2017. **** The City of Islandia was disincorporated on March 6, 2012. ***** The City of Westlake was incorporated on June 20, 2016.


Bureau of Economic and Business ResearchCollege of Liberal Arts and SciencesUNIVERSITY of FLORIDA
Ayers Technological Plaza720 SW 2nd Ave, Suite 150P.O. Box 117148Gainesville, Florida 32611-7148phone: 352-392-0171www.bebr.ufl.edu