Embed Size (px)
Citation preview
Bureau of Fire Investigation Investigative Management and Reporting System
2018 Annual Report
Veritas ex Cineribus Bill de Blasio
Mayor Daniel A. Nigro
Fire Commissioner

Bureau of Fire Investigation Fire Department of the City of New York
Chief Fire Marshal Thomas G. Kane
Assistant Chief Fire Marshal John D. Lynn Chief of Operations
Supervising Fire Marshal John P. Watkins Program Administrator
Fire Marshal Philip Pillet Medical Examiner Liaison
Computer Associate Dean Eliades Application Developer
Principal Administrative AssociateDana Holland
Records Management Supervisor

Bureau of Fire Investigation
Investigative Management and Reporting System
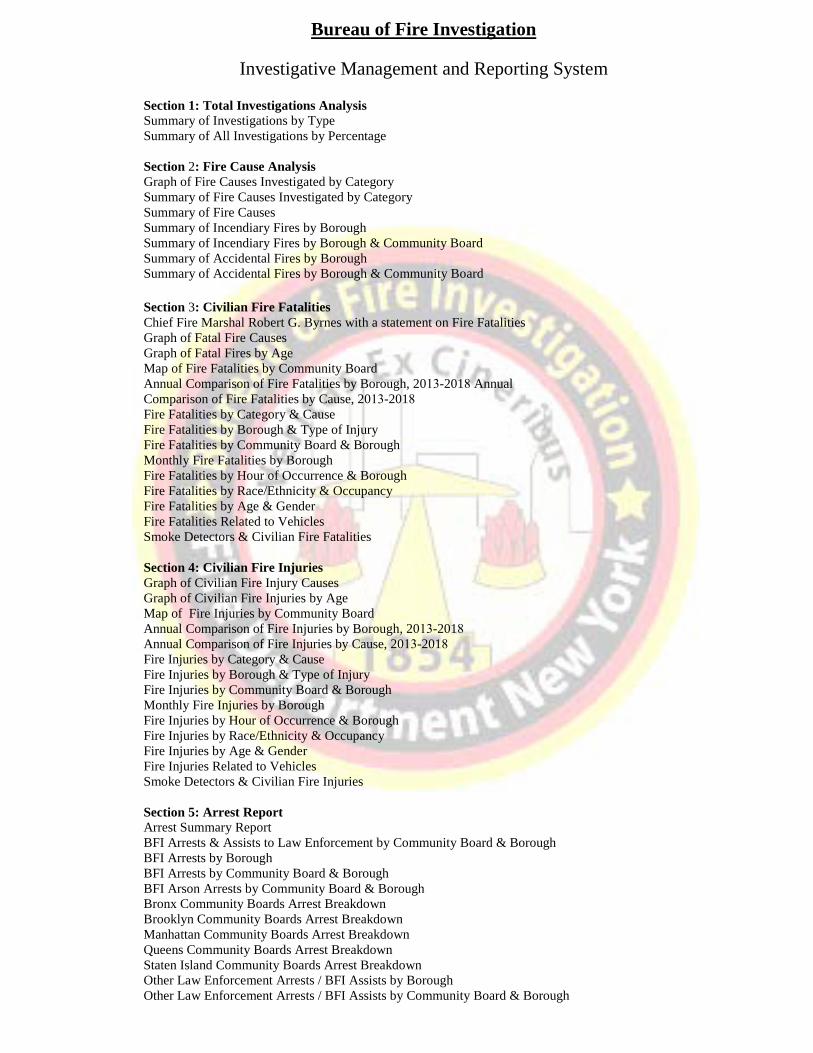
Section 1: Total Investigations Analysis Summary of Investigations by Type Summary of All Investigations by Percentage
Section 2: Fire Cause Analysis Graph of Fire Causes Investigated by Category Summary of Fire Causes Investigated by Category Summary of Fire Causes Summary of Incendiary Fires by Borough Summary of Incendiary Fires by Borough & Community Board Summary of Accidental Fires by Borough Summary of Accidental Fires by Borough & Community Board
Section 3: Civilian Fire Fatalities Chief Fire Marshal Robert G. Byrnes with a statement on Fire Fatalities Graph of Fatal Fire Causes Graph of Fatal Fires by Age Map of Fire Fatalities by Community Board Annual Comparison of Fire Fatalities by Borough, 2013-2018 Annual Comparison of Fire Fatalities by Cause, 2013-2018Fire Fatalities by Category & Cause Fire Fatalities by Borough & Type of Injury Fire Fatalities by Community Board & Borough Monthly Fire Fatalities by Borough Fire Fatalities by Hour of Occurrence & Borough Fire Fatalities by Race/Ethnicity & Occupancy Fire Fatalities by Age & Gender Fire Fatalities Related to Vehicles Smoke Detectors & Civilian Fire Fatalities
Section 4: Civilian Fire Injuries Graph of Civilian Fire Injury Causes Graph of Civilian Fire Injuries by Age Map of Fire Injuries by Community Board Annual Comparison of Fire Injuries by Borough, 2013-2018 Annual Comparison of Fire Injuries by Cause, 2013-2018 Fire Injuries by Category & Cause Fire Injuries by Borough & Type of Injury Fire Injuries by Community Board & Borough Monthly Fire Injuries by Borough Fire Injuries by Hour of Occurrence & Borough Fire Injuries by Race/Ethnicity & Occupancy Fire Injuries by Age & Gender Fire Injuries Related to Vehicles Smoke Detectors & Civilian Fire Injuries
Section 5: Arrest Report Arrest Summary Report BFI Arrests & Assists to Law Enforcement by Community Board & Borough BFI Arrests by Borough BFI Arrests by Community Board & Borough BFI Arson Arrests by Community Board & Borough Bronx Community Boards Arrest Breakdown Brooklyn Community Boards Arrest Breakdown Manhattan Community Boards Arrest Breakdown Queens Community Boards Arrest Breakdown Staten Island Community Boards Arrest Breakdown Other Law Enforcement Arrests / BFI Assists by Borough Other Law Enforcement Arrests / BFI Assists by Community Board & Borough

Bureau of Fire Investigation Investigative Management and Reporting System
2018Annual Report
on Total Investigations
Veritas ex Cineribus

Bureau Of Fire InvestigationInvestigative Management and Reporting System
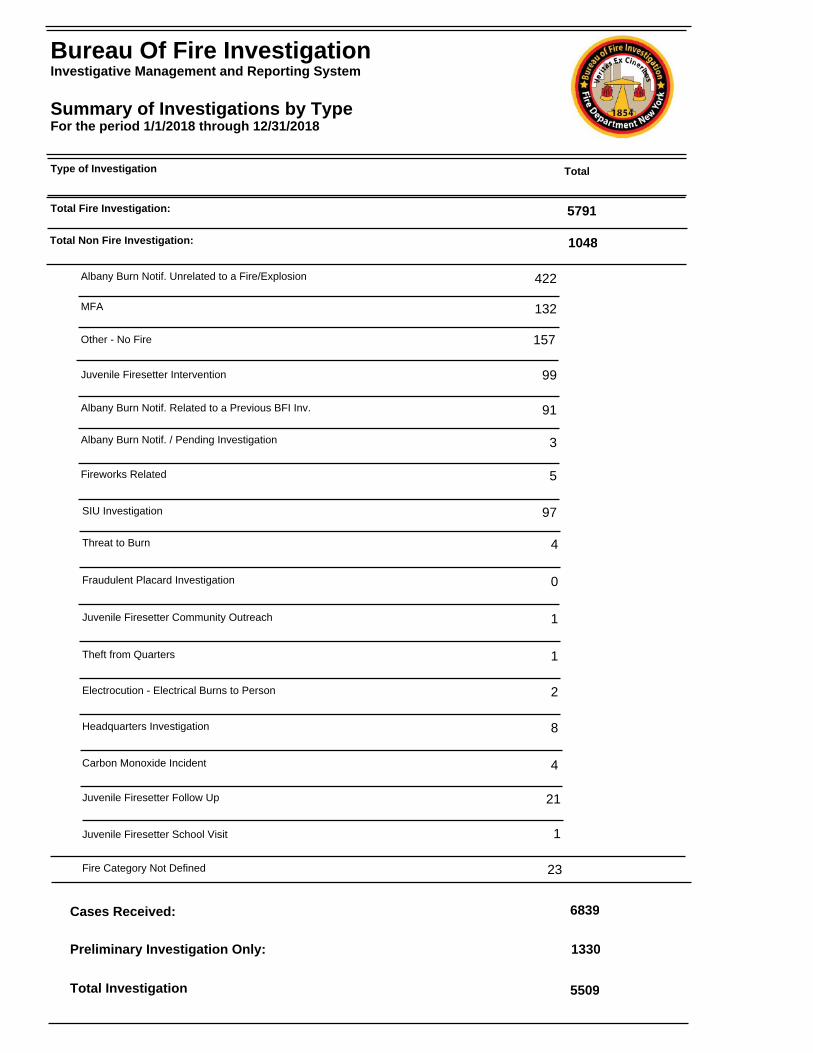
Summary of Investigations by Type For the period 1/1/2018 through 12/31/2018
Type of Investigation
Total Fire Investigation:
Total Non Fire Investigation:
Cases Received:
Preliminary Investigation Only:
Total Investigation
6839
1330
5509
Total
Albany Burn Notif. Unrelated to a Fire/Explosion
MFA
Other - No Fire
Juvenile Firesetter Intervention
Albany Burn Notif. Related to a Previous BFI Inv.
Albany Burn Notif. / Pending Investigation
Fireworks Related
SIU Investigation
Threat to Burn
Fraudulent Placard Investigation
Juvenile Firesetter Community Outreach
Theft from Quarters
Headquarters Investigation
Carbon Monoxide Incident
422
132
157
99
91
3
5
97
4
0
1
1
8
4
5791
1048
Electrocution - Electrical Burns to Person 2
Juvenile Firesetter Follow Up 21
Juvenile Firesetter School Visit 1
23Fire Category Not Defined
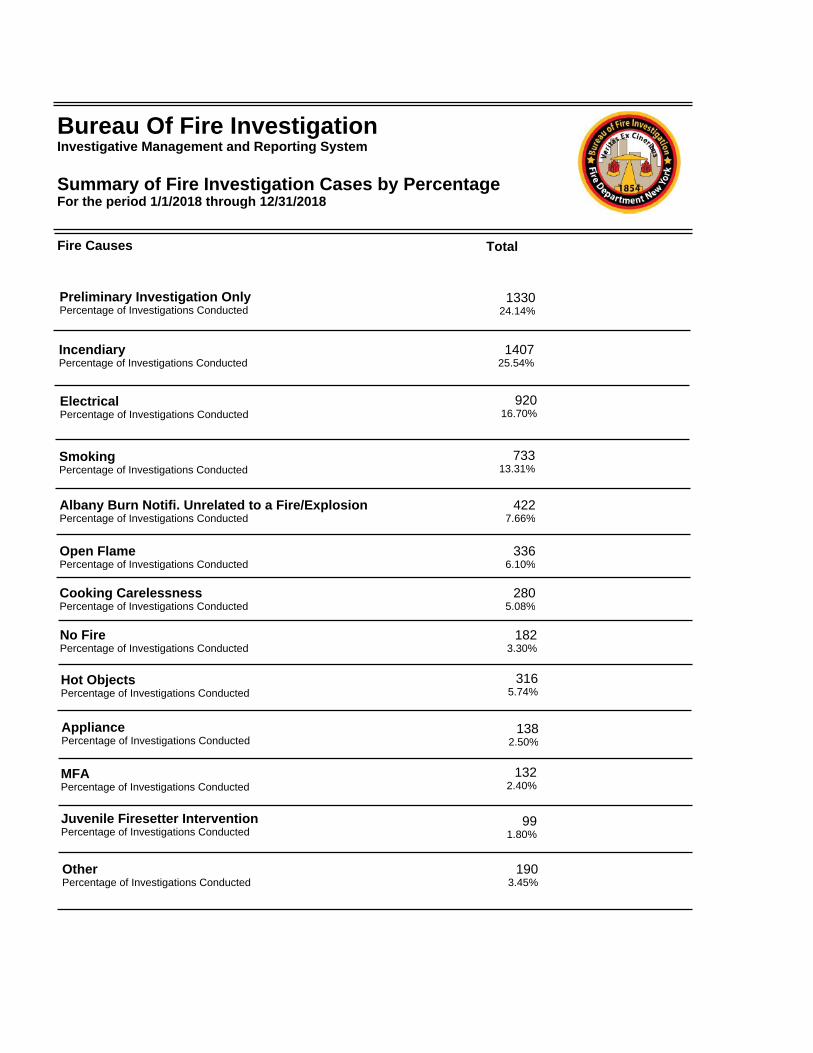
Preliminary Investigation OnlyPercentage of Investigations Conducted
IncendiaryPercentage of Investigations Conducted
SmokingPercentage of Investigations Conducted
Albany Burn Notifi. Unrelated to a Fire/ExplosionPercentage of Investigations Conducted
Open FlamePercentage of Investigations Conducted
Cooking CarelessnessPercentage of Investigations Conducted
Hot ObjectsPercentage of Investigations Conducted
No FirePercentage of Investigations Conducted
AppliancePercentage of Investigations Conducted
OtherPercentage of Investigations Conducted
MFAPercentage of Investigations Conducted
133024.14%
140725.54%
73313.31%
4227.66%
3366.10%
2805.08%
3165.74%
1823.30%
1382.50%
1903.45%
1322.40%
Juvenile Firesetter InterventionPercentage of Investigations Conducted
991.80%
ElectricalPercentage of Investigations Conducted
92016.70%
Bureau Of Fire InvestigationInvestigative Management and Reporting System
Summary of Fire Investigation Cases by Percentage For the period 1/1/2018 through 12/31/2018
Fire Causes Total
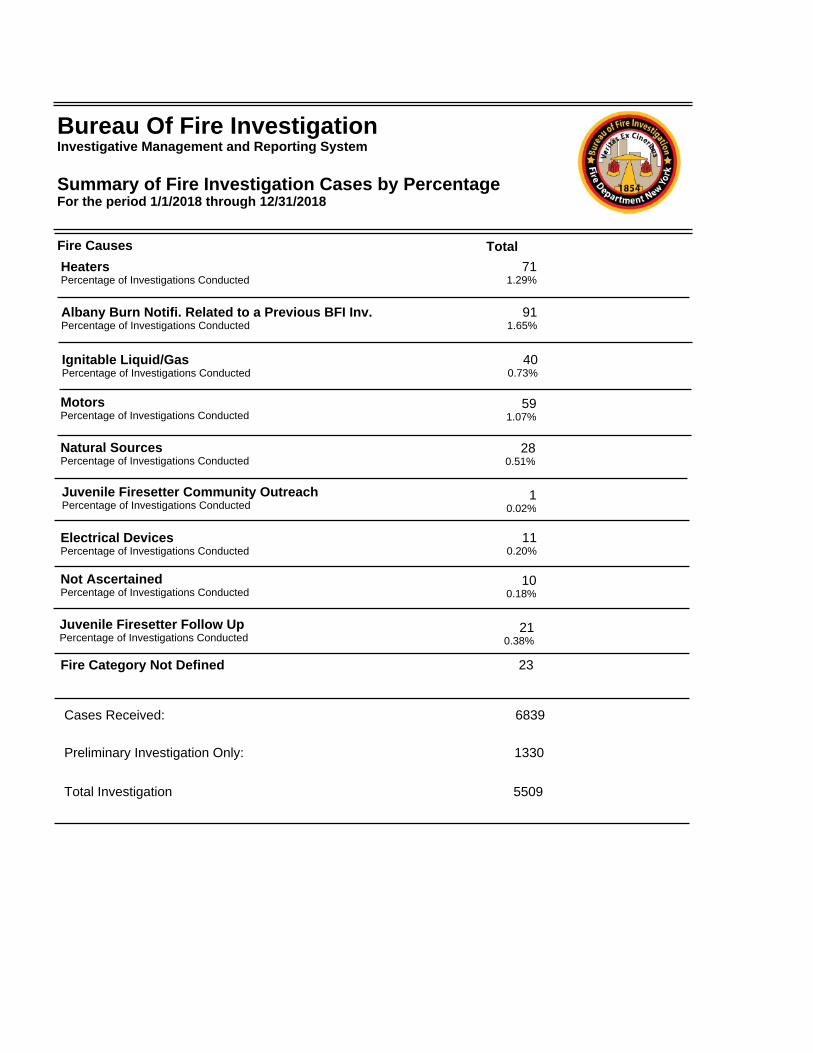
Cases Received:
Preliminary Investigation Only:
Total Investigation
6839
1330
5509
HeatersPercentage of Investigations Conducted
Ignitable Liquid/GasPercentage of Investigations Conducted
711.29%
400.73%
MotorsPercentage of Investigations Conducted
591.07%
Natural SourcesPercentage of Investigations Conducted
280.51%
Electrical DevicesPercentage of Investigations Conducted
110.20%
Not AscertainedPercentage of Investigations Conducted
100.18%
Juvenile Firesetter Community OutreachPercentage of Investigations Conducted
10.02%
Juvenile Firesetter Follow UpPercentage of Investigations Conducted
210.38%
Albany Burn Notifi. Related to a Previous BFI Inv.Percentage of Investigations Conducted
911.65%
Fire Category Not Defined 23
Bureau Of Fire InvestigationInvestigative Management and Reporting System
Summary of Fire Investigation Cases by Percentage For the period 1/1/2018 through 12/31/2018
Fire Causes Total

Bureau of Fire Investigation Investigative Management and Reporting System
2018 Annual Report
on Fire Causes
Veritas ex Cineribus

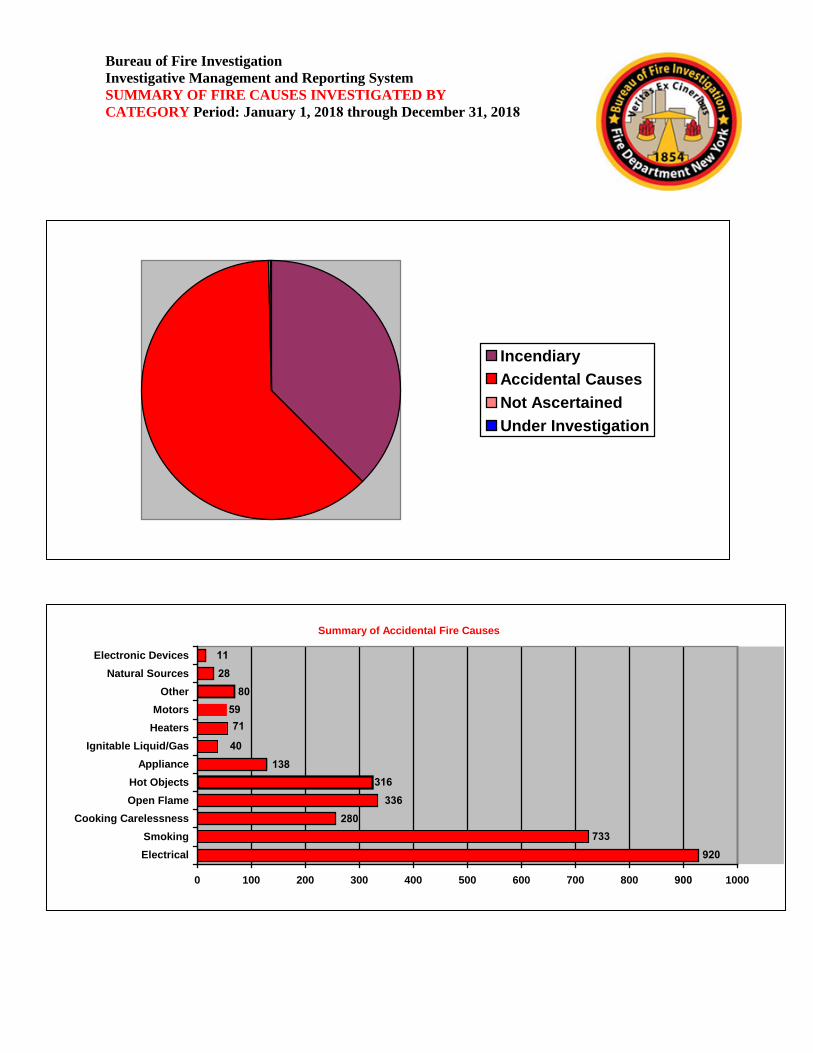
Bureau of Fire Investigation Investigative Management and Reporting System SUMMARY OF FIRE CAUSES INVESTIGATED BY CATEGORY Period: January 1, 2018 through December 31, 2018
IncendiaryAccidental Causes Not AscertainedUnder Investigation
Summary of Accidental Fire Causes
920733
280336
316138
40
715980
2811
0 100 200 300 400 500 600 700 800 900 1000
ElectricalSmoking
Cooking CarelessnessOpen FlameHot Objects
ApplianceIgnitable Liquid/Gas
HeatersMotors
OtherNatural Sources
Electronic Devices
IncendiaryPercentage of Investigations Conducted
SmokingPercentage of Investigations Conducted
ElectricalPercentage of Investigations Conducted
Open FlamePercentage of Investigations Conducted
Cooking CarelessnessPercentage of Investigations Conducted
Hot ObjectsPercentage of Investigations Conducted
AppliancePercentage of Investigations Conducted
OtherPercentage of Investigations Conducted
HeatersPercentage of Investigations Conducted
Ignitable Liquid/GasPercentage of Investigations Conducted
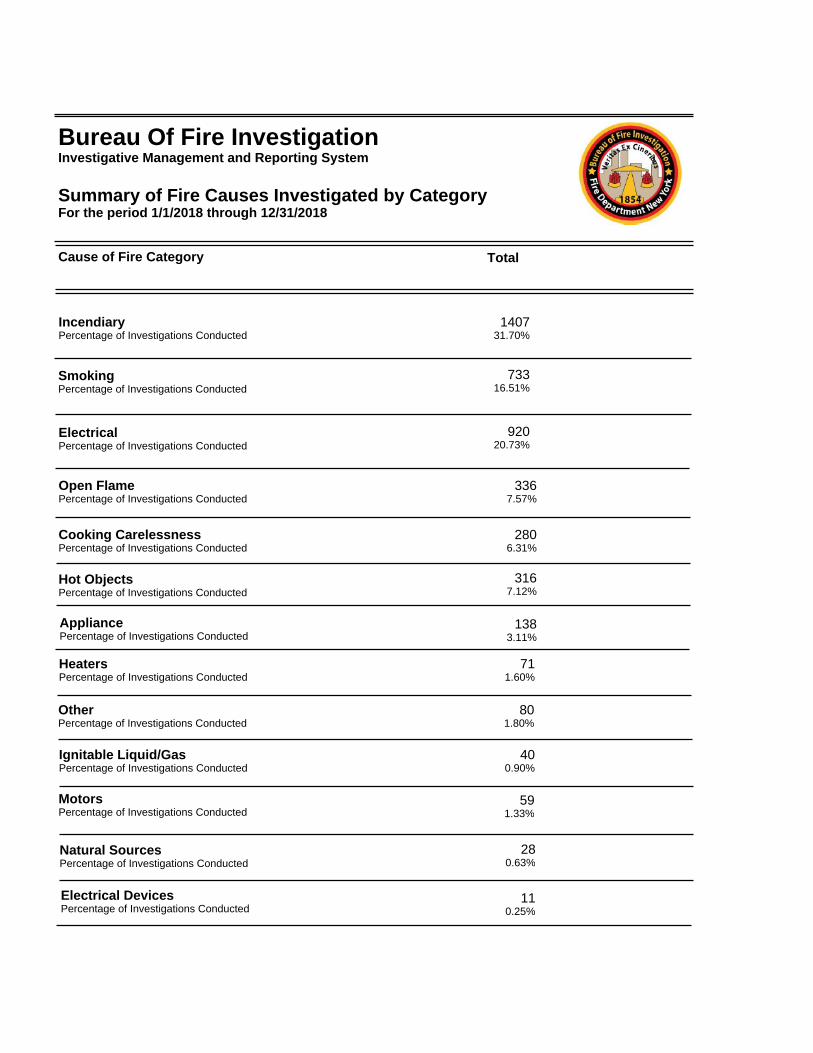
140731.70%
73316.51%
92020.73%
3367.57%
2806.31%
3167.12%
1383.11%
801.80%
711.60%
400.90%
MotorsPercentage of Investigations Conducted
591.33%
Natural SourcesPercentage of Investigations Conducted
280.63%
Electrical DevicesPercentage of Investigations Conducted
110.25%
Bureau Of Fire InvestigationInvestigative Management and Reporting System
Summary of Fire Causes Investigated by Category For the period 1/1/2018 through 12/31/2018
Cause of Fire Category Total
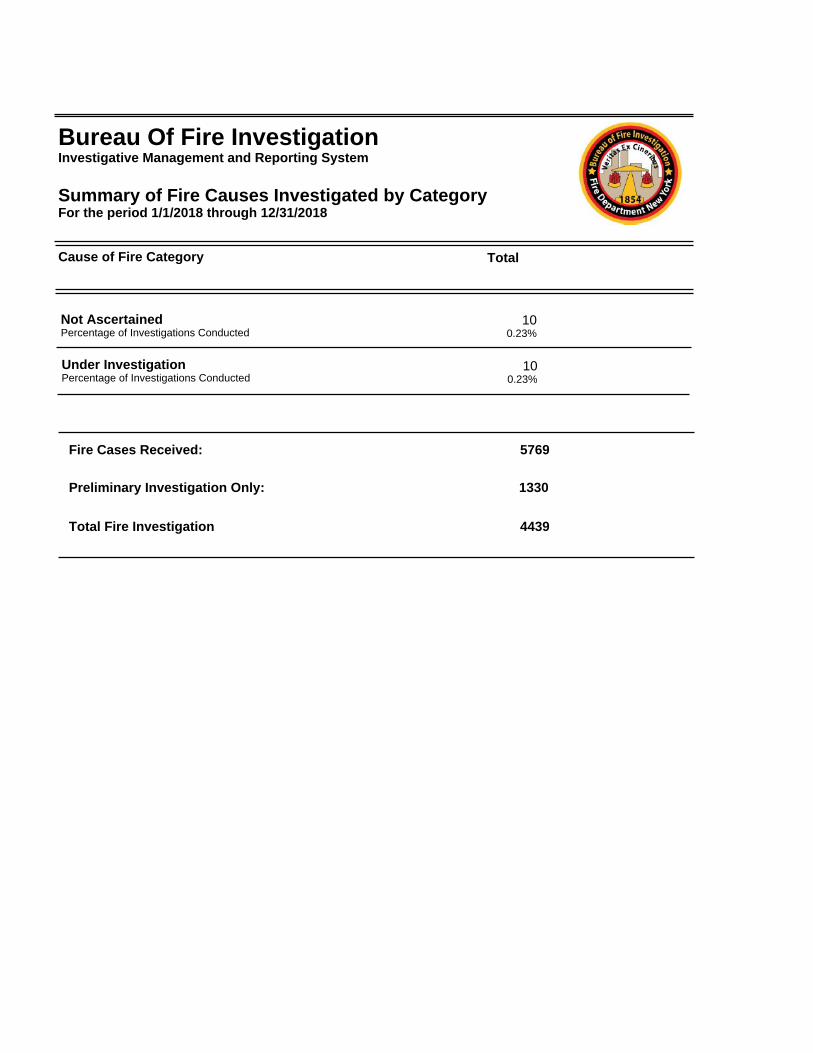
Fire Cases Received:
Preliminary Investigation Only:
Total Fire Investigation
5769
1330
4439
Not AscertainedPercentage of Investigations Conducted
100.23%
Under InvestigationPercentage of Investigations Conducted
100.23%
Bureau Of Fire InvestigationInvestigative Management and Reporting System
Summary of Fire Causes Investigated by Category For the period 1/1/2018 through 12/31/2018
Cause of Fire Category Total
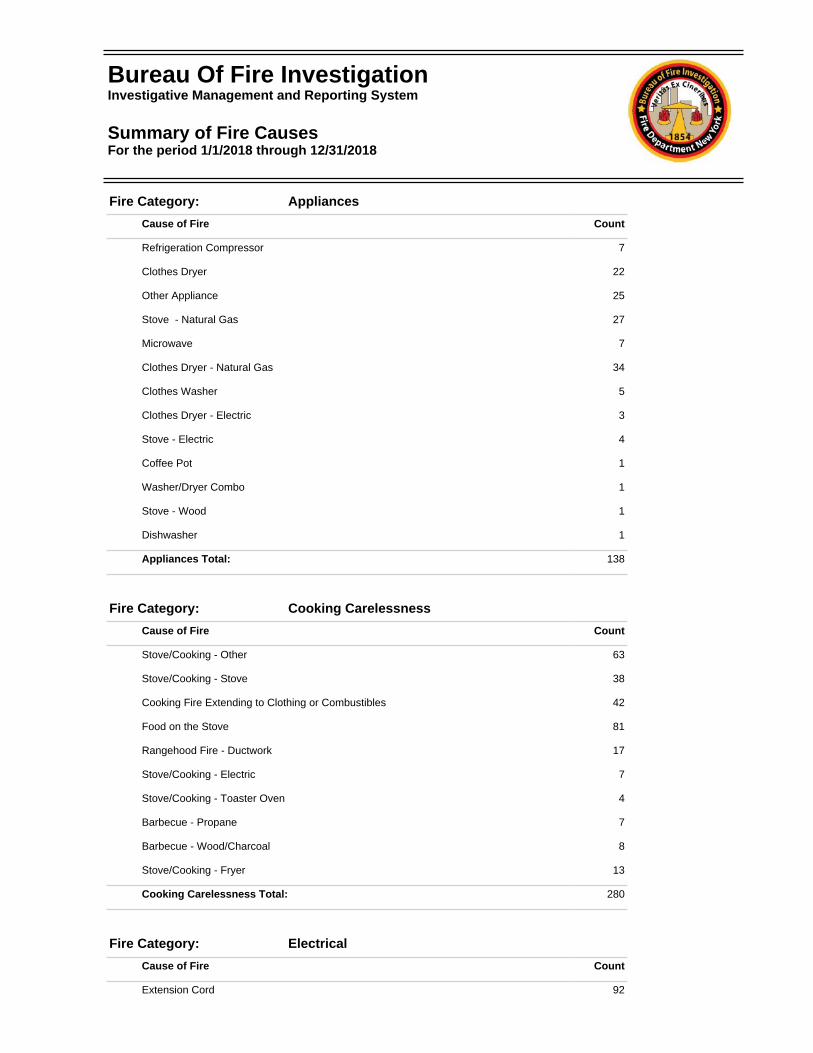
Fire Category: Appliances
Cause of Fire Count
Refrigeration Compressor 7
Clothes Dryer 22
Other Appliance 25
Stove - Natural Gas 27
Microwave 7
Clothes Dryer - Natural Gas 34
Clothes Washer 5
Clothes Dryer - Electric 3
Stove - Electric 4
Coffee Pot 1
Washer/Dryer Combo 1
Stove - Wood 1
Dishwasher 1
Appliances Total: 138
Fire Category: Cooking Carelessness
Cause of Fire Count
Stove/Cooking - Other 63
Stove/Cooking - Stove 38
Cooking Fire Extending to Clothing or Combustibles 42
Food on the Stove 81
Rangehood Fire - Ductwork 17
Stove/Cooking - Electric 7
Stove/Cooking - Toaster Oven 4
Barbecue - Propane 7
Barbecue - Wood/Charcoal 8
Stove/Cooking - Fryer 13
Cooking Carelessness Total: 280
Fire Category: Electrical
Cause of Fire Count
Extension Cord 92
Bureau Of Fire InvestigationInvestigative Management and Reporting System
Summary of Fire CausesFor the period 1/1/2018 through 12/31/2018
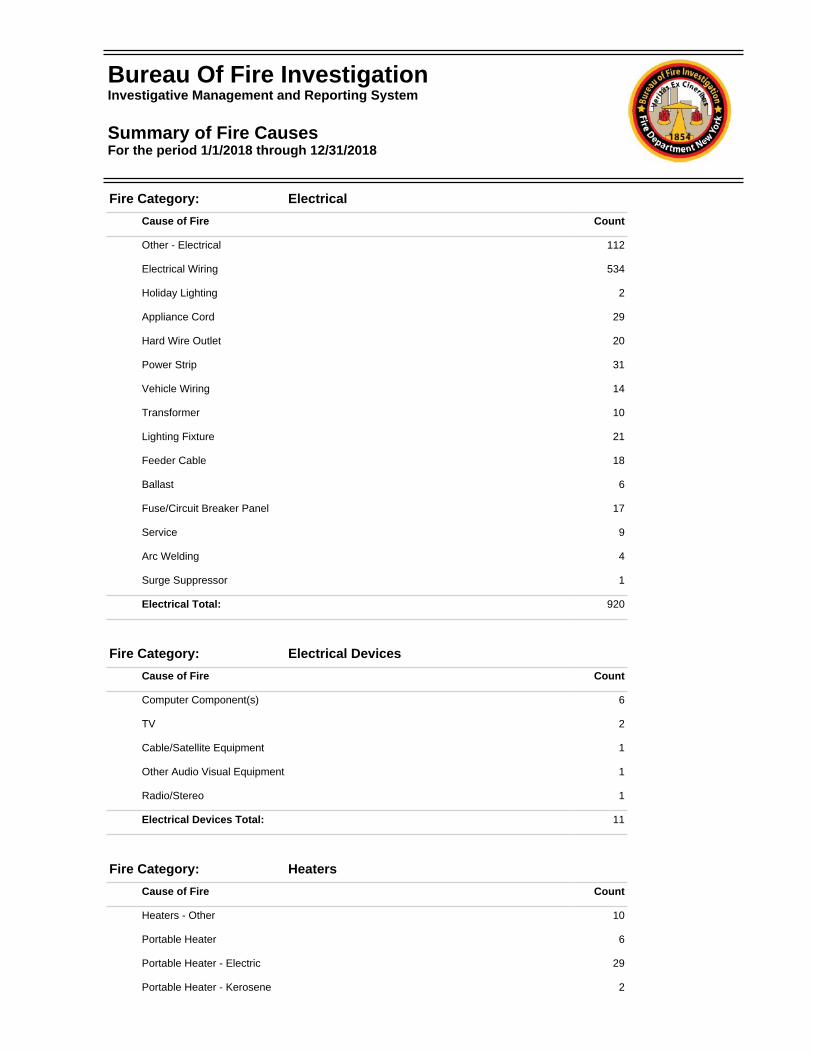
Fire Category: Electrical
Cause of Fire Count
Other - Electrical 112
Electrical Wiring 534
Holiday Lighting 2
Appliance Cord 29
Hard Wire Outlet 20
Power Strip 31
Vehicle Wiring 14
Transformer 10
Lighting Fixture 21
Feeder Cable 18
Ballast 6
Fuse/Circuit Breaker Panel 17
Service 9
Arc Welding 4
Surge Suppressor 1
Electrical Total: 920
Fire Category: Electrical Devices
Cause of Fire Count
Computer Component(s) 6
TV 2
Cable/Satellite Equipment 1
Other Audio Visual Equipment 1
Radio/Stereo 1
Electrical Devices Total: 11
Fire Category: Heaters
Cause of Fire Count
Heaters - Other 10
Portable Heater 6
Portable Heater - Electric 29
Portable Heater - Kerosene 2
Bureau Of Fire InvestigationInvestigative Management and Reporting System
Summary of Fire CausesFor the period 1/1/2018 through 12/31/2018
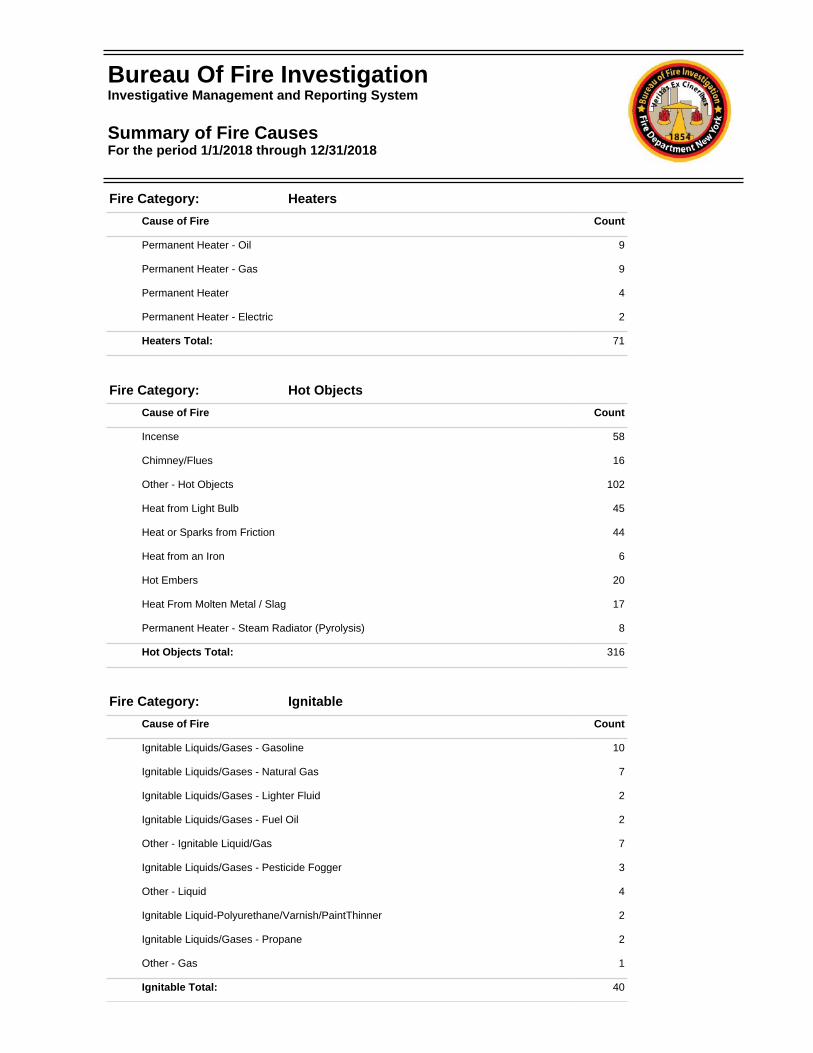
Fire Category: Heaters
Cause of Fire Count
Permanent Heater - Oil 9
Permanent Heater - Gas 9
Permanent Heater 4
Permanent Heater - Electric 2
Heaters Total: 71
Fire Category: Hot Objects
Cause of Fire Count
Incense 58
Chimney/Flues 16
Other - Hot Objects 102
Heat from Light Bulb 45
Heat or Sparks from Friction 44
Heat from an Iron 6
Hot Embers 20
Heat From Molten Metal / Slag 17
Permanent Heater - Steam Radiator (Pyrolysis) 8
Hot Objects Total: 316
Fire Category: Ignitable
Cause of Fire Count
Ignitable Liquids/Gases - Gasoline 10
Ignitable Liquids/Gases - Natural Gas 7
Ignitable Liquids/Gases - Lighter Fluid 2
Ignitable Liquids/Gases - Fuel Oil 2
Other - Ignitable Liquid/Gas 7
Ignitable Liquids/Gases - Pesticide Fogger 3
Other - Liquid 4
Ignitable Liquid-Polyurethane/Varnish/PaintThinner 2
Ignitable Liquids/Gases - Propane 2
Other - Gas 1
Ignitable Total: 40
Bureau Of Fire InvestigationInvestigative Management and Reporting System
Summary of Fire CausesFor the period 1/1/2018 through 12/31/2018
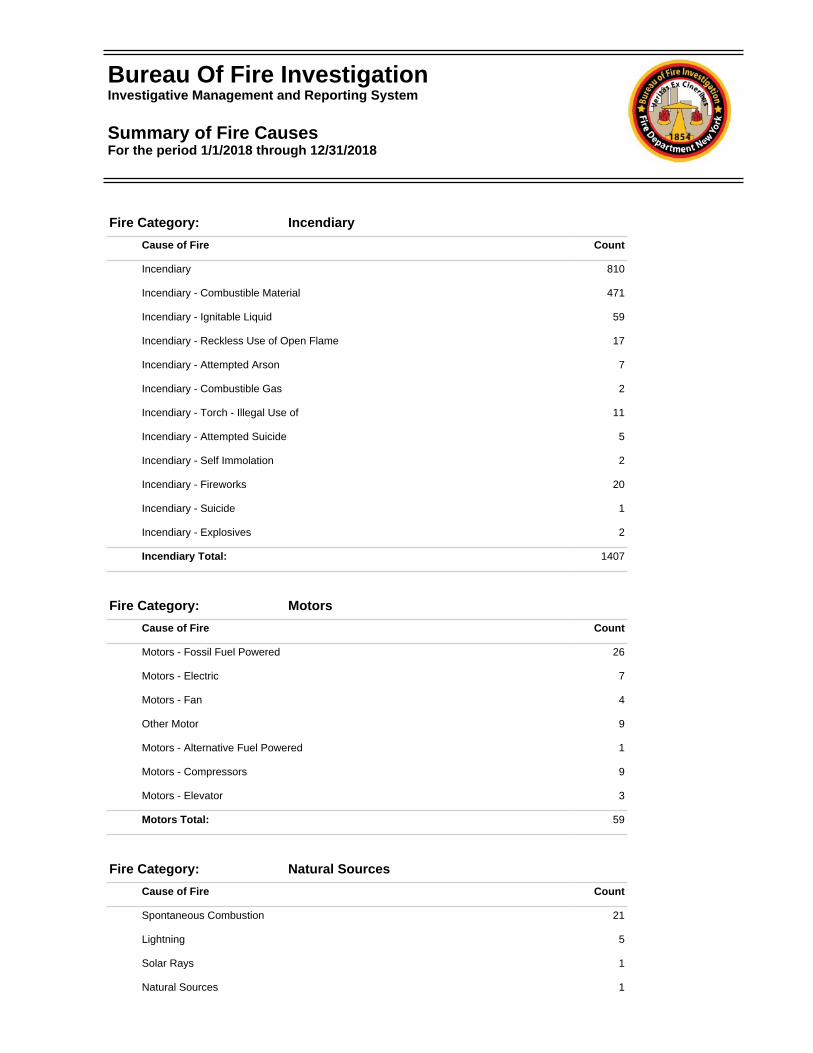
Fire Category: Incendiary
Cause of Fire Count
Incendiary 810
Incendiary - Combustible Material 471
Incendiary - Ignitable Liquid 59
Incendiary - Reckless Use of Open Flame 17
Incendiary - Attempted Arson 7
Incendiary - Combustible Gas 2
Incendiary - Torch - Illegal Use of 11
Incendiary - Attempted Suicide 5
Incendiary - Self Immolation 2
Incendiary - Fireworks 20
Incendiary - Suicide 1
Incendiary - Explosives 2
Incendiary Total: 1407
Fire Category: Motors
Cause of Fire Count
Motors - Fossil Fuel Powered 26
Motors - Electric 7
Motors - Fan 4
Other Motor 9
Motors - Alternative Fuel Powered 1
Motors - Compressors 9
Motors - Elevator 3
Motors Total: 59
Fire Category: Natural Sources
Cause of Fire Count
Spontaneous Combustion 21
Lightning 5
Solar Rays 1
Natural Sources 1
Bureau Of Fire InvestigationInvestigative Management and Reporting System
Summary of Fire CausesFor the period 1/1/2018 through 12/31/2018
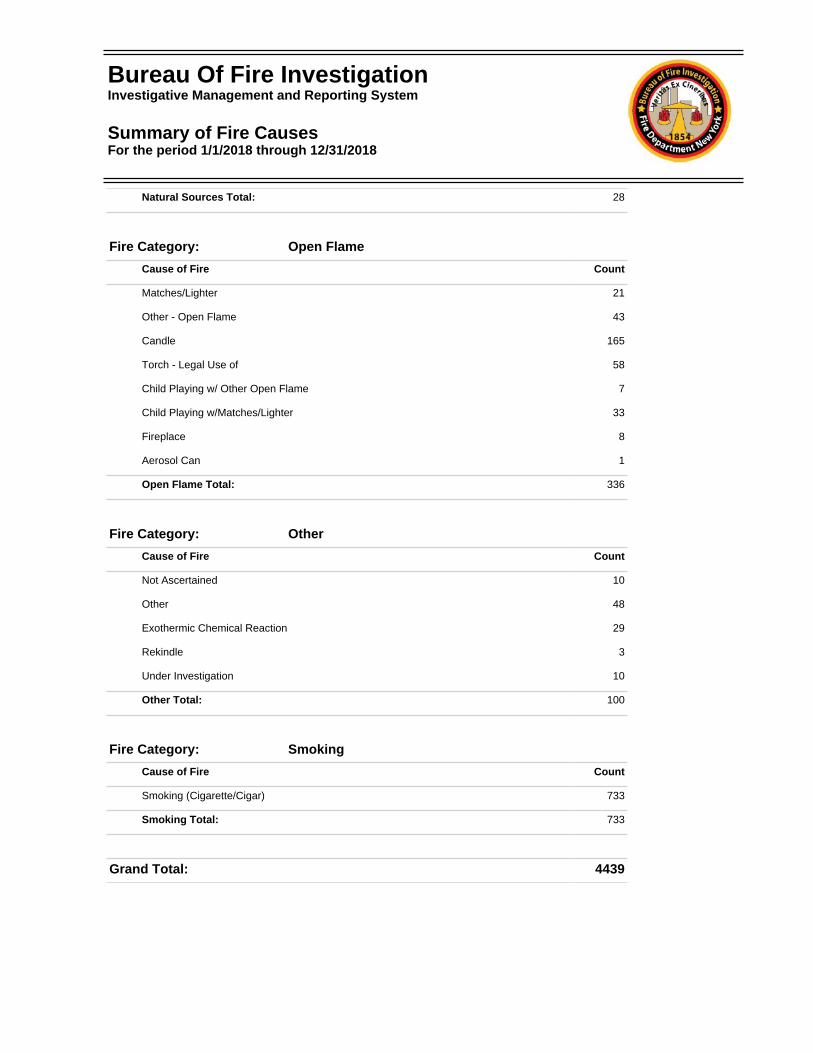
Natural Sources Total: 28
Fire Category: Open Flame
Cause of Fire Count
Matches/Lighter 21
Other - Open Flame 43
Candle 165
Torch - Legal Use of 58
Child Playing w/ Other Open Flame 7
Child Playing w/Matches/Lighter 33
Fireplace 8
Aerosol Can 1
Open Flame Total: 336
Fire Category: Other
Cause of Fire Count
Not Ascertained 10
Other 48
Exothermic Chemical Reaction 29
Rekindle 3
Under Investigation 10
Other Total: 100
Fire Category: Smoking
Cause of Fire Count
Smoking (Cigarette/Cigar) 733
Smoking Total: 733
Grand Total: 4439
Bureau Of Fire InvestigationInvestigative Management and Reporting System
Summary of Fire CausesFor the period 1/1/2018 through 12/31/2018
Bureau of Fire Investigation Investigative Management and Reporting System
2018 Annual Report
on Incendiary Fires
Veritas ex Cineribus

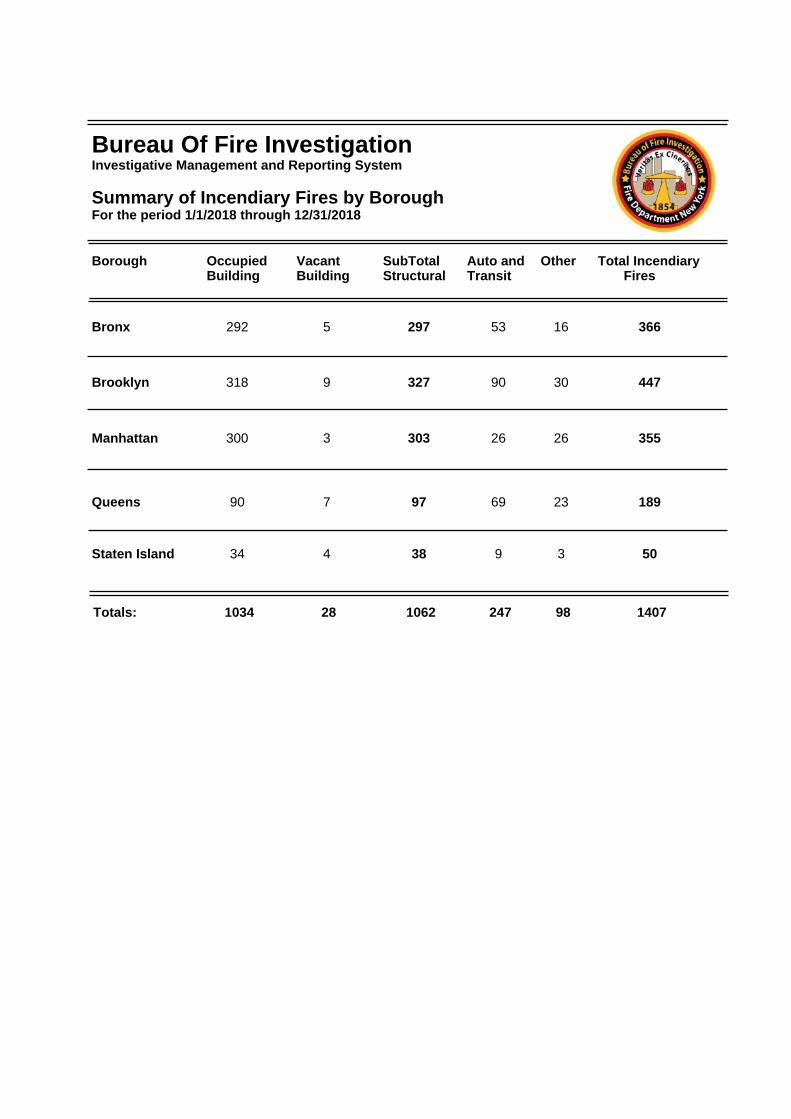
Bureau Of Fire InvestigationInvestigative Management and Reporting System
Summary of Incendiary Fires by BoroughFor the period 1/1/2018 through 12/31/2018
Borough OccupiedBuilding
VacantBuilding
SubTotalStructural
Auto andTransit
Other Total Incendiary Fires
Bronx
Brooklyn
Manhattan
Queens
Staten Island
Totals:
292 5 297 53 16 366
318 9 327 90 30 447
300 3 303 26 26 355
90 7 97 69 23 189
34 4 38 9 3 50
1034 28 1062 247 98 1407
Borough Occupied Building
Vacant Building
SubTotal Structural
Auto and Transit Other Total Incendiary Fires
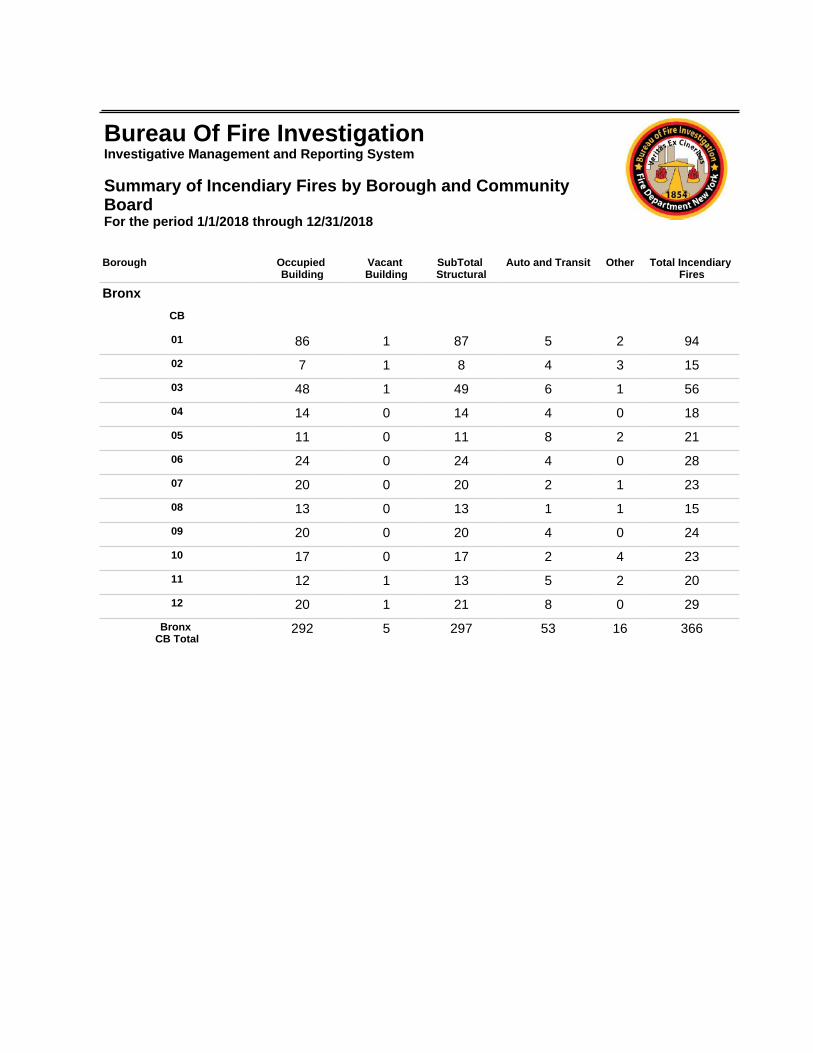
Bronx
CB
01 86 1 87 5 2 94
02 7 1 8 4 3 15
03 48 1 49 6 1 56
04 14 0 14 4 0 18
05 11 0 11 8 2 21
06 24 0 24 4 0 28
07 20 0 20 2 1 23
08 13 0 13 1 1 15
09 20 0 20 4 0 24
10 17 0 17 2 4 23
11 12 1 13 5 2 20
12 20 1 21 8 0 29
Bronx CB Total
292 5 297 53 16 366
Bureau Of Fire InvestigationInvestigative Management and Reporting System
Summary of Incendiary Fires by Borough and Community BoardFor the period 1/1/2018 through 12/31/2018
Borough Occupied Building
Vacant Building
SubTotal Structural
Auto and Transit Other Total Incendiary Fires
Brooklyn
CB
01 30 0 30 11 4 45
02 14 0 14 2 2 18
03 40 2 42 6 4 52
04 10 1 11 5 0 16
05 37 0 37 20 5 62
06 18 2 20 2 1 23
07 9 0 9 4 0 13
08 8 2 10 2 2 14
09 23 0 23 2 2 27
10 2 0 2 1 0 3
11 6 0 6 4 0 10
12 5 0 5 3 0 8
13 26 0 26 1 1 28
14 5 0 5 0 0 5
15 7 0 7 5 4 16
16 45 1 46 4 1 51
17 16 1 17 4 1 22
18 17 0 17 14 3 34
Brooklyn CB Total
318 9 327 90 30 447
Bureau Of Fire InvestigationInvestigative Management and Reporting System
Summary of Incendiary Fires by Borough and Community BoardFor the period 1/1/2018 through 12/31/2018

Borough Occupied Building
Vacant Building
SubTotal Structural
Auto and Transit Other Total Incendiary Fires
Manhattan
CB
01 7 0 7 2 3 12
02 15 0 15 1 6 22
03 43 0 43 6 4 53
04 14 1 15 2 2 19
05 23 1 24 1 3 28
06 8 1 9 1 0 10
07 20 0 20 0 2 22
08 16 0 16 0 1 17
09 23 0 23 0 1 24
10 44 0 44 5 2 51
11 67 0 67 1 1 69
12 20 0 20 7 1 28
Manhattan CB Total
300 3 303 26 26 355
Bureau Of Fire InvestigationInvestigative Management and Reporting System
Summary of Incendiary Fires by Borough and Community BoardFor the period 1/1/2018 through 12/31/2018
Borough Occupied Building
Vacant Building
SubTotal Structural
Auto and Transit Other Total Incendiary Fires
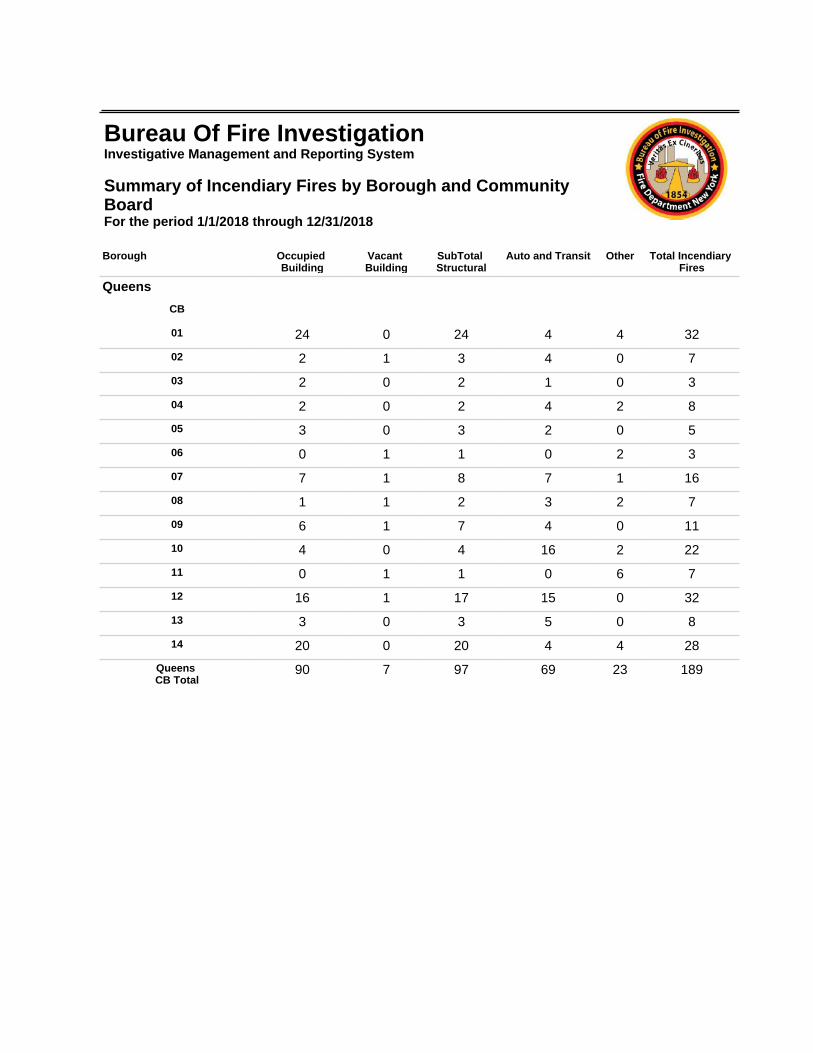
Queens
CB
01 24 0 24 4 4 32
02 2 1 3 4 0 7
03 2 0 2 1 0 3
04 2 0 2 4 2 8
05 3 0 3 2 0 5
06 0 1 1 0 2 3
07 7 1 8 7 1 16
08 1 1 2 3 2 7
09 6 1 7 4 0 11
10 4 0 4 16 2 22
11 0 1 1 0 6 7
12 16 1 17 15 0 32
13 3 0 3 5 0 8
14 20 0 20 4 4 28
Queens CB Total
90 7 97 69 23 189
Bureau Of Fire InvestigationInvestigative Management and Reporting System
Summary of Incendiary Fires by Borough and Community BoardFor the period 1/1/2018 through 12/31/2018
Borough Occupied Building
Vacant Building
SubTotal Structural
Auto and Transit Other Total Incendiary Fires
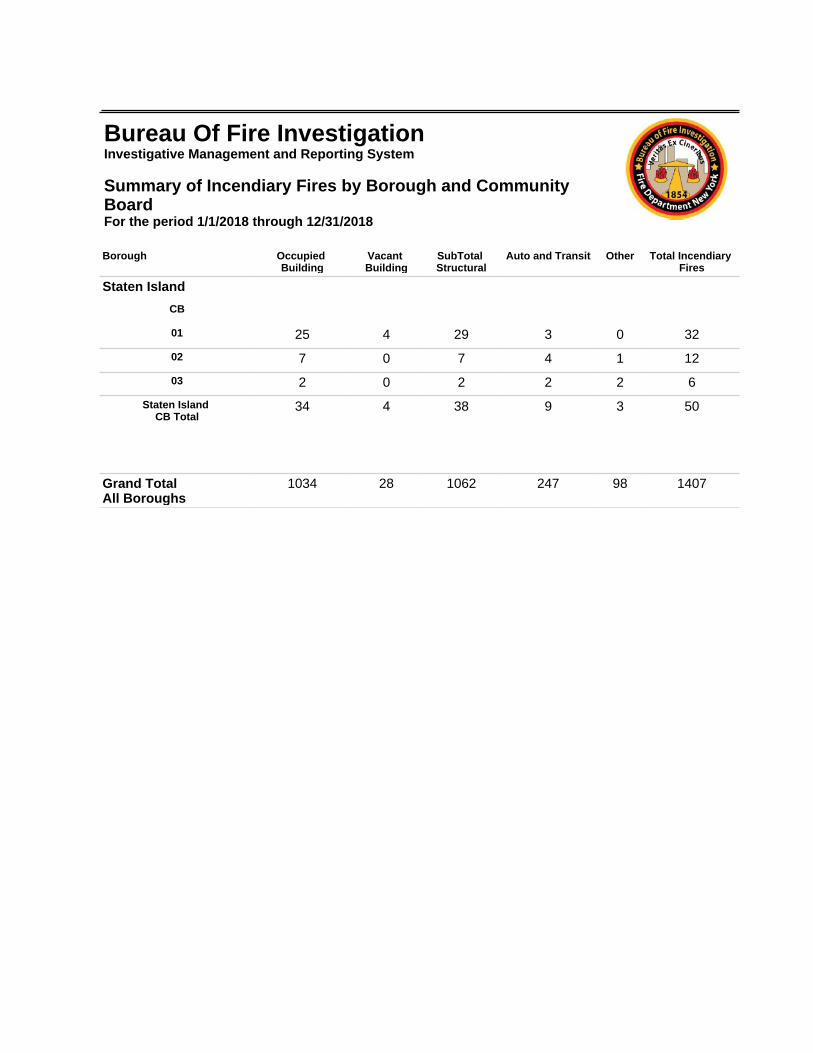
Staten Island
CB
01 25 4 29 3 0 32
02 7 0 7 4 1 12
03 2 0 2 2 2 6
Staten Island CB Total
34 4 38 9 3 50
Grand TotalAll Boroughs
1034 28 1062 247 98 1407
Bureau Of Fire InvestigationInvestigative Management and Reporting System
Summary of Incendiary Fires by Borough and Community BoardFor the period 1/1/2018 through 12/31/2018
Bureau of Fire Investigation Investigative Management and Reporting System
2018 Annual Report
on Accidental Fires
Veritas ex Cineribus
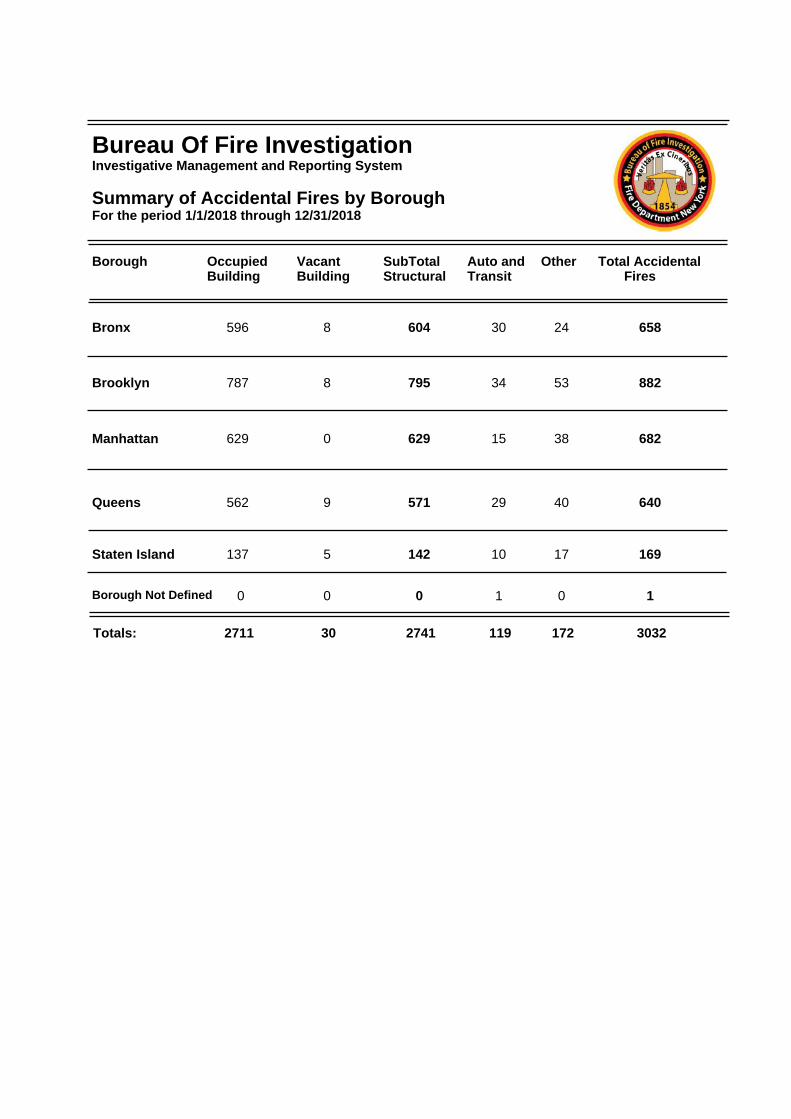
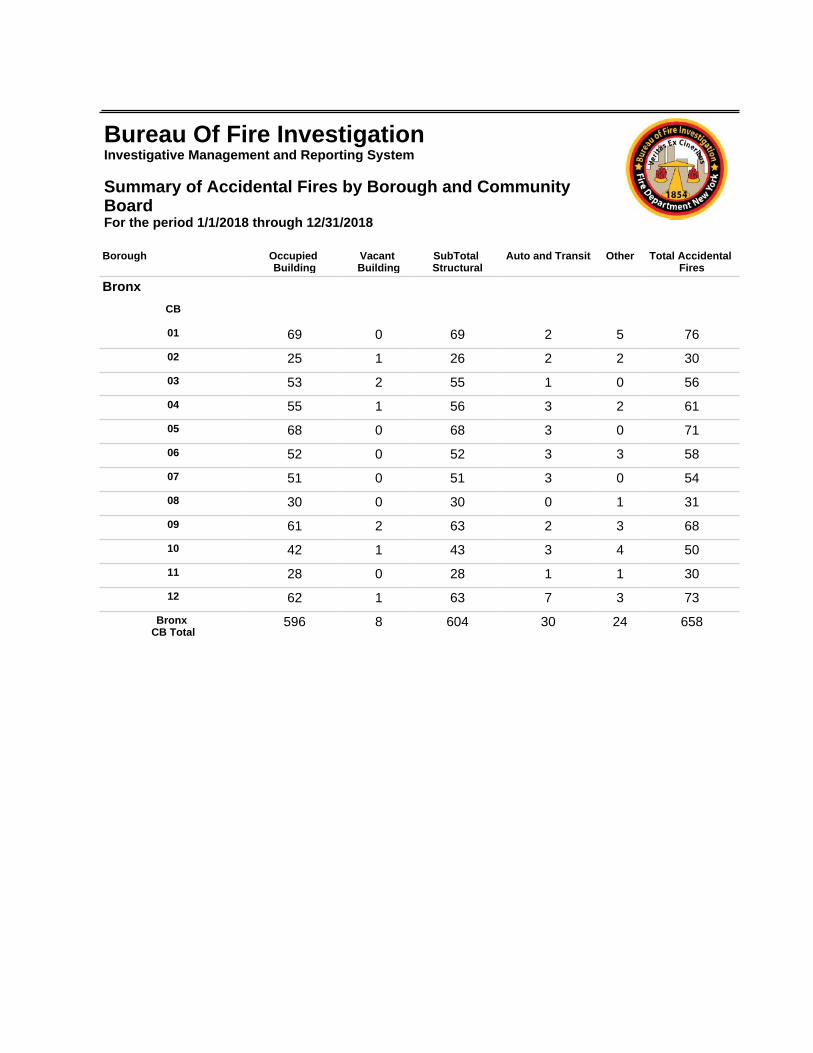
Bureau Of Fire InvestigationInvestigative Management and Reporting System
Summary of Accidental Fires by BoroughFor the period 1/1/2018 through 12/31/2018
Borough OccupiedBuilding
VacantBuilding
SubTotalStructural
Auto andTransit
Other Total Accidental Fires
Bronx
Brooklyn
Manhattan
Queens
Staten Island
Totals:
596 8 604 30 24 658
787 8 795 34 53 882
629 0 629 15 38 682
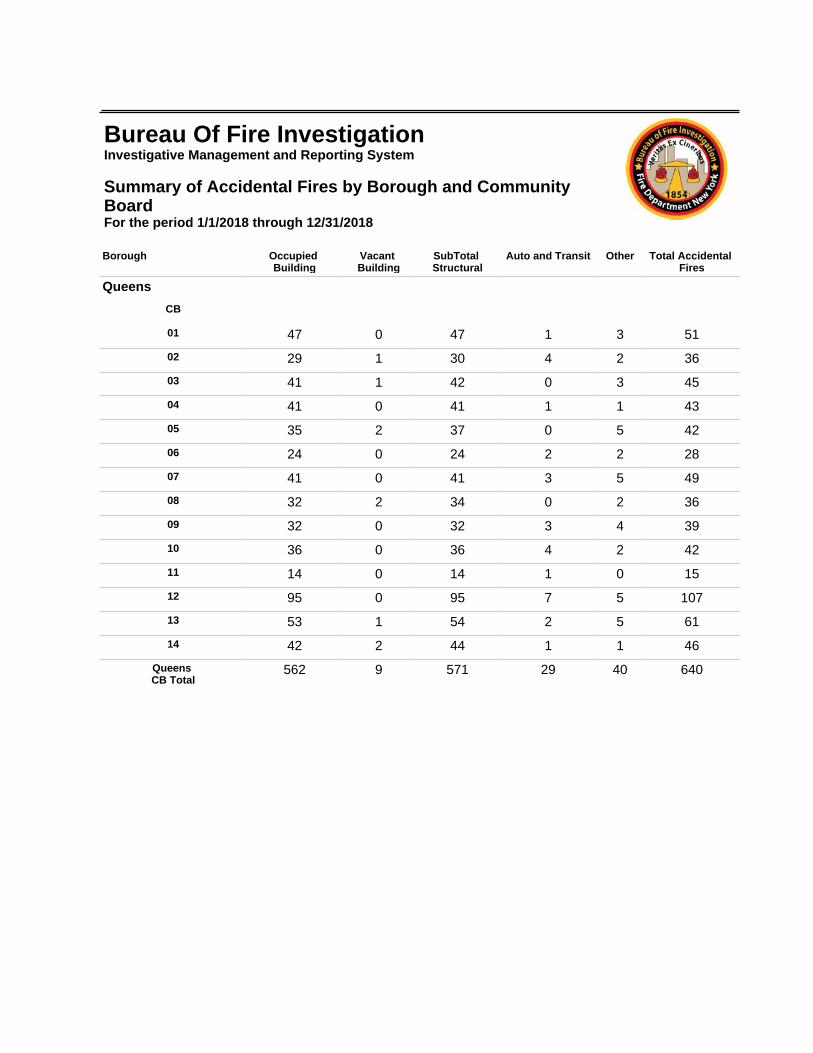
562 9 571 29 40 640
137 5 142 10 17 169
2711 30 2741 119 172 3032
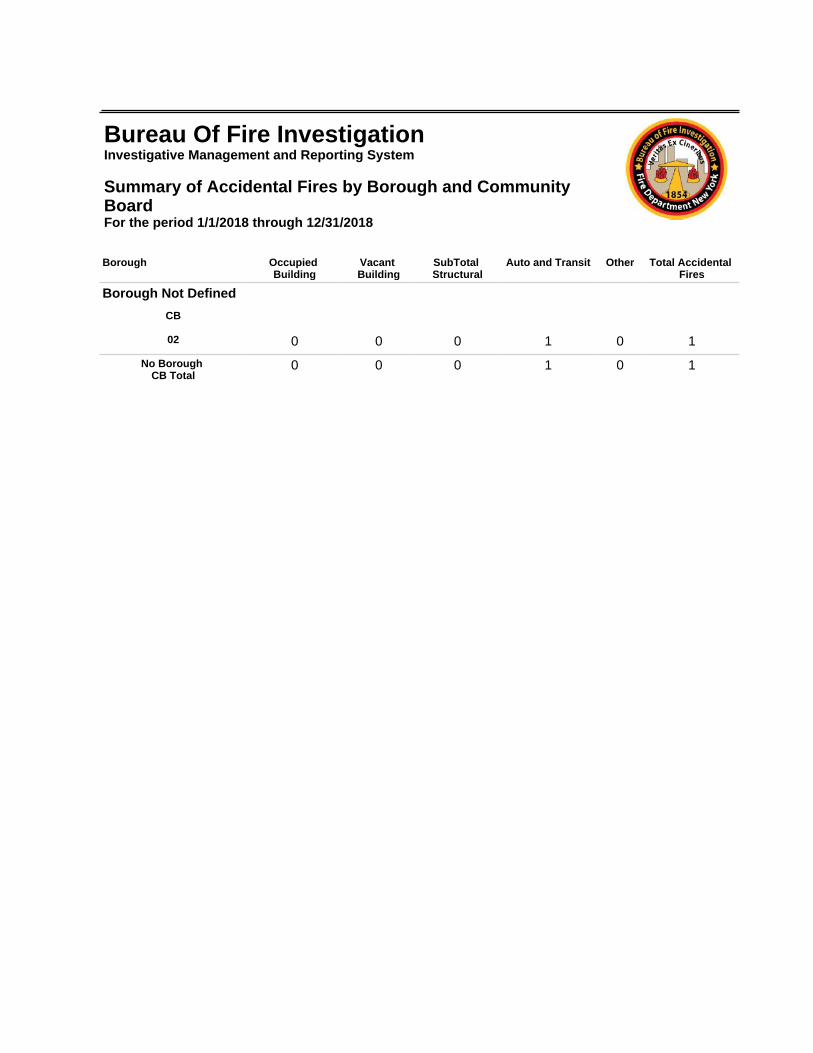
Borough Not Defined 0 0 0 1 0 1
Borough Occupied Building
Vacant Building
SubTotal Structural
Auto and Transit Other Total Accidental Fires
Bronx
CB
01 69 0 69 2 5 76
02 25 1 26 2 2 30
03 53 2 55 1 0 56
04 55 1 56 3 2 61
05 68 0 68 3 0 71
06 52 0 52 3 3 58
07 51 0 51 3 0 54
08 30 0 30 0 1 31
09 61 2 63 2 3 68
10 42 1 43 3 4 50
11 28 0 28 1 1 30
12 62 1 63 7 3 73
Bronx CB Total
596 8 604 30 24 658
Bureau Of Fire InvestigationInvestigative Management and Reporting System
Summary of Accidental Fires by Borough and Community BoardFor the period 1/1/2018 through 12/31/2018

Borough Occupied Building
Vacant Building
SubTotal Structural
Auto and Transit Other Total Accidental Fires
Brooklyn
CB
01 63 1 64 6 7 77
02 46 1 47 1 3 51
03 61 1 62 1 2 65
04 46 0 46 2 2 50
05 66 1 67 6 2 75
06 28 2 30 0 7 37
07 29 0 29 2 2 33
08 36 0 36 1 3 40
09 46 0 46 0 1 47
10 17 0 17 0 4 21
11 26 0 26 1 2 29
12 41 0 41 1 6 48
13 34 0 34 1 4 39
14 52 0 52 1 2 55
15 35 1 36 3 1 40
16 43 1 44 2 1 47
17 57 0 57 1 1 59
18 61 0 61 5 3 69
Brooklyn CB Total
787 8 795 34 53 882
Bureau Of Fire InvestigationInvestigative Management and Reporting System
Summary of Accidental Fires by Borough and Community BoardFor the period 1/1/2018 through 12/31/2018

Borough Occupied Building
Vacant Building
SubTotal Structural
Auto and Transit Other Total Accidental Fires
Manhattan
CB
01 19 0 19 1 6 26
02 33 0 33 1 5 39
03 65 0 65 1 3 69
04 44 0 44 2 0 46
05 67 0 67 4 8 79
06 39 0 39 1 2 42
07 54 0 54 1 2 57
08 46 0 46 0 2 48
09 50 0 50 1 4 55
10 57 0 57 0 3 60
11 82 0 82 1 0 83
12 73 0 73 2 3 78
Manhattan CB Total
629 0 629 15 38 682
Bureau Of Fire InvestigationInvestigative Management and Reporting System
Summary of Accidental Fires by Borough and Community BoardFor the period 1/1/2018 through 12/31/2018
Borough Occupied Building
Vacant Building
SubTotal Structural
Auto and Transit Other Total Accidental Fires
Queens
CB
01 47 0 47 1 3 51
02 29 1 30 4 2 36
03 41 1 42 0 3 45
04 41 0 41 1 1 43
05 35 2 37 0 5 42
06 24 0 24 2 2 28
07 41 0 41 3 5 49
08 32 2 34 0 2 36
09 32 0 32 3 4 39
10 36 0 36 4 2 42
11 14 0 14 1 0 15
12 95 0 95 7 5 107
13 53 1 54 2 5 61
14 42 2 44 1 1 46
Queens CB Total
562 9 571 29 40 640
Bureau Of Fire InvestigationInvestigative Management and Reporting System
Summary of Accidental Fires by Borough and Community BoardFor the period 1/1/2018 through 12/31/2018

Borough Occupied Building
Vacant Building
SubTotal Structural
Auto and Transit Other Total Accidental Fires
Staten Island
CB
01 78 4 82 5 7 94
02 34 0 34 2 4 40
03 25 1 26 3 6 35
Staten Island CB Total
137 5 142 10 17 169
Grand TotalAll Boroughs
2711 30 2741 119 172 3032
Bureau Of Fire InvestigationInvestigative Management and Reporting System
Summary of Accidental Fires by Borough and Community BoardFor the period 1/1/2018 through 12/31/2018
Borough Occupied Building
Vacant Building
SubTotal Structural
Auto and Transit Other Total Accidental Fires
Borough Not Defined
CB
02 0 0 0 1 0 1
No Borough CB Total
0 0 0 1 0 1
Bureau Of Fire InvestigationInvestigative Management and Reporting System
Summary of Accidental Fires by Borough and Community BoardFor the period 1/1/2018 through 12/31/2018

Bureau of Fire Investigation Investigative Management and Reporting System
2018 Annual Report
on Civilian Fire Fatalities
Veritas ex Cineribus

0
50
100
150
200
250
300
19651968
19711974
19771980
19831986
19891992
19951998
20012004
20072010
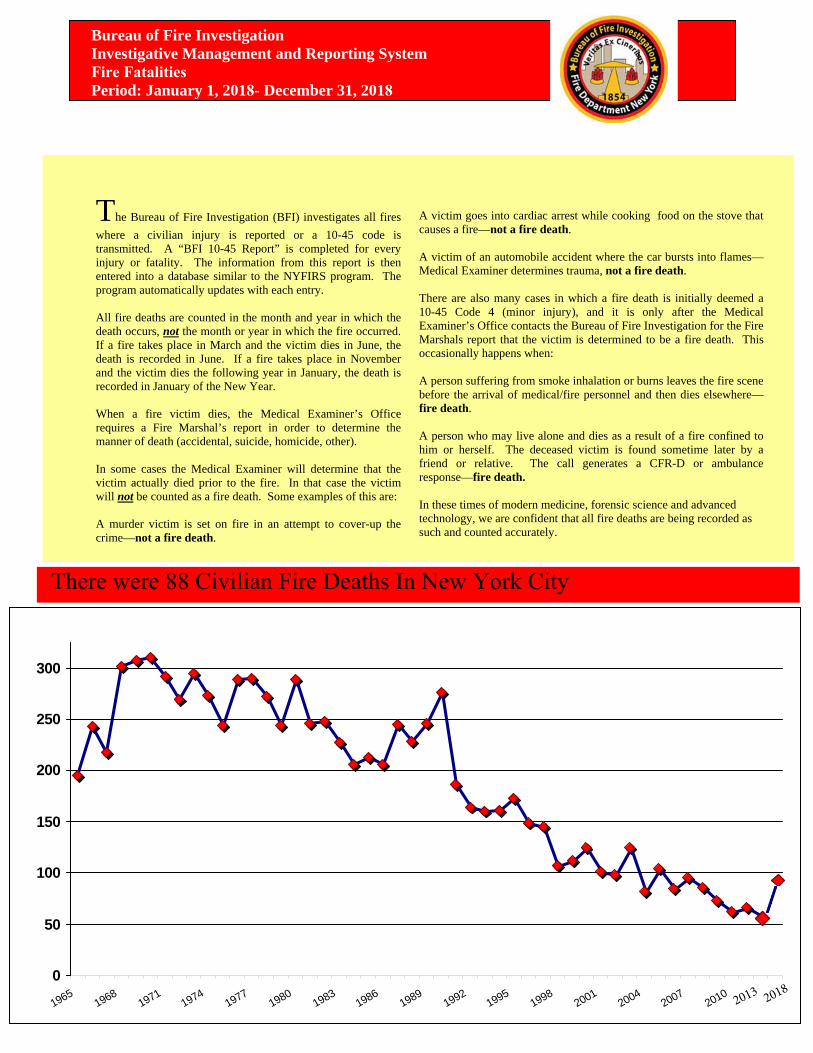
The Bureau of Fire Investigation (BFI) investigates all fireswhere a civilian injury is reported or a 10-45 code is transmitted. A “BFI 10-45 Report” is completed for every injury or fatality. The information from this report is then entered into a database similar to the NYFIRS program. The program automatically updates with each entry.
All fire deaths are counted in the month and year in which the death occurs, not the month or year in which the fire occurred. If a fire takes place in March and the victim dies in June, the death is recorded in June. If a fire takes place in November and the victim dies the following year in January, the death is recorded in January of the New Year.
When a fire victim dies, the Medical Examiner’s Office requires a Fire Marshal’s report in order to determine the manner of death (accidental, suicide, homicide, other).
In some cases the Medical Examiner will determine that the victim actually died prior to the fire. In that case the victim will not be counted as a fire death. Some examples of this are:
A murder victim is set on fire in an attempt to cover-up the crime—not a fire death.
A victim goes into cardiac arrest while cooking food on the stove that causes a fire—not a fire death.
A victim of an automobile accident where the car bursts into flames—Medical Examiner determines trauma, not a fire death.
There are also many cases in which a fire death is initially deemed a 10-45 Code 4 (minor injury), and it is only after the Medical Examiner’s Office contacts the Bureau of Fire Investigation for the Fire Marshals report that the victim is determined to be a fire death. This occasionally happens when:
A person suffering from smoke inhalation or burns leaves the fire scene before the arrival of medical/fire personnel and then dies elsewhere—fire death.
A person who may live alone and dies as a result of a fire confined to him or herself. The deceased victim is found sometime later by a friend or relative. The call generates a CFR-D or ambulance response—fire death.
In these times of modern medicine, forensic science and advanced technology, we are confident that all fire deaths are being recorded as such and counted accurately.
Bureau of Fire Investigation Investigative Management and Reporting System Fire FatalitiesPeriod: January 1, 2018- December 31, 2018
There were 88 Civilian Fire Deaths In New York City
2013 2018
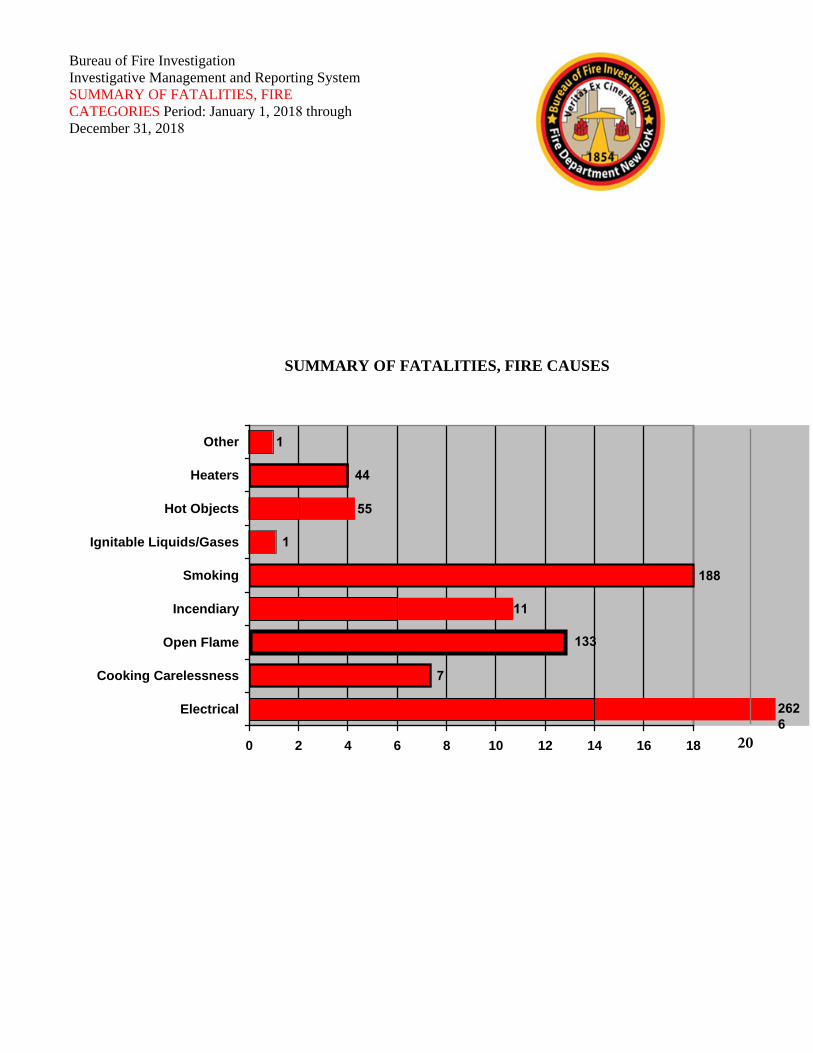
Bureau of Fire Investigation Investigative Management and Reporting System SUMMARY OF FATALITIES, FIRE CATEGORIES Period: January 1, 2018 through December 31, 2018
2626
7
133
11
188
1
55
44
1
0 2 4 6 8 10 12 14 16 18
Electrical
Cooking Carelessness
Open Flame
Incendiary
Smoking
Ignitable Liquids/Gases
Hot Objects
Heaters
Other
SUMMARY OF FATALITIES, FIRE CAUSES
20
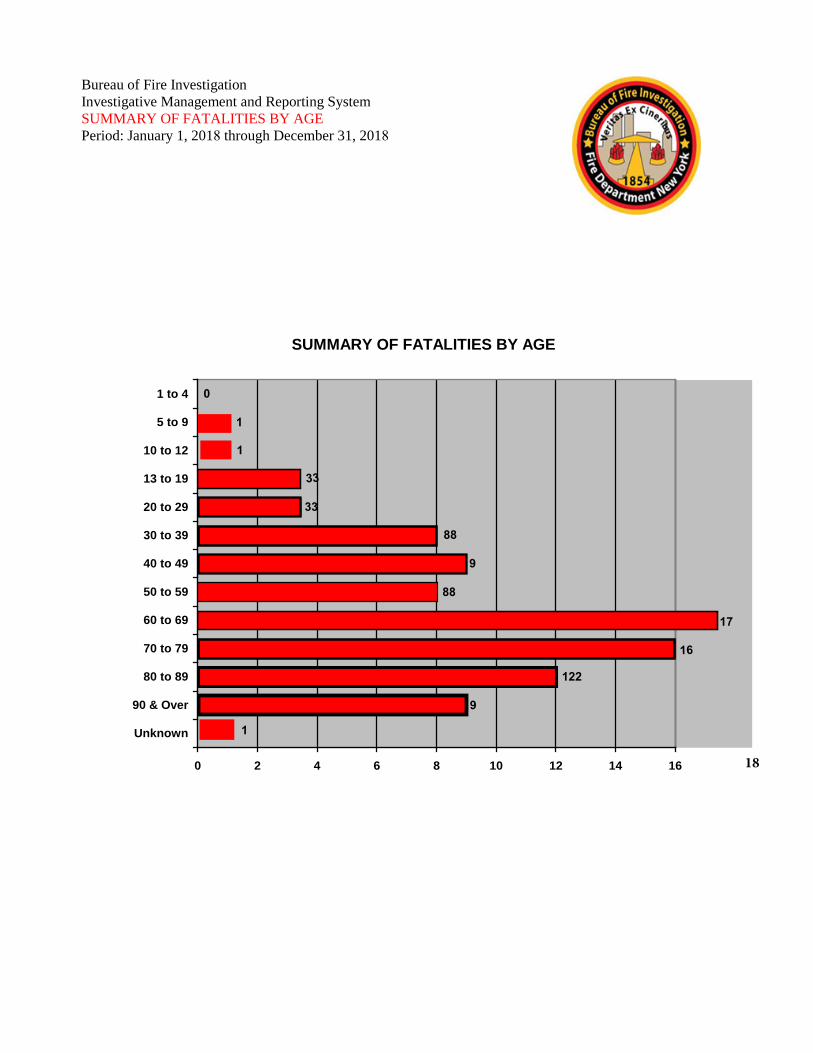
SUMMARY OF FATALITIES BY AGE
1
9
122
16
17
88
9
88
33
33
1
1
0
0 2 4 6 8 10 12 14 16
Unknown
90 & Over
80 to 89
70 to 79
60 to 69
50 to 59
40 to 49
30 to 39
20 to 29
13 to 19
10 to 12
5 to 9
1 to 4
Bureau of Fire Investigation Investigative Management and Reporting System SUMMARY OF FATALITIES BY AGE Period: January 1, 2018 through December 31, 2018
18
11
13
12
8
7
9
10
14
9
12
10
11
4
6
5
3
16 5
18
17
4
2
1
3
7
1
4 5
8
7
15
14
8
9
12
11
13
2
2
6
6
3 1
10
10 2
4
1
3
6
9
11
1
3
2
8
5
7
12
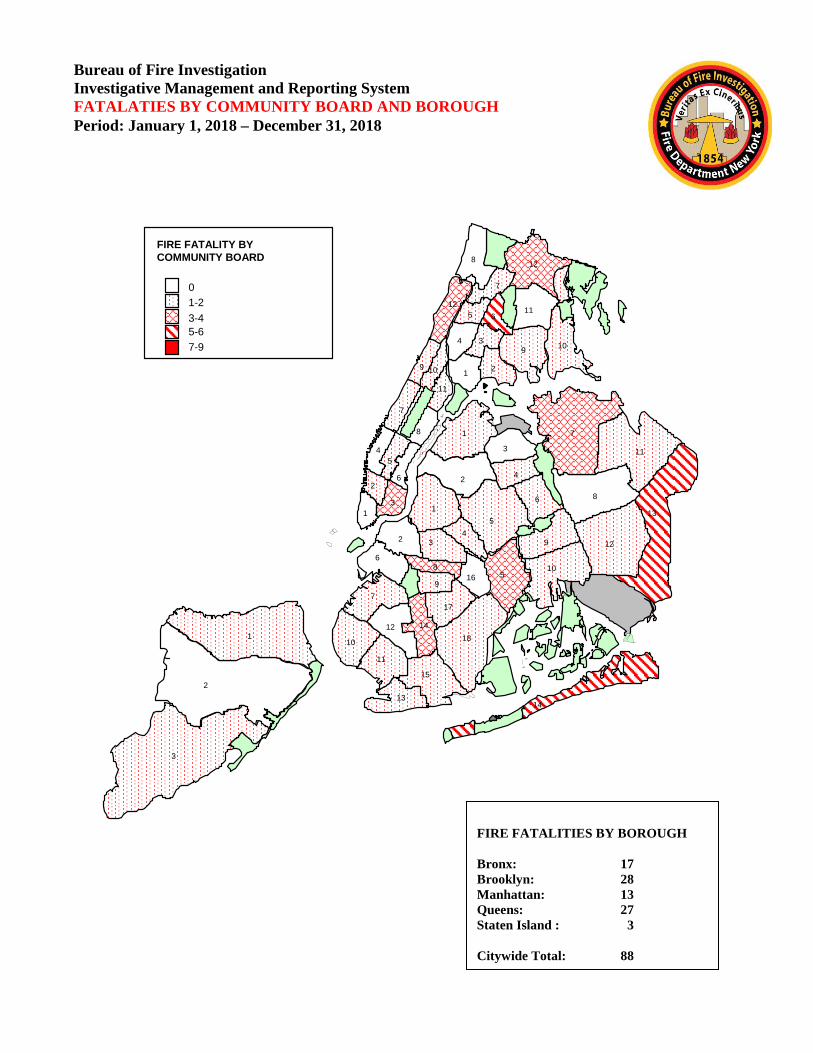
FIRE FATALITY BY COMMUNITY BOARD
0 1-2
3-4 5-6 7-9
Bureau of Fire Investigation Investigative Management and Reporting System FATALATIES BY COMMUNITY BOARD AND BOROUGH Period: January 1, 2018 – December 31, 2018
FIRE FATALITIES BY BOROUGH
Bronx: 17 Brooklyn: 28 Manhattan: 13 Queens: 27 Staten Island : 3
Citywide Total: 88

Bureau Of Fire InvestigationInvestigative Management and Reporting System
Fire Fatalities by BoroughFor the period 1/1/2013 through 12/31/2018
Borough 2013 2014 2015 2016 2017 2018
Bronx
Brooklyn
Manhattan
Queens
Staten Island
Totals:
19 9 3 17 24 17
17 22 30 14 18 28
11 25 6 5 12 13
18 15 14 10 15 27
2 0 6 2 4 3
67 71 59 48 73 88
Calendar Year
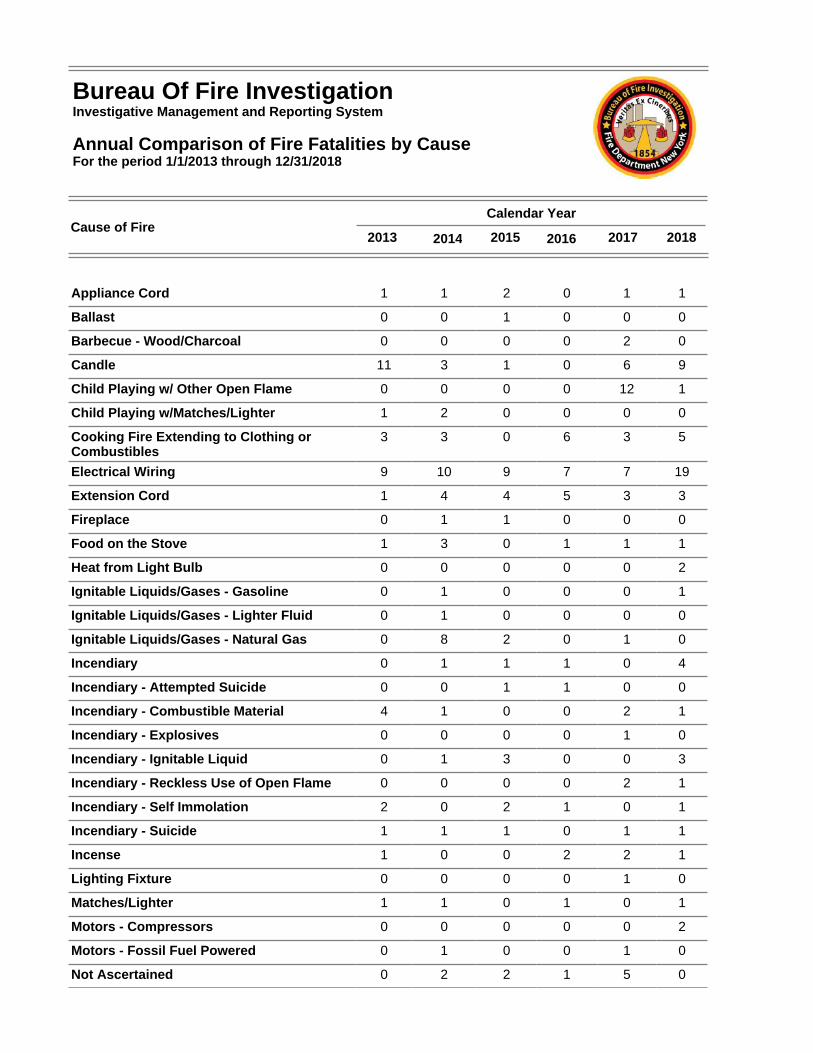
Appliance Cord 1 1 2 0 1 1
Ballast 0 0 1 0 0 0
Barbecue - Wood/Charcoal 0 0 0 0 2 0
Candle 11 3 1 0 6 9
Child Playing w/ Other Open Flame 0 0 0 0 12 1
Child Playing w/Matches/Lighter 1 2 0 0 0 0
Cooking Fire Extending to Clothing or Combustibles
3 3 0 6 3 5
Electrical Wiring 9 10 9 7 7 19
Extension Cord 1 4 4 5 3 3
Fireplace 0 1 1 0 0 0
Food on the Stove 1 3 0 1 1 1
Heat from Light Bulb 0 0 0 0 0 2
Ignitable Liquids/Gases - Gasoline 0 1 0 0 0 1
Ignitable Liquids/Gases - Lighter Fluid 0 1 0 0 0 0
Ignitable Liquids/Gases - Natural Gas 0 8 2 0 1 0
Incendiary 0 1 1 1 0 4
Incendiary - Attempted Suicide 0 0 1 1 0 0
Incendiary - Combustible Material 4 1 0 0 2 1
Incendiary - Explosives 0 0 0 0 1 0
Incendiary - Ignitable Liquid 0 1 3 0 0 3
Incendiary - Reckless Use of Open Flame 0 0 0 0 2 1
Incendiary - Self Immolation 2 0 2 1 0 1
Incendiary - Suicide 1 1 1 0 1 1
Incense 1 0 0 2 2 1
Lighting Fixture 0 0 0 0 1 0
Matches/Lighter 1 1 0 1 0 1
Motors - Compressors 0 0 0 0 0 2
Motors - Fossil Fuel Powered 0 1 0 0 1 0
Not Ascertained 0 2 2 1 5 0
Bureau Of Fire InvestigationInvestigative Management and Reporting System
Annual Comparison of Fire Fatalities by Cause For the period 1/1/2013 through 12/31/2018
Cause of Fire2013 2014 2015 2016 2017 2018
Calendar Year
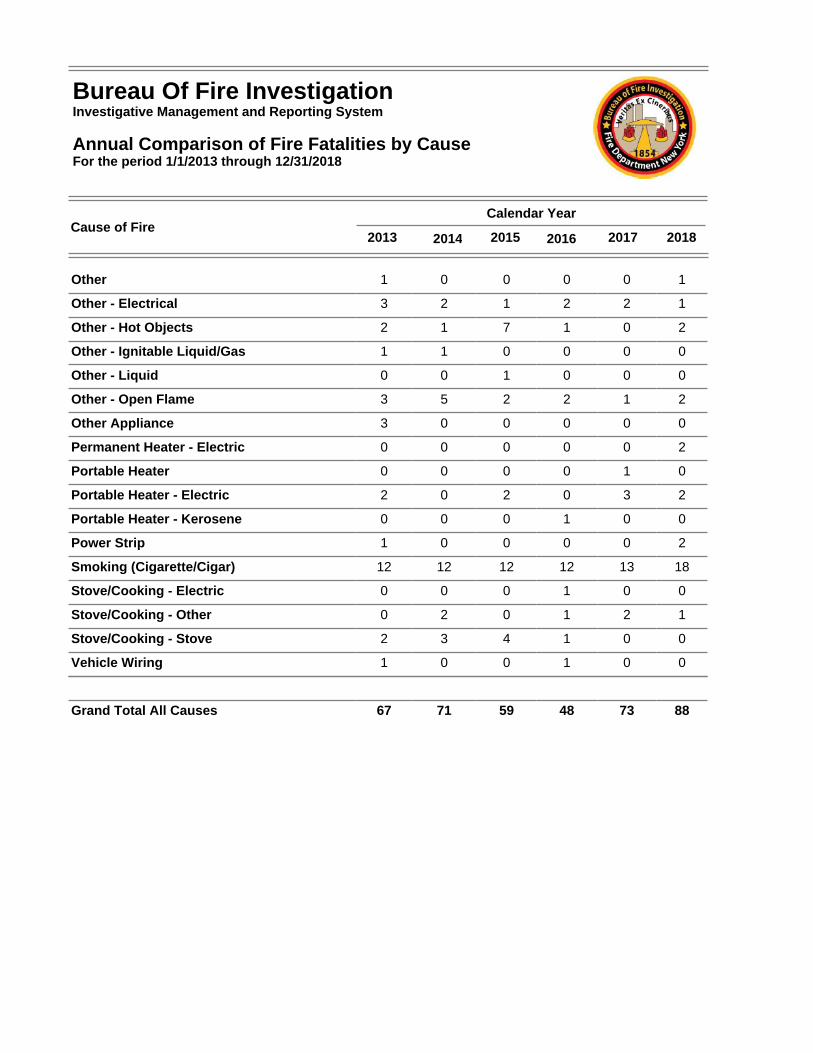
Other 1 0 0 0 0 1
Other - Electrical 3 2 1 2 2 1
Other - Hot Objects 2 1 7 1 0 2
Other - Ignitable Liquid/Gas 1 1 0 0 0 0
Other - Liquid 0 0 1 0 0 0
Other - Open Flame 3 5 2 2 1 2
Other Appliance 3 0 0 0 0 0
Permanent Heater - Electric 0 0 0 0 0 2
Portable Heater 0 0 0 0 1 0
Portable Heater - Electric 2 0 2 0 3 2
Portable Heater - Kerosene 0 0 0 1 0 0
Power Strip 1 0 0 0 0 2
Smoking (Cigarette/Cigar) 12 12 12 12 13 18
Stove/Cooking - Electric 0 0 0 1 0 0
Stove/Cooking - Other 0 2 0 1 2 1
Stove/Cooking - Stove 2 3 4 1 0 0
Vehicle Wiring 1 0 0 1 0 0
Grand Total All Causes 67 71 59 48 73 88
Bureau Of Fire InvestigationInvestigative Management and Reporting System
Annual Comparison of Fire Fatalities by Cause For the period 1/1/2013 through 12/31/2018
Cause of Fire2013 2014 2015 2016 2017 2018
Calendar Year
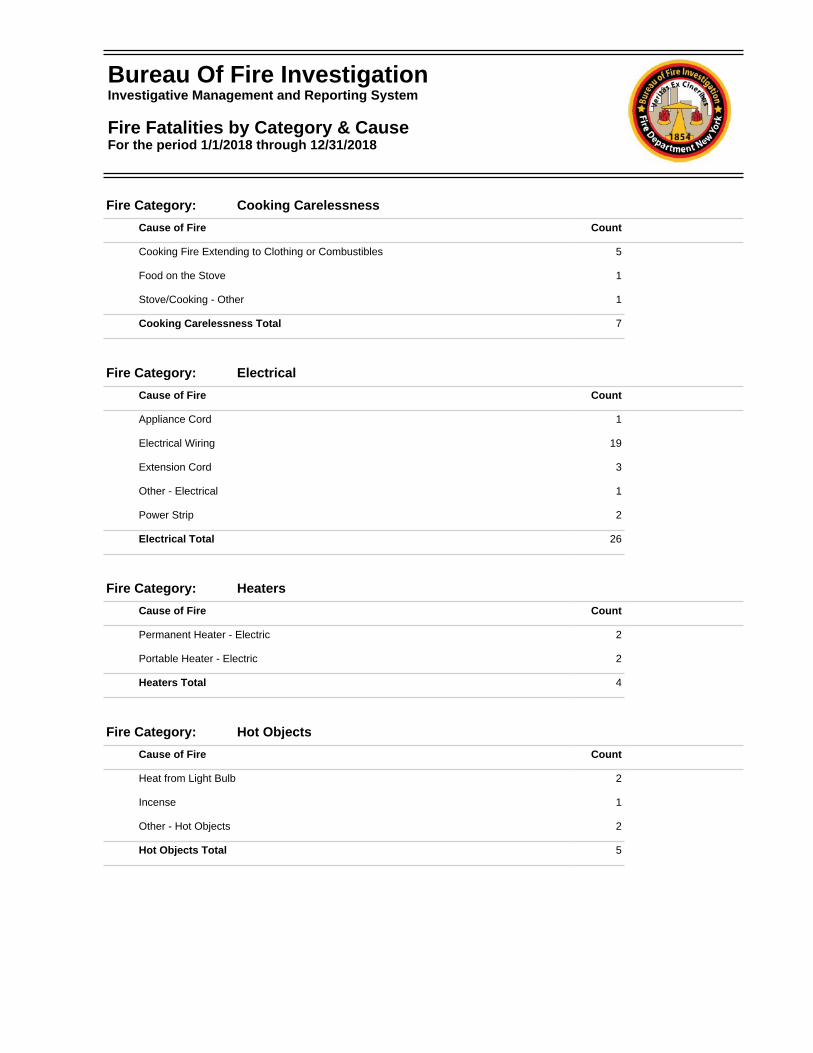
Fire Category: Cooking Carelessness
Cause of Fire Count
Cooking Fire Extending to Clothing or Combustibles 5
Food on the Stove 1
Stove/Cooking - Other 1
Cooking Carelessness Total 7
Fire Category: Electrical
Cause of Fire Count
Appliance Cord 1
Electrical Wiring 19
Extension Cord 3
Other - Electrical 1
Power Strip 2
Electrical Total 26
Fire Category: Heaters
Cause of Fire Count
Permanent Heater - Electric 2
Portable Heater - Electric 2
Heaters Total 4
Fire Category: Hot Objects
Cause of Fire Count
Heat from Light Bulb 2
Incense 1
Other - Hot Objects 2
Hot Objects Total 5
Bureau Of Fire InvestigationInvestigative Management and Reporting System
Fire Fatalities by Category & Cause For the period 1/1/2018 through 12/31/2018
Fire Category: Ignitable
Cause of Fire Count
Ignitable Liquids/Gases - Gasoline 1
Ignitable Total 1
Fire Category: Incendiary
Cause of Fire Count
Incendiary 4
Incendiary - Combustible Material 1
Incendiary - Ignitable Liquid 3
Incendiary - Reckless Use of Open Flame 1
Incendiary - Self Immolation 1
Incendiary - Suicide 1
Incendiary Total 11
Fire Category: Motors
Cause of Fire Count
Motors - Compressors 2
Motors Total 2
Fire Category: Open Flame
Cause of Fire Count
Candle 9
Child Playing w/ Other Open Flame 1
Matches/Lighter 1
Other - Open Flame 2
Open Flame Total 13
Fire Category: Other
Cause of Fire Count
Other 1
Other Total 1
Bureau Of Fire InvestigationInvestigative Management and Reporting System
Fire Fatalities by Category & Cause For the period 1/1/2018 through 12/31/2018
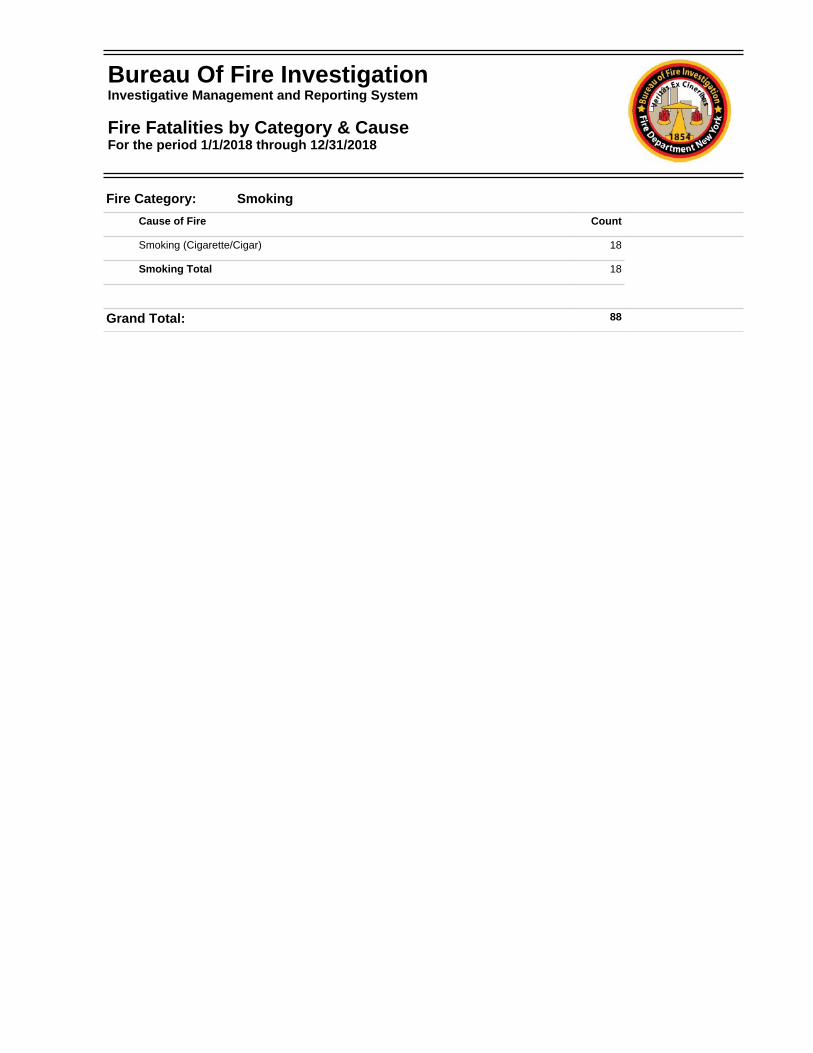
Fire Category: Smoking
Cause of Fire Count
Smoking (Cigarette/Cigar) 18
Smoking Total 18
Grand Total: 88
Bureau Of Fire InvestigationInvestigative Management and Reporting System
Fire Fatalities by Category & Cause For the period 1/1/2018 through 12/31/2018
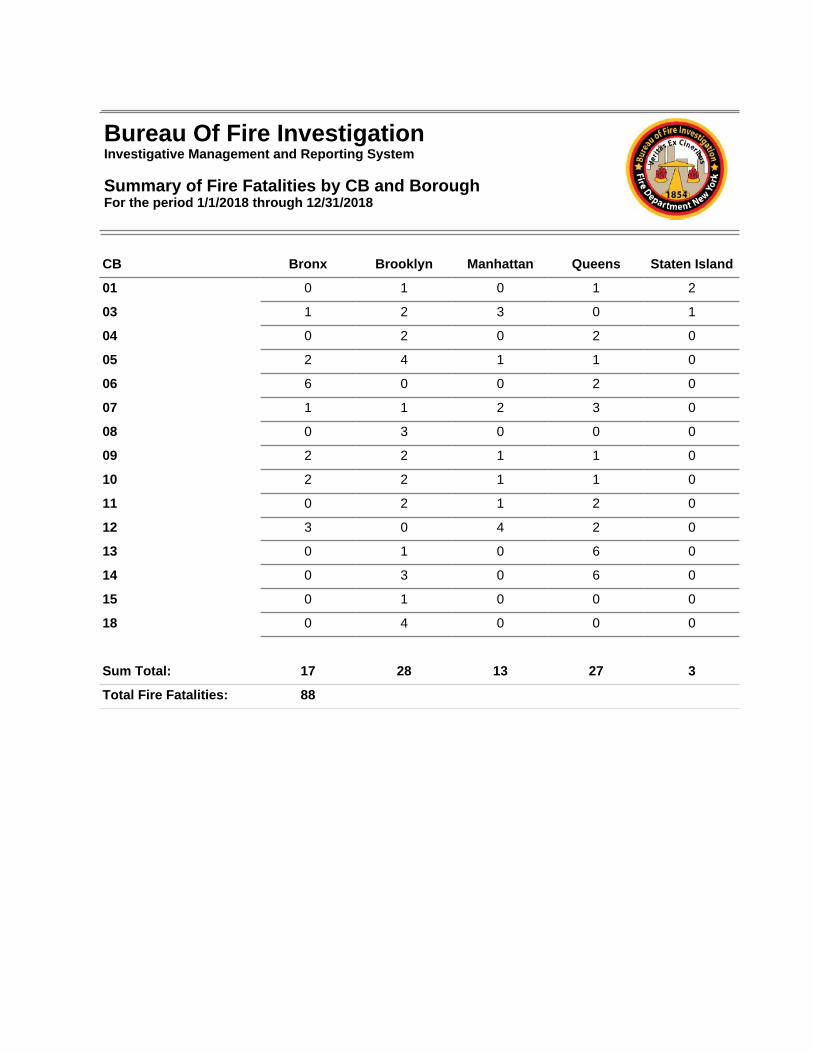
CB Bronx Brooklyn Manhattan Queens Staten Island
01 0 1 0 1 2
03 1 2 3 0 1
04 0 2 0 2 0
05 2 4 1 1 0
06 6 0 0 2 0
07 1 1 2 3 0
08 0 3 0 0 0
09 2 2 1 1 0
10 2 2 1 1 0
11 0 2 1 2 0
12 3 0 4 2 0
13 0 1 0 6 0
14 0 3 0 6 0
15 0 1 0 0 0
18 0 4 0 0 0
Sum Total: 17 28 13 27 3
Total Fire Fatalities: 88
Bureau Of Fire InvestigationInvestigative Management and Reporting System
Summary of Fire Fatalities by CB and Borough For the period 1/1/2018 through 12/31/2018
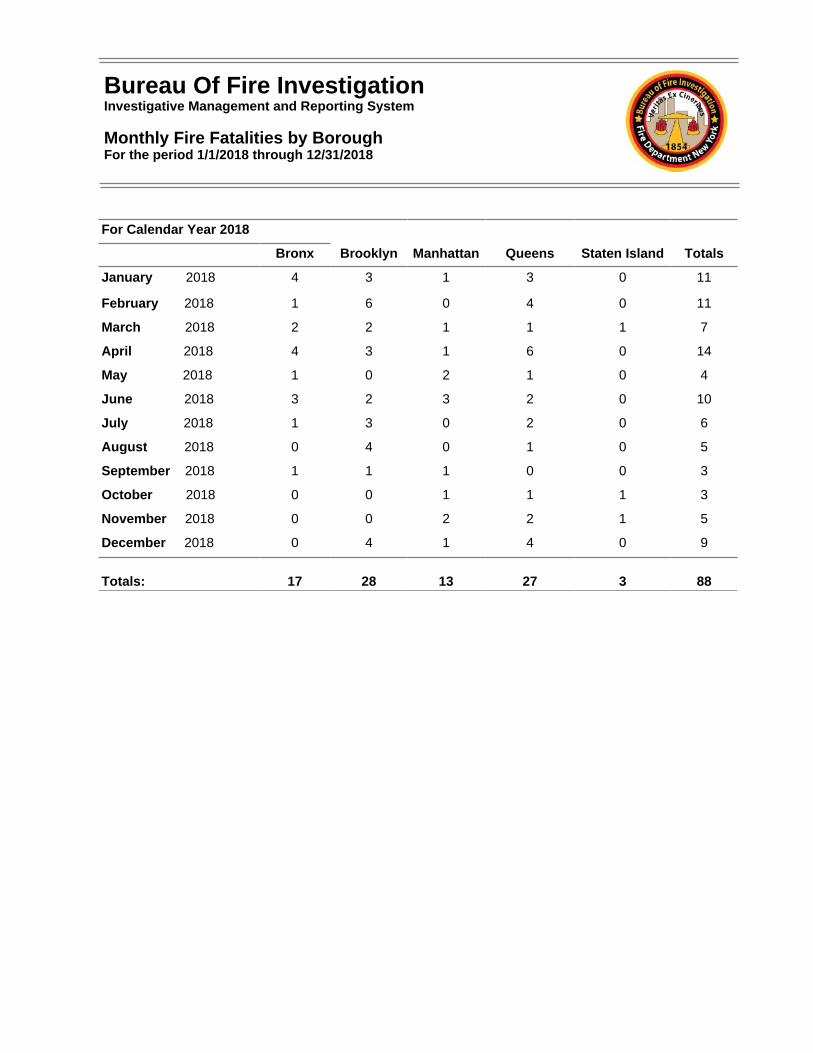
For Calendar Year 2018
Bronx Brooklyn Manhattan Queens Staten Island Totals
January 2018 4 3 1 3 0 11
February 2018 1 6 0 4 0 11
March 2018 2 2 1 1 1 7
April 2018 4 3 1 6 0 14
May 2018 1 0 2 1 0 4
June 2018 3 2 3 2 0 10
July 2018 1 3 0 2 0 6
August 2018 0 4 0 1 0 5
September 2018 1 1 1 0 0 3
October 2018 0 0 1 1 1 3
November 2018 0 0 2 2 1 5
December 2018 0 4 1 4 0 9
Totals: 17 28 13 27 3 88
Bureau Of Fire InvestigationInvestigative Management and Reporting System
Monthly Fire Fatalities by BoroughFor the period 1/1/2018 through 12/31/2018
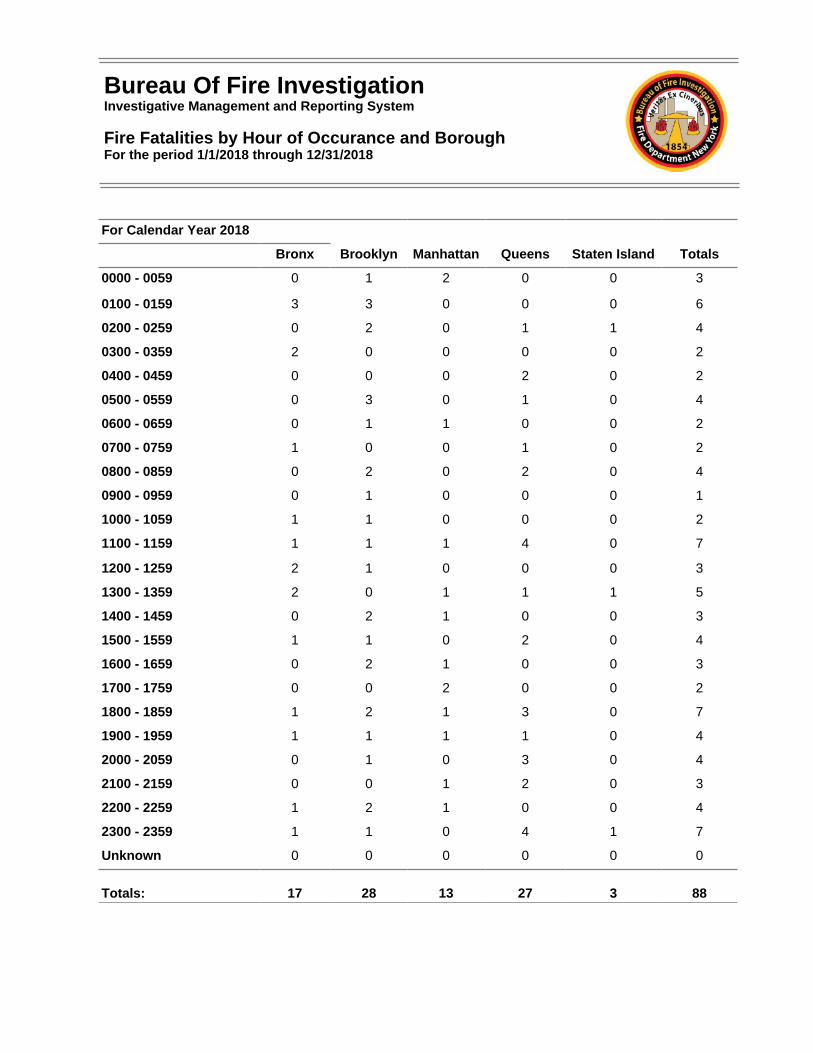
For Calendar Year 2018
Bronx Brooklyn Manhattan Queens Staten Island Totals
0000 - 0059 0 1 2 0 0 3
0100 - 0159 3 3 0 0 0 6
0200 - 0259 0 2 0 1 1 4
0300 - 0359 2 0 0 0 0 2
0400 - 0459 0 0 0 2 0 2
0500 - 0559 0 3 0 1 0 4
0600 - 0659 0 1 1 0 0 2
0700 - 0759 1 0 0 1 0 2
0800 - 0859 0 2 0 2 0 4
0900 - 0959 0 1 0 0 0 1
1000 - 1059 1 1 0 0 0 2
1100 - 1159 1 1 1 4 0 7
1200 - 1259 2 1 0 0 0 3
1300 - 1359 2 0 1 1 1 5
1400 - 1459 0 2 1 0 0 3
1500 - 1559 1 1 0 2 0 4
1600 - 1659 0 2 1 0 0 3
1700 - 1759 0 0 2 0 0 2
1800 - 1859 1 2 1 3 0 7
1900 - 1959 1 1 1 1 0 4
2000 - 2059 0 1 0 3 0 4
2100 - 2159 0 0 1 2 0 3
2200 - 2259 1 2 1 0 0 4
2300 - 2359 1 1 0 4 1 7
Unknown 0 0 0 0 0 0
Totals: 17 28 13 27 3 88
Bureau Of Fire InvestigationInvestigative Management and Reporting System
Fire Fatalities by Hour of Occurance and BoroughFor the period 1/1/2018 through 12/31/2018
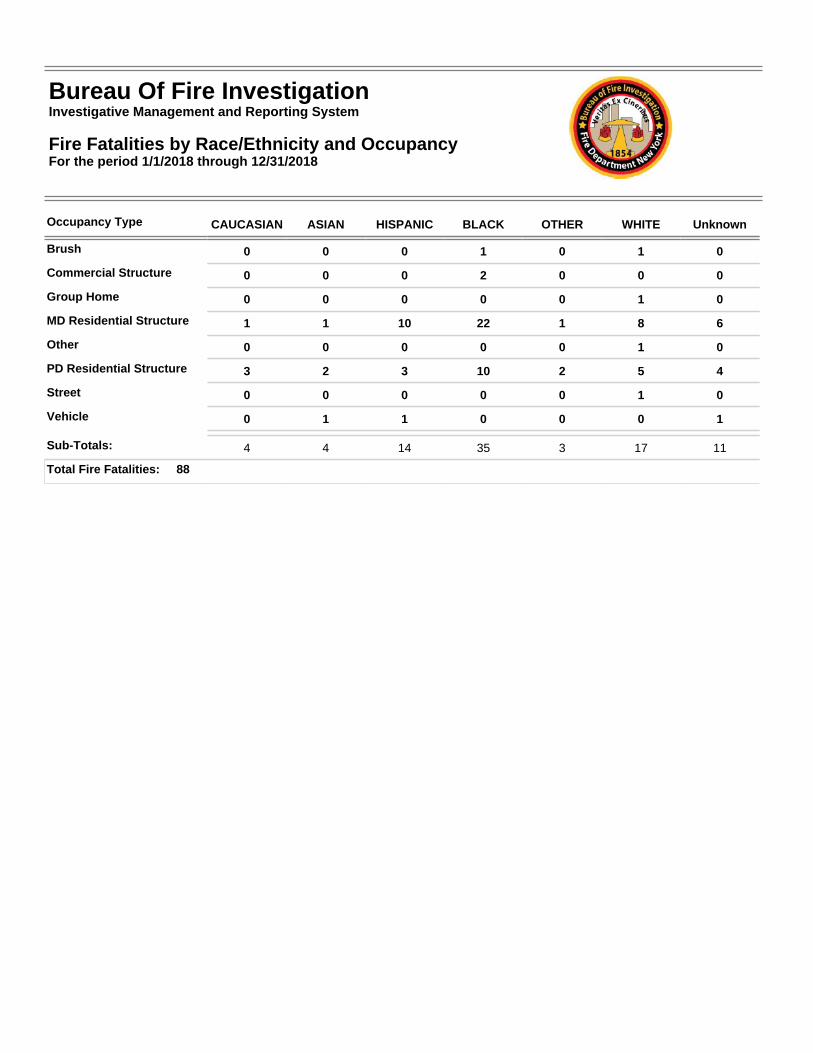
Occupancy Type CAUCASIAN ASIAN HISPANIC BLACK OTHER WHITE Unknown
Brush 0 0 0 1 0 1 0
Commercial Structure 0 0 0 2 0 0 0
Group Home 0 0 0 0 0 1 0
MD Residential Structure 1 1 10 22 1 8 6
Other 0 0 0 0 0 1 0
PD Residential Structure 3 2 3 10 2 5 4
Street 0 0 0 0 0 1 0
Vehicle 0 1 1 0 0 0 1
Sub-Totals: 4 4 14 35 3 17 11
Total Fire Fatalities: 88
Bureau Of Fire InvestigationInvestigative Management and Reporting System
Fire Fatalities by Race/Ethnicity and Occupancy For the period 1/1/2018 through 12/31/2018
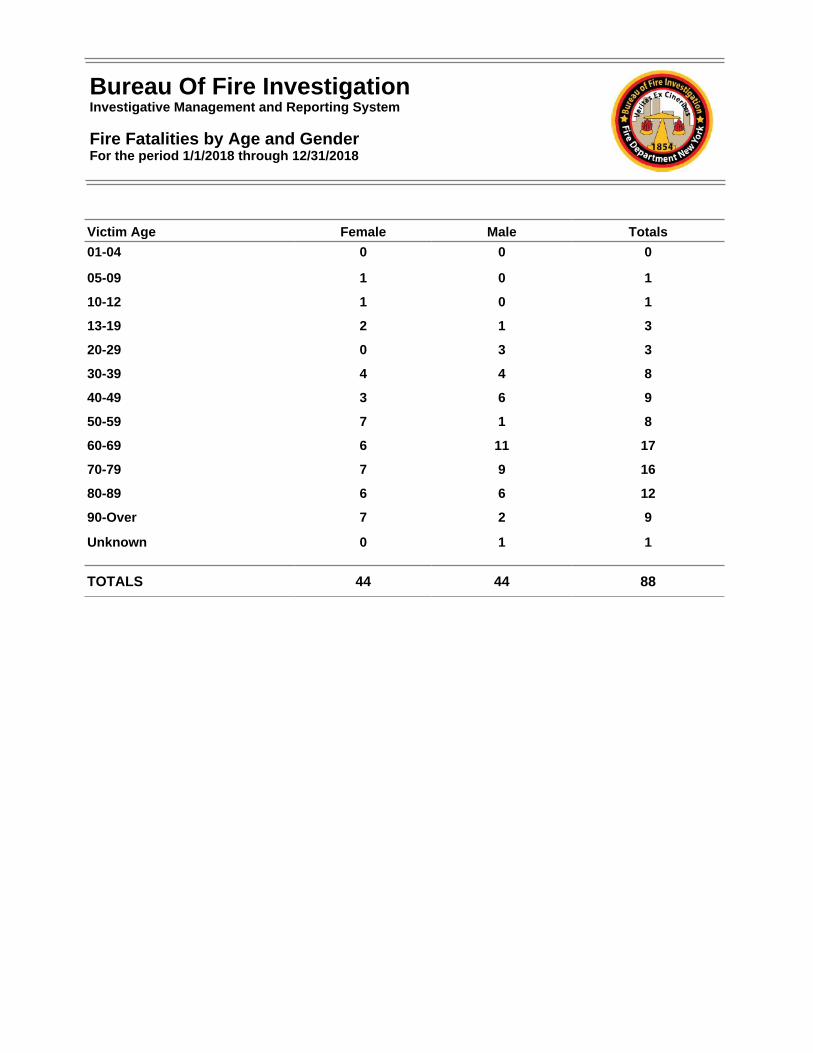
Victim Age Female Male Totals
01-04 0 0 0
05-09 1 0 1
10-12 1 0 1
13-19 2 1 3
20-29 0 3 3
30-39 4 4 8
40-49 3 6 9
50-59 7 1 8
60-69 6 11 17
70-79 7 9 16
80-89 6 6 12
90-Over 7 2 9
Unknown 0 1 1
TOTALS 44 44 88
Bureau Of Fire InvestigationInvestigative Management and Reporting System
Fire Fatalities by Age and GenderFor the period 1/1/2018 through 12/31/2018
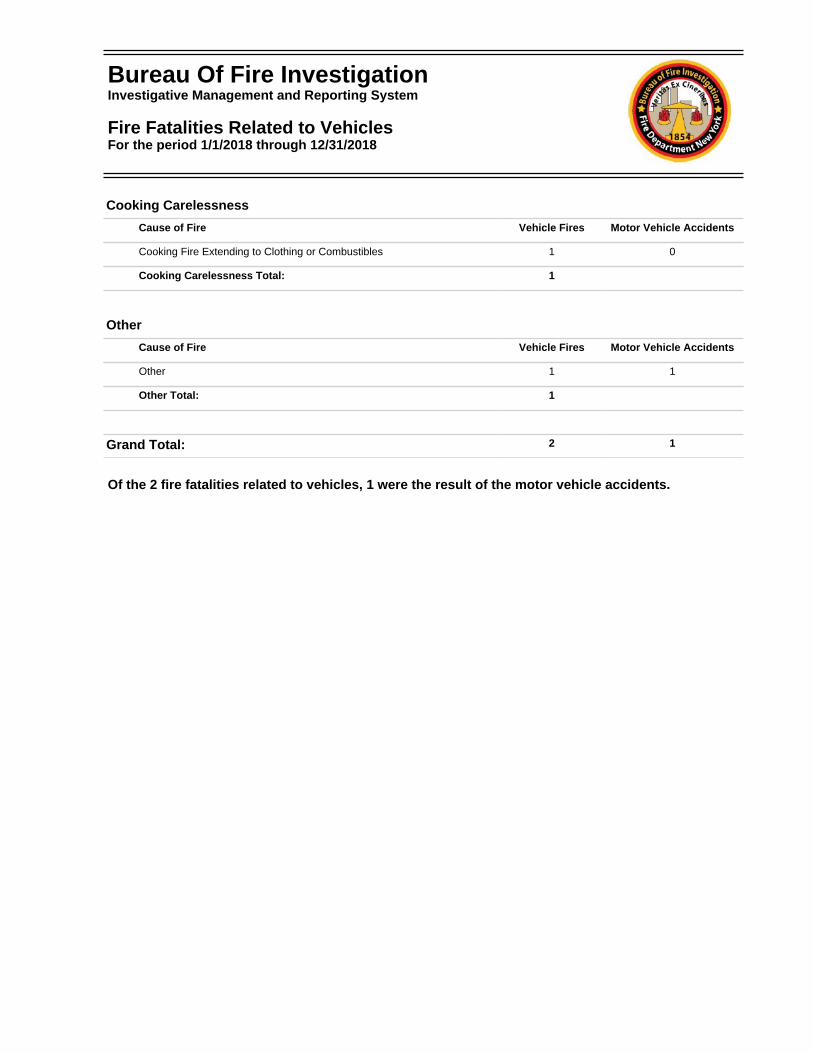
Cooking Carelessness
Cause of Fire Vehicle Fires Motor Vehicle Accidents
Cooking Fire Extending to Clothing or Combustibles 1 0
Cooking Carelessness Total: 1
Other
Cause of Fire Vehicle Fires Motor Vehicle Accidents
Other 1 1
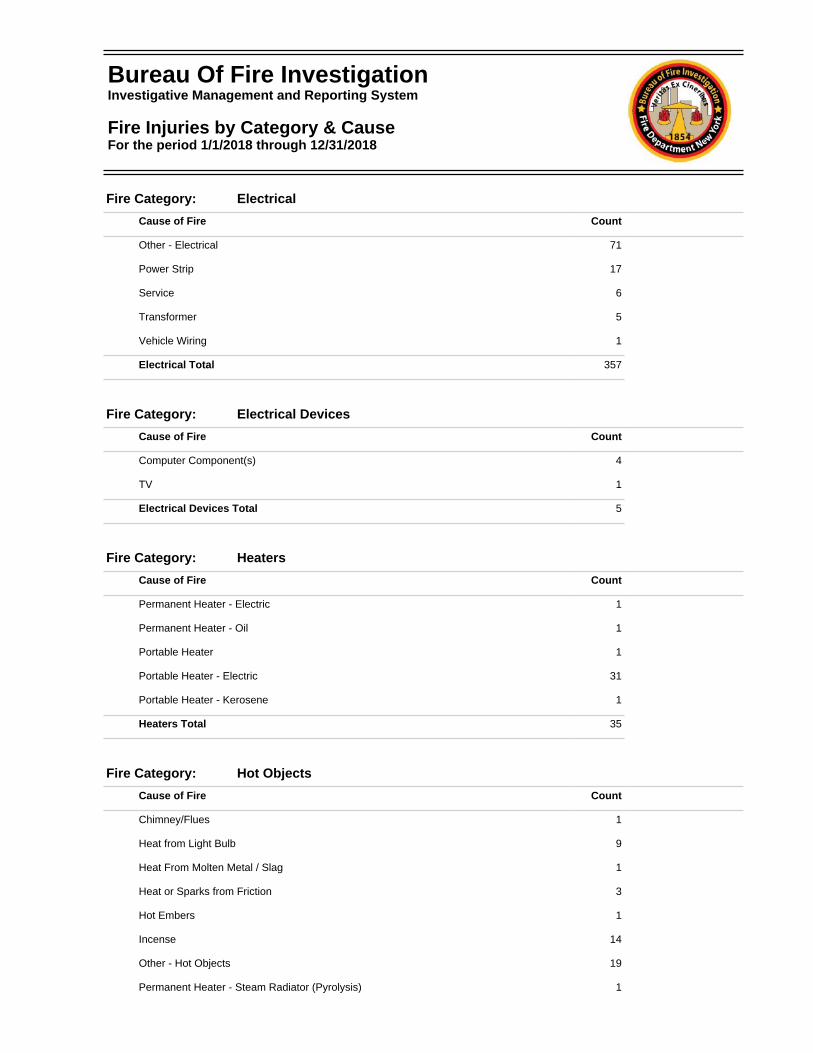
Other Total: 1
Grand Total: 2 1
Of the 2 fire fatalities related to vehicles, 1 were the result of the motor vehicle accidents.
Bureau Of Fire InvestigationInvestigative Management and Reporting System
Fire Fatalities Related to Vehicles For the period 1/1/2018 through 12/31/2018

For Calendar Year 2018 Smoke Detector Present: 38
Working: 24
Not Present: 23
Not Applicable: 6
Present Unknown if operational: 11
Unknown 10
Total 88
For Calendar Year 2017 Smoke Detector Present: 45
Working: 31
Not Present: 18
Not Applicable: 3
Present Unknown if operational: 5
Unknown 2
Total 73
For Calendar Year 2016 Smoke Detector Present: 25
Working: 14
Not Present: 11
Not Applicable: 4
Present Unknown if operational: 3
Unknown 5
Total 48
For Calendar Year 2015 Smoke Detector Present: 19
Working: 11
Not Present: 9
Not Applicable: 1
Present Unknown if operational: 21
Unknown 9
Total 59
For Calendar Year 2014 Smoke Detector Present: 24
Working: 18
Not Present: 16
Not Applicable: 3
Present Unknown if operational: 11
Unknown 17
Total 71
Bureau Of Fire InvestigationInvestigative Management and Reporting System
Smoke Detectors and Civilian Fire FatalitiesFor the period 1/1/2014 through 12/31/2018
Bureau of Fire Investigation Investigative Management and Reporting System
2018Annual Report
on Civilian Fire Injuries
Veritas ex Cineribus

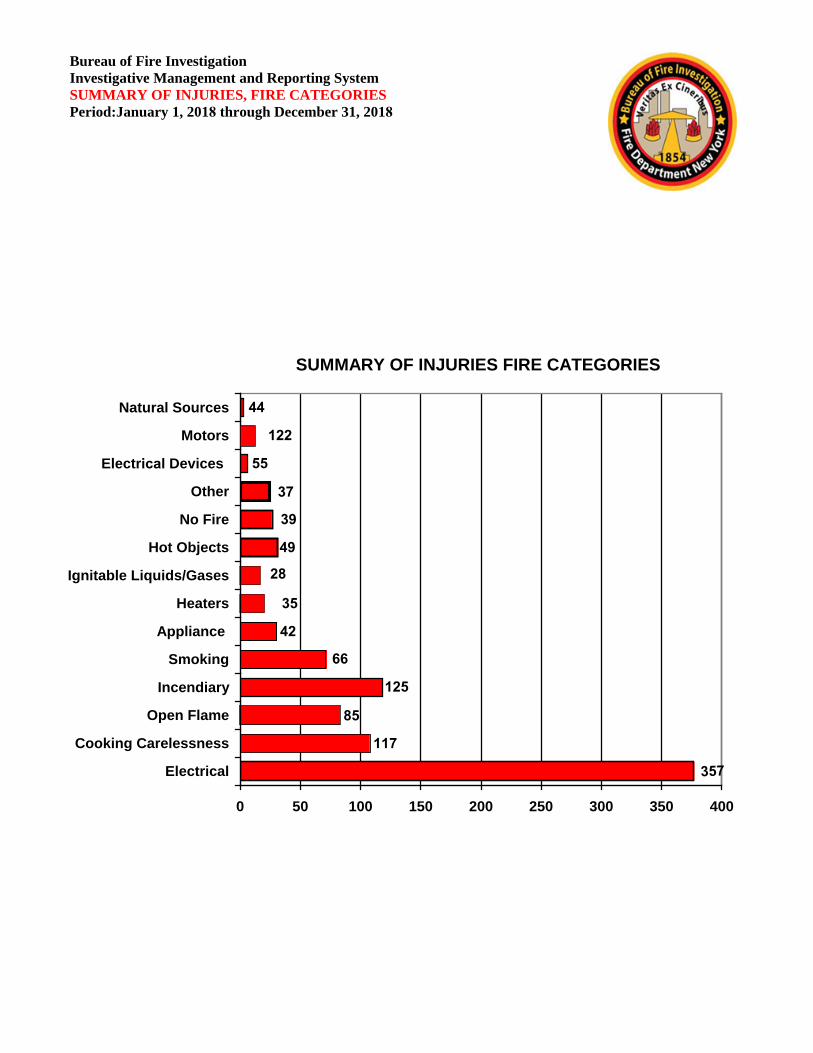
Bureau of Fire Investigation Investigative Management and Reporting System SUMMARY OF INJURIES, FIRE CATEGORIES Period:January 1, 2018 through December 31, 2018
SUMMARY OF INJURIES FIRE CATEGORIES
357
117
85
125
66
42
35
28
49
39
37
55
122
44
0 50 100 150 200 250 300 350 400
Electrical
Cooking Carelessness
Open Flame
Incendiary
Smoking
Appliance
Heaters
Ignitable Liquids/Gases
Hot Objects
No Fire
Other
Electrical Devices
Motors
Natural Sources
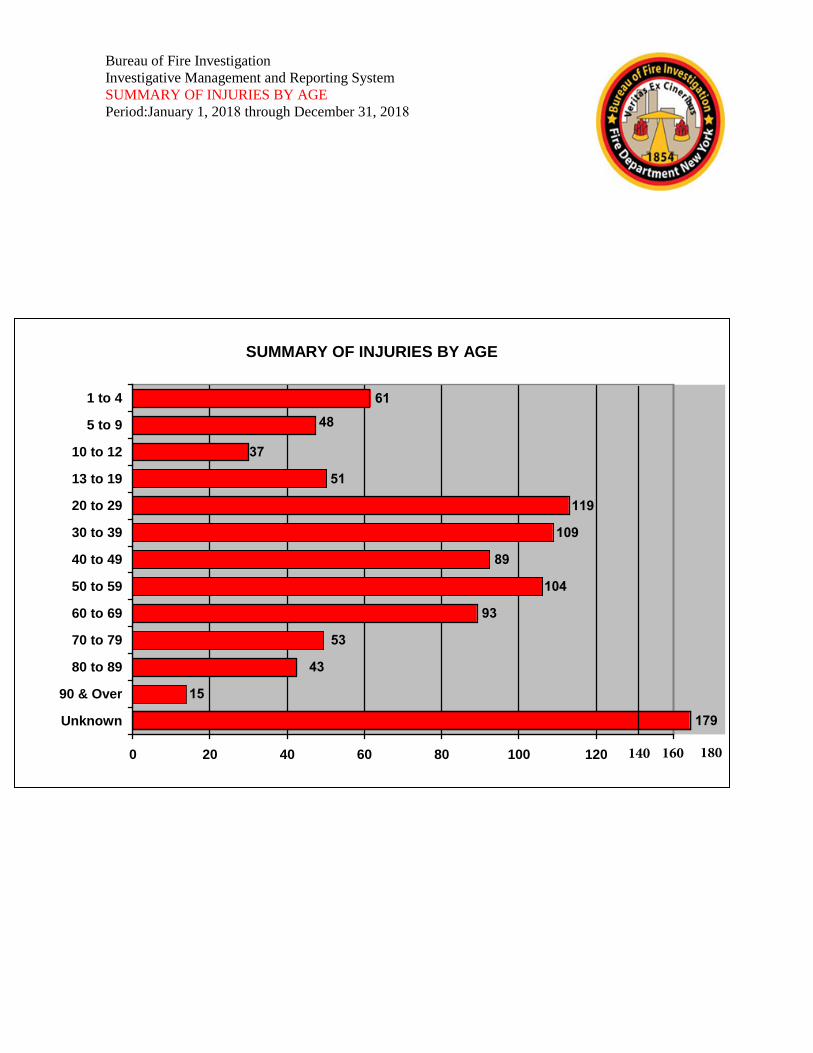
Bureau of Fire Investigation Investigative Management and Reporting System SUMMARY OF INJURIES BY AGE Period:January 1, 2018 through December 31, 2018
SUMMARY OF INJURIES BY AGE
179
15
43
53
93
104
89
109
119
51
37
48
61
0 20 40 60 80 100 120 160
Unknown
90 & Over
80 to 89
70 to 79
60 to 69
50 to 59
40 to 49
30 to 39
20 to 29
13 to 19
10 to 12
5 to 9
1 to 4
140 180
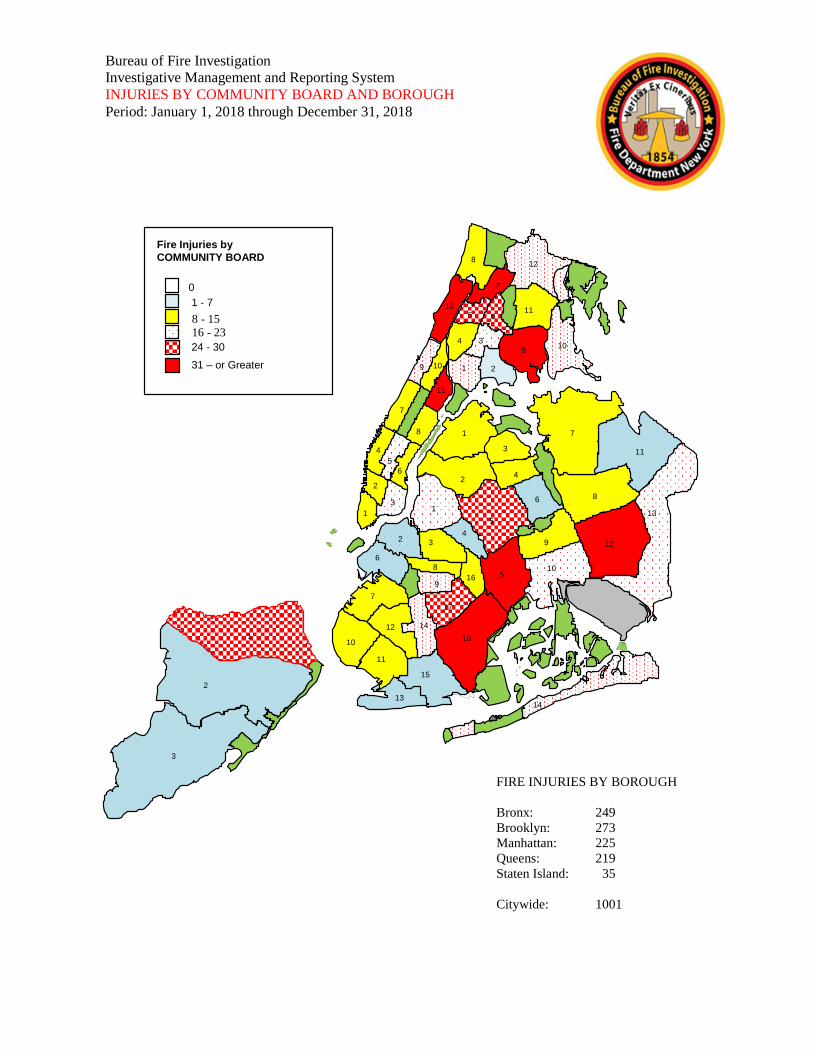
FIRE INJURIES BY BOROUGH
Bronx: 249 Brooklyn: 273 Manhattan: 225 Queens: 219 Staten Island: 35
Citywide: 1001
Bureau of Fire Investigation Investigative Management and Reporting System INJURIES BY COMMUNITY BOARD AND BOROUGH Period: January 1, 2018 through December 31, 2018
11
13
12
8
7
9
10
14
9
12
10
11
4
6
5
3
16 5
18
17
4
2
1
3
7
1
4 5
8
7
15
14
8
9
12
11
13
2
2
6
6
3 1
10
10 2
4
1
3
6
9
11
1
3
2
8
5
7
12
Fire Injuries by COMMUNITY BOARD
0 1 - 7
8 - 15 16 - 23 24 - 30
31 – or Greater
Bureau Of Fire InvestigationInvestigative Management and Reporting System
Fire Injuries by BoroughFor the period 1/1/2013 through 12/31/2018
Borough 2013 2014 2015 2016 2017 2018
Bronx
Brooklyn
Manhattan
Queens
Staten Island
Totals:
234 180 252 211 264 249
278 351 363 282 317 273
204 177 175 205 202 225
255 202 229 257 238 219
46 67 62 46 53 35
1017 977 1081 1001 1074 1001
Calendar Year
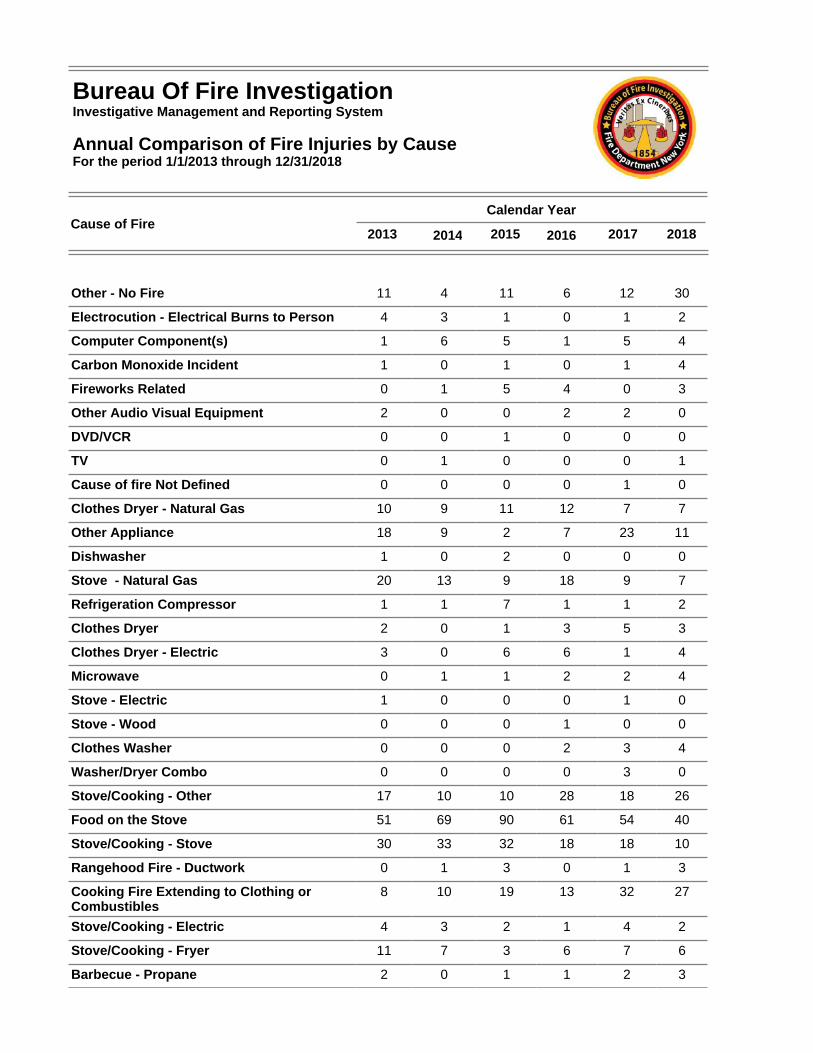
Other - No Fire 11 4 11 6 12 30
Electrocution - Electrical Burns to Person 4 3 1 0 1 2
Computer Component(s) 1 6 5 1 5 4
Carbon Monoxide Incident 1 0 1 0 1 4
Fireworks Related 0 1 5 4 0 3
Other Audio Visual Equipment 2 0 0 2 2 0
DVD/VCR 0 0 1 0 0 0
TV 0 1 0 0 0 1
Cause of fire Not Defined 0 0 0 0 1 0
Clothes Dryer - Natural Gas 10 9 11 12 7 7
Other Appliance 18 9 2 7 23 11
Dishwasher 1 0 2 0 0 0
Stove - Natural Gas 20 13 9 18 9 7
Refrigeration Compressor 1 1 7 1 1 2
Clothes Dryer 2 0 1 3 5 3
Clothes Dryer - Electric 3 0 6 6 1 4
Microwave 0 1 1 2 2 4
Stove - Electric 1 0 0 0 1 0
Stove - Wood 0 0 0 1 0 0
Clothes Washer 0 0 0 2 3 4
Washer/Dryer Combo 0 0 0 0 3 0
Stove/Cooking - Other 17 10 10 28 18 26
Food on the Stove 51 69 90 61 54 40
Stove/Cooking - Stove 30 33 32 18 18 10
Rangehood Fire - Ductwork 0 1 3 0 1 3
Cooking Fire Extending to Clothing or Combustibles
8 10 19 13 32 27
Stove/Cooking - Electric 4 3 2 1 4 2
Stove/Cooking - Fryer 11 7 3 6 7 6
Barbecue - Propane 2 0 1 1 2 3
Bureau Of Fire InvestigationInvestigative Management and Reporting System
Annual Comparison of Fire Injuries by CauseFor the period 1/1/2013 through 12/31/2018
Cause of Fire2013 2014 2015 2016 2017 2018
Calendar Year
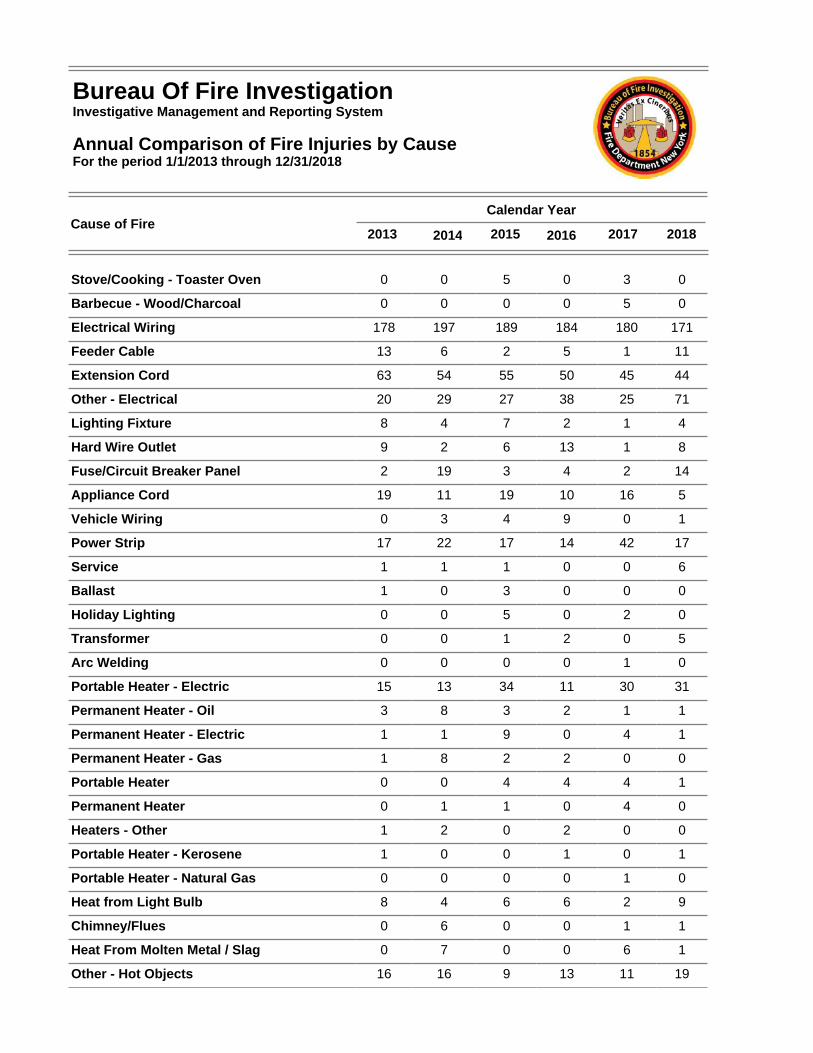
Stove/Cooking - Toaster Oven 0 0 5 0 3 0
Barbecue - Wood/Charcoal 0 0 0 0 5 0
Electrical Wiring 178 197 189 184 180 171
Feeder Cable 13 6 2 5 1 11
Extension Cord 63 54 55 50 45 44
Other - Electrical 20 29 27 38 25 71
Lighting Fixture 8 4 7 2 1 4
Hard Wire Outlet 9 2 6 13 1 8
Fuse/Circuit Breaker Panel 2 19 3 4 2 14
Appliance Cord 19 11 19 10 16 5
Vehicle Wiring 0 3 4 9 0 1
Power Strip 17 22 17 14 42 17
Service 1 1 1 0 0 6
Ballast 1 0 3 0 0 0
Holiday Lighting 0 0 5 0 2 0
Transformer 0 0 1 2 0 5
Arc Welding 0 0 0 0 1 0
Portable Heater - Electric 15 13 34 11 30 31
Permanent Heater - Oil 3 8 3 2 1 1
Permanent Heater - Electric 1 1 9 0 4 1
Permanent Heater - Gas 1 8 2 2 0 0
Portable Heater 0 0 4 4 4 1
Permanent Heater 0 1 1 0 4 0
Heaters - Other 1 2 0 2 0 0
Portable Heater - Kerosene 1 0 0 1 0 1
Portable Heater - Natural Gas 0 0 0 0 1 0
Heat from Light Bulb 8 4 6 6 2 9
Chimney/Flues 0 6 0 0 1 1
Heat From Molten Metal / Slag 0 7 0 0 6 1
Other - Hot Objects 16 16 9 13 11 19
Bureau Of Fire InvestigationInvestigative Management and Reporting System
Annual Comparison of Fire Injuries by CauseFor the period 1/1/2013 through 12/31/2018
Cause of Fire2013 2014 2015 2016 2017 2018
Calendar Year
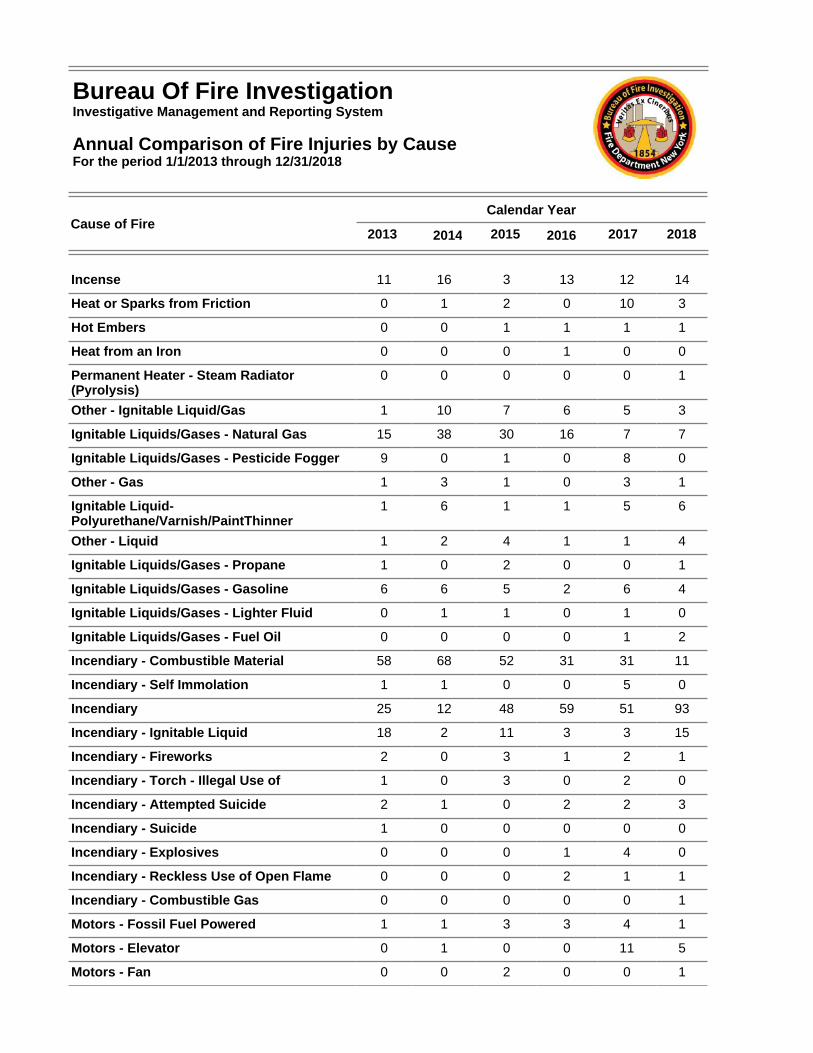
Incense 11 16 3 13 12 14
Heat or Sparks from Friction 0 1 2 0 10 3
Hot Embers 0 0 1 1 1 1
Heat from an Iron 0 0 0 1 0 0
Permanent Heater - Steam Radiator (Pyrolysis)
0 0 0 0 0 1
Other - Ignitable Liquid/Gas 1 10 7 6 5 3
Ignitable Liquids/Gases - Natural Gas 15 38 30 16 7 7
Ignitable Liquids/Gases - Pesticide Fogger 9 0 1 0 8 0
Other - Gas 1 3 1 0 3 1
Ignitable Liquid-Polyurethane/Varnish/PaintThinner
1 6 1 1 5 6
Other - Liquid 1 2 4 1 1 4
Ignitable Liquids/Gases - Propane 1 0 2 0 0 1
Ignitable Liquids/Gases - Gasoline 6 6 5 2 6 4
Ignitable Liquids/Gases - Lighter Fluid 0 1 1 0 1 0
Ignitable Liquids/Gases - Fuel Oil 0 0 0 0 1 2
Incendiary - Combustible Material 58 68 52 31 31 11
Incendiary - Self Immolation 1 1 0 0 5 0
Incendiary 25 12 48 59 51 93
Incendiary - Ignitable Liquid 18 2 11 3 3 15
Incendiary - Fireworks 2 0 3 1 2 1
Incendiary - Torch - Illegal Use of 1 0 3 0 2 0
Incendiary - Attempted Suicide 2 1 0 2 2 3
Incendiary - Suicide 1 0 0 0 0 0
Incendiary - Explosives 0 0 0 1 4 0
Incendiary - Reckless Use of Open Flame 0 0 0 2 1 1
Incendiary - Combustible Gas 0 0 0 0 0 1
Motors - Fossil Fuel Powered 1 1 3 3 4 1
Motors - Elevator 0 1 0 0 11 5
Motors - Fan 0 0 2 0 0 1
Bureau Of Fire InvestigationInvestigative Management and Reporting System
Annual Comparison of Fire Injuries by CauseFor the period 1/1/2013 through 12/31/2018
Cause of Fire2013 2014 2015 2016 2017 2018
Calendar Year
Motors - Electric 0 1 0 5 1 5
Other Motor 1 0 1 1 1 0
Motors - Compressors 0 0 0 0 2 0
Spontaneous Combustion 0 1 3 1 5 4
Candle 112 67 64 65 108 57
Child Playing w/Matches/Lighter 49 21 31 29 28 9
Matches/Lighter 12 2 22 29 5 7
Torch - Legal Use of 9 3 6 8 6 2
Other - Open Flame 16 13 21 14 10 5
Aerosol Can 9 3 9 6 3 1
Fireplace 0 2 5 0 0 1
Child Playing w/ Other Open Flame 7 12 2 1 15 3
Exothermic Chemical Reaction 1 0 3 3 1 2
Other 2 1 5 21 8 3
Not Ascertained 0 2 2 2 1 27
SIU Investigation 0 0 0 1 3 1
Juvenile Firesetter Intervention 0 0 0 1 0 2
Under Investigation 0 0 0 0 1 2
Smoking (Cigarette/Cigar) 69 85 92 106 99 66
Grand Total All Causes 1017 977 1081 1001 1074 1001
Bureau Of Fire InvestigationInvestigative Management and Reporting System
Annual Comparison of Fire Injuries by CauseFor the period 1/1/2013 through 12/31/2018
Cause of Fire2013 2014 2015 2016 2017 2018
Calendar Year

Fire Category: Appliances
Cause of Fire Count
Clothes Dryer 3
Clothes Dryer - Electric 4
Clothes Dryer - Natural Gas 7
Clothes Washer 4
Microwave 4
Other Appliance 11
Refrigeration Compressor 2
Stove - Natural Gas 7
Appliances Total 42
Fire Category: Cooking Carelessness
Cause of Fire Count
Barbecue - Propane 3
Cooking Fire Extending to Clothing or Combustibles 27
Food on the Stove 40
Rangehood Fire - Ductwork 3
Stove/Cooking - Electric 2
Stove/Cooking - Fryer 6
Stove/Cooking - Other 26
Stove/Cooking - Stove 10
Cooking Carelessness Total 117
Fire Category: Electrical
Cause of Fire Count
Appliance Cord 5
Electrical Wiring 171
Extension Cord 44
Feeder Cable 11
Fuse/Circuit Breaker Panel 14
Hard Wire Outlet 8
Lighting Fixture 4
Bureau Of Fire InvestigationInvestigative Management and Reporting System
Fire Injuries by Category & CauseFor the period 1/1/2018 through 12/31/2018
Fire Category: Electrical
Cause of Fire Count
Other - Electrical 71
Power Strip 17
Service 6
Transformer 5
Vehicle Wiring 1
Electrical Total 357
Fire Category: Electrical Devices
Cause of Fire Count
Computer Component(s) 4
TV 1
Electrical Devices Total 5
Fire Category: Heaters
Cause of Fire Count
Permanent Heater - Electric 1
Permanent Heater - Oil 1
Portable Heater 1
Portable Heater - Electric 31
Portable Heater - Kerosene 1
Heaters Total 35
Fire Category: Hot Objects
Cause of Fire Count
Chimney/Flues 1
Heat from Light Bulb 9
Heat From Molten Metal / Slag 1
Heat or Sparks from Friction 3
Hot Embers 1
Incense 14
Other - Hot Objects 19
Permanent Heater - Steam Radiator (Pyrolysis) 1
Bureau Of Fire InvestigationInvestigative Management and Reporting System
Fire Injuries by Category & CauseFor the period 1/1/2018 through 12/31/2018
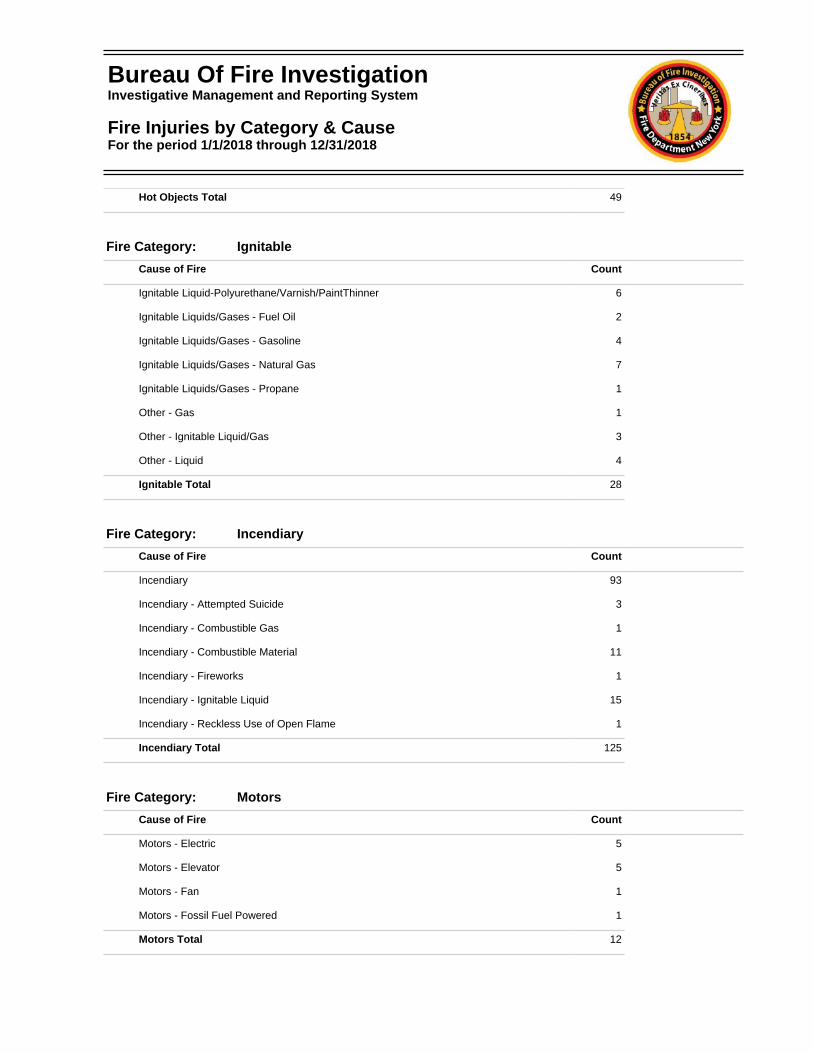
Hot Objects Total 49
Fire Category: Ignitable
Cause of Fire Count
Ignitable Liquid-Polyurethane/Varnish/PaintThinner 6
Ignitable Liquids/Gases - Fuel Oil 2
Ignitable Liquids/Gases - Gasoline 4
Ignitable Liquids/Gases - Natural Gas 7
Ignitable Liquids/Gases - Propane 1
Other - Gas 1
Other - Ignitable Liquid/Gas 3
Other - Liquid 4
Ignitable Total 28
Fire Category: Incendiary
Cause of Fire Count
Incendiary 93
Incendiary - Attempted Suicide 3
Incendiary - Combustible Gas 1
Incendiary - Combustible Material 11
Incendiary - Fireworks 1
Incendiary - Ignitable Liquid 15
Incendiary - Reckless Use of Open Flame 1
Incendiary Total 125
Fire Category: Motors
Cause of Fire Count
Motors - Electric 5
Motors - Elevator 5
Motors - Fan 1
Motors - Fossil Fuel Powered 1
Motors Total 12
Bureau Of Fire InvestigationInvestigative Management and Reporting System
Fire Injuries by Category & CauseFor the period 1/1/2018 through 12/31/2018
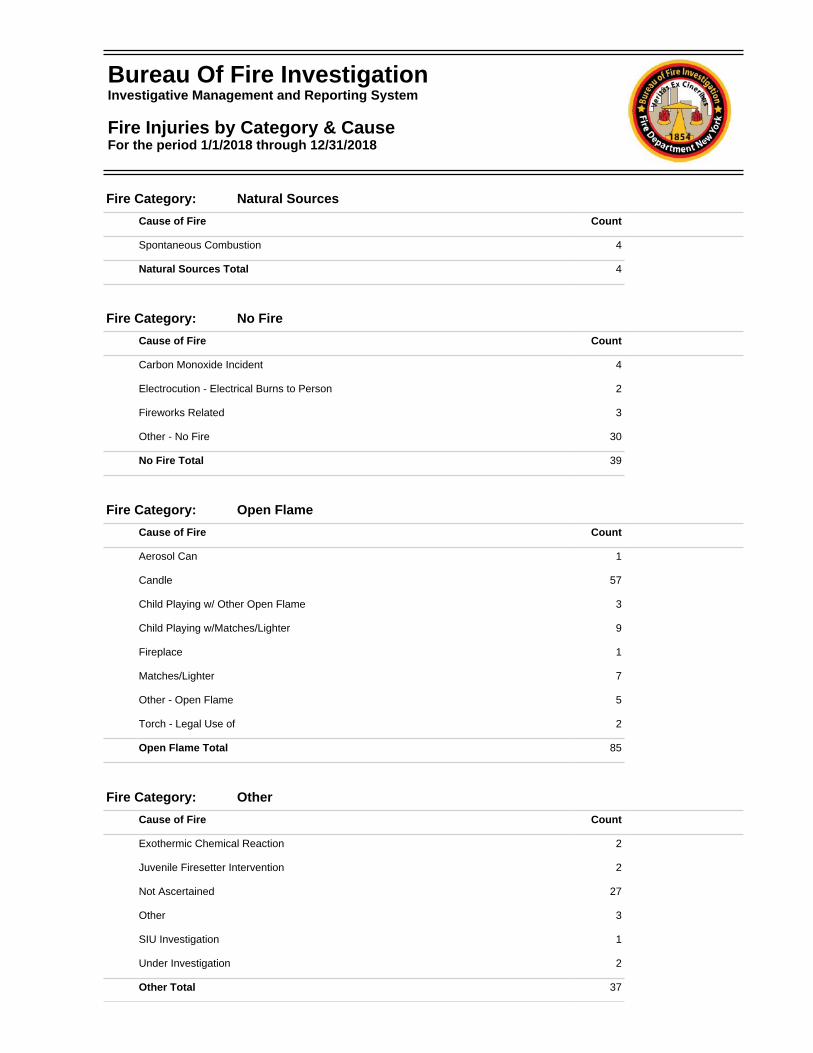
Fire Category: Natural Sources
Cause of Fire Count
Spontaneous Combustion 4
Natural Sources Total 4
Fire Category: No Fire
Cause of Fire Count
Carbon Monoxide Incident 4
Electrocution - Electrical Burns to Person 2
Fireworks Related 3
Other - No Fire 30
No Fire Total 39
Fire Category: Open Flame
Cause of Fire Count
Aerosol Can 1
Candle 57
Child Playing w/ Other Open Flame 3
Child Playing w/Matches/Lighter 9
Fireplace 1
Matches/Lighter 7
Other - Open Flame 5
Torch - Legal Use of 2
Open Flame Total 85
Fire Category: Other
Cause of Fire Count
Exothermic Chemical Reaction 2
Juvenile Firesetter Intervention 2
Not Ascertained 27
Other 3
SIU Investigation 1
Under Investigation 2
Other Total 37
Bureau Of Fire InvestigationInvestigative Management and Reporting System
Fire Injuries by Category & CauseFor the period 1/1/2018 through 12/31/2018
Fire Category: Smoking
Cause of Fire Count
Smoking (Cigarette/Cigar) 66
Smoking Total 66
Grand Total: 1001
Bureau Of Fire InvestigationInvestigative Management and Reporting System
Fire Injuries by Category & CauseFor the period 1/1/2018 through 12/31/2018
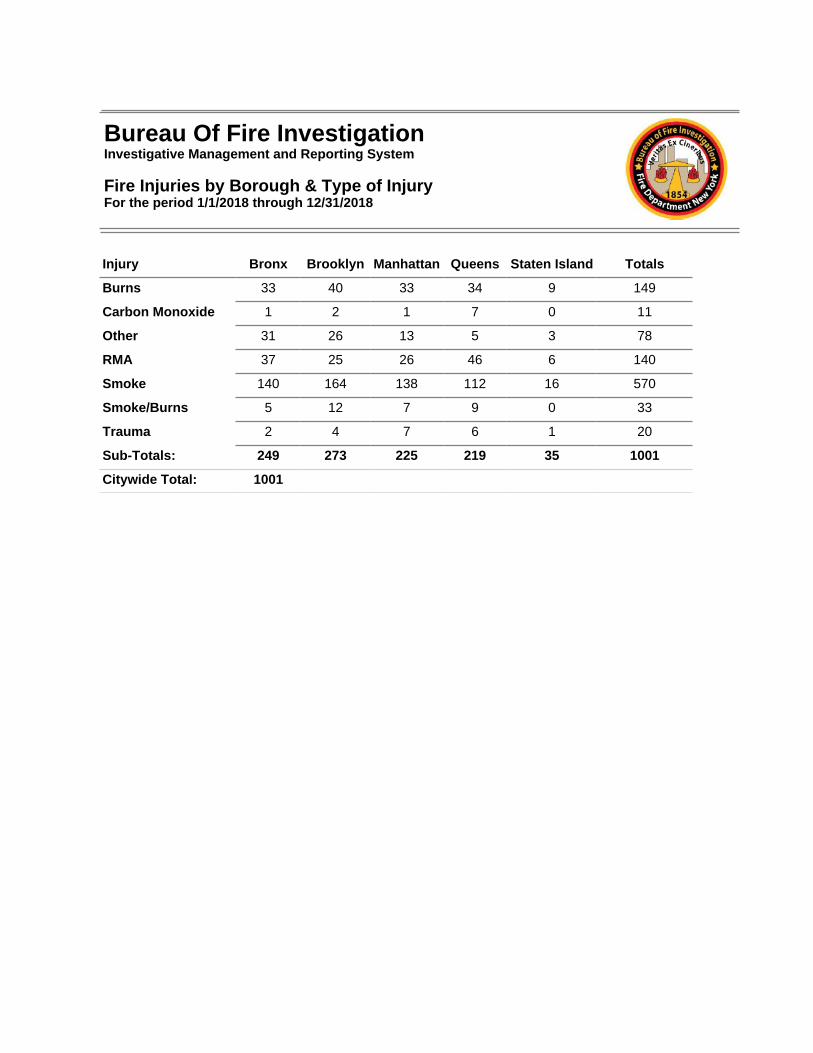
Injury Bronx Brooklyn Manhattan Queens Staten Island Totals
Burns 33 40 33 34 9 149
Carbon Monoxide 1 2 1 7 0 11
Other 31 26 13 5 3 78
RMA 37 25 26 46 6 140
Smoke 140 164 138 112 16 570
Smoke/Burns 5 12 7 9 0 33
Trauma 2 4 7 6 1 20
Sub-Totals: 249 273 225 219 35 1001
Citywide Total: 1001
Bureau Of Fire InvestigationInvestigative Management and Reporting System
Fire Injuries by Borough & Type of InjuryFor the period 1/1/2018 through 12/31/2018
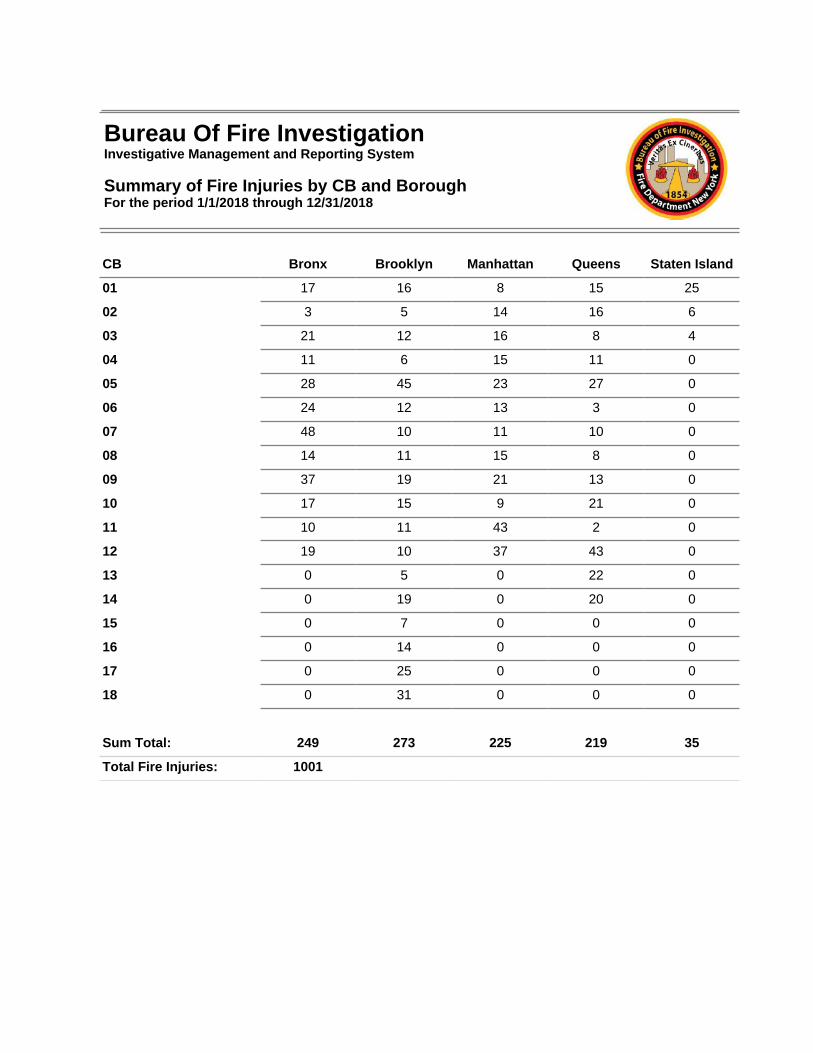
CB Bronx Brooklyn Manhattan Queens Staten Island
01 17 16 8 15 25
02 3 5 14 16 6
03 21 12 16 8 4
04 11 6 15 11 0
05 28 45 23 27 0
06 24 12 13 3 0
07 48 10 11 10 0
08 14 11 15 8 0
09 37 19 21 13 0
10 17 15 9 21 0
11 10 11 43 2 0
12 19 10 37 43 0
13 0 5 0 22 0
14 0 19 0 20 0
15 0 7 0 0 0
16 0 14 0 0 0
17 0 25 0 0 0
18 0 31 0 0 0
Sum Total: 249 273 225 219 35
Total Fire Injuries: 1001
Bureau Of Fire InvestigationInvestigative Management and Reporting System
Summary of Fire Injuries by CB and BoroughFor the period 1/1/2018 through 12/31/2018
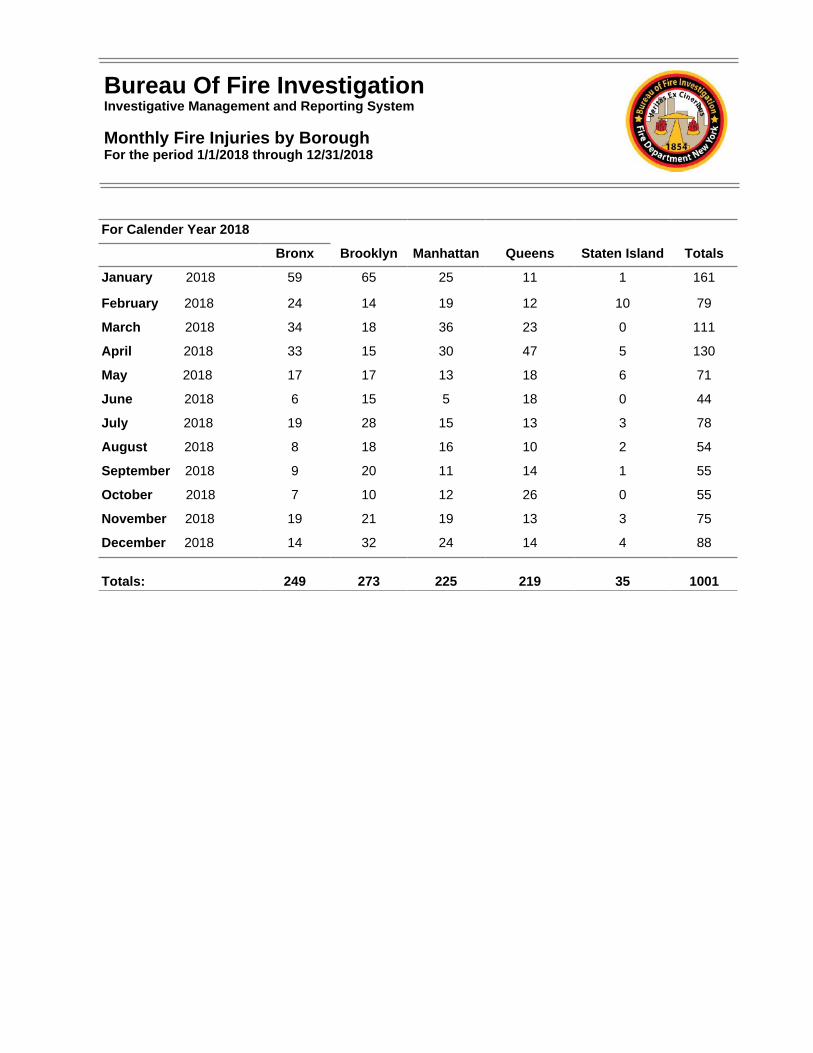
For Calender Year 2018
Bronx Brooklyn Manhattan Queens Staten Island Totals
January 2018 59 65 25 11 1 161
February 2018 24 14 19 12 10 79
March 2018 34 18 36 23 0 111
April 2018 33 15 30 47 5 130
May 2018 17 17 13 18 6 71
June 2018 6 15 5 18 0 44
July 2018 19 28 15 13 3 78
August 2018 8 18 16 10 2 54
September 2018 9 20 11 14 1 55
October 2018 7 10 12 26 0 55
November 2018 19 21 19 13 3 75
December 2018 14 32 24 14 4 88
Totals: 249 273 225 219 35 1001
Bureau Of Fire InvestigationInvestigative Management and Reporting System
Monthly Fire Injuries by BoroughFor the period 1/1/2018 through 12/31/2018
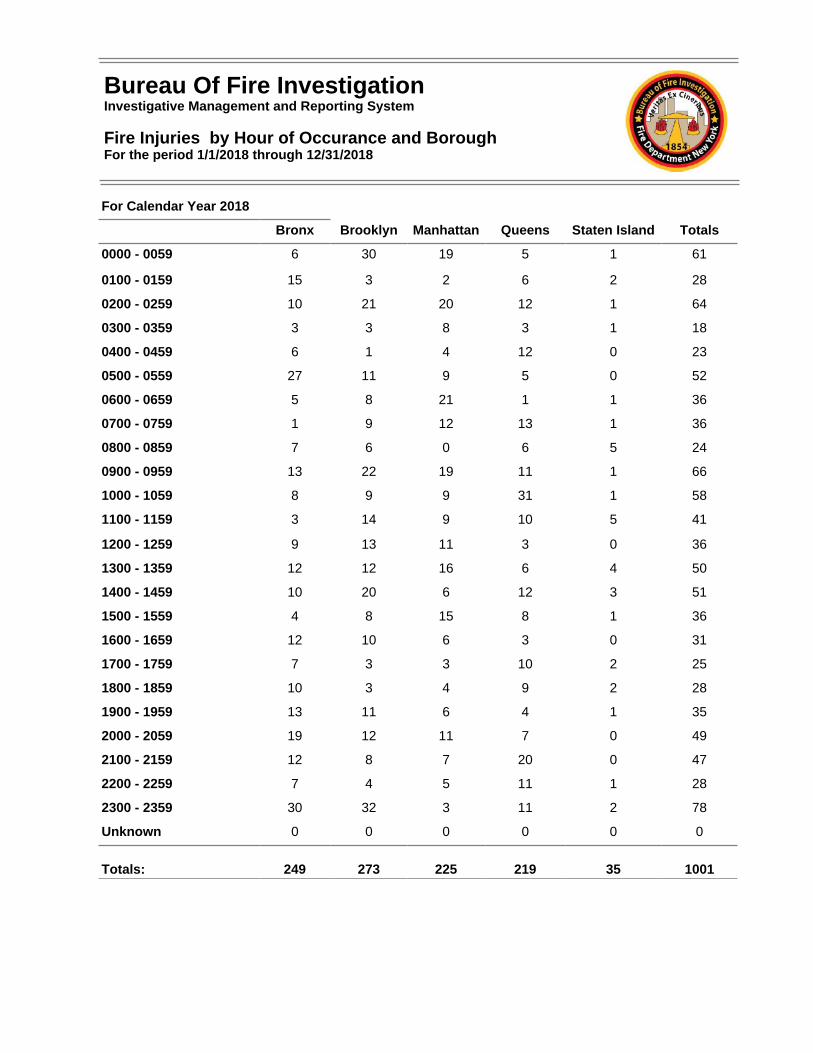
For Calendar Year 2018
Bronx Brooklyn Manhattan Queens Staten Island Totals
0000 - 0059 6 30 19 5 1 61
0100 - 0159 15 3 2 6 2 28
0200 - 0259 10 21 20 12 1 64
0300 - 0359 3 3 8 3 1 18
0400 - 0459 6 1 4 12 0 23
0500 - 0559 27 11 9 5 0 52
0600 - 0659 5 8 21 1 1 36
0700 - 0759 1 9 12 13 1 36
0800 - 0859 7 6 0 6 5 24
0900 - 0959 13 22 19 11 1 66
1000 - 1059 8 9 9 31 1 58
1100 - 1159 3 14 9 10 5 41
1200 - 1259 9 13 11 3 0 36
1300 - 1359 12 12 16 6 4 50
1400 - 1459 10 20 6 12 3 51
1500 - 1559 4 8 15 8 1 36
1600 - 1659 12 10 6 3 0 31
1700 - 1759 7 3 3 10 2 25
1800 - 1859 10 3 4 9 2 28
1900 - 1959 13 11 6 4 1 35
2000 - 2059 19 12 11 7 0 49
2100 - 2159 12 8 7 20 0 47
2200 - 2259 7 4 5 11 1 28
2300 - 2359 30 32 3 11 2 78
Unknown 0 0 0 0 0 0
Totals: 249 273 225 219 35 1001
Bureau Of Fire InvestigationInvestigative Management and Reporting System
Fire Injuries by Hour of Occurance and BoroughFor the period 1/1/2018 through 12/31/2018
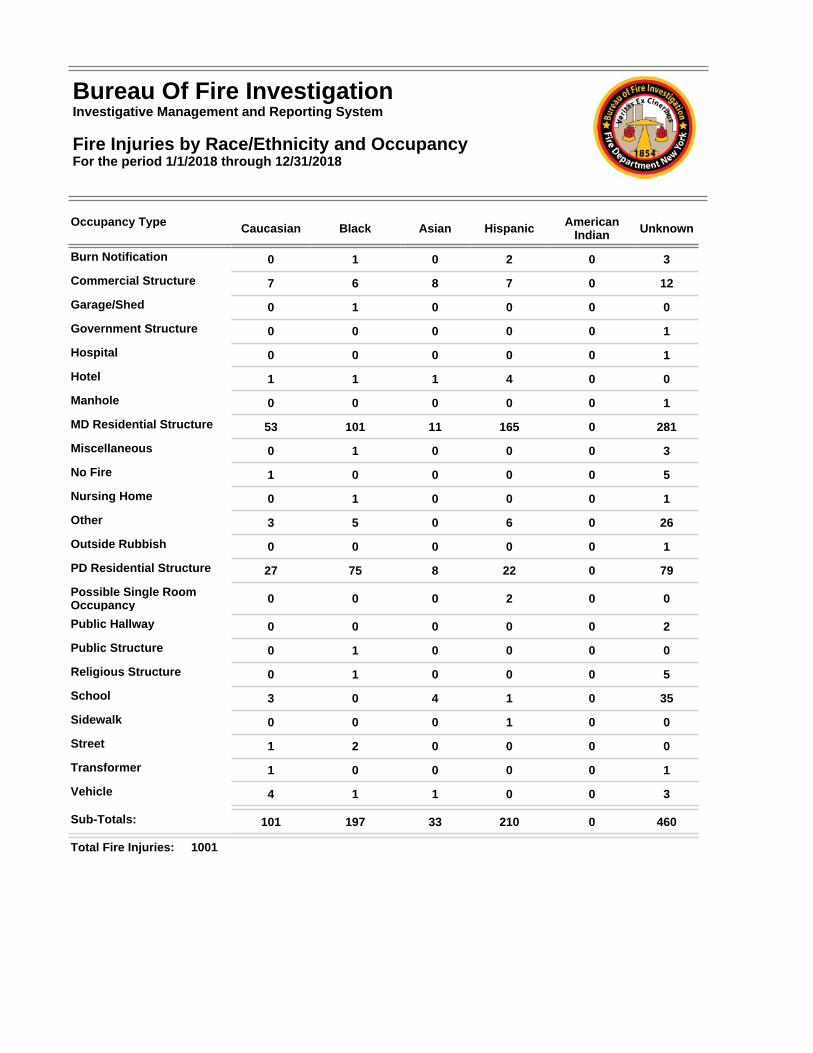
Occupancy Type Caucasian Black Asian Hispanic AmericanIndian Unknown
Burn Notification 0 1 0 2 0 3
Commercial Structure 7 6 8 7 0 12
Garage/Shed 0 1 0 0 0 0
Government Structure 0 0 0 0 0 1
Hospital 0 0 0 0 0 1
Hotel 1 1 1 4 0 0
Manhole 0 0 0 0 0 1
MD Residential Structure 53 101 11 165 0 281
Miscellaneous 0 1 0 0 0 3
No Fire 1 0 0 0 0 5
Nursing Home 0 1 0 0 0 1
Other 3 5 0 6 0 26
Outside Rubbish 0 0 0 0 0 1
PD Residential Structure 27 75 8 22 0 79
Possible Single Room Occupancy 0 0 0 2 0 0
Public Hallway 0 0 0 0 0 2
Public Structure 0 1 0 0 0 0
Religious Structure 0 1 0 0 0 5
School 3 0 4 1 0 35
Sidewalk 0 0 0 1 0 0
Street 1 2 0 0 0 0
Transformer 1 0 0 0 0 1
Vehicle 4 1 1 0 0 3
Sub-Totals: 101 197 33 210 0 460
Total Fire Injuries: 1001
Bureau Of Fire InvestigationInvestigative Management and Reporting System
Fire Injuries by Race/Ethnicity and Occupancy For the period 1/1/2018 through 12/31/2018
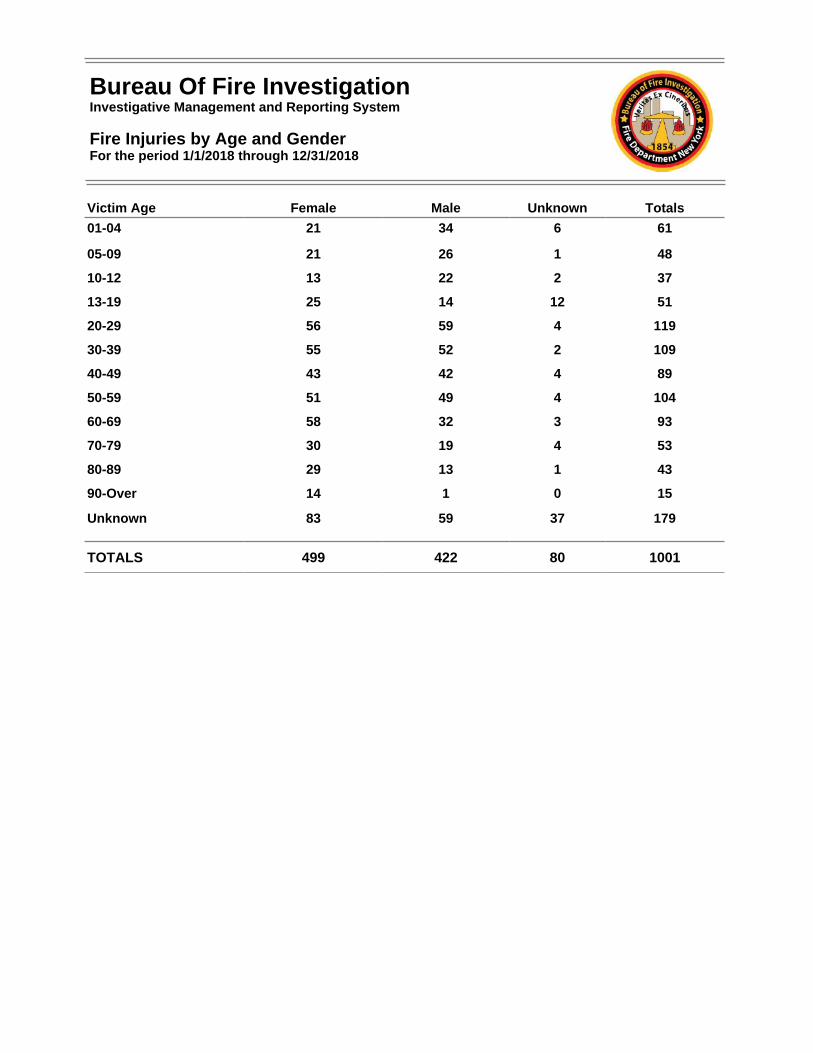
Victim Age Female Male Unknown Totals
01-04 21 34 6 61
05-09 21 26 1 48
10-12 13 22 2 37
13-19 25 14 12 51
20-29 56 59 4 119
30-39 55 52 2 109
40-49 43 42 4 89
50-59 51 49 4 104
60-69 58 32 3 93
70-79 30 19 4 53
80-89 29 13 1 43
90-Over 14 1 0 15
Unknown 83 59 37 179
TOTALS 499 422 80 1001
Bureau Of Fire InvestigationInvestigative Management and Reporting System
Fire Injuries by Age and GenderFor the period 1/1/2018 through 12/31/2018
Bureau Of Fire InvestigationInvestigative Management and Reporting System
Fire Injuries by Age and GenderFor the period 1/1/2018 through 12/31/2018
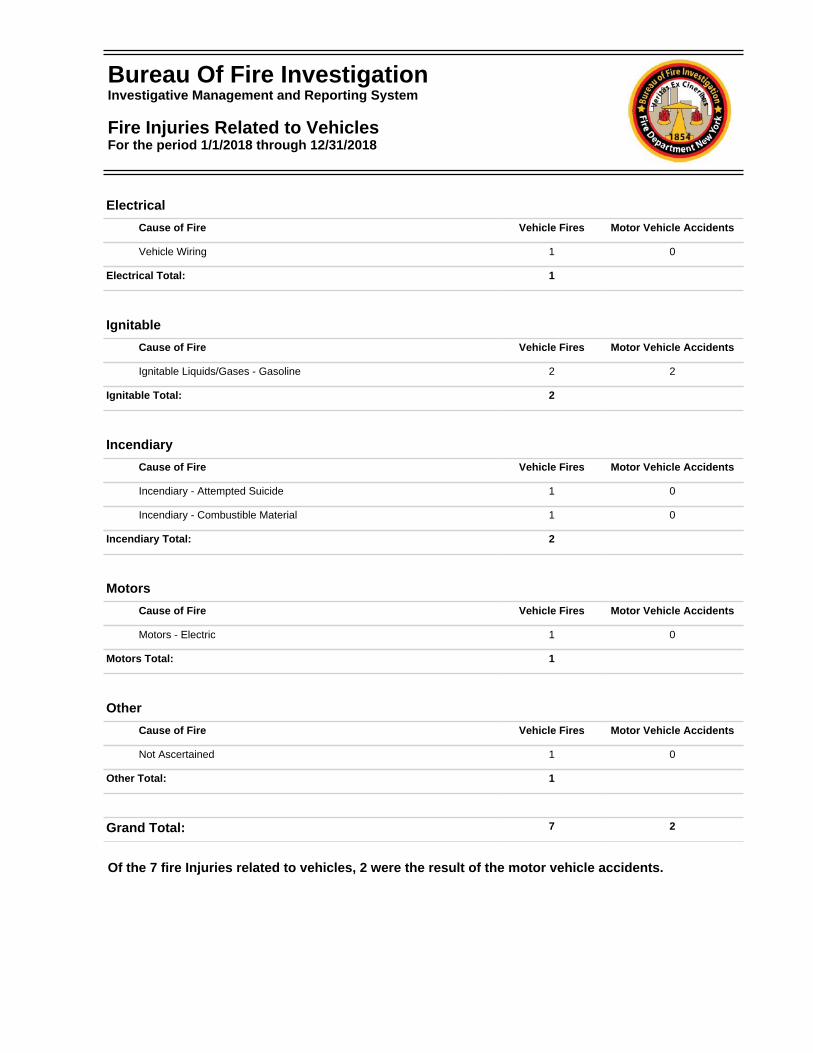
Electrical
Cause of Fire Vehicle Fires Motor Vehicle Accidents
Vehicle Wiring 1 0
Electrical Total: 1
Ignitable
Cause of Fire Vehicle Fires Motor Vehicle Accidents
Ignitable Liquids/Gases - Gasoline 2 2
Ignitable Total: 2
Incendiary
Cause of Fire Vehicle Fires Motor Vehicle Accidents
Incendiary - Attempted Suicide 1 0
Incendiary - Combustible Material 1 0
Incendiary Total: 2
Motors
Cause of Fire Vehicle Fires Motor Vehicle Accidents
Motors - Electric 1 0
Motors Total: 1
Other
Cause of Fire Vehicle Fires Motor Vehicle Accidents
Not Ascertained 1 0
Other Total: 1
Grand Total: 7 2
Of the 7 fire Injuries related to vehicles, 2 were the result of the motor vehicle accidents.
Bureau Of Fire InvestigationInvestigative Management and Reporting System
Fire Injuries Related to VehiclesFor the period 1/1/2018 through 12/31/2018
Bureau Of Fire InvestigationInvestigative Management and Reporting System
Fire Injuries Related to VehiclesFor the period 1/1/2018 through 12/31/2018
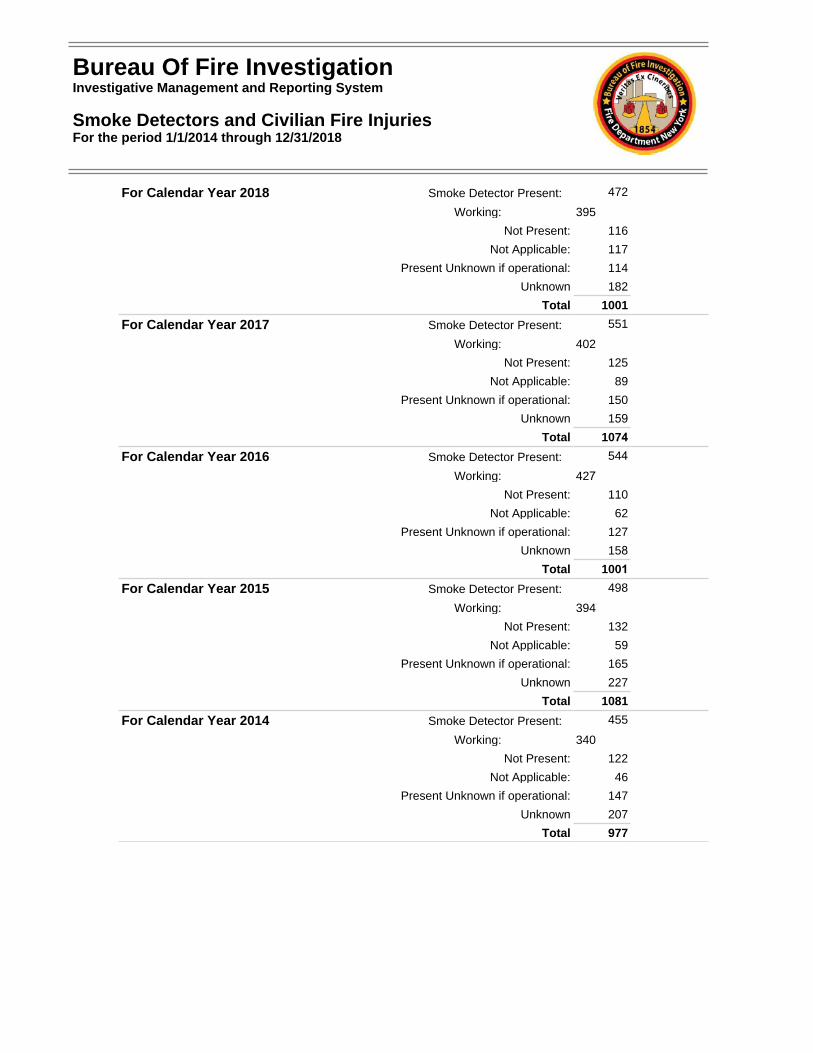
For Calendar Year 2018 Smoke Detector Present: 472
Working: 395
Not Present: 116
Not Applicable: 117
Present Unknown if operational: 114
Unknown 182
Total 1001
For Calendar Year 2017 Smoke Detector Present: 551
Working: 402
Not Present: 125
Not Applicable: 89
Present Unknown if operational: 150
Unknown 159Total 1074
For Calendar Year 2016 Smoke Detector Present: 544
Working: 427Not Present: 110
Not Applicable: 62
Present Unknown if operational: 127
Unknown 158Total 1001
For Calendar Year 2015 Smoke Detector Present: 498
Working: 394
Not Present: 132
Not Applicable: 59
Present Unknown if operational: 165
Unknown 227
Total 1081
For Calendar Year 2014 Smoke Detector Present: 455
Working: 340
Not Present: 122
Not Applicable: 46
Present Unknown if operational: 147
Unknown 207
Total 977
Bureau Of Fire InvestigationInvestigative Management and Reporting System
Smoke Detectors and Civilian Fire InjuriesFor the period 1/1/2014 through 12/31/2018
Bureau of Fire Investigation Investigative Management and Reporting System
2018Annual Report
on Arrests
Veritas ex Cineribus

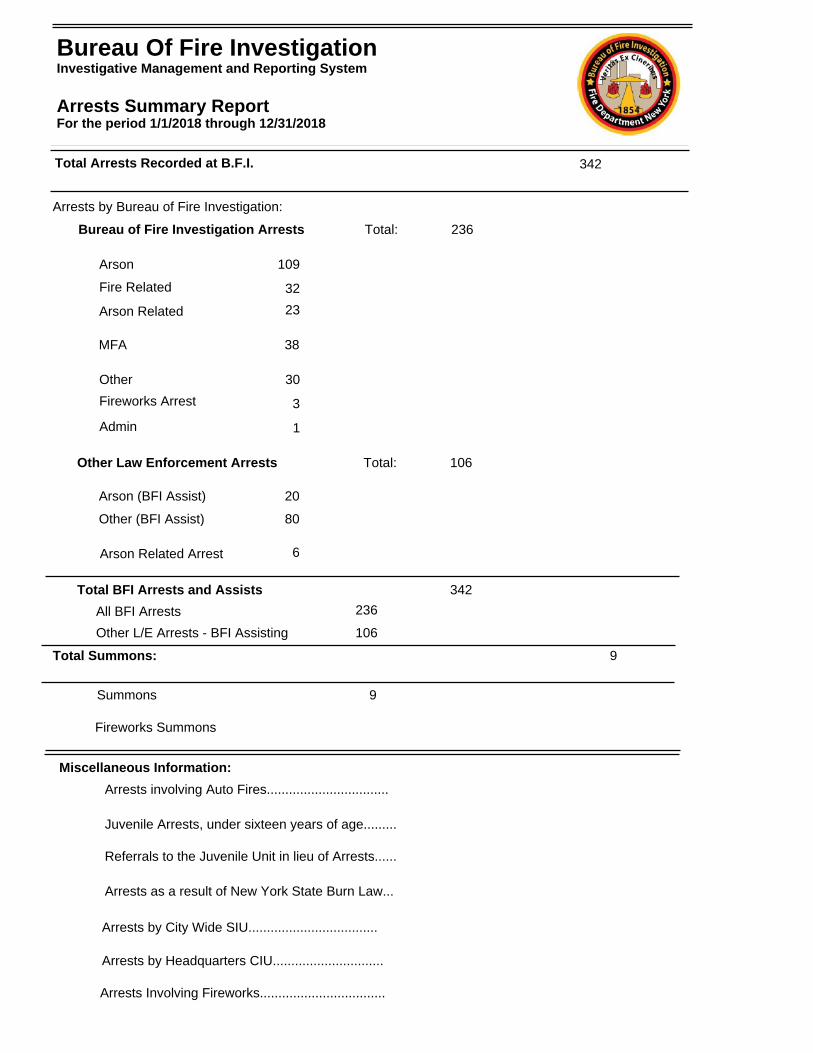
Bureau of Fire Investigation Arrests
Arson
236
109
Total:
Fire Related 32
Arson Related 23
MFA
Other
Fireworks Arrest
38
30
3
Other Law Enforcement Arrests Total: 106
Arson (BFI Assist)
Other (BFI Assist)
Arson Related Arrest
20
80
6
Total BFI Arrests and Assists 342
All BFI Arrests 236
Other L/E Arrests - BFI Assisting 106
Total Summons: 9
Summons 9
Fireworks Summons
Miscellaneous Information:
Arrests involving Auto Fires.................................
Juvenile Arrests, under sixteen years of age.........
Referrals to the Juvenile Unit in lieu of Arrests......
Arrests as a result of New York State Burn Law...
Arrests by City Wide SIU...................................
Arrests by Headquarters CIU..............................
Arrests Involving Fireworks..................................
342
Arrests by Bureau of Fire Investigation:
Total Arrests Recorded at B.F.I.
Admin 1
Bureau Of Fire InvestigationInvestigative Management and Reporting System
Arrests Summary ReportFor the period 1/1/2018 through 12/31/2018
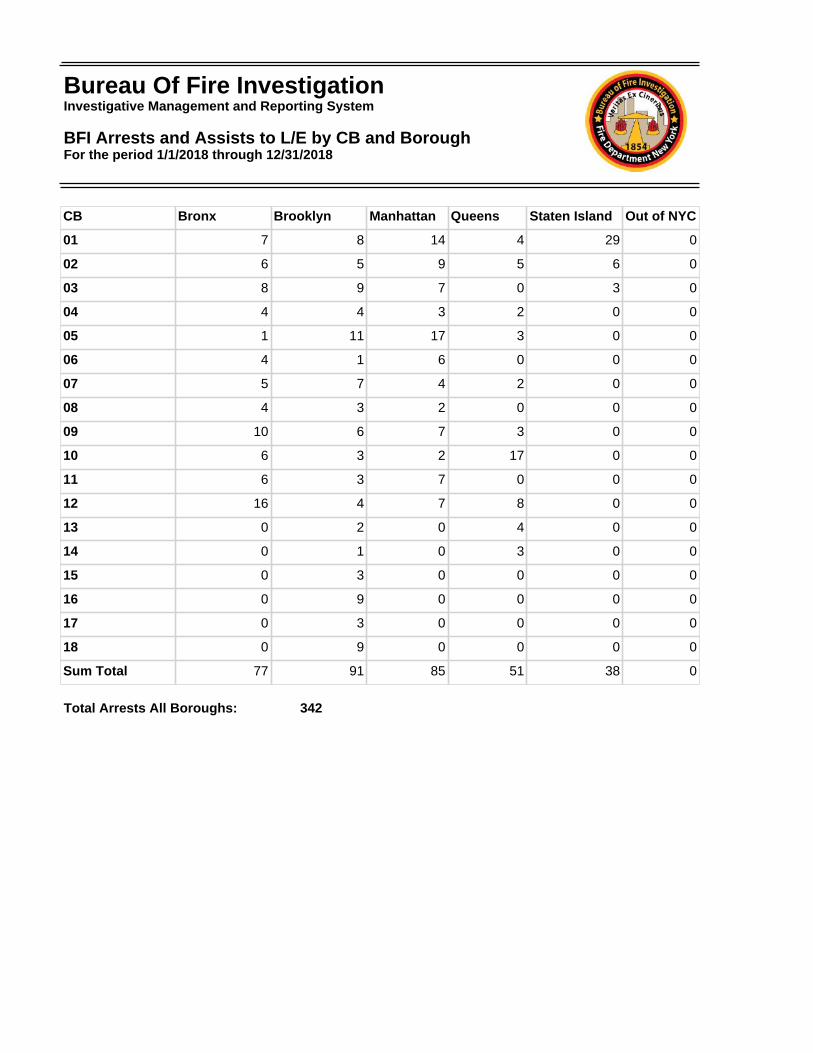
CB Bronx Brooklyn Manhattan Queens Staten Island Out of NYC
01 7 8 14 4 29 0
02 6 5 9 5 6 0
03 8 9 7 0 3 0
04 4 4 3 2 0 0
05 1 11 17 3 0 0
06 4 1 6 0 0 0
07 5 7 4 2 0 0
08 4 3 2 0 0 0
09 10 6 7 3 0 0
10 6 3 2 17 0 0
11 6 3 7 0 0 0
12 16 4 7 8 0 0
13 0 2 0 4 0 0
14 0 1 0 3 0 0
15 0 3 0 0 0 0
16 0 9 0 0 0 0
17 0 3 0 0 0 0
18 0 9 0 0 0 0
Sum Total 77 91 85 51 38 0
Total Arrests All Boroughs: 342
Bureau Of Fire InvestigationInvestigative Management and Reporting System
BFI Arrests and Assists to L/E by CB and Borough For the period 1/1/2018 through 12/31/2018
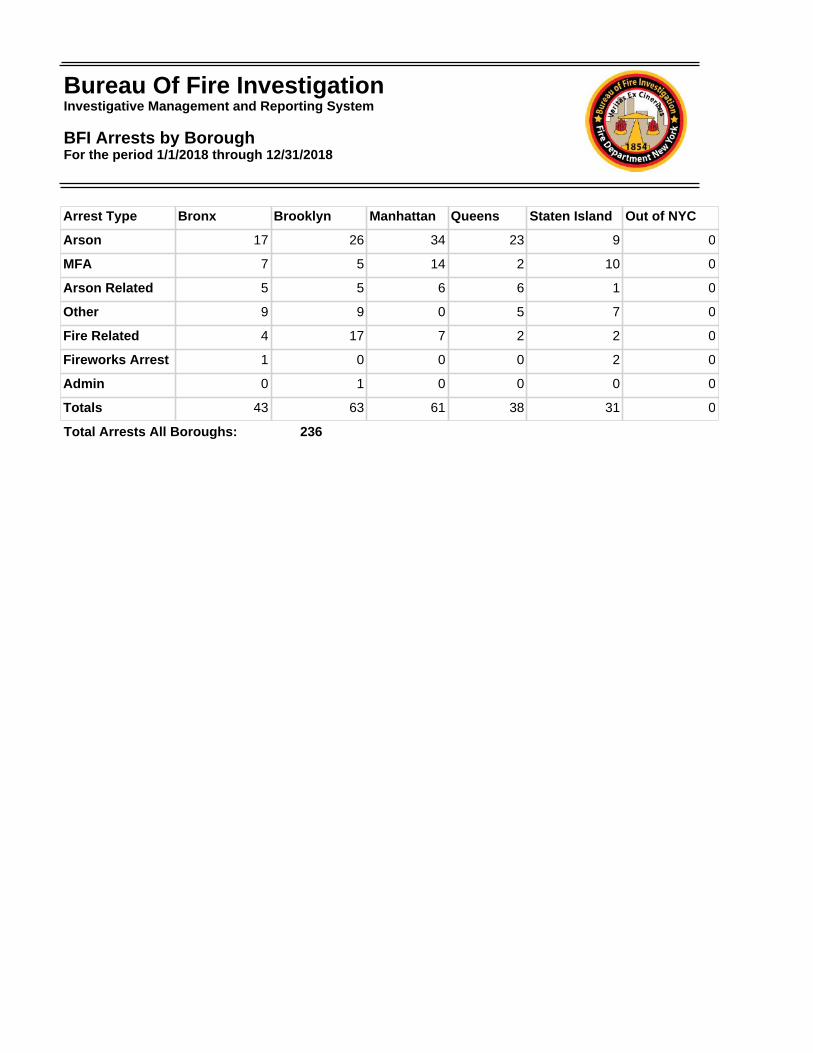
Arrest Type Bronx Brooklyn Manhattan Queens Staten Island Out of NYC
Arson 17 26 34 23 9 0
MFA 7 5 14 2 10 0
Arson Related 5 5 6 6 1 0
Other 9 9 0 5 7 0
Fire Related 4 17 7 2 2 0
Fireworks Arrest 1 0 0 0 2 0
Admin 0 1 0 0 0 0
Totals 43 63 61 38 31 0
Total Arrests All Boroughs: 236
Bureau Of Fire InvestigationInvestigative Management and Reporting System
BFI Arrests by BoroughFor the period 1/1/2018 through 12/31/2018
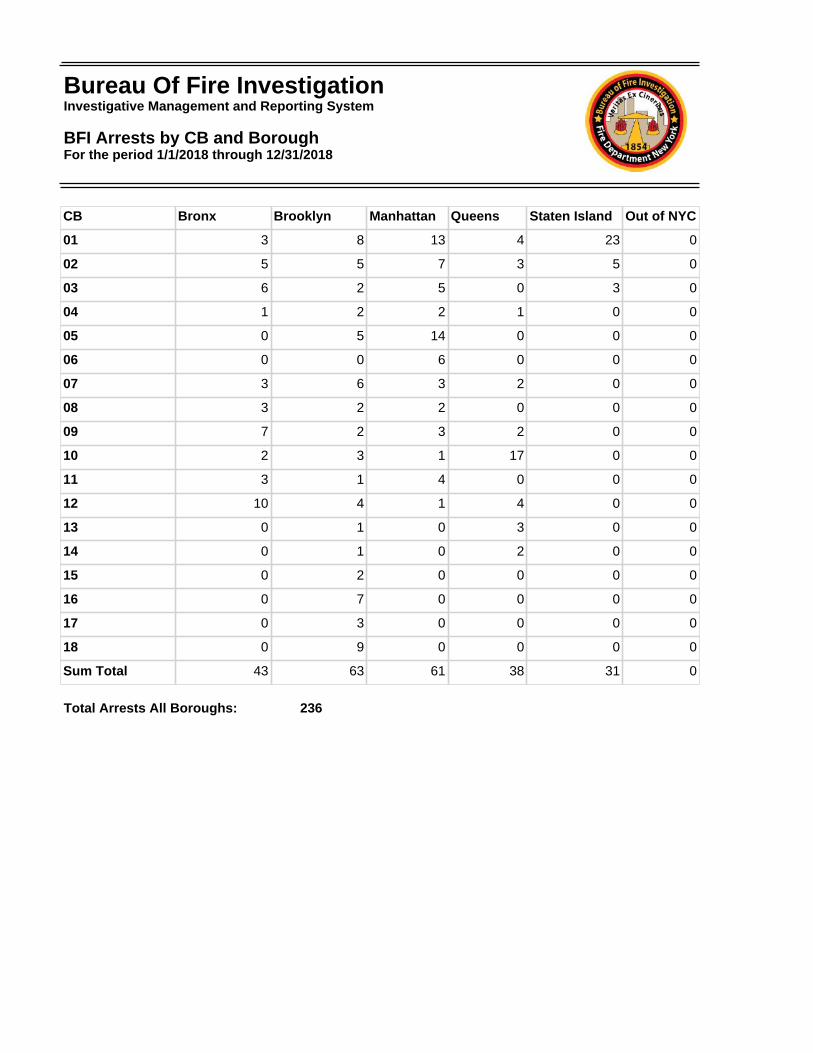
CB Bronx Brooklyn Manhattan Queens Staten Island Out of NYC
01 3 8 13 4 23 0
02 5 5 7 3 5 0
03 6 2 5 0 3 0
04 1 2 2 1 0 0
05 0 5 14 0 0 0
06 0 0 6 0 0 0
07 3 6 3 2 0 0
08 3 2 2 0 0 0
09 7 2 3 2 0 0
10 2 3 1 17 0 0
11 3 1 4 0 0 0
12 10 4 1 4 0 0
13 0 1 0 3 0 0
14 0 1 0 2 0 0
15 0 2 0 0 0 0
16 0 7 0 0 0 0
17 0 3 0 0 0 0
18 0 9 0 0 0 0
Sum Total 43 63 61 38 31 0
Total Arrests All Boroughs: 236
Bureau Of Fire InvestigationInvestigative Management and Reporting System
BFI Arrests by CB and Borough For the period 1/1/2018 through 12/31/2018
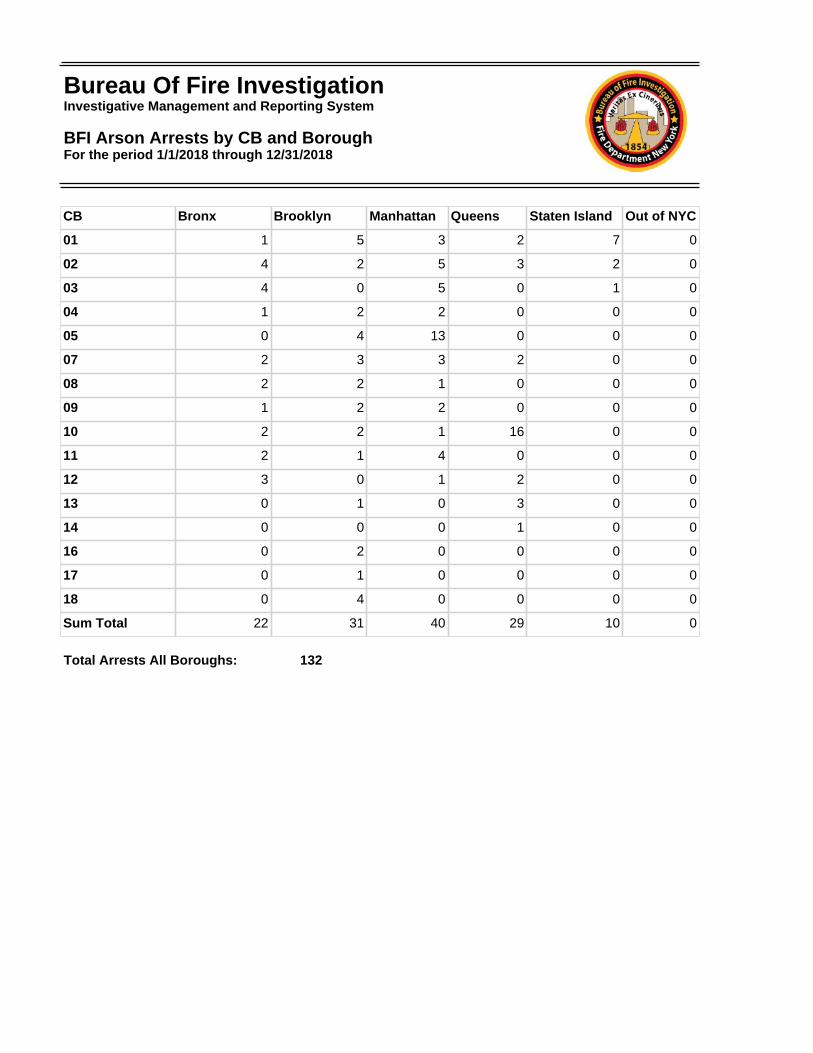
CB Bronx Brooklyn Manhattan Queens Staten Island Out of NYC
01 1 5 3 2 7 0
02 4 2 5 3 2 0
03 4 0 5 0 1 0
04 1 2 2 0 0 0
05 0 4 13 0 0 0
07 2 3 3 2 0 0
08 2 2 1 0 0 0
09 1 2 2 0 0 0
10 2 2 1 16 0 0
11 2 1 4 0 0 0
12 3 0 1 2 0 0
13 0 1 0 3 0 0
14 0 0 0 1 0 0
16 0 2 0 0 0 0
17 0 1 0 0 0 0
18 0 4 0 0 0 0
Sum Total 22 31 40 29 10 0
Total Arrests All Boroughs: 132
Bureau Of Fire InvestigationInvestigative Management and Reporting System
BFI Arson Arrests by CB and Borough For the period 1/1/2018 through 12/31/2018

CB Arson Arson L/E MFA Other Other L/E Fire Related
01 1 2 1 0 2 1
02 4 0 0 0 1 1
03 4 1 0 1 1 1
04 1 0 0 0 3 0
05 0 0 0 0 1 0
06 0 1 0 0 3 0
07 2 0 1 0 2 0
08 2 0 0 1 1 0
09 1 0 5 0 3 1
10 2 2 0 0 2 0
11 2 1 0 1 2 0
12 3 1 0 6 5 1
Sum Total 22 8 7 9 26 5
Total Arrests Bronx: 77
Bureau Of Fire InvestigationInvestigative Management and Reporting System
Bronx Community Boards Arrest Breakdown For the period 1/1/2018 through 12/31/2018
CB Arson Arson L/E MFA Other Other L/E Fire Related Admin
01 5 0 0 1 0 2 0
02 2 0 0 2 0 1 0
03 0 5 1 0 2 1 0
04 2 0 0 0 2 0 0
05 4 2 0 0 4 1 0
06 0 0 0 0 1 0 0
07 3 0 0 0 1 3 0
08 2 0 0 0 1 0 0
09 2 1 0 0 3 0 0
10 2 0 0 1 0 0 0
11 1 0 0 0 2 0 0
12 0 0 1 0 0 3 0
13 1 0 0 0 1 0 0
14 0 0 0 0 0 0 1
15 0 0 0 0 1 2 0
16 2 0 0 4 2 1 0
17 1 0 0 0 0 2 0
18 4 0 3 1 0 1 0
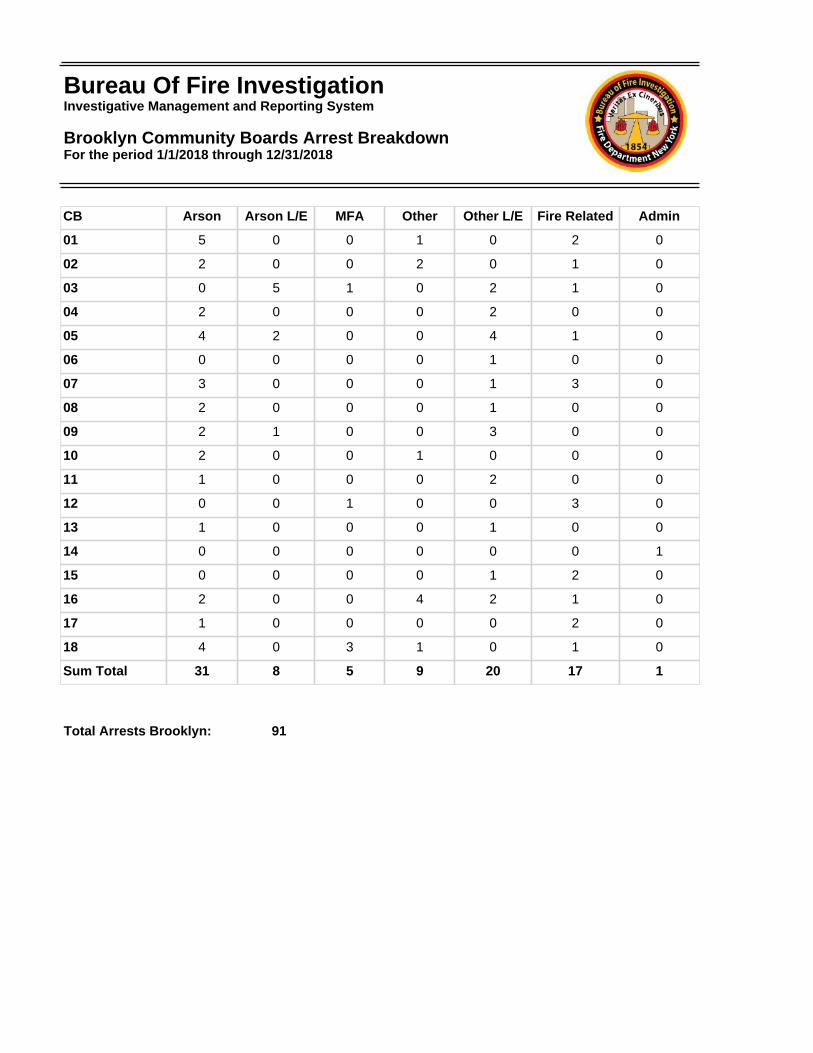
Sum Total 31 8 5 9 20 17 1
Total Arrests Brooklyn: 91
Bureau Of Fire InvestigationInvestigative Management and Reporting System
Brooklyn Community Boards Arrest Breakdown For the period 1/1/2018 through 12/31/2018
CB Arson Arson L/E MFA Other Other L/E Fire Related
01 3 0 8 0 1 2
02 5 1 0 0 1 2
03 5 0 0 0 2 0
04 2 0 0 0 1 0
05 13 0 0 0 3 1
06 0 0 6 0 0 0
07 3 1 0 0 0 0
08 1 0 0 0 0 1
09 2 1 0 0 3 1
10 1 0 0 0 1 0
11 4 1 0 0 2 0
12 1 1 0 0 5 0
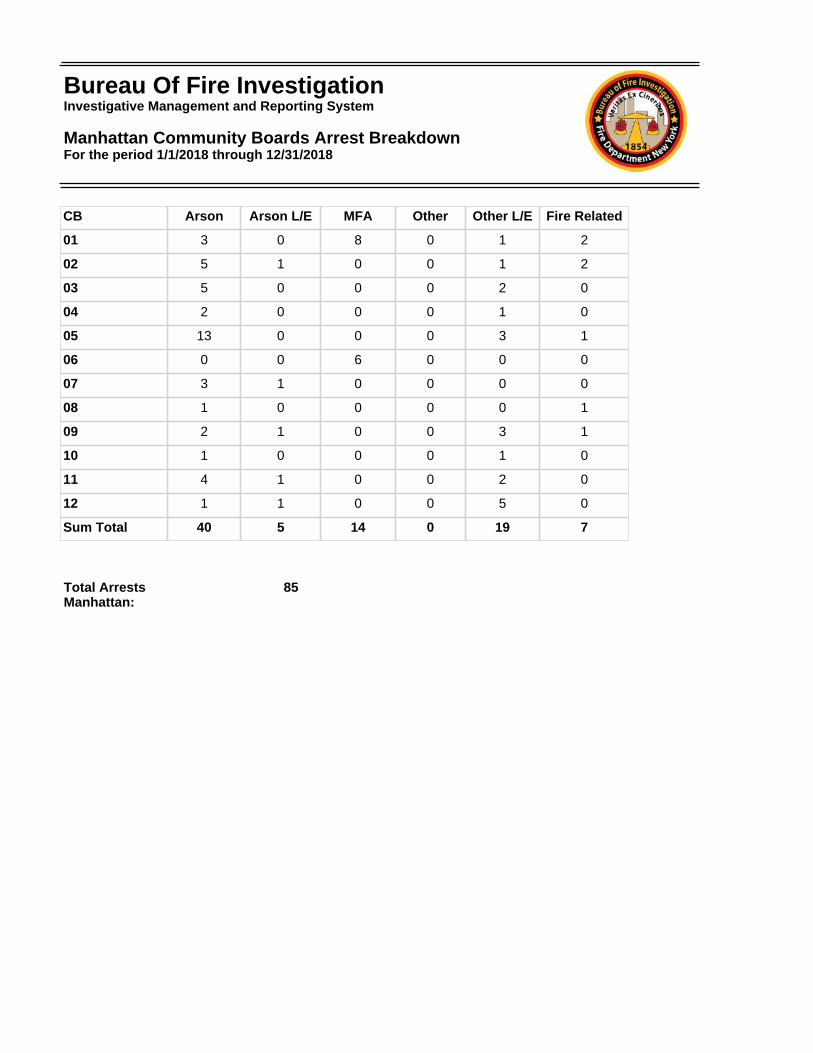
Sum Total 40 5 14 0 19 7
Total Arrests Manhattan:
85
Bureau Of Fire InvestigationInvestigative Management and Reporting System
Manhattan Community Boards Arrest Breakdown For the period 1/1/2018 through 12/31/2018
CB Arson Arson L/E MFA Other Other L/E Fire Related
01 2 0 0 1 0 1
02 3 0 0 0 2 0
04 0 1 0 1 0 0
05 0 2 0 0 1 0
07 2 0 0 0 0 0
09 0 1 0 2 0 0
10 16 0 0 1 0 0
12 2 0 2 0 4 0
13 3 1 0 0 0 0
14 1 0 0 0 1 1
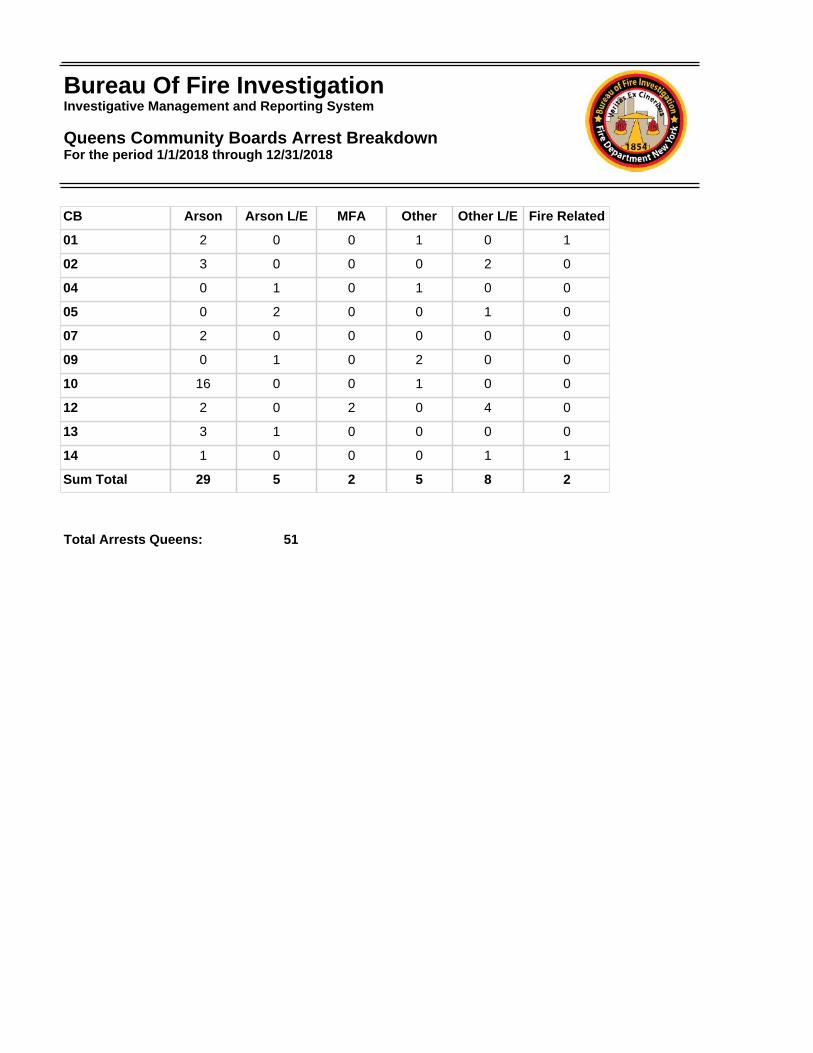
Sum Total 29 5 2 5 8 2
Total Arrests Queens: 51
Bureau Of Fire InvestigationInvestigative Management and Reporting System
Queens Community Boards Arrest Breakdown For the period 1/1/2018 through 12/31/2018
CB Arson Arson L/E MFA Other Other L/E Fire Related
01 7 0 8 6 6 2
02 2 0 2 0 1 1
03 1 0 0 1 0 1
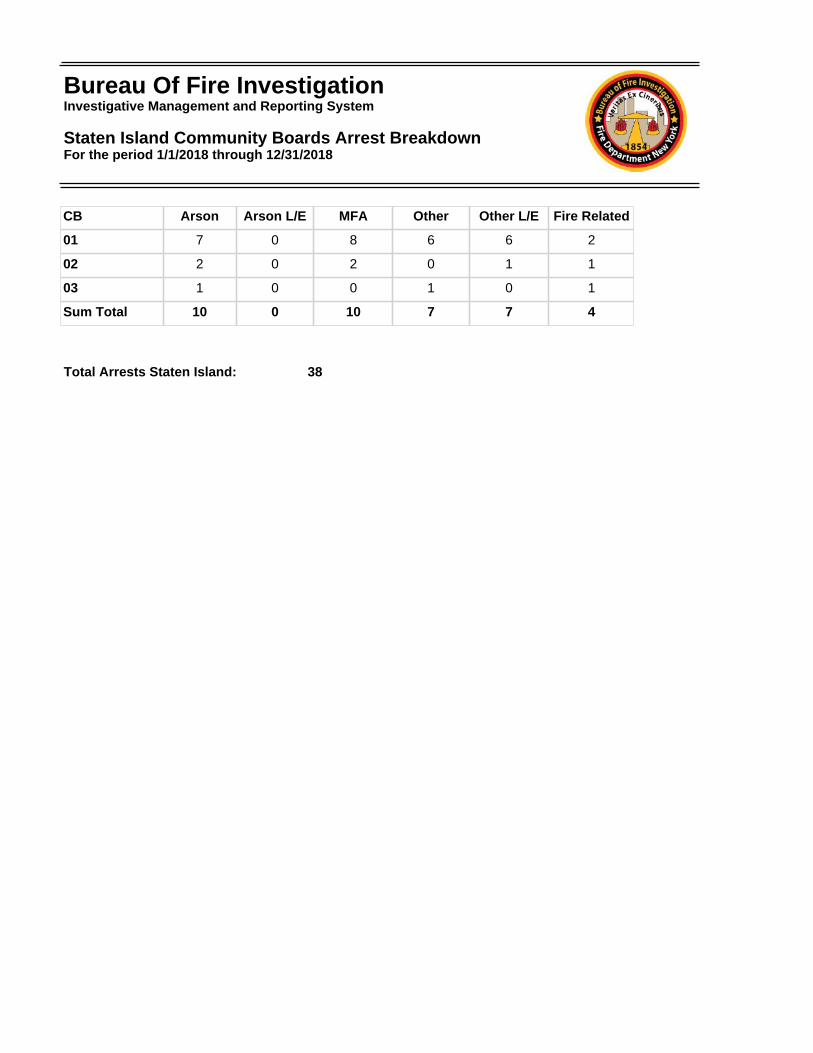
Sum Total 10 0 10 7 7 4
Total Arrests Staten Island: 38
Bureau Of Fire InvestigationInvestigative Management and Reporting System
Staten Island Community Boards Arrest Breakdown For the period 1/1/2018 through 12/31/2018
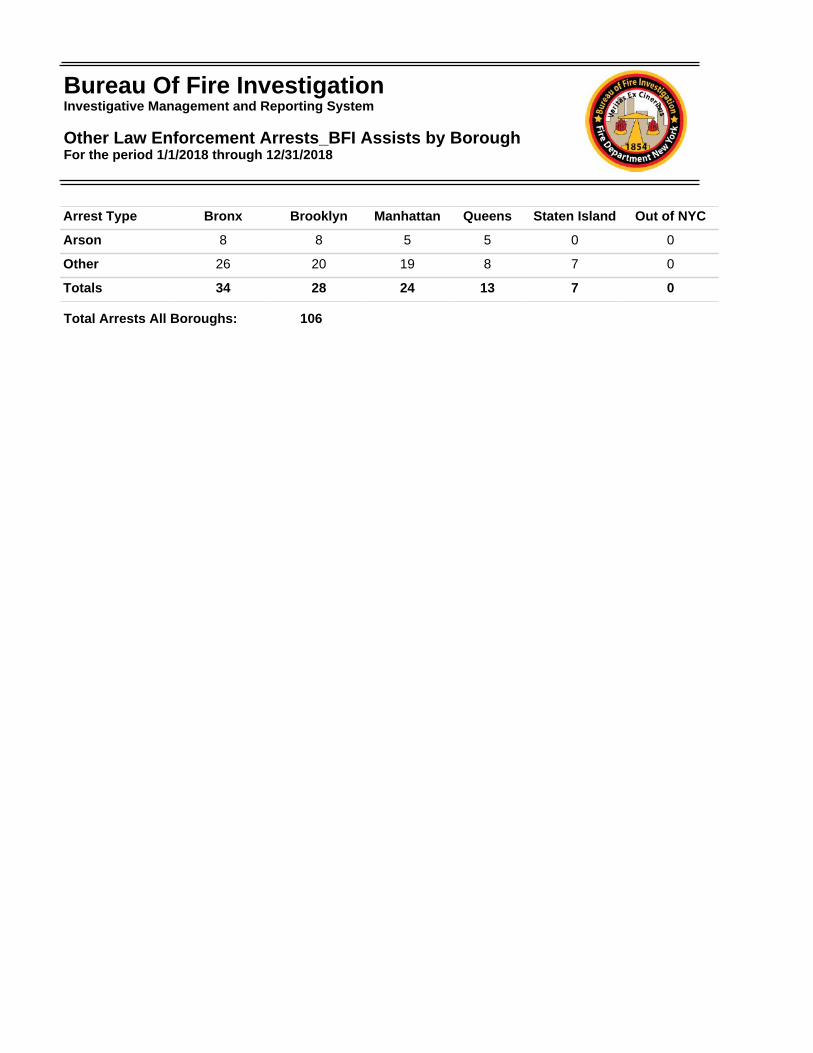
Arrest Type Bronx Brooklyn Manhattan Queens Staten Island Out of NYC
Arson 8 8 5 5 0 0
Other 26 20 19 8 7 0
Totals 34 28 24 13 7 0
Total Arrests All Boroughs: 106
Bureau Of Fire InvestigationInvestigative Management and Reporting System
Other Law Enforcement Arrests_BFI Assists by BoroughFor the period 1/1/2018 through 12/31/2018
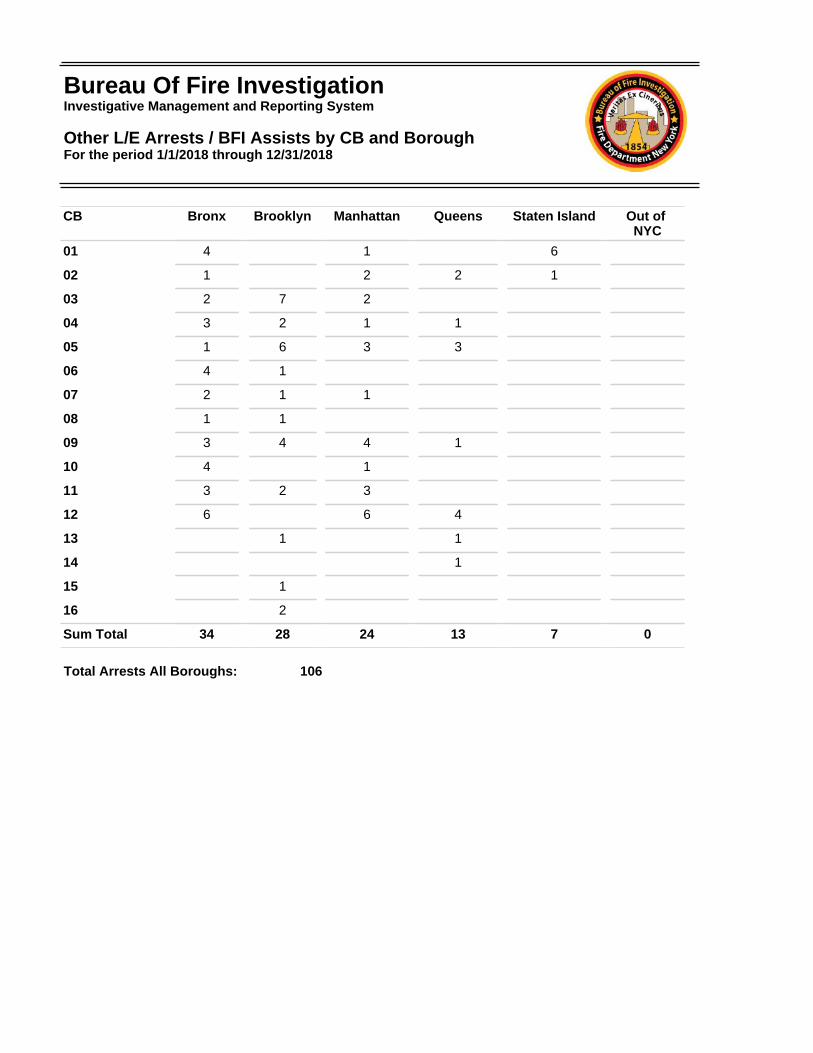
CB Bronx Brooklyn Manhattan Queens Staten Island Out of NYC
01 4 1 6
02 1 2 2 1
03 2 7 2
04 3 2 1 1
05 1 6 3 3
06 4 1
07 2 1 1
08 1 1
09 3 4 4 1
10 4 1
11 3 2 3
12 6 6 4
13 1 1
14 1
15 1
16 2
Sum Total 34 28 24 13 7 0
Total Arrests All Boroughs: 106
Bureau Of Fire InvestigationInvestigative Management and Reporting System
Other L/E Arrests / BFI Assists by CB and Borough For the period 1/1/2018 through 12/31/2018


![BUREAU OF FIRE PREVENTION, INSPECTIONS AND INVESTIGATIONS INVESTIGATION REPORT … · 2020. 6. 28. · INVESTIGATION REPORT Jtme 1, 1950 NAME: Robert Da]e Segee ADDRESs, Adelphi ,](https://img.pdfslide.net/doc/110x75/6099885ce133c9192a5789e8/bureau-of-fire-prevention-inspections-and-investigations-investigation-report-2020.jpg)