Embed Size (px)
Citation preview

Bureau of Health Information
Technical Supplement
Healthcare in Focus 2015: How does NSW compare?
Annual performance report

Bureau of Health Information | Technical Supplement, Healthcare in Focus 2015 i

Bureau of Health Information | Technical Supplement, Healthcare in Focus 2015 ii
Contents
Introduction ......................................................................................................................................................... 1
Data Sources and Methods ................................................................................................................................ 3
The Commonwealth Fund International Health Policy Survey ...................................................................... 4
Organisation for Economic Cooperation and Development........................................................................... 5
Australian Bureau of Statistics: Patient Experience Survey and Cause of Death ......................................... 5
Australian Institute for Health and Welfare: Healthcare expenditures ........................................................... 6
Bureau of Health Information: NSW Patient Survey Program ....................................................................... 6
NSW Ministry of Health: Linked admitted patient, emergency department and fact of death data ............... 6
NSW Ministry of Health: Hospital activity data (Health Information Exchange and Waiting List Collection
Online System) ............................................................................................................................................... 7
Indicator specifications by chapter ..................................................................................................................... 9
Appendix A: OECD country comparison data tables ........................................................................................ 16
Appendix B: Risk standardised 30-day return to acute care following hospitalisation for chronic obstructive
pulmonary disease ........................................................................................................................................... 18
Appendix C: Risk standardised 30-day mortality (all cause) following hospitalisation for chronic obstructive
pulmonary disease, and congestive heart failure ............................................................................................ 23
References ....................................................................................................................................................... 31

Bureau of Health Information | Technical Supplement, Healthcare in Focus 2015 1
Introduction
Bureau of Health Information | Technical Supplement, Healthcare in Focus 2015 2
This is a supplement to the Bureau of Health
Information’s sixth annual performance report,
Healthcare in Focus 2015: How does NSW
compare? The supplement describes methods
and technical terms used to compute descriptive
statistics and performance indicators included in
the report. It is technical in nature, and is intended
for audiences interested in the creation and
analysis of health performance information.
To produce the report, BHI used the following
sources of data:
The Commonwealth Fund International Health
Policy Survey 2015
Commonwealth Fund International Health
Policy Survey 2014
The Organisation for Economic Cooperation
and Development (OECD) Health Statistics
online database
NSW Health linked admitted patient,
emergency department presentation and fact of
death data, accessed via the Centre for
Epidemiology and Evidence [5]
NSW Health admitted patient (2001/02–
2013/14), emergency department presentation
(2000–2015) and elective surgery waiting list
(2014–2015) data collections, accessed via the
Health Information Exchange (HIE) and Waiting
List Collection Online System (WLCOS)
Australian Bureau of Statistics (ABS) mortality
data for 2014
Survey results from the ABS Patient
Experience Survey 2013–14
Survey results from BHI’s NSW Patient Survey
Program 2013–14
Australian Institute of Health and Welfare
(AIHW) expenditure data
Health and healthcare performance data
already published by governments or journal
articles. The sources of these data are
indicated where appropriate.
BHI used SAS/STAT™ software for the
statistical analysis of data published in
the report [1]

Bureau of Health Information | Technical Supplement, Healthcare in Focus 2015 3
Data Sources and Methods
Bureau of Health Information | Technical Supplement, Healthcare in Focus 2015 4
The Commonwealth Fund International Health Policy Survey
Each year, The Commonwealth Fund, a
philanthropic organisation in the United States,
commissions an international survey to support
the creation of public reports that benchmark the
performance of comparable healthcare systems.
The survey focuses on different populations,
generally following a three-year cycle. In 2013,
the sample was drawn from adults aged 18 years
and over, while in 2014 it focused on aged 55
years and over. In 2015, the survey was a
sample of primary care physicians or general
practitioners (GPs).
The Bureau of Health Information, as a partner,
invested in an additional sample of The
Commonwealth Fund International Health Policy
Survey (2015 IHPS) to ensure the number of
NSW participants was sufficient to compute robust
estimates of performance indicators of the NSW
health system, and to make statistically valid
comparisons with the countries participating
in the survey.
Fieldwork in all countries took place between
March and June 2015. The survey assessed
confidence in the healthcare system including
questions of access, cost and quality. Social
Science Research Solutions (SSRS) produced a
comprehensive methodological report that details
the sample design, data collection, data
processing and survey procedures used in
conducting the survey.
Final samples were weighted to reflect the
distribution of the GP population in each country.
The characteristics and populations used to
calculate weights for each country are
summarised in the SSRS methodology report [2].
Australian data were weighted to represent
providers from the national list of physicians
provided by the Medical Directory of Australia, of
more than 23,000 Australian physicians, where
general practitioners were selected.
In Australia, 747 GPs were surveyed, including
401 in NSW. The response rate was 25% for
Australia. Response rates for countries sampled
for the 2015 IHPS varied from 8% in France to
47% in Sweden (Table 1).
To align GP responses with patient perspectives
results from the 2014 Commonwealth Fund
International Health Policy Survey of Older Adults
were also used. Respondent numbers and
response rates for the 2014 survey are provided
in (Table 2). For more detailed information on the
2014 survey, see the Technical supplement for
Healthcare in Focus 2014.
Statistical analysis
The performance of the NSW healthcare system
was reported alongside Australia and 10 other
countries. Reported percentages are the weighted
estimates that are intended to reflect the views
and experiences of the population (whether by
NSW, region or country) or primary care practices.
Consistent with published reports on The
Commonwealth Fund data [3], non-response
categories, such as ‘not sure’, ‘declined to
answer’, and ‘not applicable’ were excluded from
reporting and statistical analyses. Some
physicians responded by mail resulting in a small
number of multiple responses for questions where
only a single response was requested. These
multi-responses were also excluded (<1% and
only for a small subset of countries on a small
number of questions). More information can be
provided upon request.
The NSW estimates are compared with results for
the rest of for Australia and the 10 other countries.
Note that while results are shown for all of
Australia, any differences between Australia and
NSW are based on comparisons with the rest of
Australia. A main response category was
determined for each question, and responses
were dichotomised such that the response value
of interest (for example ‘always’) is coded as 1,
and all other values, excluding non-response
categories, are coded as 0. Logistic regression is
then used to fit this binary variable on an

Bureau of Health Information | Technical Supplement, Healthcare in Focus 2015 5
explanatory variable for each respondent country,
with appropriate adjustment for survey weights
using the SAS procedures SURVEYLOGISTIC for
the analysis [1]. Any values different from NSW
are noted with an asterix (*) or shaded to identify
statistically significant differences at a 5%
significance level. If no difference is flagged than
with the available data, we are unable to detect
statistical differences in the performance based on
the statistical model.
Organisation for Economic Cooperation and Development
The Organisation for Economic Cooperation and
Development (OECD) is a comprehensive and
consistent source of comparable international
data on various economic and social topics,
including health care.
The latest edition of the OECD’s biennial report
Health at a Glance was released in November
2015. The OECD Health Care Quality Indicators
included in that report are based on specifications
developed by the US Agency for Healthcare
Research and Quality () and made available
through the OECD website OECD Health
Statistics (www.oecd-ilibrary.org/social-issues-
migration-health/data/oecd-health-
statistics_health-data-en)
Statistical analysis
A subset of these healthcare measures have been
presented in this report with the NSW results
calculated based on specifications from the OECD
and the Australian Institute for Health and Welfare
[7]. Details relevant to BHI’s calculation of these
indicators are provided in Table 3.
In some analysis, to provide additional information
for variation within NSW, hospital-level results
were calculated. In this case, non-overlapping
confidence intervals were used to flag hospitals
where confidence interval around the expected
values for the hospital was not overlapping with
that of NSW.
Standardised International comparisons
International data comparisons from both survey
and administrative data sources present
challenges due to differences in data collection,
definition and quality, as well as differences in
each country’s organisation of healthcare.
A synthesis of administrative data measures
based on values for international comparators
is also provided. NSW results were compared to
the range of available country values on a
normalised scale.
The scores are calculated for each country using
the formula ((x i-x )) x where x i is the result
for the country and x and x are, respectively,
the mean and standard deviation of the results of
all countries. Scores are transformed such that
the value greater than zero indicates better than
average performance. The interquartile range of
these transformed scores is shown in the grey
area [13][14].
Australian Bureau of Statistics: Patient Experience Survey and Cause of Death
The Australian Bureau of Statistics (ABS)
conducts an annual Patient Experience Survey, a
nation-wide population-based survey of patients’
experiences using the Australian health system.
The ABS provided BHI with a customised report
on NSW results for 2014–15. The sample of
27,341 people aged 15+ years was weighted to
represent the estimated population aged 15+
years in private dwellings in each state and
territory. Further information on survey and
analysis methods can be found in the ABS’s
survey methods documentation [4].
The ABS also provided a customised report on
causes of death in NSW for the calendar years
2009–2013. The report included age-standardised
rates of mortality and potential years of life lost for
selected causes of death, by sex and year of
death registration. Further information can be
found in the ABS’s methodological documentation
for its Causes of Death 2013 report [5].

Bureau of Health Information | Technical Supplement, Healthcare in Focus 2015 6
Australian Institute for Health and Welfare: Healthcare expenditures
The Australian Institute for Health and Welfare
(AIHW) provided a customised report of
healthcare expenditures stratified by finance,
provider and function categories according to the
OECD’s System of Health Accounts (SHA)
definitions. For more information, see the AIHW
annual report [6]. Other reports from AIHW on
hospital statistics and cancer screening [12] were
used throughout the report and referenced in
related figures.
Bureau of Health Information: NSW Patient Survey Program
BHI conducts a regular, comprehensive statewide
patient experience survey program. The NSW
Patient Survey Program collects information from
patients across NSW about their experiences with
a variety of healthcare services.
For this report, BHI used de-identified unit record
data from the survey program. The most recent
Adult Admitted Patient Survey includes responses
from 27,000 patients who were admitted to a
NSW public hospital between January and
December 2014 (adjusted response rate 43%).
The Emergency Department Patient Survey
includes18,301 patients of all ages who visited an
emergency department in a NSW public hospital
between April 2014 – March 2015 (adjusted
response rate 27%).
The SAS procedure SURVEYFREQ was used to
compute patient population estimates using
sampling and post-stratification weights provided
by IPSOS [1, 5]. Where the distribution of results
by hospital are provided, statistical differences
between a hospital and NSW result are noted if
the 95% confidence intervals of the two estimates
are not overlapping.
NSW Ministry of Health: Linked admitted patient, emergency department and fact of death data
The Centre for Epidemiology and Evidence (CEE)
at the NSW Ministry of Health maintains a data
warehouse called Secure Analytics for Population
Health Research and Intelligence (SAPHaRI) [5].
SAPHaRI holds records of hospital admissions,
emergency department presentations and fact of
death, each of which has been assigned a unique
person identifier. The person identifier is a
statistical linkage key generated by the Centre of
Health Record Linkage (CHeReL) using
probabilistic record linkage methods. Data linkage
allowed the computation of various statistics at a
patient level of analysis, such as unplanned
readmission rates. The linkage of these data
occurs on a six-monthly cycle. Further information
can be found at www.cherel.org.au. The linked
data at the time of analysis were available for the
2014–15 financial year. For the Admitted Patient
Data Collection, the most recent complete year of
data including private hospitals, was 2013–14.
An “episode” is a single record containing
information about a patient admitted to a hospital
or emergency department; information includes
patient demographics, date, conditions and
treatment or procedure received and the
Australian Refined-Diagnosis related group
(ARDRG) code. BHI calculated OECD indicators
based on episodes following specifications used
by AIHW in calculating the Australia values
provided to OECD. This term is used
interchangeably with “admission”, “separation”,
“discharge” and “hospitalisation” in other AIHW
and OECD reports. A “period of care” is not the
same as an episode. Periods of care identify
contiguous hospitalisation episodes within the
same or different hospitals into one single period
of care in order to follow an outcome of interest.
Periods of care are used in 30 day mortality and
return to acute care measures.
Bureau of Health Information | Technical Supplement, Healthcare in Focus 2015 7
Statistics calculated based on denominators
containing only hospitalisations exclude episodes
at Albury Base Hospital, since this facility is
administered by the Victorian Department of
Health. Statistics calculated as a rate per 100
or 100,000 population exclude non-residents
of NSW.
Where the distribution of results by hospital are
provided, statistical differences between a hospital
and NSW result are noted if the 95% confidence
intervals of the two estimates are not overlapping.
The variance is given by the standard variance for
a binomial distribution, with the exception of
Average length of stay estimates where non-
parametric ranking tests were performed.
NSW Ministry of Health: Hospital activity data (Health Information Exchange and Waiting List Collection Online System)
The NSW Ministry of Health maintains data
warehouses containing the most recent
accumulation of NSW hospital and health facility
activity data available. Inpatient and emergency
department presentation data are uploaded
weekly and become available for BHI analysis two
weeks later. Elective surgery waiting list data are
uploaded monthly and available two weeks later.
BHI, in conjunction with the NSW Ministry of
Health and other agencies, has developed various
measures of NSW public hospital admissions and
emergency department and elective surgery
activity and performance for hospitals with
electronic data available. These measures are
published in the BHI report series Hospital
Quarterly and are available on BHI’s online data
portal Healthcare Observer. The statistics
reported have been calculated for the 2014–15
financial year rather than for quarters. Hospital
Quarterly activity and performance statistics
exclude episodes at Albury Base Hospital, since
this facility is administered by the Victorian
Department of Health.

Bureau of Health Information | Technical Supplement, Healthcare in Focus 2015 8
Table 1 The Commonwealth Fund International Health Policy Survey of Primary Care Physicians 2015, number of respondents and response rates by country
Country Method Number of Respondents
Response Rate
Australia (New South Wales (n=401)
Phone/email/fax recruit to online 747 25.1%
Canada Postal mail recruit to online/mail 2,284 31.7%
France Phone (CATI) 502 8.1%
Germany Postal mail 559 18.7%
Netherlands Postal mail 618 40.6%
New Zealand Phone/email/fax recruit to online 503 27.7%
Norway Postal mail 864 44.4%
Sweden Postal mail recruit to online/mail 2,905 46.5%
Switzerland Postal mail recruit to online/phone (CATI)
1,065 39.0%
United Kingdom Phone recruit to phone (CATI)/online 1,001 39.4%
United States (excluding Alaska and Hawaii) Postal mail recruit to online/mail 1,001 30.9%
Table 2 The Commonwealth Fund International Health Policy Survey of Older Adults 2014, number of respondents and response rates by country
Country Number of respondents Response rate
Australia (including New South Wales) 3,310 31%
Canada 5,269 28%
France 1,500 29%
Germany 928 26%
Netherlands 1,000 25%
New Zealand 750 27%
Norway 1,000 16%
Sweden 7,206 23%
Switzerland 1,812 60%
United Kingdom 1,000 23%
United States (excluding Alaska and Hawaii) 1,755 24%
Bureau of Health Information | Technical Supplement, Healthcare in Focus 2015 9
Indicator specifications by chapter

Bureau of Health Information | Technical Supplement, Healthcare in Focus 2015 10
Table 3 Specifications for indicators calculated by BHI by chapter
Indicator Cohort description (numerator, denominator)
Further details (inclusions, exclusions, references)
Data source
Accessibility
Median time from emergency presentation to starting treatment, by urgency category
Cohort: Emergency presentations to NSW public hospital emergency departments
Time to treatment is the difference between arrival time and start of treatment time
Excludes:
Non-emergency presentations
Presentations for which their treatment was not started
Presentations that did not have a valid visit type, presentation time, start of treatment time or urgency category
For further details, see www.bhi.nsw.gov.au/publications/hospital_quarterly_nsw/technical_supplements_of_hospital_quarterly
NSW public hospital activity data; AIHW hospital statistics
Percentage of emergency department presentations leaving within four hours, by mode of separation
Denominator: All presentations to NSW public hospital emergency departments
Numerator: Denominator cases where the time between arrival at and departure from the ED was less than four hours
For further details, see www.bhi.nsw.gov.au/publications/hospital_quarterly_nsw/technical_supplements_of_hospital_quarterly
NSW public hospital activity data; AIHW hospital statistics
Median waiting times for elective surgery
Cohort: Patients removed from the elective surgery waiting list because they received their surgery
Waiting time: in days, the difference between patient’s listing date on the waiting list and date of their removal from the waiting list
For further details, see www.bhi.nsw.gov.au/publications/hospital_quarterly_nsw/technical_supplements_of_hospital_quarterly
Waiting list online collection system (WLCOS)
Percentage of patients’ surgeries completed in recommended time, by selected elective surgery type
Denominator: Count of procedures of a particular type performed
Numerator: Cases in the denominator with a waiting time less than recommended for the urgency category
For further details, see www.bhi.nsw.gov.au/publications/hospital_quarterly_nsw/technical_supplements_of_hospital_quarterly
Waiting list online collection system (WLCOS)
Appropriateness
Percentage of patients receiving hip fracture surgery within two days, for patients aged 65 years and over
Denominator: Episodes selected with principal diagnosis ICD-10-AM codes S72.0, S72.1 or S72.2 with a procedure performed
Numerator: Denominator cases where the difference between admission date and procedure date is less than or equal to two days
Excludes:
Patients under 65 years of age
Linked hospital activity data; OECD Health Statistics

Bureau of Health Information | Technical Supplement, Healthcare in Focus 2015 11
Indicator Cohort description (numerator, denominator)
Further details (inclusions, exclusions, references)
Data source
Percentage of deaths in hospital, Hospital and ED use in the period before death
Denominator: ABS deaths in NSW during 2006 and 2013
Numerators:
In hospital deaths, patients with at least one hospitalisation/ emergency presentation near end of life (within 30, 180 and 365 days of death), during 2006 and 2013 patients with at least one hospitalisation for Palliative care
Excludes:
Patients with hospitalisations/ emergency presentations more than three days after date of death
Non-emergency presentations
ABS deaths, Linked NSW Admitted Patient and the NSW Emergency Department Data Collections, and the NSW Register of Births, Deaths and Marriages
Effectiveness
Directly age-sex standardised hospitalisation rates for hospitalisations for chronic disease related conditions (COPD, Diabetes complications, Asthma, Heart failure)
Denominator: NSW estimated resident population aged 15 years and over at 30 June 2011
Numerator: Acute episodes of care with principal diagnosis ICD-10-AM codes for each condition as follows:
Asthma: J45, J46
COPD: J40*, J41, J42, J43, J44, J47
*J40 only qualifies if accompanied by J41, J43, J44 or J47
Congested Heart Failure: I11.0, I13.0, I13.2, I50.0, I50.1, I50.9
Diabetes : E10, E11,E13, E14
Diabetic amputation procedure: 44361-00, 44361-01, 44367-02, 44367-00, 44367-01, 44370-00, 44373-00
Standard population is the 2005 OECD resident population, as specified in Table 6
Excludes:
Non NSW residents
Transfers from another institution
Pregnancy/childbirth and puerperium episodes
Same-day discharge
Patients with cystic fibrosis or respiratory system anomalies (asthma only)
Patients with trauma (S78.0, S78.1, S78.9, S88.0, S88.1, S88..9, S98.0, S98.1, S98.2, S98.3, S98.4, T05.3, T05.4, T05.5, T13.6) or tumour related (C40.2, C40.3) (diabetic amputation only)
Linked admitted patient, emergency department presentation and fact of death data
Directly age-sex standardised mortality rate following hospitalisation for stroke, per 100 patients hospitalised
Denominator: Patients aged 45 years and over with principal diagnosis ICD-10-AM codes for each condition as follows:
Ischaemic stroke: I63, I64
Numerator: Cases in denominator that died in or out of hospital within 30 days of admission
Standard population is the 2010 OECD hospitalised population, as specified in Table 5
Results are included in the synthesis only.
Excludes:
Non NSW residents
Linked hospital activity data; OECD Health Statistics
Unadjusted hospitalisation rate, per 100,000 episodes, for foreign body left during procedure
Denominator: hospital episodes for patients aged 15 years and over
Numerator: Cases in denominator with secondary diagnosis ICD-10-AM codes T81.5, T81.6, Y61.0, Y61.1, Y61.2, Y61.3, Y61.4, Y61.5, Y61.6, Y61.7, Y61.8, Y61.9
Excludes:
Episodes with principal diagnosis of foreign body left during procedure
Same day discharge
Linked hospital activity data; OECD Health Statistics

Bureau of Health Information | Technical Supplement, Healthcare in Focus 2015 12
Indicator Cohort description (numerator, denominator)
Further details (inclusions, exclusions, references)
Data source
Unadjusted hospitalisation rate, per 100,000 surgical episodes, for post-operative pulmonary embolism or deep vein thrombosis
Denominator: Surgical episodes for patients aged 15 years and over
Numerator: Cases in denominator with secondary diagnosis ICD-10-AM codes I26.0, I26.9, I80.1, I80.2, I80.3, I80.8, I80.9, I82.8 or I82.9
More information on hip and knee procedure codes available upon request.
Excludes:
Episodes with principal diagnosis of pulmonary embolism or deep vein thrombosis
Episodes with procedure code ‘interruption of vena cava’ (ACHI procedure code 34800-00)
Pregnancy/childbirth and puerperium episodes
Episodes with length of stay less than 2 days
Linked hospital activity data; OECD Health Statistics
Unadjusted hospitalisation rate, per 100,000 surgical episodes, for post-operative sepsis
Denominator: Abdominal surgical episodes for patients aged 15 years and over
Numerator: Cases in denominator with secondary diagnosis ICD-10-AM codes A40.0, A40.1, A40.2, A40.3, A40.8, A40.9, A41.0, A41.1, A41.2, A41.3, A41.4, A41.5, A41.8, A41.9, R57.2, R57.8, R65.0, R65.1 or T81.1
More information on abdominal procedure codes available upon request.
Excludes:
Episodes with principal diagnosis of sepsis or infection
Immunocompromised patients
Cancer patients
Pregnancy/childbirth and puerperium episodes
Episodes with length of stay less than 3 days
Additional diagnosis codes for recording wound infection sepsis are available in the Australia modification of the ICD-10 (T81.42). For comparative purposes, this was excluded for international comparison. The post-operative sepsis cases excluded had minimal impact on the rate published.
Linked hospital activity data; OECD Health Statistics
Unadjusted rates of hospitalisation for obstetric trauma, per 100 vaginal deliveries, with and without instrument
Denominator: Vaginal deliveries for females aged 15 years and over
ICD-10-AM diagnosis codes: O80, O81, O83, O84, O84.0, O84.1, O84.8, O84.81, O84.82, O84.9
Numerator: Cases in denominator with ICD-10-AM diagnosis codes O70.2 or O70.3 or ACHI procedure code 16573-00
Method based on OECD definition
ACHI procedure codes for instrument-assisted delivery: 90468-00, 90468-01, 90468-02, 90468-03, 90468-04, 90468-05, 90469-00, 90469-01, 90470-01, 90470-02, 90470-04, 90474-00, 90475-00
Linked hospital activity data; OECD Health Statistics
Readmission: AMI CHF and COPD
See Spotlight on measurement
Return to acute care following hospitalisation, Insights into readmissions
http://www.bhi.nsw.gov.au/publications/spotlight_series
for AMI and CHF
See appendix B for COPD
Linked admitted patient and fact of death data

Bureau of Health Information | Technical Supplement, Healthcare in Focus 2015 13
Indicator Cohort description (numerator, denominator)
Further details (inclusions, exclusions, references)
Data source
Mortality: AMI, CHF, and COPD
See Spotlight on measurement
Measuring 30-day mortality following hospitalisation, Considering approaches for ongoing reporting in NSW
http://www.bhi.nsw.gov.au/publications/spotlight_series
for AMI
See appendix C for CHF and COPD
Linked admitted patient and fact of death data
Efficiency
Average length of stay (ALOS) for vaginal delivery and caesarean delivery
Maternal and child health register data was linked to admission records and the length of stay is calculated by subtracting the baby born date to the mother discharge date
Excludes:
Length of stay greater than 120 days
Linked hospital activity data and maternal and child health register data
The number of knee arthroscopy procedures
Denominator: Knee arthroscopy procedures on patients aged 50 years and over
Numerator: hospitalisation with ACHI procedure codes:
49557-00, 49503-00, 49560-03, 49562-01, 49561-01, 49557-02, 49558-00, 49558-01
Costs was estimated by multiplying the total length of stay of knee arthroscopy episodes with the average cost of knee arthroscopy per day, which derived from 2012-13 costing report round 17—public hospital cost estimated for ARDRG code Arthroscopy (I24Z)
Excludes:
patients under 50 years of age
Linked admitted patient data
Equity
Hospitalisation rates for removal or restoration of teeth
Denominator: children aged 1 to 4 years old.
Numerator: hospitalisations with ACHI procedure codes:
97411 - 97679 with K02 (Dental caries) in diagnosis code 1 (restoration of teeth) or
97311 - 97327 with K02 (Dental caries) in diagnosis code 1 (removal of teeth)
Excludes:
Non NSW residents
Linked admitted patient data
Frequent user of emergency departments
Count of emergency ED presentations recorded between 1 July 2014 and 30 June 2015 for each patient were categorised into 1, 2 and 3 or more presentations
Excludes:
Non NSW residents
Linked emergency department presentation
Frequent user of overnight hospitalisations
Count of overnight hospitalisations recorded between 1 July 2013 and 30 June 2014 for each patient were categorised into 1, 2 and 3 or
Excludes:
Non NSW residents
Baby born in hospital (ICD codes:
Linked admitted patient data

Bureau of Health Information | Technical Supplement, Healthcare in Focus 2015 14
Indicator Cohort description (numerator, denominator)
Further details (inclusions, exclusions, references)
Data source
more presentations 'Z38.0','Z38.3','Z38.6')
Calculations by socio-economic status.
In this report, the NSW population was divided into five groups based on the Index of Relative Socio-Economic Disadvantage (IRSD) scores of their postal area of residence. This means that postal areas were sorted by IRSD score and assigned to population-weighted quintiles, each containing close to one-fifth of the total population of NSW.
The denominator in each quintile was derived from ABS 2011 data of which each quintile contains roughly one-fifth of the total NSW population.
Excludes:
postal area is missing
postal area of the patient is not in NSW
Note: While the index of disadvantage is not a measure of socio-economic advantage, the language of high SES to represent the least disadvantaged quintile, and low SES to reflect the most disadvantaged quintile was used for ease of communication.
Table 4 Definitions and derived data items
Data item Description
NSW resident
NSW residents are identified in administrative data collections using the data field STATE OF RESIDENCE in SAPHaRI datasets. The data recorded in this field is taken directly from the relevant table in the Health Information Exchange data warehouse. Surveys use sampling methods that ensure persons surveyed are usual residents of NSW.
Transfers into a health facility
Episodes of care that begin with a transfer in from a previous hospital are identified using BHI’s method of collapsing contiguous episodes of care linked by a unique patient identifier into a period of care. As such, transfers can be identified by the absence of a subsequent episode that meets the criteria.
Same day discharge/day only admission
A same day discharge is identified by equal episode start and end dates.
Length of stay An episode’s length of stay is calculated as the difference between the episode end date and the episode start date minus total episode leave days. This definition is specified in the AIHW Health Minimum dataset. The quantity is derived in SAPHaRI datasets.
Chronic condition
The chronic condition cohort includes patients with the following conditions: hypertension or high blood pressure, heart disease (including heart attack), diabetes, asthma or chronic lung disease (such as chronic bronchitis, emphysema or COPD), depression, anxiety or other mental health problems, cancer, joint pain or arthritis.
Area of usual residence Area of usual residence is used to attach an index of socio-economic status and remoteness category to where a patient lives.
Hospital in the Home (HITH)
In NSW, Hospital in the Home (HITH) is defined as the range of service delivery models providing acute and post-acute care that is delivered in home (including Residential Aged Care Facilities), clinic or other settings as a substitution or avoidance of hospital [NSW Health, NSW Hospital in the Home (HITH) Guideline].

Bureau of Health Information | Technical Supplement, Healthcare in Focus 2015 15
Table 5 OECD standard hospitalised population 2010 [6]
Age group Male Female Total
45–49 74,148 20,572 94,720
50–54 108,762 29,478 138,240
55–59 127,052 38,458 165,511
60–64 136,650 51,020 187,670
65–69 125,408 58,289 183,697
70–74 124,159 71,511 195,670
75–79 113,769 85,892 199,661
80–84 95,557 95,372 190,929
85+ 83,829 132,234 216,063
Total 989,333 582,826 1,572,160
Table 6 OECD standard resident population, 2005, by age group and sex [6]
Age group Male Female Total
15–19 40,625,795 38,773,417 79,399,212
20–24 41,743,145 40,258,194 82,001,339
25–29 41,941,848 40,948,668 82,890,516
30–34 43,389,484 42,704,755 86,094,239
35–39 43,371,817 42,895,601 86,267,418
40–44 43,161,119 43,109,483 86,270,602
45–49 40,248,518 40,649,038 80,897,556
50–54 36,427,644 37,364,408 73,792,052
55–59 33,380,411 34,689,310 68,069,721
60–64 26,289,839 28,254,493 54,544,332
65–69 22,346,079 25,279,333 47,625,412
70–74 18,074,327 22,236,819 40,311,146
75–79 13,607,727 19,097,765 32,705,492
80–84 8,425,270 14,684,935 23,110,205
85+ 5,282,533 12,504,426 17,786,959
Total 458,315,556 483,450,645 941,766,201

Bureau of Health Information | Technical Supplement, Healthcare in Focus 2015 16
Appendix A: OECD country comparison data tables The analysis of Healthcare in Focus places NSW in an international context focusing on Australia and 10
other countries: Canada, France, Germany, the Netherlands, New Zealand, Norway, Sweden, Switzerland,
the United States and the United Kingdom. In addition, data for the remaining 23 of the 34 OECD countries
(Austria, Belgium, Chile, the Czech Republic, Denmark, Estonia, Finland, Greece, Hungary, Iceland, Ireland,
Israel, Italy, Japan, Korea, Luxembourg, Mexico, Poland, Portugal, the Slovak Republic, Slovenia, Spain and
Turkey) was obtained for a broader perspective of performance across a range of measures.
A summary of values used in the report summary figures is provided in Table A.1 and A.2. Country data
is available at (http://stats.oecd.org/index.aspx?DataSetCode=HEALTH_STAT) including detail on years
and methods.
Table A.1 Indicator values for NSW and available country comparators, 2013 or nearest (Part 1 of 2)
Cata
ract
extr
acti
on
med
ian
wait
(d
ay
s)
Hip
re
pla
cem
en
t
su
rgery
med
ian
wait
(day
s)
Kn
ee r
ep
lacem
en
t
su
rgery
med
ian
wa
it
(days
)
(%)
Infl
ue
nza s
ho
t
(% o
f a
ge
d 6
5+
)
Vaccin
ati
on
in
ch
ild
ren
(%
)
Hip
fra
ctu
re s
urg
ery
wit
hin
tw
o d
ays
(%
o
f ag
ed
65+
)
Caes
are
an
se
cti
on
(% o
f b
irth
s)
Co
ng
esti
ve
heart
fail
ure
ho
sp
ita
lis
ati
on
rate
per
100
,00
0
po
pu
lati
on
Asth
ma
ho
sp
ita
lis
ati
on
rate
per
100
,00
0
po
pu
lati
on
Dia
bete
s
am
pu
tati
on
rate
per
100
,00
0 p
op
ula
tio
n
CO
PD
ho
sp
ita
lis
ati
on
s
rate
per
10
0,0
00
po
pu
lati
on
NSW 222 207 291 71 91.4 70 31.5 220 58.3 4.13 311
Australia 79 106 194 74.6 91
32.1 240 64.7 4.48 324
Canada 48 87 98 64.1 96 92 26.3 179 14.9 7.43 243
France
51.9 99
20.8 238 30.3 7.46 120
Germany
58.6 96 87.6 30.9 382 22.6 9.15 245
Netherlands
68.8 97 95.2 15.6 199 31.2 4.71 164
New Zealand 74 87 95 69 92 82.3 25.8 228 72.2 5.93 325
Norway 100 135 164 20.8 94 89.3 16.5 175 25.6 5.67 222
Sweden
45.8 98 93 16.4 300 22.8 4.07 192
Switzerland
46 96 85.9 32.5 174 12.7 3.1 101
United Kingdom 61 75 79 75.5 96 87.6 23 99.4 60.5 3.11 213
United States
66.5 94
32.5 367 103
216
Austria
36.1 83 84.4 28.8 283 43.6
305
Belgium
58 99 84.3 20.2 183 34.2 4.81 211
Chile 154 232 154 76.5 91
44.7 119 20.6
118
Czech Rep.
22.1 99 85.4 26.1 415 37
159
Denmark 61 41 48 45.6 94 95.8 22.2 154 45.9 8.52 288
Estonia 83 145 229 1.1 94 80.9 20.1
36.9
307
Finland 87 103 123 41 98 85.8 15.8 278 60.8
132
Hungary 39 75 114 36.7 99 88.3 35.3 441 73.3
354
Iceland
91 95.8 15.2 197 20.8 3.5 206
Ireland
59.2 96 82.3 28.5 175 41.3 3.24 395
Israel 58 56 82 61.2 94 84.8 15.4 234 54.1 15.9 207
Italy
54.2 97 44.8 36.1 268 9.76 2.71 69.8
Japan
50 98
137 34.7
23.5
Korea
77.4 99
36 102 98.5 2.43 212
Latvia
95 49.9
95.2
162
Luxembourg
43.3 99
26.8
25.2 3.47 166
Mexico
78.5 83
45.2 74 12.8
106
Poland 371 221 328 12.1 99
34.6 548 80.3
181
Portugal 66.7 82.4 182 49.9 98 45 35 195 16.9 11.9 72
Slovak Rep.
15.6 98
30.7 437 109
170
Slovenia
13 95 61.9 19.5 306 42.6 15.3 108
Spain 97 130 162 56.4 96 43.3 25.2 206 42 6.7 194
Notes: Hospitalisation rates are age-sex standardised rates for the population aged 15 years and over. COPD: Chronic Obstructive Pulmonary Disease. Most data is for 2011, 2012
and 2013 in a few cases values are for 2008 and 2009.
Bureau of Health Information | Technical Supplement, Healthcare in Focus 2015 17
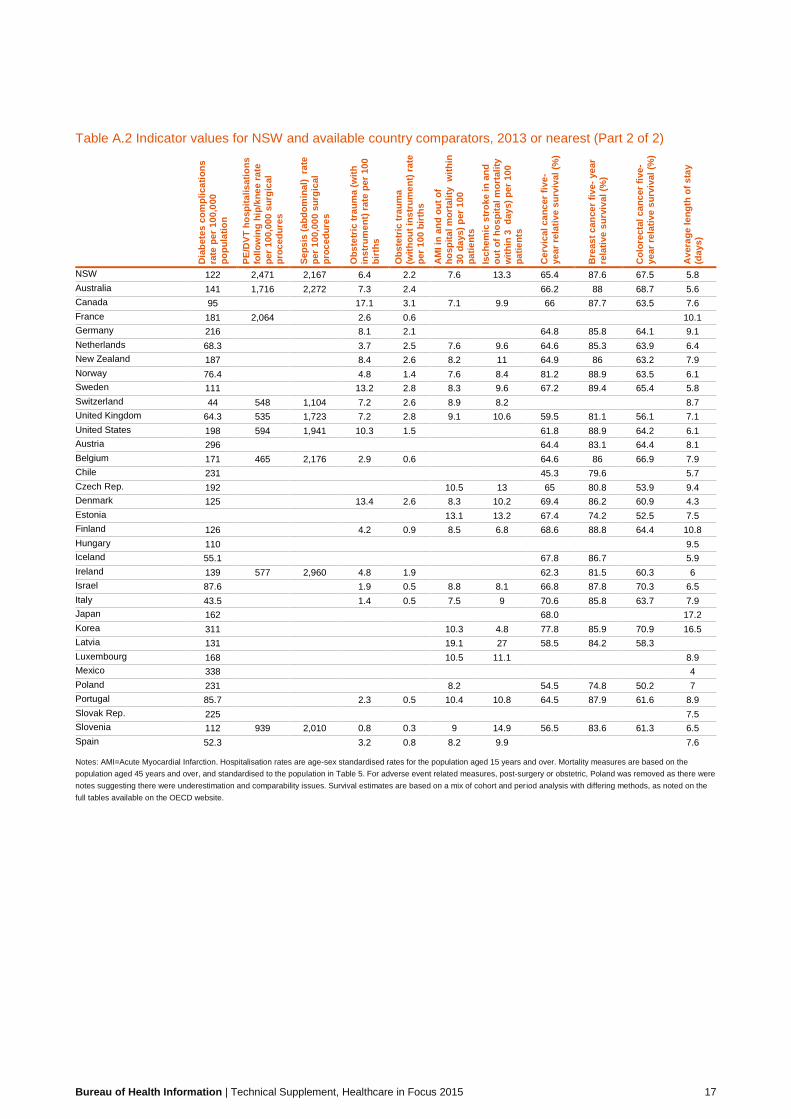
Table A.2 Indicator values for NSW and available country comparators, 2013 or nearest (Part 2 of 2)
Dia
bete
s c
om
pli
ca
tio
ns
rate
per
10
0,0
00
po
pu
lati
on
PE
/DV
T h
osp
ita
lis
ati
on
s
foll
ow
ing
hip
/kn
ee r
ate
per
100
,00
0 s
urg
ical
pro
ced
ure
s
Sep
sis
(a
bd
om
inal)
ra
te
per
100
,00
0 s
urg
ical
pro
ced
ure
s
Ob
ste
tric
tra
um
a (
wit
h
ins
tru
me
nt)
ra
te p
er
10
0
bir
ths
Ob
ste
tric
tra
um
a
(wit
ho
ut
ins
tru
me
nt)
ra
te
per
100
bir
ths
AM
I in
an
d o
ut
of
ho
sp
ita
l m
ort
ali
ty
wit
hin
30 d
ays)
per
100
pa
tie
nts
Isc
hem
ic s
tro
ke i
n a
nd
ou
t o
f h
os
pit
al m
ort
ali
ty
wit
hin
3
day
s)
per
100
pa
tie
nts
Cerv
ical
ca
nc
er
five
-
year
rela
tiv
e s
urv
ival
(%)
Bre
as
t c
an
cer
fiv
e-
ye
ar
rela
tive
su
rviv
al
(%)
Co
lore
cta
l ca
nc
er
five
-
year
rela
tiv
e s
urv
ival
(%)
Avera
ge l
en
gth
of
sta
y
(days
)
NSW 122 2,471 2,167 6.4 2.2 7.6 13.3 65.4 87.6 67.5 5.8
Australia 141 1,716 2,272 7.3 2.4
66.2 88 68.7 5.6
Canada 95
17.1 3.1 7.1 9.9 66 87.7 63.5 7.6
France 181 2,064
2.6 0.6
10.1
Germany 216
8.1 2.1
64.8 85.8 64.1 9.1
Netherlands 68.3
3.7 2.5 7.6 9.6 64.6 85.3 63.9 6.4
New Zealand 187
8.4 2.6 8.2 11 64.9 86 63.2 7.9
Norway 76.4
4.8 1.4 7.6 8.4 81.2 88.9 63.5 6.1
Sweden 111
13.2 2.8 8.3 9.6 67.2 89.4 65.4 5.8
Switzerland 44 548 1,104 7.2 2.6 8.9 8.2
8.7
United Kingdom 64.3 535 1,723 7.2 2.8 9.1 10.6 59.5 81.1 56.1 7.1
United States 198 594 1,941 10.3 1.5
61.8 88.9 64.2 6.1
Austria 296
64.4 83.1 64.4 8.1
Belgium 171 465 2,176 2.9 0.6
64.6 86 66.9 7.9
Chile 231
45.3 79.6
5.7
Czech Rep. 192
10.5 13 65 80.8 53.9 9.4
Denmark 125
13.4 2.6 8.3 10.2 69.4 86.2 60.9 4.3
Estonia
13.1 13.2 67.4 74.2 52.5 7.5
Finland 126
4.2 0.9 8.5 6.8 68.6 88.8 64.4 10.8
Hungary 110
9.5
Iceland 55.1
67.8 86.7
5.9
Ireland 139 577 2,960 4.8 1.9
62.3 81.5 60.3 6
Israel 87.6
1.9 0.5 8.8 8.1 66.8 87.8 70.3 6.5
Italy 43.5
1.4 0.5 7.5 9 70.6 85.8 63.7 7.9
Japan 162
68.0 17.2
Korea 311
10.3 4.8 77.8 85.9 70.9 16.5
Latvia 131
19.1 27 58.5 84.2 58.3
Luxembourg 168
10.5 11.1
8.9
Mexico 338
4
Poland 231
8.2
54.5 74.8 50.2 7
Portugal 85.7
2.3 0.5 10.4 10.8 64.5 87.9 61.6 8.9
Slovak Rep. 225
7.5
Slovenia 112 939 2,010 0.8 0.3 9 14.9 56.5 83.6 61.3 6.5
Spain 52.3
3.2 0.8 8.2 9.9
7.6
Notes: AMI=Acute Myocardial Infarction. Hospitalisation rates are age-sex standardised rates for the population aged 15 years and over. Mortality measures are based on the
population aged 45 years and over, and standardised to the population in Table 5. For adverse event related measures, post-surgery or obstetric, Poland was removed as there were
notes suggesting there were underestimation and comparability issues. Survival estimates are based on a mix of cohort and period analysis with differing methods, as noted on the
full tables available on the OECD website.

Bureau of Health Information | Technical Supplement, Healthcare in Focus 2015 18
Appendix B: Risk standardised 30-day return to acute care following hospitalisation for chronic obstructive pulmonary disease
The condition
Chronic obstructive pulmonary disease (COPD) is a long-term lung disease, associated with prolonged
exposure to tobacco smoke. While no existing treatment can cure COPD, it can be effectively managed
outside the hospital setting with appropriate and timely care.
Between July 2009 and June 2012, 44,363 COPD index hospitalisations were included in the analyses. Of
these, 9,404 (22%) were followed by an unplanned readmission within 30 days of discharge.
The indicator
The risk standardised readmission ratio (RSRR) provides a fair comparison of a particular hospital’s results
in returns to acute care given its case mix with an average NSW hospital with the same case mix.
Data sources
Data are drawn from the NSW Ministry of Health’s Health Information Exchange (HIE) and NSW Registry of
Births, Deaths and Marriages, and probabilistically linked by the Centre for Health Record Linkage
(CheReL). Data are accessed via SAPHaRI, Centre for Epidemiology and Evidence, NSW Ministry of Health.
Calculation
The ratio of the observed number of emergency returns to acute care (numerator) to the expected number of
emergency returns to acute care (denominator) within 30 days following discharge from COPD index
admissions at a given hospital.
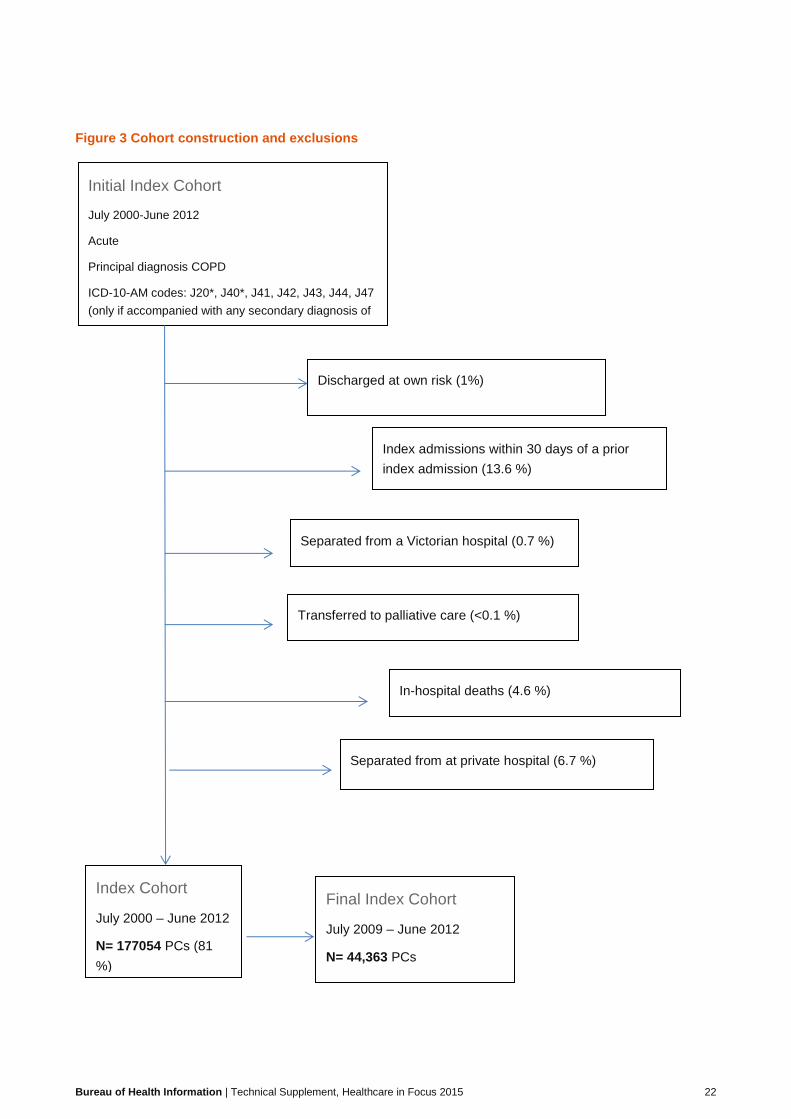
Cohort index admissions
An index admission is the hospitalisation included in calculating RSRRs for the condition of interest. The
index admissions form the ‘cohort’ for assessing returns to acute care (Figure 3).
Inclusions
• Principal diagnosis of COPD: J20*, J40*, J41, J42, J43, J44, J47 (*only if accompanied by
secondary diagnosis of J41-J44, J47)
• Aged 45 years or over
• Admissions to acute care
• Discharged between 1 July 2009 and 30 June 2012.
Exclusions
• Index admissions with mode of separation ‘Discharged at own risk’, as the hospital would not be able
to complete treatment or discharge planning
• Index admissions within 30 days of a prior index admission (any admission within 30 days
following discharge from an index admission is considered a readmission)
• Discharges from NSW hospitals administered by agencies external to NSW
• Index admissions with mode of separation ‘Transferred to palliative care’
Bureau of Health Information | Technical Supplement, Healthcare in Focus 2015 19
• Index admissions ending with an in-hospital death
• Discharges from a private hospital.
Periods of care and transfers
Multiple acute, contiguous hospitalisations are considered as a single, acute period of care. Acute
admissions on the same day of separation from another acute hospitalisation are included in the same acute
period of care, regardless of the mode of separation at the previous hospitalisation. If an acute admission is
coded as ending in a transfer, and there is another acute admission within one day of that transfer, the
second admission is concatenated into the same period of care.
Numerator
Observed number of hospital-level returns to acute care, where an emergency return to acute care meets
the following criteria:
• All-cause hospitalisations within 30 days following discharge from a COPD index admission
• Acute and emergency hospitalisations
• Admitted to any NSW hospital (public or private).
In cases where more than one emergency return to acute care occurs within 30 days of an index admission,
only the first readmission is counted.
Denominator
Expected number of emergency returns to acute care at a given hospital, on the basis of an average NSW
hospital’s performance with the same case mix, calculated as the sum of the estimated probabilities of
emergency returns to acute care using a NSW-level prediction model.
Attributions of index admissions and emergency returns to acute care
In case of patient transfers, index admissions and emergency returns to acute care are attributed to the last
hospital that discharged the patient to a non-acute care setting.
When there is a non-emergency overnight acute rehospitalisation in the 30 days following discharge from the
index admission, and preceding the first emergency return to acute care, no return is assigned to that index
admission.
Transfers to non-acute care
Periods of care include acute hospitalisations only. A transfer from acute to non-acute care, within the same
or to a different hospital, is considered to be a discharge. Should the patient then be transferred from non-
acute care as an acute, emergency return to acute care within 30 days of discharge, it will be considered as
a return to acute care. The return to acute care is attributed to the hospital which discharged the patient from
acute to non-acute care.
Development and validation of the prediction model
The NSW-level prediction model is developed using Fine & Gray competing risks regression models
adjusting for patient-level risk factors, and taking into account the competing risk of death. The standard
errors are adjusted for within hospital correlations.
A backward modelling approach is used to build the multivariable regression models. Variables significant at
20 percent level in the univariate analysis are considered for inclusion in multivariable models. Only variables
with a 2-sided p-value of less than 0.05 in the multivariable models are retained in the final model.
Risk adjustment variables

Bureau of Health Information | Technical Supplement, Healthcare in Focus 2015 20
The following variables are included in the development of the prediction models:
• Age at index admission
• Sex
• Elixhauser comorbidities, dementia and history of COPD with a one year look back period
The final prediction model is shown in Table 1. The prediction ability of the model is assessed using c-
statistics in data from previous financial years (Figure 1). The stability of the coefficients in previous financial
years is also tested (Figure 2). The clinical relevance of the variables in the final model and their direction of
association with the outcome are reviewed by clinicians. The model’s C-statistic was 0.65, and its
performance was relatively stable over different financial years.
Table 1: Prediction model, return to acute care within 30 days of discharge using Fine and Gray
competing risks regression models, July 2009-June 2012
Risk factors
Subhazard
ratio p-value 95% Conf.Interval
Age 1.01 0.000 1.00 1.01
Female versus male 0.87 0.000 0.83 0.91
History of COPD 1.84 0.000 1.76 1.91
Congestive heart failure 1.25 0.000 1.19 1.32
Cardiac arrhythmia 1.07 0.012 1.02 1.14
Pulmonary circulation disorders 1.09 0.039 1.00 1.19
Hypertension 1.12 0.000 1.06 1.19
Renal failure 1.15 0.002 1.05 1.26
Liver disease 1.28 0.001 1.10 1.48
Solid tumour*(without metastasis) 1.31 0.000 1.19 1.45
Weight loss 1.20 0.000 1.12 1.29
Fluid and electrolyte disorders 1.17 0.000 1.11 1.23
Blood loss anaemia 1.28 0.046 1.00 1.64
Alcohol abuse 1.16 0.009 1.04 1.30
Drug abuse 1.48 0.000 1.25 1.74
Psychoses 1.30 0.009 1.07 1.58
Depression 1.18 0.000 1.08 1.29

Bureau of Health Information | Technical Supplement, Healthcare in Focus 2015 21
Figure 1: Model performance (C-statistics) over different time periods
Reference period c-statistics
July 2009-June 2012 0.65
Validation period Method 1 Method 2
July 2006-June 2009 0.64 0.64
July 2003-June 2006 0.64 0.64
July 2000-June 2003 0.63 0.63
Method 1: using July 2009-June 2012 coefficients
Method 2: using recalibrated coefficients
Figure 2: Stability of the prediction model coefficients
Index admissions with less than 30 days of follow-up information
Calculation of unadjusted rates of return to acute care and hospital RSRRs excludes index cases that
occurred less than 30 days from the end of the study period (30 Jun 2012) to avoid introducing bias with a
truncated follow-up period. However, as competing risk regression models take into account different follow
up periods, index admissions without a full 30 days of follow-up information are included to build the NSW
prediction models.
-0.500
0.000
0.500
1.000
1.5002009-2012 2006-2008 2003-2005 2000-2002
Bureau of Health Information | Technical Supplement, Healthcare in Focus 2015 22
Figure 3 Cohort construction and exclusions
Index Cohort
July 2000 – June 2012
N= 177054 PCs (81
%)
Initial Index Cohort
July 2000-June 2012
Acute
Principal diagnosis COPD
ICD-10-AM codes: J20*, J40*, J41, J42, J43, J44, J47
(only if accompanied with any secondary diagnosis of
J41-J44, J47)
N= 217,836 periods of care
July 2000 – June 2011
N=159190
Discharged at own risk (1%)
Index admissions within 30 days of a prior
index admission (13.6 %)
Separated from a Victorian hospital (0.7 %)
Transferred to palliative care (<0.1 %)
In-hospital deaths (4.6 %)
Final Index Cohort
July 2009 – June 2012
N= 44,363 PCs
Separated from at private hospital (6.7 %)

Bureau of Health Information | Technical Supplement, Healthcare in Focus 2015 23
Appendix C: Risk standardised 30-day mortality (all cause) following hospitalisation for chronic obstructive pulmonary disease, and congestive heart failure
The conditions
Chronic obstructive pulmonary disease (COPD) is a long-term lung disease, associated with prolonged
exposure to tobacco smoke. In 2013, COPD accounted for 1,907 deaths in NSW (4% of deaths).
Congestive heart failure (CHF) occurs when the heart is unable to keep up with the demands of, or provide
adequate blood flow to, other organs. It often develops as a result of hypertension, diabetes or other
coronary heart diseases. In 2013, CHF accounted for 1,104 deaths in NSW (2% of deaths).
The indicator – risk standardised mortality ratios
Risk-standardised mortality ratios (RSMRs) can provide important information about healthcare system
performance. Hospital variation in mortality, after adjusting for patient case mix, points to differences in
processes or delivery of care. The indicator is based on statewide mortality data and uses a statistical model
to identify patient level characteristics associated with 30-day mortality, and to quantify the effect of those
characteristics on the likelihood of death within 30 days of hospitalisation. This information is then applied to
each hospital’s patient population, adjusting for the presence of the characteristics shown to affect the
likelihood of death. This results in an ‘expected’ number of deaths for each hospital which is then compared
to the ‘observed’ number of deaths that actually occurred (O/E). Ratios greater than 1.0 indicate higher than
expected mortality and ratios less than 1.0 indicate lower than expected mortality. Ratios close to 1.0 are not
generally considered to be meaningful and funnel plots are used to interpret the results.
Cohorts
The cohort for the indicators consists of patients aged 45 years or over who were discharged between 1 July
2009 and 30 June 2012 with an acute, emergency admission for a principal diagnosis of the condition of
interest (Figures 1 and 2).
For COPD, ICD-10 codes: J20*, J40*, J41, J42, J43, J44, J47
For CHF, ICD-10 codes: I11.0, I13.0, I13.2, I50.0, I50.1, I50.9
*only if accompanied by secondary diagnosis of J41-J44, J47
For each condition, a patient is counted once only. This is possible through the use of linked data based on a
probabilistically assigned unique patient identifier, which is generated by statistical linkage with a false
positive rate of 3 in 1,000 records (0.3%).
In the period July 2009 to June 2012, there were 28,700 patients hospitalised for COPD, and 25,437 patients
hospitalised for CHF one or more times.
Of these, 3,029 (11%) died within 30 days of their last hospitalisation for COPD, and 3,770 (15%) died within
30 days of their last hospitalisation for CHF.

Bureau of Health Information | Technical Supplement, Healthcare in Focus 2015 24
Data sources
Data were drawn from the NSW Ministry of Health’s Health Information Exchange (HIE) and NSW Registry
of Births, Deaths and Marriages, and probabilistically linked by the Centre for Health Record Linkage
(CheReL). Data were accessed via SAPHaRI, Centre for Epidemiology and Evidence, NSW Ministry of
Health.
Attribution
Multiple acute, contiguous hospitalisations are considered as a single, acute period of care. Regardless of
subsequent transfers to other facilities, patients and their outcomes are attributed to the hospital to which
patients were initially admitted for an acute period of care, for the condition of interest. This admission is the
starting point for the 30-day follow-up interval. If patients had more than one period of care for a condition
during the specified financial years, their last period of care for that condition was selected.
Risk adjustment
For each (de-identified) patient, demographic information and recorded Elixhauser comorbidities were
obtained from the Admitted Patients Data Collection extending 12 months prior to, and including, the
hospitalisation under consideration (index admission). A random intercept logistic regression approach was
used to develop a prediction model. The model adjusts for patient level risk factors, and also accounts for
within hospital correlations. Only those variables that were shown to have a significant impact on mortality
(P<0.05) were retained in the final model. The clinical relevance of the variables in the final model and their
direction of association with the outcome were reviewed by clinicians.
The model calculates the expected mortality for each hospital. The final condition-specific prediction models
are shown in Tables 1 and 2. Our approach to risk adjustment is consistent with that deemed appropriate for
a publicly reported outcome measure in the research literature.

Bureau of Health Information | Technical Supplement, Healthcare in Focus 2015 25
Figure 1 Cohort, chronic obstructive pulmonary disease (COPD)
1
2
3
4
Patients discharged between July 2009 and June 2012, with an
ICD10_AM principal diagnosis code of J20*, J40*, J41, J42, J43, J44,
J47
(*only if accompanied by secondary diagnosis of J41-J44, J47)
N= 32069
July 2000 – June 2011
N=159190
Exclude other than acute,
emergency care
N=2190
Exclude patients
aged < 45
N=924
Exclude period of care
started prior to study
period
N=7
Remove Albury Base
(Victorian jurisdiction)
N=248
Index cases: chronic obstructive
pulmonary disease
N= 28700

Bureau of Health Information | Technical Supplement, Healthcare in Focus 2015 26
Figure 2 Cohort, congestive heart failure (CHF)
1
2
3
4
Patients discharged between July 2009 and June 2012, with an
ICD10_AM principal diagnosis code of I11.0, I13.0, I13.2, I50.0, I50.1,
I50.9
N= 29201
July 2000 – June 2011
N=159190
Exclude other than acute,
emergency care
N=3074
Exclude patients
aged < 45
N=461
Exclude period of care
started prior to study
period
N=5
Remove Albury Base
(Victorian jurisdiction)
N=160
Index cases: congestive heart
failure
N= 25437

Bureau of Health Information | Technical Supplement, Healthcare in Focus 2015 27
Table 1: Chronic obstructive pulmonary disease: predictors of mortality within 30 days of admission using
random intercept logistic regression model, July 2009 – June 2012
Risk factors Odds Ratio P>z
[95% Conf. Interval]
Number of previous acute hospitalisations for COPD*
One versus zero 1.66 <0.001 (1.50 1.83)
Two versus Zero 2.02 <0.001 (1.76 2.31)
Three or more versus zero 2.89 <0.001 (2.56 3.27)
Female versus male 0.82 <0.001 (0.76 0.89)
Age** (per year increase) 1.03 <0.001 (1.03 1.04)
Age squared 1.00 0.038 (1.00 1.00)
Congestive heart failure 1.43 <0.001 (1.30 1.57)
Cardiac arrhythmia 1.11 0.034 (1.01 1.21)
Pulmonary circulation disorders 1.63 <0.001 (1.43 1.85)
Other neurological disorders 1.44 0.001 (1.16 1.79)
Diabetes, complicated 0.87 0.033 (0.76 0.99)
Liver disease 1.97 <0.001 (1.49 2.59)
Lymphoma 1.60 0.047 (1.01 2.54)
Metastatic cancer 3.17 <0.001 (2.46 4.10)
Solid tumour without metastasis 1.43 <0.001 (1.18 1.74)
Weight loss 1.76 <0.001 (1.57 1.97)
Fluid and electrolyte disorders 1.74 <0.001 (1.59 1.90)
Psychoses 2.14 <0.001 (1.50 3.05)
*contiguous hospitalisation episodes for COPD are counted once, acute episodes with a principal diagnosis
of COPD are considered
**age is centred around the mean
Bureau of Health Information | Technical Supplement, Healthcare in Focus 2015 28
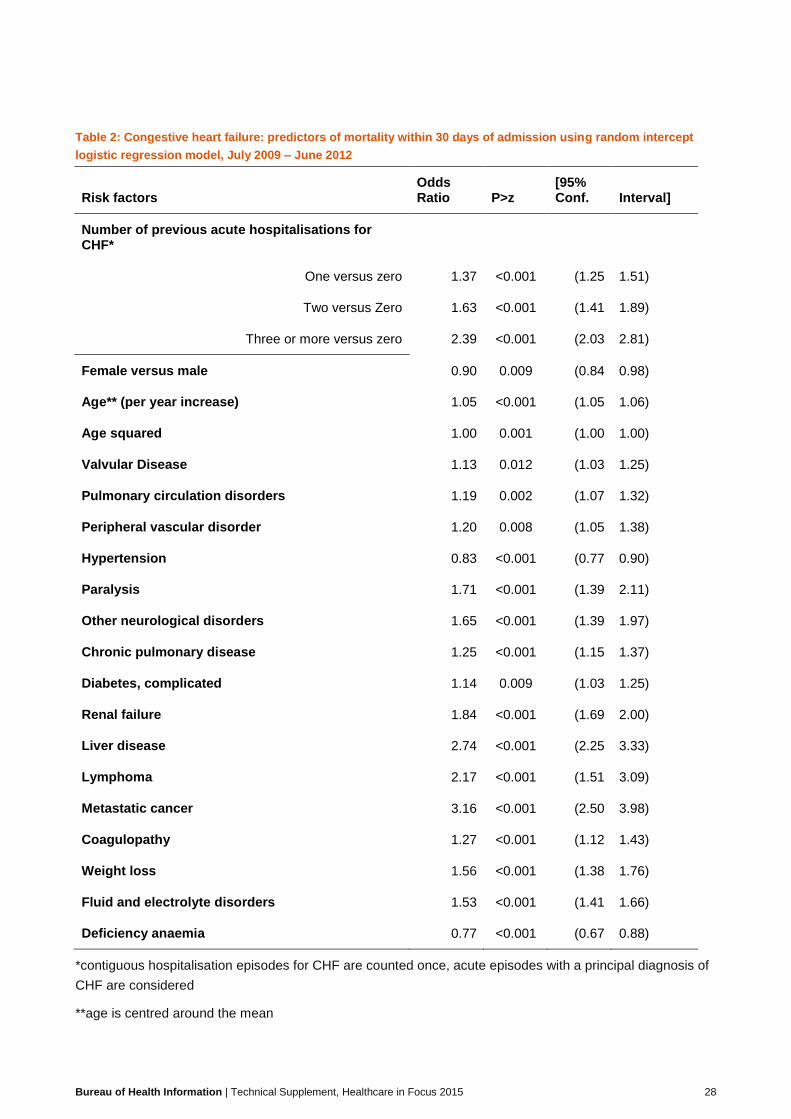
Table 2: Congestive heart failure: predictors of mortality within 30 days of admission using random intercept
logistic regression model, July 2009 – June 2012
Risk factors Odds Ratio P>z
[95% Conf. Interval]
Number of previous acute hospitalisations for CHF*
One versus zero 1.37 <0.001 (1.25 1.51)
Two versus Zero 1.63 <0.001 (1.41 1.89)
Three or more versus zero 2.39 <0.001 (2.03 2.81)
Female versus male 0.90 0.009 (0.84 0.98)
Age** (per year increase) 1.05 <0.001 (1.05 1.06)
Age squared 1.00 0.001 (1.00 1.00)
Valvular Disease 1.13 0.012 (1.03 1.25)
Pulmonary circulation disorders 1.19 0.002 (1.07 1.32)
Peripheral vascular disorder 1.20 0.008 (1.05 1.38)
Hypertension 0.83 <0.001 (0.77 0.90)
Paralysis 1.71 <0.001 (1.39 2.11)
Other neurological disorders 1.65 <0.001 (1.39 1.97)
Chronic pulmonary disease 1.25 <0.001 (1.15 1.37)
Diabetes, complicated 1.14 0.009 (1.03 1.25)
Renal failure 1.84 <0.001 (1.69 2.00)
Liver disease 2.74 <0.001 (2.25 3.33)
Lymphoma 2.17 <0.001 (1.51 3.09)
Metastatic cancer 3.16 <0.001 (2.50 3.98)
Coagulopathy 1.27 <0.001 (1.12 1.43)
Weight loss 1.56 <0.001 (1.38 1.76)
Fluid and electrolyte disorders 1.53 <0.001 (1.41 1.66)
Deficiency anaemia 0.77 <0.001 (0.67 0.88)
*contiguous hospitalisation episodes for CHF are counted once, acute episodes with a principal diagnosis of
CHF are considered
**age is centred around the mean

Bureau of Health Information | Technical Supplement, Healthcare in Focus 2015 29
Validity analyses
The model’s performance was assessed in terms of discriminant ability using the area under the receiver
operating characteristic (ROC) curve (C-statistic) - a summary statistic for assessing model performance.
The C-statistic is an indicator of the model's discriminant ability, that is, its ability to correctly classify those
who have and have not died within 30 days of hospitalisation.
The model’s C-statistic was 0.74 for COPD, and 0.72 for CHF (Figures 3 and 4).
The reported C-statistics by the Yale group in US was 0.72 for COPD, and 0.68 for CHF mortality.
The models were validated by calculating C-statistics for data from previous financial years (2003-2005 and
2006-2008), and assessing the change to the estimated parameters (Figures3-6). The models’ performance
was stable over three discrete sets of three financial year periods.
Figure 3 COPD model performance (C-statistics) over different time periods
Reference period
July 2009-June 2012 0.74
Validation period Method 1 Method 2
July 2006-June 2009 0.73 0.73
July 2003-June 2006 0.73 0.73
Figure 4 CHF model performance (C-statistics) over different time periods
Reference period
July 2009-June 2012 0.72
Validation period Method 1 Method 2
July 2006-June 2009 0.70 0.70
July 2003-June 2006 0.69 0.70
Method 1: using July 2009-June 2012 coefficients
Method 2: using recalibrated coefficients

Bureau of Health Information | Technical Supplement, Healthcare in Focus 2015 30
Figure 5 COPD: stability of the prediction model coefficients
Figure 6 CHF: stability of the prediction model coefficients
-0.50
0.00
0.50
1.00
1.50 July 2009-June 2012 July 2006-June 2009 July 2003-June 2006
-0.5
0
0.5
1
1.5 July 2009-June 2012 July 2006-June 2009 July 2003-June 2006
Bureau of Health Information | Technical Supplement, Healthcare in Focus 2015 31
References [1] SAS Institute. The SAS System for Windows, version 9.2 Cary (NC). SAS Institute, 2005. (Note: SAS and
all other SAS Institute Inc. product or service names are registered trademarks or trademarks of SAS
Institute Inc. in the USA and other countries. ® indicates USA registration).
[2] SSRS. International Health Policy Survey 2014 Methodology Report [Unpublished].
[3] Osborn R, Moulds D, Squires M, Doty M, Anderson C. International Survey Of Older Adults Finds
Shortcomings In Access, Coordination, And Patient-Centered Care. Health Affairs 2014;33(12): 2247-2255.
[4] Australian Bureau of Statistics. Patient Experiences in Australia: Summary of Findings, 2013-14 [online]
[cited 14 March 2015]. Available from:
http://www.abs.gov.au/AUSSTATS/[email protected]/Lookup/4839.0Explanatory%20Notes12013-
14?OpenDocument
[5] Centre for Epidemiology and Evidence. Secure Analytics for Population Health Research and Intelligence
(SAPHaRI). Sydney: NSW Ministry of Health, 2012.
[6] Australian Institute of Health and Welfare. Health expenditure Australia 2012-13. Health and welfare
expenditure series no. 52. Cat. no. HWE 61. Canberra: AIHW, 2014.
[7] Australian Institute of Health and Welfare. OECD health-care quality indicators for Australia 2011-12. Cat.
no. PHE 174. Canberra: AIHW, 2014.
[8] Population and Public Health Division. New South Wales Admitted Patient Report 2012. Sydney: NSW
Ministry of Health, 2012.
[8] OECD. OECD Health Data 2015. July 2015. http://www.oecd.org/health/healthdata.
[9] Bureau of Health Information. Spotlight on Measurement: 30-day mortality following hospitalisation, five
clinical conditions, NSW, July 2009 – June 2012. Sydney: BHI, 2013.
[10] Bureau of Health Information. Hospital Quarterly Technical Supplement: Emergency department
measures, October to December 2012. Sydney: BHI, 2013.
[11] Bureau of Health Information. Hospital Quarterly Technical Supplement, Elective Surgery measures,
January to March 2013. Sydney: BHI, 2013.
[12] Australian Institute of Health and Welfare. Breast Screen Australia monitoring report 2012-2013.
Canberra: AIHW, 2015.
[13] Veillard J, Moses McKeag A, Tipper B, Krylova O, Reason B. 2013. Methods to stimulate national and
sub-national benchmarking through international health system performance comparisons: A Canadian
approach. Health Policy 2013;112(1–2):141-147.
[14] Canadian Institute for Health Information. International Comparisons: A Focus on Quality of Care.
Toronto: CIHI, 2014.