Embed Size (px)
Citation preview

Bureau of Meteorology

2 Report at a glance
Report at a glance
The Bureau of Meteorology and CSIRO play an important role in monitoring, analysing and communicating observed changes in Australia’s climate.
This fourth, biennial State of the Climate report draws on the latest monitoring, science and projection information to describe variability and changes in Australia’s climate, and how it is likely to change in the future. Observations and climate modelling paint a consistent picture of ongoing, long-term climate change interacting with underlying natural variability.
These changes affect many Australians, particularly changes associated with increases in the frequency or intensity of heat events, fire weather and drought. Australia will need to plan for and adapt to some level of climate change. This report is a synthesis of the science informing our understanding of climate in Australia, and includes new information about Australia’s climate of the past, present and future. The science underpinning this report will help inform a range of economic, environmental and social decision-making and local vulnerability assessments, by government, industry and communities.
Key points
Australia• Australia’s climate has warmed in
both mean surface air temperature and surrounding sea surface temperature by around 1 °C since 1910.
• The duration, frequency and intensity of extreme heat events have increased across large parts of Australia.
• There has been an increase in extreme fire weather, and a longer fire season, across large parts of Australia since the 1970s.
• May–July rainfall has reduced by around 19 per cent since 1970 in the southwest of Australia.
• There has been a decline of around 11 per cent since the mid-1990s in the April–October growing season rainfall in the continental southeast.
• Rainfall has increased across parts of northern Australia since the 1970s.
• Oceans around Australia have warmed and ocean acidity levels have increased.
• Sea levels have risen around Australia. The rise in mean sea level amplifies the effects of high tides and storm surges.
Annual mean temperature changes across Australia since 1910.

State of the Climate 2016 3
Global• Global average annual carbon
dioxide (CO2) levels are steadily increasing; they reached 399 parts per million (ppm) in 2015, and the annual value for 2016 is almost certain to be higher than 400 ppm. Current levels are likely the highest in the past two million years.
• 2015 was the warmest year on record for the globe since reliable global surface air temperature records began in 1880. The last 15 years are among the 16 warmest years on record.
• Globally-averaged ocean temperatures and heat content are increasing. Observations reveal this warming extends to at least 2000 m below the surface.
• Globally-averaged sea level has risen over 20 cm since the late 19th century, with about one third of this rise due to ocean warming and the rest from melting land ice and changes in the amount of water stored on the land.
Global surface temperature anomalies of the Earth (land and ocean) for 1950–2015. Anomalies are with respect to the 1961–1990 base period. Major tropical volcanic eruptions are associated with cooler global temperatures. El Niño and La Niña events typically develop in winter to spring and decline the following autumn. For strong events, the response in global temperature is greatest in the latter part of an event and thus the year following the start of the event is highlighted. For example, the warming associated with the 1997–98 El Niño led to high mean global temperatures in 1998 (the warmest year for the 20th century). Neutral years are those years with no moderate or strong El Niño or La Niña events occurring. Data from World Meteorological Organization: http://public.wmo.int/en/resources/library/wmo-statement-status-of-global-climate-2015
Future• Australian temperatures are
projected to continue increasing with more extremely hot days and fewer extremely cool days.
• The number of days with weather conducive to fire in southern and eastern Australia is projected to increase.
• Winter and spring rainfall is projected to decrease across southern continental Australia, with more time spent in drought.
• Past and ongoing greenhouse gas emissions mean further warming of ocean temperatures.
• Sea-level rise and ocean acidification around Australia are projected to continue.

4 Australia’s changing climate
Australia’s changing climate
Key points• Australia’s climate has warmed,
with around a 1 °C increase in both mean surface air temperature and surrounding sea surface temperature since 1910.
• The duration, frequency and intensity of extreme heat events have increased across large parts of Australia.
• The number of days per year over 35 °C has increased in recent decades, except in parts of northern Australia.
TemperatureAustralia’s weather and climate are changing in response to a warming global climate system. Australia has warmed by around 1 °C since 1910, with most warming since 1950. Australia’s top five warmest years on record included each of the last three years—2013, 2014 and 2015; 2013 was Australia’s warmest year on record. The warming trend occurs against a background of year-to-year climate variability, mostly associated with El Niño and La Niña in the tropical Pacific Ocean.
Sea surface temperatures in the Australian region have warmed by nearly 1 °C since 1900, with the past three years, 2013–2015, all in the region’s five warmest years on record.
Time series of anomalies in sea surface temperature and temperature over land in the Australian region. Anomalies are the departures from the 1961–1990 average climatological period. Sea surface temperature values are provided for a boxed region around Australia (4–46 °S and 94–174 °E).

State of the Climate 2016 5
Distribution of monthly day and night-time temperature anomalies (standardised with respect to the 1951–1980 base period) aggregated across 104 locations and all months of the year, for three periods: 1951–1980 (orange, light blue), 1981–2010 (red, green) and 2001–2015 (dark red, dark blue). Very warm months correspond to two standard deviations from the mean. Detection and attribution studies use various methods to understand the significance of these distribution shifts and their cause.
The shift to a warmer climate in Australia is accompanied by more extreme heat events on daily, multi-day and seasonal timescales.
Australia-wide, increases in average temperature have been more notable across autumn, winter and spring, with the smallest trends in summer. The last three years (2013, 2014, and 2015) have seen the warmest spring seasons on record. Recent attribution studies reveal that the underlying global warming trend was important in driving the unusually warm temperatures experienced during those three spring seasons.
Across Australia, the increases in averaged monthly maximum and minimum temperatures have shifted the temperature distribution, and led to an increase in warm extremes. Very warm monthly maximum temperatures that occurred around 2 per cent of the time during the period 1951–1980 occurred over 11 per cent of the time during the period 2001–2015. Very warm monthly minimum, or night-time, temperatures that occurred 2 per cent of the time in the 1951–1980 period now occur nearly 9 per cent of the time. Examining the temperature distribution shifts in this way can assist in detecting changes in the climate system.

6 Australia’s changing climate
Determining the cause of extreme weather eventsAs the global climate system has warmed, changes have occurred to both the frequency and severity of extreme weather. In Australia, the most obvious change has been an increase in the occurrence of record-breaking heat. Quantifying the influence of increasing atmospheric greenhouse gases on extreme weather events is an important component of communicating and planning for future climate change.
A growing amount of research, including published work from the Bureau of Meteorology and CSIRO, estimates the relative contributions of natural variability and climate change to individual extreme events. These studies use statistical modelling, dynamical climate modelling and weather forecasting techniques.
For example, in 2014, Australia experienced daytime temperatures during October–November that were a record 2.47 °C above the 1961–1990 mean. Our research shows that the same weather systems in a lower CO2 environment, typical of 1960, would have been warm over the southeast, but not record-breaking. Similarly, a Bureau of Meteorology study of Australia’s record-breaking temperatures of September 2013 found that about 15 per cent of the record temperature anomaly can be explained by global warming.
Figure (a): Australia’s observed October–November 2014 daytime temperature anomaly. Figure (b): Simulated forecast showing October–November 2014 daytime temperatures were closer to observed when current atmospheric CO2 concentrations (400 ppm) and ocean conditions were included. Figure (c): The simulated forecast in a lower CO2 environment (315 ppm) with generally cooler ocean temperatures was warm over the southeast, but not record-breaking. Anomalies are relative to the climate of 1981–2010 in the forecast model and observations. Figures drawn from Hope et al. (2015). This and other published research is available in the Bulletin of the American Meteorological Society: www.ametsoc.org/ams/index.cfm/publications/bulletin-of-the-american-meteorological-society-bams/explaining-extreme-events-from-a-climate-perspective/
State of the Climate 2016 7
Extreme temperature events that occur over large areas of the continent are also increasing in frequency. This is illustrated by an increase in the number of days per year when the Australian area-averaged daily mean temperature is extreme. In this instance, extreme days are defined as those above the 99th percentile of each month from the years 1910–2015. In 2013 there were 28 days over this threshold. This compares to the period prior to 1950 when more than half the years had no extreme days.
Number of days in each year where the Australian area-averaged daily mean temperature is extreme. Extreme days are those above the 99th percentile of each month from the years 1910-2015. These extreme events typically occur over a large area, with generally more than 40 per cent of Australia experiencing temperatures in the warmest 10 per cent for that month.
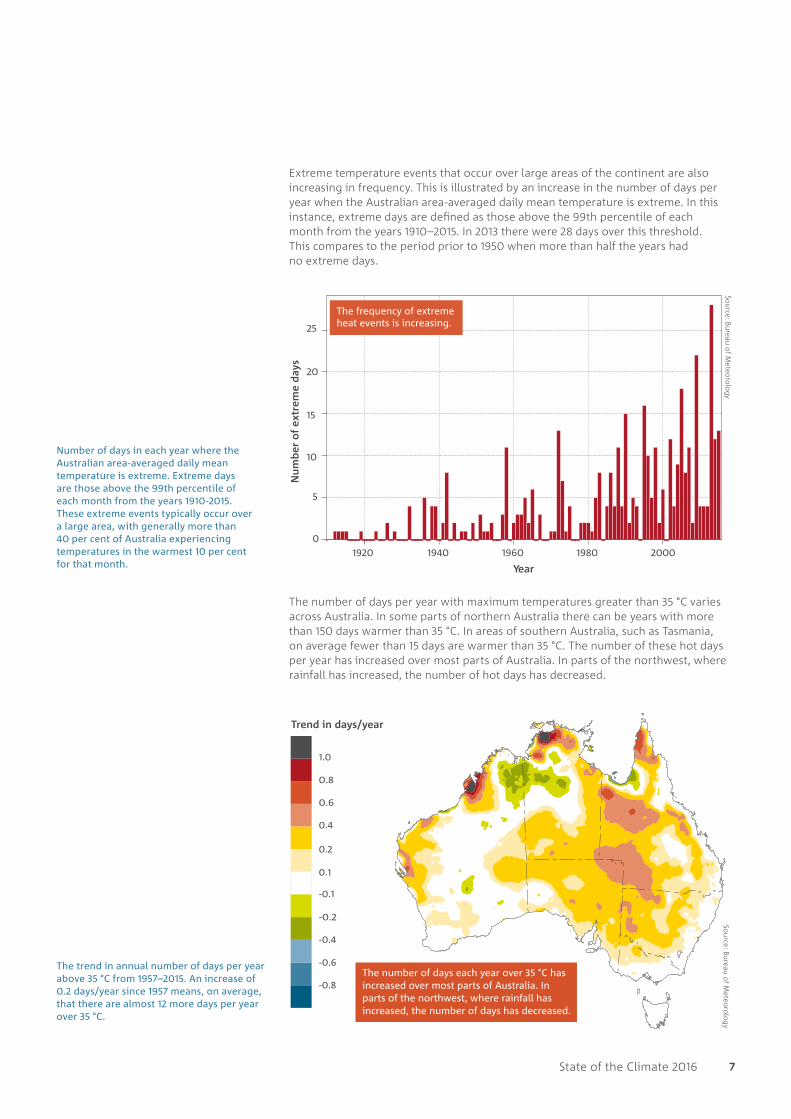
The number of days per year with maximum temperatures greater than 35 °C varies across Australia. In some parts of northern Australia there can be years with more than 150 days warmer than 35 °C. In areas of southern Australia, such as Tasmania, on average fewer than 15 days are warmer than 35 °C. The number of these hot days per year has increased over most parts of Australia. In parts of the northwest, where rainfall has increased, the number of hot days has decreased.
The trend in annual number of days per year above 35 °C from 1957–2015. An increase of 0.2 days/year since 1957 means, on average, that there are almost 12 more days per year over 35 °C.

8 Australia’s changing climate
Fire weather is monitored in Australia with the Forest Fire Danger Index (FFDI). This helps estimate the fire danger on a given day based on observations of temperature, humidity, wind speed and rainfall. The annual 90th percentile of daily FFDI points has increased since 1974 across Australia, especially in southern and eastern Australia, and the fire season has lengthened. Increasing temperatures and drying contributed to the observed upward trend in FFDI. Considerable year-to-year variability is also seen, with La Niña years (e.g. 2010–11 and 1999–2000) generally associated with a lower frequency of days with high values of FFDI.
Fire weather
Key point• There has been an increase
in extreme fire weather, and a longer fire season, across large parts of Australia since the 1970s.
Trends from 1974 to 2015 in annual 90th percentile of daily FFDI at 38 climate reference locations. Trends are in FFDI points per decade and larger circles represent larger trends. Filled circles represent statistically significant trends. Trends are upward (in red), except for Brisbane airport (in blue). Figure is updated to 2015 from Clarke et al. (2013).

State of the Climate 2016 9
Key points• May–July rainfall has reduced by
around 19 per cent since 1970 in the southwest of Australia.
• There has been a decline of around 11 per cent since the mid-1990s in the April–October growing season rainfall in the continental southeast.
• Rainfall has increased across parts of northern Australia since the 1970s.
RainfallAustralian rainfall varies greatly from one year to the next and from one decade to the next, and is strongly influenced by phenomena such as El Niño and La Niña. Despite this large natural variability, underlying longer-term trends are evident in some regions.
There has been significant drying across southern Australia, especially across the cool April–October growing season. For the southeast of the continent, rainfall for the period 1996 to 2015 has decreased by around 11 per cent since national rainfall records began in 1900. This period encompasses the Millennium Drought, which saw low annual rainfall totals across the region from 1997 to 2010. The drying trend is particularly strong between May and July over southwest Western Australia, with rainfall since 1970 around 19 per cent less than the long-term average. Since 1996, this decline from the long-term average has increased to around 25 per cent.
Southern growing season (April–October) rainfall deciles for the last 20 years (1996–2015). A decile map shows where rainfall is above average, average or below average for the recent period, in comparison with the entire rainfall record from 1900.
10 Australia’s changing climate
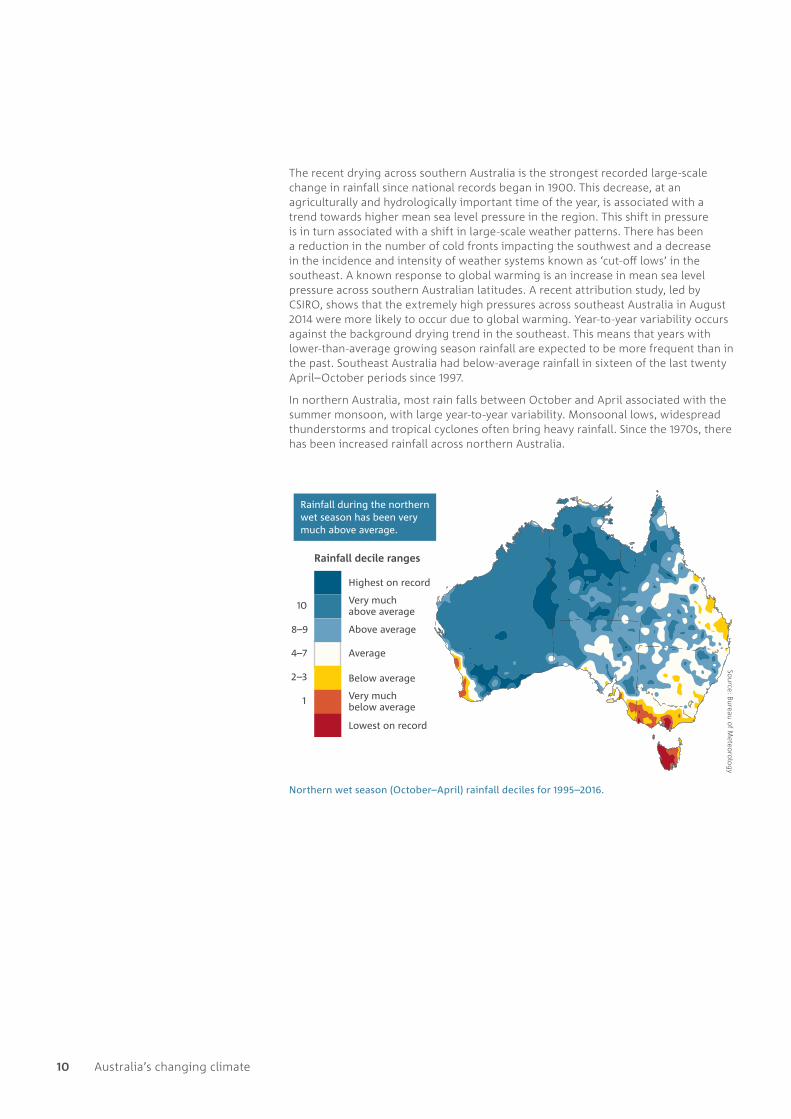
The recent drying across southern Australia is the strongest recorded large-scale change in rainfall since national records began in 1900. This decrease, at an agriculturally and hydrologically important time of the year, is associated with a trend towards higher mean sea level pressure in the region. This shift in pressure is in turn associated with a shift in large-scale weather patterns. There has been a reduction in the number of cold fronts impacting the southwest and a decrease in the incidence and intensity of weather systems known as ‘cut-off lows’ in the southeast. A known response to global warming is an increase in mean sea level pressure across southern Australian latitudes. A recent attribution study, led by CSIRO, shows that the extremely high pressures across southeast Australia in August 2014 were more likely to occur due to global warming. Year-to-year variability occurs against the background drying trend in the southeast. This means that years with lower-than-average growing season rainfall are expected to be more frequent than in the past. Southeast Australia had below-average rainfall in sixteen of the last twenty April–October periods since 1997.
In northern Australia, most rain falls between October and April associated with the summer monsoon, with large year-to-year variability. Monsoonal lows, widespread thunderstorms and tropical cyclones often bring heavy rainfall. Since the 1970s, there has been increased rainfall across northern Australia.
Northern wet season (October–April) rainfall deciles for 1995–2016.

State of the Climate 2016 11
Heavy rainfallThere is mixed evidence for changes in heavy rainfall over Australia. Studies show either no trend, or that a small but increasing proportion of Australia received more rain from heavy rain days during the period 1950–2012. Large variability in extreme rainfall events from decade to decade is also evident, with very wet events often associated with La Niña years.
Streamflow The reduction in rainfall across southern Australia is amplified in streamflow. In the far southwest, streamflow has declined by more than 50 per cent since the mid-1970s. Since the mid-1990s, streamflow in the southeast is around half the long-term average. During the same period, streamflow in the Murray–Darling Basin was 41 per cent lower than average and in some basins in the west and central regions of Victoria, such as the Campaspe Basin, streamflows have declined more than 70 per cent. A recent analysis of hydrologic stations with at least 30 years of high-quality records shows a trend to lower streamflows for southwest and southeast Australia and strong evidence of a trend to higher streamflows in far northern Australia.
Tropical cyclonesThe number of tropical cyclones in the Australian region varies with El Niño and La Niña events. Observations show that when this variability is accounted for there is a statistically significant downward trend in the number of tropical cyclones in the Australian region of responsibility for observing tropical cyclones (i.e. the ocean and land areas from 90°E to 160°E in the southern hemisphere). This trend is calculated using the available high-quality data from 1982 to present. In contrast to the number of tropical cyclones, the statistical significance of any observed trend in tropical cyclone intensity is overshadowed by large uncertainties due to the short satellite record and high variability.

12 Australia’s changing climate
How do we know which baseline period to use?The World Meteorological Organization’s standard reference period, for use in monitoring long-term climate change, is the 30-year period 1961–1990. This State of the Climate report uses that baseline period for long-term averages where suitable data are available, while normally using the full period of available nationwide data for extremes and frequency distributions. Records from the monitoring of the ocean, atmosphere and land can vary in length, influencing the baselines that we use.
National records across Australia are available for rainfall from 1900, and for monthly temperature, from consistent thermometer screens, from 1910. Digitised daily temperature records become widespread from 1950 onwards, and hence a period beginning in 1951 is used as the initial baseline for daily temperature distributions.
The measurement of atmospheric constituents such as CO2 began in Mauna Loa, Hawaii in 1958, and clean air baseline measurements started in the mid-1970s at Cape Grim, Tasmania.
High-quality satellite altimeter data has been available for monitoring sea level of the oceans surrounding Australia since 1993. Sea level measurements can also be taken from tide gauges along the Australian coastline.
Archives of in situ sea surface temperature measurements extend back more than 160 years, with increasing spatial coverage in recent decades. The number of ocean temperature profile measurements in the upper 700 m have increased since the 1950s. For depths below 2000 m, ocean temperature profiles are largely measured by ship-based surveys (GO-SHIP) since the 1970s. In 2006, the Argo profiling float array achieved near-global coverage for the upper 2000 m.
Satellite measurements started in the late 1970s and provide information about sea-ice, oceans and land.
Projections used in this report are from www.climatechangeinaustralia.gov.au and are generated by global climate models using different greenhouse gas and aerosol emissions scenarios. These projections are generally compared to a 1986–2005 baseline.

State of the Climate 2016 13
Ocean temperature and heat contentThe oceans surrounding Australia have warmed, with the greatest surface warming to the west and south of the continent. As in the atmosphere, favourable conditions for marine heatwaves around Australia can occur due to natural variability, such as the warmer Pacific Ocean waters brought to our region by La Niña. However, attribution studies have shown that background warming of the global oceans has led to a greater prevalence of marine heatwaves. In recent years, major heat events have occurred to the west of Australia, off Tasmania’s east coast and, with the 2015–16 El Niño, in the Coral Sea.
Oceans and cryosphere
Key points• Ocean temperatures and ocean
heat content have been steadily increasing globally.
• The Argo global ocean observing system reveals that over the past decade ocean warming extends to a depth of at least 2000 m.
• Globally-averaged sea level has risen over 20 cm since the late 19th century, with about one third of this rise due to ocean warming and the rest from melting land ice and changes in the amount of water stored on the land. The rise in mean sea level amplifies the effects of high tides and storm surges.
• Oceans around Australia have become warmer and there is an increased level of acidity.
Trends in sea surface temperature in the Australian region from 1950 to 2015. These are calculated from the National Oceanic and Atmospheric Administration (NOAA) Extended Reconstructed Sea Surface Temperature Version 4 (ERSST v4) data, from www.esrl.noaa.gov/psd/. A full description of the ERSST v4 data is in Huang et al. (2015) and Liu et al. (2015).

14 Oceans and cryosphere
As with temperatures over land, global ocean temperatures (particularly the upper 300 m) show shorter-term variability, on top of the long-term change. For instance, the global surface ocean temperatures were relatively cool following the strong La Niña of 2010, but became warmer with the 2015–16 El Niño. Temperatures at depth are not influenced by this variability and are increasing steadily.
Estimates of the change in ocean heat content over the full ocean depth, from 1960 to present. Shading provides an indication of the confidence range of the estimate.
Oceans play a critical role in the climate system—the world’s oceans absorb more than 90 per cent of the additional energy arising from the enhanced greenhouse effect, resulting in increases in ocean heat content. Ocean heat content is less variable than surface temperature and is a more reliable measure of the additional heat in the climate system. Our ability to monitor the ocean has been greatly enhanced in the last ten years, with the deployment of thousands of robotic submersible floats worldwide, as part of the international Argo program.
Ocean observations, including Argo with its short but growing record of near-global ocean observations including the deep ocean, show conclusively that ocean heat content has risen steadily, and there is an overall energy imbalance at the Earth’s surface of 0.65–0.80 Wm-2, averaged over the surface of the Earth. Around 80 per cent of the additional energy accumulated by the climate system is accounted for by the warming of the upper 2000 m of the ocean. At least 75 per cent of the ocean warming occurred in the southern hemisphere, predominantly between latitudes 30° S and 50° S.

State of the Climate 2016 15
Sea levelAs oceans warm, they expand and sea level rises. Ocean warming has contributed about a third of the observed global sea-level rise of over 20 cm since the late 19th century. The remainder comes from the loss of ice from glaciers and polar ice sheets, and changes in the amount of water stored on the land. Since 1993, the rates of sea-level rise to the north, west and southeast of Australia have been higher than the global average, and rates of sea-level rise on the central east and southern coasts of the continent have been closer to the global average.
High-quality global sea-level measurements from satellite altimetry since 1993 (red line), in addition to longer-term records from tide gauges (blue line, with green shading providing an indication of the confidence range of the estimate). www.cmar.csiro.au/sealevel/. From 1993–2013 sea level has risen at a rate of about 2.6–2.9 mm per year with a confidence range of +/- 0.4 mm (Watson et al, 2015).
The rate of sea-level rise around Australia as measured by satellite observations from 1993 to 2015. Rates of sea-level rise vary from year to year and spatially. This is partly due to the natural variability of the climate system from influences such as El Niño and La Niña.

16 Oceans and cryosphere
Ocean acidificationThe atmospheric CO2 taken up by the ocean reacts in seawater causing a decrease in seawater pH or an increased level of acidity (i.e. the waters are less ‘basic’). Ocean acidification can affect the entire marine biosphere, although not all species are susceptible. In general, marine species that produce shells or skeletons of calcium carbonate, like corals and shellfish, are susceptible to increasing acidity levels, particularly in early life stages. The average pH of surface waters around Australia is estimated to have decreased between 1880–89 and 2000–09 by about 0.1, corresponding to a 25 per cent increase in the concentration of hydrogen ions. Seas to the south of Australia have a slightly greater ocean acidification change than those to the north.
The change in the pH of surface waters around Australia between 1880–89 and 2000–09. Red indicates regions where the changes have been greatest. Calculations are based on present-day data on the carbonate chemistry of surface seawater around Australia from the Integrated Marine Observing System and other programs, and extrapolation of atmospheric carbon dioxide concentration changes since the 1880s (Lenton et al., 2016).

State of the Climate 2016 17
CryosphereMelting of the Greenland ice sheet has increased dramatically over the last 25 years, with the rate increasing from 34 Gt (billion tonnes) per year during 1992–2001 to 215 Gt per year over 2002–11. The meltwater contributes to sea-level rise. Changes have also been observed in the ice sheets and ice shelves around Antarctica, with outlet glaciers retreating in West Antarctica and melting of the underside of ice-shelves to the west of the Antarctic Peninsula. In Antarctica, ice shelves on the coastal waters are a major control on the rate of loss of land-based ice from the Antarctic continent. Warm ocean water penetrating below the ice shelves of the West Antarctic ice sheet is destabilising a number of outlet glaciers, increasing the Antarctic contribution to sea-level rise.
In contrast, sea-ice changes have little impact on sea level. Sea-ice is merely frozen sea water that floats. When it melts, it returns the original volume of water to the sea. However, the presence or absence of sea-ice can influence the climate and also be an indicator of wider climate changes. The sea-ice extent in the Arctic Ocean has decreased 3.5–4.1 per cent per decade since satellite records began in 1979. The lowest winter maximum extent on record was observed in 2015, and the summer sea-ice extent was the fourth smallest.
In Antarctica, sea -ce has seen statistically significant increases of extent and season duration in some regions (particularly in the Ross Sea region, at about 170 degrees of longitude) and decreases in others (particularly to the west of the Antarctic Peninsula in the Bellingshausen Sea). The duration of the sea-ice season has changed by up to four months over the 36 years of sea-ice records in these regions. These trends are a result of many factors including changes in winds over the Southern Ocean and near the Antarctic continent, and changes in ocean surface temperature and salinity.
Trends in the length of the sea-ice season duration each year (in days per year) around Antarctica, 1979–2014. The Antarctic land-mass is shaded grey. Each year sea-ice around Antarctica expands (or advances) from a minimum extent in February to a maximum extent in September. Duration is a measure of the number of days that a particular location contains sea-ice.

18 Greenhouse gases
Key points• Global average annual CO2
levels are steadily increasing; they reached 399 parts per million (ppm) in 2015, and the annual value for 2016 is almost certain to be higher than 400 ppm. Current levels are likely the highest in the past two million years.
• The overwhelming contribution to the additional CO2 in the atmosphere is from human activities, mainly the burning of fossil fuels.
• CO2 increases in 2015 were the highest ever observed, resulting from a combination of ongoing large human emissions and a weakening of land uptake of CO2 due to the 2015–16 El Niño.
Greenhouse gases
Monitoring greenhouse gases at Cape Grim Cape Grim, on Tasmania’s northwest coast, is one of only three World Meteorological Organization (WMO) global super-stations for the measurement of greenhouse gases.
This year, 2016, marks the 40th anniversary of the first greenhouse gas measurements at Cape Grim. CO2 (carbon dioxide) and CFC (chlorofluorocarbon, a potent synthetic greenhouse gas responsible for the ozone hole) measurements began in 1976 and later extended to cover all major greenhouse gases. Cape Grim’s location is unique in that its exposure to the weather systems coming across the Southern Ocean mean that about 40 per cent of the time atmospheric measurements are not influenced by local sources of pollution.
Cape Grim greenhouse gas data are freely available, and are widely used to quantify global, regional and Australian emissions of greenhouse gases. They have been used in hundreds of research papers on climate change and ozone depletion, which have been cited in all five Intergovernmental Panel on Climate Change (IPCC) international assessments of climate change and in all seven United Nations Environment Programme (UNEP)/WMO international assessments of ozone depletion. Cape Grim greenhouse gas data also provide independent verification of Australia’s National Greenhouse Gas Inventory, which reports Australia’s annual emissions to the United Nations Framework Convention on Climate Change. Cape Grim air is analysed in situ, but also in CSIRO’s GASLAB in Melbourne and in a number of laboratories around the world.
CSIRO commenced collection of the Cape Grim Air Archive in 1978; this long-running collection forms a critical component of the world’s background atmospheric air samples, underpinning extensive research on global and Australian emissions of greenhouse and ozone-depleting gases.
Background hourly clean-air CO2 as measured at Cape Grim. The blue hourly data represent thousands of individual measurements. To obtain clean air measurements, the data are filtered for only times when weather systems have come across the Southern Ocean, and thus the air is not influenced by local sources of pollution.

State of the Climate 2016 19
Global atmospheric concentrations of the major long-lived greenhouse gases, carbon dioxide (CO2), methane (CH4), nitrous oxide (N2O) and a group of synthetic greenhouse gases, continue to rise. The amounts of CO2, CH4 and N2O in the atmosphere show significant seasonal and year-to-year variabilities, but all show ongoing upward trends.
The global mean CO2 level in 2015 was 399 ppm—a 44 per cent increase from the concentration of 278 ppm around the year 1750, and likely the highest level in at least the past two million years. The global annual average CO2 level is almost certain to exceed 400 ppm for 2016. Measurements at Cape Grim in Tasmania exceeded 400 ppm in May 2016. The impact of all greenhouse gases in the atmosphere combined can be expressed as an ‘equivalent CO2’ atmospheric concentration, which reached 487 ppm in 2015.
Global mean greenhouse gas concentrations (ppm: parts per million; ppb: parts per billion) obtained from in situ monitoring by CSIRO and the Bureau of Meteorology (commencing Cape Grim, Tasmania, 1976) and the Advanced Global Atmospheric Gases Experiment (global, including Cape Grim, commencing 1978) and from measurements on flask air samples (global, including Cape Grim, commencing 1992) and the Cape Grim Air Archive (1978–2015) taken at the CSIRO GASLAB (Aspendale, Melbourne) laboratory. Carbon dioxide and nitrous oxide are read from the left hand axis in measures of both ppm and ppb as noted. Methane and synthetic greenhouse gas amounts are read from the right hand axis.

20 Greenhouse gases
The global annual CO2 increase in 2015 was 3.0 ppm, the largest ever observed. The previous record annual increase was 2.6 ppm, set in 2013. During 2015 the rate of increase in fossil fuel emissions slowed. However, the strong El Niño, which led to increased fires and associated greenhouse gas emissions, as well as a weakening of natural CO2 sinks through drought and reduced rainfall over large regions led to increased emissions from natural sources in 2015.
Analysis of the different types (or isotopes) of carbon in atmospheric CO2 shows that the additional CO2 since 1750 in the atmosphere results from human activities, predominantly the burning of fossil fuels.
CO2 concentrations have risen over the last 1000 years as shown by the red dots and orange line. The different types of carbon in CO2 tell us about its source. The vast majority of carbon atoms are carbon-12, with only a small amount of carbon-13. Their ratio compared to a standard is termed δ13C and is shown in black and blue. It is read from the right hand axis. Increasing negative values indicate more carbon from fossil fuels and land-use change, which release more carbon-12. CO2 and the carbon-13 isotope ratio (δ13C) are measured at CSIRO from air in Antarctic ice from the Australian Antarctic Science Program and the British Antarctic Survey and at Cape Grim.

State of the Climate 2016 21
Annual fluxes of CO2 and their changing sources (e.g. fossil fuels) and sinks (e.g. the ocean absorbing CO2). About 30 per cent of the anthropogenic (caused by human activity) CO2 emissions have been taken up by the ocean and about 30 per cent by land. The remaining 40 per cent of emissions have led to an increase in the concentration of CO2 in the atmosphere. Data: CDIAC/NOAA-ESRL/GCP/Joos et al., 2013 and Khatiwala et al., 2013.
Over the last 250 years, about 30 per cent of the anthropogenic (caused by human activity) CO2 emissions have been taken up by the ocean and about 30 per cent by the land. The remaining 40 per cent of emissions have led to the observed increase in the concentration of CO2 in the atmosphere.

22 Future climate
Observed regional trends in rainfall and temperature can seem small when compared to daily, monthly and seasonal climate variability. However, such changes in the average climate, experienced over multiple decades, can have a large influence on ecosystems, agriculture and the built environment. In particular, the changing nature of rainfall and temperature extremes can have a noticeable impact.
As Australia’s climate evolves, a number of long-term changes, such as an increase in mean temperatures, are almost certain. The degree of change in temperature over the next few decades is relatively clear, while the extent to which the climate will change later in the century depends on the level of emissions now and into the future.
The Bureau of Meteorology and CSIRO, with other research institutions around Australia, have recently completed Climate Change in Australia, which describes likely changes to Australia’s climate over the coming century. The report and accompanying interactive materials are available at www.climatechangeinaustralia.gov.au.
Why are Australia and the globe warming?Energy comes from the Sun. In order to maintain stable temperatures at the Earth’s surface, in the long run this incoming energy must be balanced by an equal amount of heat radiated back to space. Greenhouse gases in the atmosphere, such as carbon dioxide, act to increase the temperature of the Earth’s surface, ocean and the atmosphere, by making it harder for the Earth to radiate this heat. This is called the greenhouse effect. Without any greenhouse gases, the Earth’s surface would be much colder, with an average temperature of about -18 °C. For centuries prior to industrialisation the incoming sunlight and outgoing heat were balanced and global average temperatures were relatively steady, at a little under 15 °C. Now, mostly because of the burning of fossil fuels and changes in land use, the concentrations of greenhouse gases in the atmosphere are rising and causing surface temperatures to increase. There is now an energy imbalance at the Earth’s surface of 0.65–0.80 Wm-2 (averaged globally). The atmosphere and oceans will continue to warm until enough extra heat can escape to space to allow the Earth to return to balance. Because carbon dioxide increases persist in the atmosphere for hundreds of years, further warming and sea-level rise is locked in.
Future climate
Key points• Australian temperatures are
projected to continue increasing with more extremely hot days and fewer extremely cool days.
• An increase in the number of days with weather conducive to fire in southern and eastern Australia is projected.
• Extreme rainfall events are likely to increase in intensity by the end of the century across most of Australia.
• Winter and spring rainfall is projected to decrease across southern continental Australia, with more time spent in drought.
• Projections suggest fewer tropical cyclones will form in the southern hemisphere than are currently observed, but a higher proportion of those will be more intense, with ongoing large variability from decade to decade.
• Past and ongoing emissions commit us to further sea-level rise around Australia in coming decades, with ongoing sea-level rise projected.
• Oceans around Australia will warm further and acidification will continue—with significant impacts on marine ecosystems.

Further informationThe Bureau of Meteorology and CSIRO monitor, archive, analyse, model, interpret and communicate Australia’s observed and future weather and climate.
Collaboratively we contribute to research that underpins the health, security and prosperity of Australia in areas such as weather and ocean prediction, hazard prediction and warnings, climate variability and climate change, water supply and management, and adaptation to climate impacts.
Further information about the content of this report, and a list of references is online.
Bureau of Meteorology www.bom.gov.au/state-of-the-climate e [email protected]
CSIRO www.csiro.au/state-of-the-climate e [email protected] t 1300 363 400
Additional information about climate change and projections for Australia can be found at: www.climatechangeinaustralia.gov.au
COPYRIGHT AND DISCLAIMER To the extent permitted by law, all rights are reserved and no part of this publication covered by copyright may be reproduced or copied in any form or by any means except with the written permission of CSIRO and the Bureau of Meteorology.
It is advised that users seek additional information or expert scientific advice before using the contents of this report in any specific situation.
ISBN: 978-0-642-70678-2
© 2016 Commonwealth of Australia
B&M | 16-00159