Embed Size (px)
Citation preview

BURGER FUEL WORLDWIDE LIMITED ANNUAL REPORT 2019

CONTENTS PAGE
Annual Report of the Directors 4-5
Independent Auditor’s Report 10-14
Consolidated Statement of Comprehensive Income 17
Consolidated Statement of Financial Position 18
Consolidated Statement of Changes in Equity 19
Consolidated Statement of Cash Flows 20
Notes to the Consolidated Financial Statements 21-61
Shareholder Information 62-66
Corporate Governance 67-68
Directory 69
BURGER FUEL WORLDWIDE LIMITED
CONSOLIDATED FINANCIAL
STATEMENTSFOR THE YEAR ENDED 31 MARCH 2019

PAGE 4 PAGE 5
BURGER FUEL WORLDWIDE LIMITED ANNUAL REPORT 2019
Burger Fuel Worldwide Ltd Full Year Results for the 12 months ended 31st March 2019
Overview - FY19
The Directors of Burger Fuel Worldwide Limited (BFW) present the audited results for the 12 months to 31 March 2019.
Net Profit after tax for the period was $1,236,341 representing an increase of $1.7M on the previous year.
The Group has no debt, and cash reserves of $5.5M.
BurgerFuel (unaudited) Total System Sales reduced (2.90%) to $102M on the same period last year. Group Operating Revenue decreased by (15%) to $21.0M, however this decline is mainly due to the sale of the company owned USA store to the Founding Director Chris Mason in March 2018, as well as some internal changes. This internal change lowers revenue from our proprietary product manufacturing operation but will ensure that this business unit becomes more financially efficient.
Revenue is largely comprised of sales from our company owned restaurants, manufacturing and long-term recurring royalties.
As at 31 March 2019 there were 78 BurgerFuel stores operating worldwide and 2 single outlets in New Zealand; one for each of our new concepts; Shake Out® & Winner Winner®.
BFW results for the period 1 April 2018 to 31 March 2019
31 March
2019
31 March
2018
$000 $000
Operating Revenue* 21,028 24,774
Operating Expenses** (19,172) (24,809)
Net Profit (Loss) Before Tax 1,856 (35)
Net Profit (Loss) After Tax*** 1,236 (463)
* Revenue includes; Operating revenue & interest income.
** Expenses include; Operating expenses, depreciation, amortisation & interest expense ***The New Zealand entities had taxable income and were unable to utilise the foreign tax losses. The overseas entities had minimal tax.
The Year To Date And Group Outlook
New Zealand
System sales across New Zealand (56 restaurants) increased by 2.6% on the previous year. We closed our last remaining Australian franchised stores in July & August 2018.
BurgerFuel NZ continues to perform well, although we did experience less growth than we would have liked in the period. At this stage we are not undertaking third party home delivery as over time we believe it will negatively affect both the brand and individual store profitability. This decision may have impacted our growth numbers, however we remain committed to a no delivery policy at this stage. There are still some opportunities for new BurgerFuel stores to open in NZ, but we will only undertake new openings if we can achieve both the right locations as well as the accompanying franchisees.
We previously advised the market at the last AGM, that whilst we remain fully dedicated to supporting the BurgerFuel brand and driving growth within the BurgerFuel business, the Group is now also focused on the development of our other brands, Winner Winner, the chicken concept purchased by BFW in December 2017, and Shake Out, the new burger concept developed in-house. Our first Shake Out opened in November 2018 at the Smales Farm complex in Auckland. This new company owned restaurant is performing well and we are currently preparing to open more company owned and franchised Shake Out stores in the current year.
The Winner Winner chicken brand we have been working on for the past year is now also ready to roll out. We expect to open new Winner Winner restaurants in FY20.
The Middle East
The Middle East has been very challenging in recent years. We continue to face difficulties in those markets. The UAE, Saudi Arabia and Iraq have all experienced competitive pressures as well as internal political and economic issues over the past 2-3 years. In their own unique way each of these countries remain volatile to sales which are in general, flat or declining.
The UAE especially, continues to see a significant slowdown in the retail sector and the competitor market is becoming even more densely populated, both of which have been reflected in the slowing of sales. Our licensees in the Middle East continue to face disproportionately high rental costs, and accordingly have already closed a number of stores, with plans to close more stores that are no longer financially viable.
ANNUAL REPORT OF THE DIRECTORS FOR THE YEAR ENDED 31 MARCH 2019
Our licensed business in Saudi Arabia has continued to see satisfactory sales, but like our other Middle Eastern markets, they are also facing high retail rents, increasing labour costs and staff shortages due to the changes in work visa requirements. In line with our other Middle Eastern markets, our partners in Saudi are also optimising locations, working to reduce overheads and increase customer reach.
Iraq too, is facing significant challenges, and while the brand did experience positive traction in this market, the political and economic climate is now susceptible to volatility, and this is having an impact on trade. Only one store is now trading in Iraq and we expect the situation there to remain as it is, or worsen, which could mean this single store in Iraq may cease trading.
Overall, and as always, we continue to caution the market as to the future of the Middle Eastern region for BurgerFuel. These countries remain uncertain and we anticipate further declines in our revenue from this market. That said, we remain committed to supporting the BurgerFuel business in this region and will continue working closely with our partners in each country.
United States
In the United States we have one licenced store in Broad Ripple, Indianapolis, operated by our licensee, Chris Mason. Whilst the store has experienced a decline in sales in the past 12 months since opening, Chris remains focused on his search for an established US partner. At this stage the US store continues to trade, and we will update the market if anything changes.
Outlook
Last year we advised the market that BFW was transforming from a single brand, international company to a multi-brand New Zealand company. This transition is going well, and we are pleased that we have managed to absorb all the costs associated with this transition, as well as the costs to develop the new brands and provide an acceptable profit for FY19. We will continue to focus on the opening of new restaurants in NZ and we look forward to updating the market with these new openings as the year progresses.
This change in focus has prompted us to review our company name, and from the 1st July 2019 we will be known as Burger Fuel Group Limited, which is more in line with our future strategy.
As advised on the 15th February 2019, the board has sought input from KPMG’s Corporate Finance team to undertake a full strategic options review of the business and to look at all potential opportunities for the Group. That review is now underway.
A further matter is the dissolution of the NZAX. The Group will be migrating to the NZSX main board and will continue to operate as a publicly listed
company.
On the 28th April 2019 we completed the last tranche of the BFW share buyback from Franchise Brands. BFW bought back and cancelled 5,963,355 (or 10%) shares in total, utilising its cash reserves. The total number of shares on issue in BFW is now 53,670,195.
The Group is focused on profit and growth, as well as development in new areas beyond the BurgerFuel brand. We thank all shareholders for their support, and we look forward to the year ahead.
Best regards
Josef Roberts Group CEO
Peter Brook
Chairman
ANNUAL REPORT OF THE DIRECTORS FOR THE YEAR ENDED 31 MARCH 2019

PAGE 6 PAGE 7
BURGER FUEL WORLDWIDE LIMITED ANNUAL REPORT 2019
Total System Sales represent total till sales figures across the counter for all franchise and company owned stores. These figures are based on store sales reported by franchisees to Burger Fuel Limited for the corresponding financial years, and have not been independently reviewed or audited by Baker Tilly Staples Rodway. All figures are taken from till sales and are up to and including the last day of the calendar month. These figures are exclusive of GST.
Financial years are from 1st April to 31st March. Total system sales represent total till sales figures across the counter
for all franchise and company owned stores.
TOTAL SYSTEM SALES TOTAL (UNAUDITED) SYSTEM SALES$102,181,305
2011
NZ$33.0M
2012
NZ$38.1M
2013
NZ$49.3M
2014
NZ$66.2M
2015
NZ$82.8M
2010
NZ$29.9M
2009
NZ$25.9M
2008
NZ$22.5M
2016
NZ$96.5M
2017
NZ$100.3M
2018
NZ$105.2M
2019
NZ$102.2M
NOTE: BFW listed as a company on the NZAX on 27 July 2007
* 2008 reporting period is 9½ months
BURGER FUEL WORLDWIDE LIMITED REVENUE AND TRADING HISTORY
REVENUE LOSS PROFIT AFTER TAX
2009
NZ$7.5M
(NZ$710,282)
2008*
NZ$4.5M
(NZ$2,149,067)
2010
NZ$8.7M
(NZ$552,983)
2011
NZ$8.3M
NZ$33,513
2012
NZ$9.6M
NZ$708,360
NZ$12.0M
NZ$1,098,294
2013
NZ$14.4M
NZ$400,656
2014
NZ$18.7M
NZ$532,170
2015
NZ$20.3M
(NZ$1,143,655)
2016
NZ$22.3M
NZ$888,948
2017
NZ$24.8M
(NZ$463,062)
2018
NZ$21.0M
2019
NZ$1,236,341

THE BOARD
MARK PIET CHIEF FINANCIAL OFFICER
Mark is the CFO & Company
Secretary of BurgerFuel and has
been with the company since
2008.
Mark is a chartered accountant
& a member of Chartered
Accountants Australia and New
Zealand.
Prior to joining BurgerFuel, Mark
worked for Deutsche Bank & The
Economist in London.
PETER BROOK CHAIRMAN
MEMBER - BFW AUDIT COMMITTEE
Peter has 20 years experience in
the investment banking industry,
retiring in 2000 to pursue his
own business and consultancy
activities.
Peter is presently Chairman of
Trust Investment Management
Ltd and Generate Investment
Management Ltd.
Other Directorships: Argosy
Property Ltd, a Trustee of the
Melanesian Mission Trust Board,
and a number of directorships of
private companies.
ALAN DUNN INDEPENDENT DIRECTOR
CHAIRMAN - BFW AUDIT COMMITTEE
Former CEO and Chairman of
McDonald’s NZ from 1993 to
2003. In 2004 Alan became
Chicago based VP Operations,
then Regional VP Nordics and
Managing Director Sweden until
retirement from McDonalds in
2007.
Other Directorships: Z Energy,
NZ Post and a number of
directorships of private
companies.
TYRONE FOLEY CHIEF OPERATING OFFICER
Tyrone is the group COO and is
responsible for the management
of all departments at Head Office
and daily operations in all markets
around the world.
Tyrone’s previous management
roles have been with McDonald’s
and BP.
JOSEF ROBERTS GROUP CEO
Josef is the Group CEO and
is responsible for the overall
direction and management of the
business.
Former CEO and founder of Red
Bull Australasia.

PAGE 10 PAGE 11
INDEPENDENT AUDITOR’S REPORT
TO THE SHAREHOLDERS OF BURGER FUEL WORLDWIDE LIMITED
Report on the Audit of the Consolidated Financial Statements
Opinion
We have audited the consolidated financial statements of Burger Fuel Worldwide Limited and its subsidiaries
(‘the Group’) on pages 17 to 61, which comprise the consolidated statement of financial position as at 31 March
2019, and the consolidated statement of comprehensive income, consolidated statement of changes in equity
and consolidated statement of cash flows for the year then ended, and notes to the consolidated financial
statements, including significant accounting policies.
In our opinion, the accompanying consolidated financial statements present fairly, in all material respects, the
consolidated financial position of the Group as at 31 March 2019, and its consolidated financial performance
and its consolidated cash flows for the year then ended in accordance with New Zealand Equivalents to
International Financial Reporting Standards (‘NZ IFRS’) and International Financial Reporting Standards
(‘IFRS’).
Our report is made solely to the Shareholders of Burger Fuel Worldwide Limited, in accordance with the
Companies Act 1993. Our audit work has been undertaken so that we might state those matters which we are
required to state to them in an auditor’s report and for no other purpose. To the fullest extent permitted by
law, we do not accept or assume responsibility to anyone other than Burger Fuel Worldwide Limited and the
Shareholders of Burger Fuel Worldwide Limited, for our audit work, for our report or for the opinions we have
formed.
Basis for Opinion
We conducted our audit in accordance with International Standards on Auditing (New Zealand) (‘ISAs (NZ)’).
Our responsibilities under those standards are further described in the Auditor’s Responsibilities for the
Audit of the Consolidated Financial Statements section of our report. We are independent of the Group in
accordance with Professional and Ethical Standard 1 (Revised) Code of Ethics for Assurance Practitioners
issued by the New Zealand Auditing and Assurance Standards Board and the International Ethics Standards
Board for Accountants’ Code of Ethics for Professional Accountants (‘IESBA Code’), and we have fulfilled our
other ethical responsibilities in accordance with these requirements and the IESBA Code. We believe that the
audit evidence we have obtained is sufficient and appropriate to provide a basis for our opinion.
Other than in our capacity as auditor, our firm carries out other assignments for Burger Fuel Worldwide
Limited and its subsidiaries in the area of taxation compliance services. The provision of these other services
has not impaired our independence.
Key Audit Matters
Key audit matters are those matters that, in our professional judgement, were of most significance in
our audit of the consolidated financial statements of the current year. These matters were addressed in the
context of our audit of the consolidated financial statements as a whole, and in forming our opinion thereon,
and we do not provide a separate opinion on these matters. Key audit matters are selected from the matters
communicated with the Directors, but are not intended to represent all matters that were discussed with them.
T: +64 9 309 0463
F: +64 9 309 4544
W: www.bakertillysr.nzLevel 9, 45 Queen Street,
Auckland 1010
PO Box 3899, Auckland 1140
New Zealand Key Audit MatterHow our audit addressed the key audit matterGoodwill
As disclosed in Note 14 of the Group’s consolidated financial statements the Group has goodwill of $1,639,279 allocated across two of the Group’s cash-generating units (‘CGUs’). Goodwill was significant to our audit due to the size of the assets and the subjectivity, complexity and uncertainty inherent in the measurement of the recoverable amount of the CGU’s for the purpose of the required annual impairment test. The measurement of a CGU’s recoverable amount includes the assessment and calculation of its ‘value-in-use’.
Management has completed the annual impairment test for each of the CGUs as at 31 March 2019.
Our audit procedures among others included:• Evaluating Management’s determination of the
Group’s CGUs based on our understanding of the nature of the Group’s business and the economic environment in which the segments operate. We also analysed the internal reporting of the Group to assess how the CGUs are monitored and reported.
• Challenging Management’s assumptions and estimates used to determine the recoverable value of its indefinite life intangible assets, including those relating to forecast revenue, cost, capital expenditure, discount rates, by adjusting for future events and corroborating the key market related assumptions to external data. Procedures included:
• Evaluating the logic of the value-in-use calculations supporting Management’s annual impairment test and testing the mathematical accuracy of these calculations;
• Evaluating Management’s process regarding the preparation and review of forecasts;
• Comparing forecasts to Board approved forecasts;
• Evaluating the historical accuracy of the Group’s forecasting to actual historical performance;
• Evaluating the forecast growth assumptions;• Evaluating the inputs to the calculation of the
discount rates applied;• Engaging our own internal valuation experts to
assess the reasonableness of the discount rates applied;
• Evaluating Management’s sensitivity analysis for reasonably possible changes in key assumptions;
• Performing our own sensitivity analysis for reasonably possible changes in key assumptions, the two main assumptions being: the discount rate and forecast growth assumptions (during both the forecast and terminal periods); and
• Evaluating the related disclosures about indefinite life intangible assets which are included in Note 14 in the Group’s consolidated financial statements.

PAGE 12 PAGE 13
Key Audit Matter
How our audit addressed the key audit matter
Revenue Recognition
The Group’s three largest revenue streams are
revenue from the sale of goods $8,687,830,
royalties of $5,938,200 and advertising fees
of $3,854,686. On 1 April 2018, the Group
adopted NZ IFRS 15 Revenue from Contracts
with Customers (‘NZ IFRS 15’). As described
in Note 4, Management have assessed the
impact of adoption on the Group’s recognition
of revenue for each of the Group’s sources of
revenue.
Management have concluded that:
• With respect to the sale of goods, revenue is
recognised when the performance obligation
is satisfied, being the point of sale;
• With respect to franchise and master licence
fees, revenue is recognised as the performance
obligation is satisfied, being the term of the
franchise or master licence agreement, and
• With respect to royalties and advertising fees,
revenue is recognised when the performance
obligation is satisfied, being point of sale of
goods to the franchisees’ customer.
Management has concluded that the adoption
of NZ IFRS 15 has only materially affected the
recognition of franchise and master licence
fees and an adjustment to Opening Retained
Earnings was made on adoption.
The recognition of revenue was significant to our
audit due to the significant judgements made
by Management in relation to the timing and
amount of revenue to be recognised together
with the impact of the adoption of NZ IFRS 15.
Our audit procedures among others included:
• Evaluating the design and operating effectiveness
of the key controls over the integrity, accuracy
and completeness of the sales information
provided to the Group by individual franchisees.
• Evaluating and challenging Management
assessment of the impact of adopting NZ IFRS 15
including:
• Identification of the contracts with customers;
• Identification of the performance obligations in
the contracts with customers;
• Determination of the transaction price;
• Allocation of the transaction price to each
performance obligation; and
• Recognition of revenue when each performance
obligation has been satisfied.
• Reviewing a sample of franchise and master
licencing agreements to ensure Management’s
conclusions with regards to the adoption of NZ
IFRS 15 are in line with our understanding.
• Testing Management’s calculation of the contract
liability relating to franchise and master licencing
revenue as a result of the adoption of NZ IFRS 15.
• Agreeing the percentage of sales due from
the Group’s individual franchisees as royalties
and advertising fees to the relevant franchisee
agreement on a sample basis.
• Testing the mathematical accuracy of the
royalties and advertising fee calculation
undertaken by Management on a sample basis.
• Evaluating the disclosures made in Note 4 of the
Group’s consolidated financial statements relating
to the adoption of NZ IFRS 15.
• Evaluating the disclosures made in Note 5 in the
Group’s consolidated financial statements relating
to the Group’s material categories of revenue.
Other InformationThe Directors are responsible for the other information. The other information comprises the information included in the Group’s annual report for the year ended 31 March 2019 (but does not include the consolidated financial statements and our auditor’s report thereon).
Our opinion on the consolidated financial statements does not cover the other information and we do not express any form of audit opinion or assurance conclusion thereon.
In connection with our audit of the consolidated financial statements, our responsibility is to read the other information and, in doing so, consider whether the other information is materially inconsistent with the consolidated financial statements or our knowledge obtained in the audit or otherwise appears to be materially misstated.
If, based on the work we have performed, we conclude that there is a material misstatement of this other information, we are required to report that fact.
We have nothing to report in this regard.
Responsibilities of the Directors for the Consolidated Financial StatementsThe Directors are responsible on behalf of the Group for the preparation and fair presentation of the consolidated financial statements in accordance with NZ IFRS and IFRS, and for such internal control as the Directors determine is necessary to enable the preparation of the consolidated financial statements that are free from material misstatement, whether due to fraud or error.
In preparing the consolidated financial statements, the Directors are responsible on behalf of the Group for assessing the Group’s ability to continue as a going concern, disclosing, as applicable, matters related to going concern and using the going concern basis of accounting unless the Directors either intend to liquidate the Group or to cease operations, or have no realistic alternative but to do so.
Auditor’s Responsibilities for the Audit of the Consolidated Financial StatementsOur objectives are to obtain reasonable assurance about whether the consolidated financial statements as a whole are free from material misstatement, whether due to fraud or error, and to issue an auditor’s report that includes our opinion. Reasonable assurance is a high level of assurance, but is not a guarantee that an audit conducted in accordance with ISAs (NZ) will always detect a material misstatement when it exists. Misstatements can arise from fraud or error and are considered material if, individually or in the aggregate, they could reasonably be expected to influence the economic decisions of users taken on the basis of these consolidated financial statements.
As part of an audit in accordance with ISAs (NZ), we exercise professional judgement and maintain professional scepticism throughout the audit. We also:
• Identify and assess the risks of material misstatement of the consolidated financial statements, whether due to fraud or error, design and perform audit procedures responsive to those risks, and obtain audit evidence that is sufficient and appropriate to provide a basis for our opinion. The risk of not detecting a material misstatement resulting from fraud is higher than for one resulting from error, as fraud may involve collusion, forgery, intentional omissions, misrepresentations, or the override of internal control.

PAGE 14
• Obtain an understanding of internal control relevant to the audit in order to design audit procedures
that are appropriate in the circumstances, but not for the purpose of expressing an opinion on the
effectiveness of the Group’s internal control.
• Evaluate the appropriateness of accounting policies used and the reasonableness of accounting estimates
and related disclosures made by Management.
• Conclude on the appropriateness of the use of the going concern basis of accounting by the Directors
and, based on the audit evidence obtained, whether a material uncertainty exists related to events or
conditions that may cast significant doubt on the Group’s ability to continue as a going concern. If we
conclude that a material uncertainty exists, we are required to draw attention in our auditor’s report to
the related disclosures in the consolidated financial statements or, if such disclosures are inadequate,
to modify our opinion. Our conclusions are based on the audit evidence obtained up to the date of our
auditor’s report. However, future events or conditions may cause the Group to cease to continue as a
going concern.
• Evaluate the overall presentation, structure and content of the consolidated financial statements,
including the disclosures, and whether the consolidated financial statements represent the underlying
transactions and events in a manner that achieves fair presentation.
• Obtain sufficient appropriate audit evidence regarding the financial information of the entities or
business activities within the Group to express an opinion on the consolidated financial statements. We
are responsible for the direction, supervision and performance of the group audit. We remain solely
responsible for our audit opinion.
We communicate with the Directors regarding, among other matters, the planned scope and timing of the
audit and significant audit findings, including any significant deficiencies in internal control that we identify
during our audit.
We also provide the Directors with a statement that we have complied with relevant ethical requirements
regarding independence, and to communicate with them all relationships and other matters that may
reasonably be thought to bear on our independence, and where applicable, related safeguards.
From the matters communicated with the Directors, we determine those matters that were of most
significance in the audit of the consolidated financial statements of the current year and are therefore the
key audit matters. We describe these matters in our auditor’s report unless law or regulation precludes public
disclosure about the matter or when, in extremely rare circumstances, we determine that a matter should
not be communicated in our report because the adverse consequences of doing so would reasonably be
expected to outweigh the public interest benefits of such communication.
The engagement partner on the audit resulting in this independent auditor’s report is N S de Frere.
BAKER TILLY STAPLES RODWAY AUCKLAND
Auckland, New Zealand
31 July 2019
PAGE 15

PAGE 17
THE FINANCIALS CONSOLIDATED STATEMENT OF COMPREHENSIVE INCOME FOR THE YEAR ENDED 31 MARCH 2019
2019 2018
Note $ $
Revenue 5 20,899,915 24,689,154
Operating Expenses 6 (18,408,971) (24,152,919)
Profit before Interest, Taxation, Depreciation and Amortisation 2,490,944 536,235
Depreciation 11 (577,343) (535,327)
Amortisation 14 (174,648) (117,876)
(751,991) (653,203)
Profit / (Loss) before Interest and Taxation 1,738,953 (116,968)
Interest Income 127,751 85,052
Interest Expense (10,925) (3,550)
116,826 81,502
Profit / (Loss) before Taxation 1,855,779 (35,466)
Income Tax Expense 7 (619,438) (427,596)
Net Profit / (Loss) attributable to shareholders 1,236,341 (463,062)
Other comprehensive income:
Items that may be reclassified subsequently to profit or loss:
Movement in Foreign Currency Translation Reserve 20 (52,968) 34,107
Total comprehensive income 1,183,373 (428,955)
Basic Earnings per Share (cents) 25 2.18 (0.78)
Diluted Earnings per Share (cents) 25 2.18 (0.78)
The attached notes form part of these financial statements
BURGER FUEL WORLDWIDE LIMITED ANNUAL REPORT 2019

PAGE 18 PAGE 19
BURGER FUEL WORLDWIDE LIMITED ANNUAL REPORT 2019
2019 2018
Shareholders’ equity Note $ $
Contributed equity 18 14,087,498 16,034,443
Retained earnings 19 (2,541,498) (2,336,651)
IPO capital costs 18 (223,432) (223,432)
Other reserves 20 (324,083) (271,115)
10,998,485 13,203,245
Current assets
Cash and cash equivalents 17 5,503,473 6,300,878
Trade and other receivables 9 3,021,234 3,030,807
Inventories 10 621,618 1,078,848
Loans 13 170,900 133,000
9,317,225 10,543,533
Non-current assets
Property, plant and equipment 11 2,538,702 2,387,128
Deferred tax asset 7 715,959 188,180
Intangible assets 14 2,544,788 2,525,189
5,799,449 5,100,497
Total Assets 15,116,674 15,644,030
Current liabilities
Trade and other payables 15 1,498,449 1,656,880
Contract Liability 15 263,215 -
Income tax payable 152,013 448,650
Provisions 16 414,631 298,405
2,328,308 2,403,935
Non-current liabilities
Contract Liability 15 1,751,831 -
Provisions 16 38,050 36,850
1,789,881 36,850
Total liabilities 4,118,189 2,440,785
Net assets 10,998,485 13,203,245
Net tangible assets per share ($ per share) 30 0.14 0.18
For and on behalf of the board who approved these financial statements for issue on 31st July 2019.
Director Director
The attached notes form part of these financial statements
CONSOLIDATED STATEMENT OF FINANCIAL POSITION AS AT 31 MARCH 2019
CONSOLIDATED STATEMENT OF CHANGES IN EQUITY FOR THE YEAR ENDED 31 MARCH 2019
2019
Contributed Equity
Foreign Currency
Translation Reserve
IPO Capital Costs
Retained Earnings Total Equity
Note $ $ $ $ $
Balance as at 31 March 2018 16,034,443 (271,115) (223,432) (2,336,651) 13,203,245
Impact of Changes in Accounting
Policies 4 - - - (1,441,188) (1,441,188)
Balance as at 1 April 2018 16,034,443 (271,115) (223,432) (3,777,839) 11,762,057
Buy Back and cancellation of Ordinary Shares (1,946,945) - - - (1,946,945)
Movement in foreign currency translation reserve recognised in other comprehensive income - (52,968) - - (52,968)
Net Profit for the year ended 31 March 2019 - - - 1,236,341 1,236,341
Total comprehensive income - (52,968) - 1,236,341 1,183,373
Balance as at 31 March 2019 14,087,498 (324,083) (223,432) (2,541,498) 10,998,485
2018
Contributed Equity
Foreign Currency
Translation Reserve
IPO Capital Costs
Retained Earnings Total Equity
Note $ $ $ $ $
Balance as at 1 April 2017 16,034,443 (305,222) (223,432) (1,873,589) 13,632,200
Movement in foreign currency
translation reserve recognised in other
comprehensive income - 34,107 - - 34,107
Net Loss for the year ended 31 March
2018 - - - (463,062) (463,062)
Total comprehensive income - 34,107 - (463,062) (428,955)
Balance as at 31 March 2018 16,034,443 (271,115) (223,432) (2,336,651) 13,203,245
The attached notes form part of these financial statements

PAGE 20 PAGE 21
BURGER FUEL WORLDWIDE LIMITED ANNUAL REPORT 2019
2019 2018
Cash flows from operating activities Note $ $
Cash was provided from:
Receipts from customers 20,849,474 24,088,728
Interest received 127,751 85,052
Goods and services tax received / (paid) 13,867 (15,957)
20,991,092 24,157,823
Cash was applied to:
Payments to suppliers & employees (17,908,340) (23,225,822)
Interest paid (10,925) (3,550)
Taxes paid (883,146) (97,507)
(18,802,411) (23,326,879)
Net cash flows provided from operating activities 26 2,188,681 830,9443
Cash flows from investing activities
Cash was provided from:
Repayments from suppliers & staff 13 8,711 -
Sale of property, plant and equipment 76,794 1,176,152
85,505 1,176,152
Cash was applied to:
Acquisition of intangible assets 14 (194,247) (219,090)
Advances to supplier and staff 13 (46,611) -
Acquisition of property, plant & equipment 11 (870,799) (1,898,729)
Share buyback & cancellation 18 (1,946,945) -
(3,058,602) (2,117,819)
Net cash flows applied to investing activities 2,973,097 (941,667)
Net movement in cash and cash equivalents (784,416) (110,723)
Exchange gains / (loss) on cash and cash equivalents (12,989) (1,294)
Opening cash and cash equivalents 6,300,878 6,412,895
Closing cash and cash equivalents 17 5,503,473 6,300,878
CONSOLIDATED STATEMENT OF CASH FLOWS FOR THE YEAR ENDED 31 MARCH 2019
The attached notes form part of these financial statements
1) REPORTING ENTITIES AND STATUTORY BASE
Burger Fuel Worldwide Limited is a Company registered under the Companies Act 1993 and is listed with the New Zealand Alternative Stock Exchange (NZAX). The Company is a Financial Markets Conduct (FMC) reporting entity for the purposes of the Financial Markets Conduct Act 2013 and its financial statements comply with that Act.
The financial statements presented are those of Burger Fuel Worldwide Limited (the ‘Group’). A list of its wholly owned subsidiaries is listed in note 12 of the financial statements.
The Group operates as a franchisor of gourmet burger and chicken restaurants and is a for-profit oriented entity, incorporated and domiciled in New Zealand.
2) BASIS OF PREPARATION
Statement of Compliance
The financial statements have been prepared in accordance with New Zealand Generally Accepted Accounting Practice (“NZ GAAP”) and the requirements of the Companies Act 1993, the Financial Reporting Act 2013 and the Financial Markets Conduct Act 2013. They comply with the New Zealand equivalents to International Financial Reporting Standards (“NZ IFRS”), and other applicable Financial Reporting Standards as appropriate for, for-profit oriented entities. For the purposes of complying with NZ GAAP, the Group is a Tier 1 for-profit entity as defined in the XRB’s Accounting Standards Framework. These financial statements also comply with International Financial Reporting Standards (“IFRS”).
These financial statements are presented in New Zealand dollars ($), which is the Company’s functional currency and they have been rounded to the nearest dollar.
The financial statements were approved by the Board of Directors on the date set out on page 18 of the Annual Report.
Basis of Measurement
These financial statements have been prepared under the historical cost convention, as modified by the revaluation of certain assets and liabilities in specific accounting policies below.
Use of Estimates and Judgements
The preparation of financial statements in conformity with NZ IFRS requires management to make estimates and assumptions that affect the reported amounts of assets and liabilities at the date of the financial statements and the reported amounts of revenues and expenses during the year. Actual results could differ from those estimates.
The principal areas of judgments in preparing these financial statements are set out below:
Impairment of Receivables
The Group maintains an allowance for estimated losses expected to arise from customers being unable to make required payments. This allowance takes into account known commercial factors impacting specific customer accounts, as well as the overall profile of the Group’s debtors’ portfolio. In assessing the allowance, factors such as past collection history, the age of receivable balances, the level of activity in customer accounts, as well as general, macro-economic trends, are taken into account. The impairment of receivables is detailed in note 9 of the financial statements.
Accounting for Income Tax
Preparation of the annual financial statements requires management to make estimates as to, amongst other things, the amount of tax that will ultimately be payable, the availability of losses to be carried forward and the amount of foreign tax credits it will receive in each of the jurisdictions it operates in.
Deferred tax assets are recognised for deductible temporary differences and unused tax losses (where applicable) only to the extent that it is probable that future taxable amounts will be available to utilise those temporary differences and losses. Actual results may differ from these estimates as a result of reassessment by management or taxation authorities. Refer to note 7 for additional information on accounting for income tax.
Impairment of Goodwill
The Group reviews Goodwill for indicators of impairment at least on an annual basis. This requires an estimation of the fair value of the cash-generating units to which the Goodwill are allocated. Estimating the fair value amount requires management to make an estimate of the expected future cash flows from the cash-generating unit in the forecasted period and also to determine a suitable discount rate in order to calculate the present value of those cash flows. The Group’s longer term forecasts are subject to a higher level of uncertainty as it mostly depends on consumer spending, market conditions and level of competition. For additional information on the impairment test, reference is made to note 14.1 - Intangible Assets.
3) SPECIFIC ACCOUNTING POLICIES
The following is a summary of specific accounting policies adopted by the Group in the preparation of the financial statements that materially affect the measurement of financial performance, cash flows and the financial position.
NOTES TO THE CONSOLIDATED FINANCIAL STATEMENTSFOR THE YEAR ENDED 31 MARCH 2019
PAGE 22 PAGE 23
BURGER FUEL WORLDWIDE LIMITED ANNUAL REPORT 2019
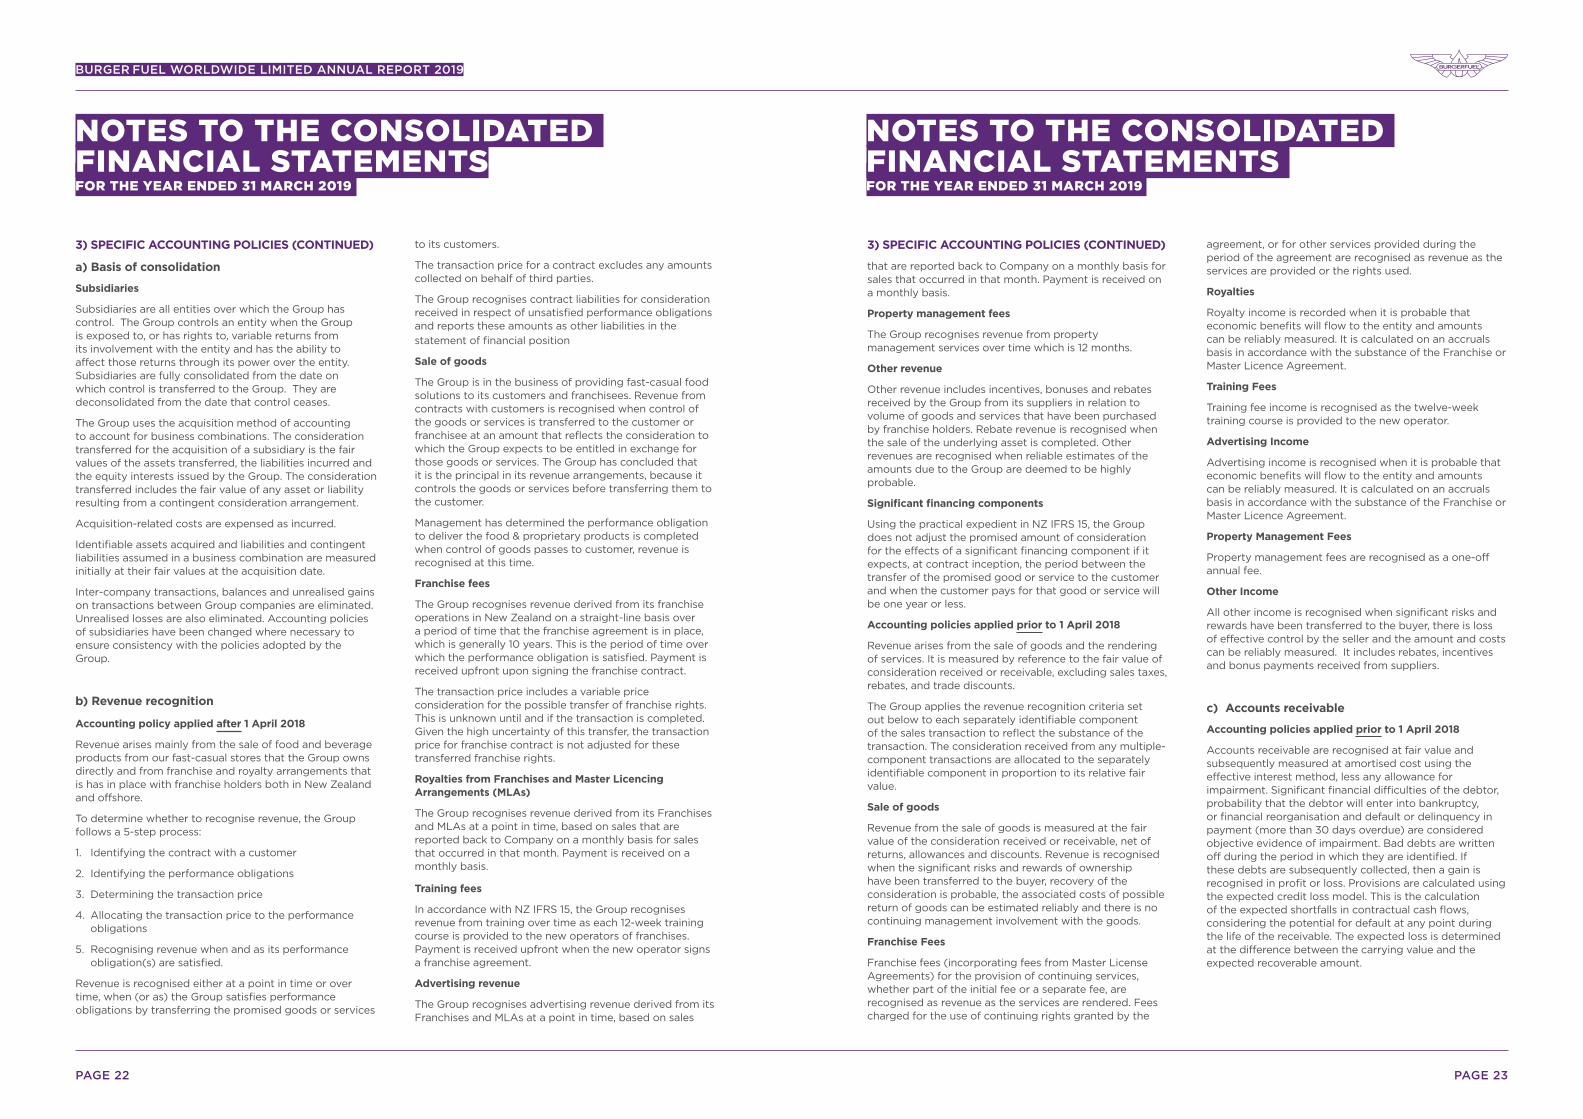
3) SPECIFIC ACCOUNTING POLICIES (CONTINUED)
a) Basis of consolidation
Subsidiaries
Subsidiaries are all entities over which the Group has control. The Group controls an entity when the Group is exposed to, or has rights to, variable returns from its involvement with the entity and has the ability to affect those returns through its power over the entity. Subsidiaries are fully consolidated from the date on which control is transferred to the Group. They are deconsolidated from the date that control ceases.
The Group uses the acquisition method of accounting to account for business combinations. The consideration transferred for the acquisition of a subsidiary is the fair values of the assets transferred, the liabilities incurred and the equity interests issued by the Group. The consideration transferred includes the fair value of any asset or liability resulting from a contingent consideration arrangement.
Acquisition-related costs are expensed as incurred.
Identifiable assets acquired and liabilities and contingent liabilities assumed in a business combination are measured initially at their fair values at the acquisition date.
Inter-company transactions, balances and unrealised gains on transactions between Group companies are eliminated. Unrealised losses are also eliminated. Accounting policies of subsidiaries have been changed where necessary to ensure consistency with the policies adopted by the Group.
b) Revenue recognition
Accounting policy applied after 1 April 2018
Revenue arises mainly from the sale of food and beverage products from our fast-casual stores that the Group owns directly and from franchise and royalty arrangements that is has in place with franchise holders both in New Zealand and offshore.
To determine whether to recognise revenue, the Group follows a 5-step process:
1. Identifying the contract with a customer
2. Identifying the performance obligations
3. Determining the transaction price
4. Allocating the transaction price to the performance obligations
5. Recognising revenue when and as its performance obligation(s) are satisfied.
Revenue is recognised either at a point in time or over time, when (or as) the Group satisfies performance obligations by transferring the promised goods or services
to its customers.
The transaction price for a contract excludes any amounts collected on behalf of third parties.
The Group recognises contract liabilities for consideration received in respect of unsatisfied performance obligations and reports these amounts as other liabilities in the
statement of financial position
Sale of goods
The Group is in the business of providing fast-casual food solutions to its customers and franchisees. Revenue from contracts with customers is recognised when control of the goods or services is transferred to the customer or franchisee at an amount that reflects the consideration to which the Group expects to be entitled in exchange for those goods or services. The Group has concluded that it is the principal in its revenue arrangements, because it controls the goods or services before transferring them to the customer.
Management has determined the performance obligation to deliver the food & proprietary products is completed when control of goods passes to customer, revenue is recognised at this time.
Franchise fees
The Group recognises revenue derived from its franchise operations in New Zealand on a straight-line basis over a period of time that the franchise agreement is in place, which is generally 10 years. This is the period of time over which the performance obligation is satisfied. Payment is received upfront upon signing the franchise contract.
The transaction price includes a variable price consideration for the possible transfer of franchise rights. This is unknown until and if the transaction is completed. Given the high uncertainty of this transfer, the transaction price for franchise contract is not adjusted for these transferred franchise rights.
Royalties from Franchises and Master Licencing Arrangements (MLAs)
The Group recognises revenue derived from its Franchises and MLAs at a point in time, based on sales that are reported back to Company on a monthly basis for sales that occurred in that month. Payment is received on a monthly basis.
Training fees
In accordance with NZ IFRS 15, the Group recognises revenue from training over time as each 12-week training course is provided to the new operators of franchises. Payment is received upfront when the new operator signs a franchise agreement.
Advertising revenue
The Group recognises advertising revenue derived from its Franchises and MLAs at a point in time, based on sales
NOTES TO THE CONSOLIDATED FINANCIAL STATEMENTSFOR THE YEAR ENDED 31 MARCH 2019
3) SPECIFIC ACCOUNTING POLICIES (CONTINUED)
that are reported back to Company on a monthly basis for sales that occurred in that month. Payment is received on a monthly basis.
Property management fees
The Group recognises revenue from property management services over time which is 12 months.
Other revenue
Other revenue includes incentives, bonuses and rebates received by the Group from its suppliers in relation to volume of goods and services that have been purchased by franchise holders. Rebate revenue is recognised when the sale of the underlying asset is completed. Other revenues are recognised when reliable estimates of the amounts due to the Group are deemed to be highly probable.
Significant financing components
Using the practical expedient in NZ IFRS 15, the Group does not adjust the promised amount of consideration for the effects of a significant financing component if it expects, at contract inception, the period between the transfer of the promised good or service to the customer and when the customer pays for that good or service will be one year or less.
Accounting policies applied prior to 1 April 2018
Revenue arises from the sale of goods and the rendering of services. It is measured by reference to the fair value of consideration received or receivable, excluding sales taxes, rebates, and trade discounts.
The Group applies the revenue recognition criteria set out below to each separately identifiable component of the sales transaction to reflect the substance of the transaction. The consideration received from any multiple-component transactions are allocated to the separately identifiable component in proportion to its relative fair value.
Sale of goods
Revenue from the sale of goods is measured at the fair value of the consideration received or receivable, net of returns, allowances and discounts. Revenue is recognised when the significant risks and rewards of ownership have been transferred to the buyer, recovery of the consideration is probable, the associated costs of possible return of goods can be estimated reliably and there is no continuing management involvement with the goods.
Franchise Fees
Franchise fees (incorporating fees from Master License Agreements) for the provision of continuing services, whether part of the initial fee or a separate fee, are recognised as revenue as the services are rendered. Fees charged for the use of continuing rights granted by the
agreement, or for other services provided during the period of the agreement are recognised as revenue as the services are provided or the rights used.
Royalties
Royalty income is recorded when it is probable that economic benefits will flow to the entity and amounts can be reliably measured. It is calculated on an accruals basis in accordance with the substance of the Franchise or Master Licence Agreement.
Training Fees
Training fee income is recognised as the twelve-week training course is provided to the new operator.
Advertising Income
Advertising income is recognised when it is probable that economic benefits will flow to the entity and amounts can be reliably measured. It is calculated on an accruals basis in accordance with the substance of the Franchise or Master Licence Agreement.
Property Management Fees
Property management fees are recognised as a one-off annual fee.
Other Income
All other income is recognised when significant risks and rewards have been transferred to the buyer, there is loss of effective control by the seller and the amount and costs can be reliably measured. It includes rebates, incentives and bonus payments received from suppliers.
c) Accounts receivable
Accounting policies applied prior to 1 April 2018
Accounts receivable are recognised at fair value and subsequently measured at amortised cost using the effective interest method, less any allowance for impairment. Significant financial difficulties of the debtor, probability that the debtor will enter into bankruptcy, or financial reorganisation and default or delinquency in payment (more than 30 days overdue) are considered objective evidence of impairment. Bad debts are written off during the period in which they are identified. If these debts are subsequently collected, then a gain is recognised in profit or loss. Provisions are calculated using the expected credit loss model. This is the calculation of the expected shortfalls in contractual cash flows, considering the potential for default at any point during the life of the receivable. The expected loss is determined at the difference between the carrying value and the expected recoverable amount.
NOTES TO THE CONSOLIDATED FINANCIAL STATEMENTS FOR THE YEAR ENDED 31 MARCH 2019

PAGE 24 PAGE 25
BURGER FUEL WORLDWIDE LIMITED ANNUAL REPORT 2019
3) SPECIFIC ACCOUNTING POLICIES (CONTINUED)
Accounting policy applied after 1 April 2018
Trade receivables and contract assets
The Group makes use of a simplified approach in accounting for trade receivables as well as contract assets and records the loss allowance as lifetime expected credit losses. These are the expected shortfalls in contractual cash flows, considering the potential for default at any point during the life of the financial instrument. In calculating, the Group uses its historical experience, external indicators and forward-looking information to calculate the expected credit losses.
The Group assesses the impairment of all its trade receivables on a specific, rather than a collective basis. If a trade receivable is considered credit impaired (e.g. the customer has failed to meet payments as due) the expected loss is determined at the difference between the carrying value and the expected recoverable amount.
Management has assessed the information available and concluded that no provision for expected credit losses was identified.
d) Inventories
Inventories are stated at the lower of cost and net realisable value after due consideration for excess and obsolete items. Cost is based on the first in, first out principle and includes expenditure incurred in acquiring the inventories and bringing them to their existing condition and location. Net realisable value is the estimated selling price in the ordinary course of business, less estimated selling expenses.
e) Financial instruments
Accounting policy applied after 1 April 2018
Recognition and derecognition
Financial assets and financial liabilities are recognised when the Group becomes a party to the contractual provisions of the financial instrument.
Financial assets are derecognised when the contractual rights to the cash flows from the financial assets expire, or when the financial asset and substantially all the risks and rewards are transferred. A financial liability is derecognised when it is extinguished, discharged, cancelled or expires.
Classification and initial measurement of financial assets
Except for those trade receivables that do not contain a significant financing component and are measured at the transaction price in accordance with NZ IFRS 15, all financial assets are initially measured at fair value adjusted for transaction costs (where applicable).
Financial assets, other than those designated and effective as hedging instruments, are classified into the following categories:
• amortised cost
• fair value through profit or loss (FVTPL)
• fair value through other comprehensive income (FVOCI).
The classification is determined by both:
• the entity’s business model for managing the financial asset
• the contractual cash flow characteristics of the financial asset.
All revenue and expenses relating to financial assets that are recognised in profit or loss are presented within finance costs, finance income or other financial items, except for impairment of trade receivables which is presented within impairment gains (losses) of financial assets in profit or loss.
Subsequent measurement of financial assets
Financial assets at amortised cost
Financial assets are measured at amortised cost if the assets meet the following conditions (and are not designated as FVTPL):
• they are held within a business model whose objective is to hold the financial assets and collect its contractual cash flows
• the contractual terms of the financial assets give rise to cash flows that are solely payments of principal and interest on the principal amount outstanding.
After initial recognition, these are measured at amortised cost using the effective interest method. Discounting is omitted where the effect of discounting is immaterial. The Group’s cash and cash equivalents, trade and most other receivables that fall into this category of financial instruments were previously classified as loans and receivables under NZ IAS 39. There has been no change in the carrying amounts due to this reclassification under NZ IFRS 9. These financial assets are classified at amortised cost as the Group intends to hold them and collect contractual cash flows.
Financial assets at fair value through profit or loss (FVTPL)
Financial assets that are held within a different business model than ‘hold to collect’ or ‘hold to collect and sell’, and financial assets whose contractual cash flows are not solely payments of principal and interest are accounted for at FVTPL. All derivative financial instruments fall into this category, except for those designated and effective as hedging instruments, for which the hedge accounting requirements apply (see overleaf).
NOTES TO THE CONSOLIDATED FINANCIAL STATEMENTS FOR THE YEAR ENDED 31 MARCH 2019
NOTES TO THE CONSOLIDATED FINANCIAL STATEMENTSFOR THE YEAR ENDED 31 MARCH 2019
3) SPECIFIC ACCOUNTING POLICIES (CONTINUED)
This category also contains any equity investment not designated at FVOCI on initial recognition, but the Group did not have any equity investments during the reporting period ended 31 March 2019.
Assets in this category are measured at fair value with gains or losses recognised in profit or loss. The fair values of financial assets in this category are determined by reference to active market transactions or using a valuation technique where no active market exists.
The Group had no financial assets that fell into this category during the year ended 31 March 2019.
Financial assets at fair value through other comprehensive income (FVOCI)
On initial recognition, the Group may make an irrevocable election (on an instrument by instrument basis) to designate investments in equity instruments as at FVTOCI. Designation at FVTOCI is not permitted if the equity investment is held for trading or if it is contingent consideration recognised by an acquirer in a business combination.
A financial asset is held for trading if:
• it has been acquired principally for the purpose of selling it in the near term; or
• on initial recognition it is part of a portfolio of identified financial instruments that the Group manages together and has evidence of a recent actual pattern of short-term profit-taking; or
• it is a derivative (except for a derivative that is a financial guarantee contract or a designated and effective hedging instrument).
Investments in equity instruments at FVTOCI are initially measured at fair value plus transaction costs. Subsequently, they are measured at fair value with gains and losses arising from changes in fair value recognised in other comprehensive income and accumulated in the investment’s revaluation reserve. The cumulative gain or loss is not be reclassified to profit or loss on disposal of the equity investments, instead, it is transferred to retained earnings.
Dividends on these investments in equity instruments are recognised in profit or loss in accordance with IFRS 9, unless the dividends clearly represent a recovery of part of the cost of the investment.
The Group has no financial assets measured at FVTOCI. Impairment of financial assets
The Group recognises a loss allowance for expected credit losses on investments in financial assets that are measured at amortised cost and contract assets. The amount of expected credit losses is updated at each reporting date
to reflect changes in credit risk since initial recognition of the respective financial instrument.
The Group recognises lifetime ECL for trade receivables and contract assets. The expected credit losses on these financial assets are estimated using a provision matrix based on the Group’s historical credit loss experience, adjusted for factors that are specific to the debtors, general economic conditions and an assessment of both the current as well as the forecast direction of conditions at the reporting date, including time value of money where appropriate.
For all other financial instruments, the Group recognises lifetime ECL when there has been a significant increase in credit risk since initial recognition. However, if the credit risk on the financial instrument has not increased significantly since initial recognition, the Group measures the loss allowance for that financial instrument at an amount equal to 12-month ECL.
Lifetime ECL represents the expected credit losses that will result from all possible default events over the expected life of a financial instrument. In contrast, 12-month ECL represents the portion of lifetime ECL that is expected to result from default events on a financial instrument that are possible within 12 months after the reporting date.
(i) Significant increase in credit risk
In assessing whether the credit risk on a financial instrument has increased significantly since initial recognition, the Group compares the risk of a default occurring on the financial instrument at the reporting date with the risk of a default occurring on the financial instrument at the date of initial recognition. In making this assessment, the Group considers both quantitative and qualitative information that is reasonable and supportable, including historical experience and forward-looking information that is available without undue cost or effort.
The nature of the Group’s trade receivables means there is little or no updated credit risk information that is routinely obtained and monitored on an individual instrument until a customer breaches the contractual terms.
Irrespective of the outcome of the above assessment, the Group presumes that the credit risk on a financial asset has increased significantly since initial recognition when contractual payments are more than 30 days past due, unless the Group has reasonable and supportable information that demonstrates otherwise.
The Group regularly monitors the effectiveness of the criteria used to identify whether there has been a significant increase in credit risk and revises them as appropriate to ensure that the criteria are capable of

PAGE 26 PAGE 27
BURGER FUEL WORLDWIDE LIMITED ANNUAL REPORT 2019
3) SPECIFIC ACCOUNTING POLICIES (CONTINUED)
identifying significant increase in credit risk before the amount becomes past due.
(ii) Definition of default
The Group considers that default has occurred when a financial asset is more than 90 days past due unless the Group has reasonable and supportable information to demonstrate that a more appropriate default criterion is required.
(iii) Credit-impaired financial assets
A financial asset is credit-impaired when one or more events that have a detrimental impact on the estimated future cash flows of that financial asset have occurred. Evidence that a financial asset is credit-impaired includes observable data about the following events:
a. significant financial difficulty of the borrower;
b. a breach of contract, such as a default or past due event (see (ii) above); and
c. it is becoming probable that the borrower will enter bankruptcy or other financial reorganisation.
(iv) Write off policy
The Group writes off a financial asset when there is information indicating that the borrower is in severe financial difficulty and there is no realistic prospect of recovery, e.g. when the borrower has been placed under liquidation or has entered into bankruptcy proceedings. Financial assets written off may still be subject to enforcement activities under the Group’s recovery procedures, taking into account legal advice where appropriate. Any recoveries made are recognised in profit or loss.
v) Measurement and recognition of expected credit losses
The measurement of expected credit losses is a function of the probability of default, loss given default (i.e. the magnitude of the loss if there is a default) and the exposure at default. The assessment of the probability of default and loss given default is based on historical data adjusted by forward-looking information as described above.
As for the exposure at default, for financial assets, this is represented by the assets’ gross carrying amount at the reporting date.
For financial assets, the expected credit loss is estimated as the difference between all contractual cash flows that are due to the Group in accordance with the contract and all the cash flows that the Group expects to receive, discounted at the original effective interest rate. If the Group has measured the loss allowance for a financial instrument at an amount equal to lifetime ECL in the previous reporting period,
but determines at the current reporting date that the conditions for lifetime ECL are no longer met, the Group measures the loss allowance at an amount equal to 12-month ECL at the current reporting date, except for assets for which simplified approach was used. The Group recognises an impairment gain or loss in profit or loss for all financial instruments with a corresponding adjustment to their carrying amount through a loss allowance account.
The implementation of IFRS 9 has not resulted in any changes to the Group’s impairment of financial assets.
Loans Receivable at amortised cost
The Group records loans receivable for loans to suppliers and employees. The Group records these at amortised cost using the effective interest method and assess these loans for impairment under the expected credit loss model, using 12 months expected losses. This is appropriate as management have assessed each counterparty as having a low risk of default and a strong capacity to meet their contractual cash flow obligations in the near term.
Derivative financial instruments and hedge accounting
The Group has not used any derivative instruments to manage its financial risks and it has not entered into any hedging arrangements during the reporting period ended 31 March 2019.
Financial Liabilities
These amounts represent unsecured liabilities for goods and services provided to the Group prior to the end of the financial year which are unpaid. Other financial liabilities are recognised initially at fair value and subsequently measured at amortised cost using the effective interest method. The Group’s other financial liabilities are trade and other payables, and these are usually paid within 30 days. There has been no change to classification or measurement under IFRS 9.
Accounting policies applied prior to 1 April 2018
The Group was required to classify all its financial instruments into one of the following four categories: loans and receivables, held to maturity investments, available for sale financial assets or fair value through profit or loss. Management determined the classification on initial recognition and re-evaluated this designation at every reporting date. At 31 March 2018 all of the Group’s financial assets were classified as loans and receivables and all its financial liabilities were accounted for at amortised cost.
Loans and Receivables
Loans and receivables are non-derivative financial assets with fixed or determinable payments that are not quoted in an active market. Loans and receivables are initially recognised at fair value plus transaction costs and are
NOTES TO THE CONSOLIDATED FINANCIAL STATEMENTS FOR THE YEAR ENDED 31 MARCH 2019
NOTES TO THE CONSOLIDATED FINANCIAL STATEMENTS FOR THE YEAR ENDED 31 MARCH 2019
3) SPECIFIC ACCOUNTING POLICIES (CONTINUED)
thereafter carried at amortised cost using the effective interest method. Loans and receivables are derecognised when the rights to receive cash flows from them have expired or have been transferred and the Group has transferred substantially all the risks and rewards of ownership. The Group assesses at each balance date whether there is objective evidence that a financial asset or a group of financial assets is impaired.
Financial Liabilities
These amounts represent unsecured liabilities for goods and services provided to the Group prior to the end of the financial year which are unpaid. Other financial liabilities are recognised initially at fair value and subsequently measured at amortised cost using the effective interest method. The Group’s other financial liabilities are trade and other payables, and these are usually paid within 30 days.
Derivatives and hedging activities
The Group has not used any derivative instruments to manage its financial risks and it has not entered into any hedging arrangements during the reporting period ended 31 March 2018.
f) Share Capital
Ordinary Shares
Incremental costs directly attributable to the issue of ordinary shares and share options are recognised as a deduction from equity.
g) Finance Income and Expense
For all financial instruments measured at amortised cost, interest income and expense is recorded at the effective interest rate.
h) Property, Plant and Equipment
Recognition and Measurement
Items of property, plant and equipment are measured at cost less accumulated depreciation and impairment losses.
Cost includes expenditures that are directly attributable to the acquisition of the asset. The cost of self-constructed assets includes the cost of materials and direct labour, any other costs directly attributable to bringing the asset to a working condition for its intended use, and the costs of dismantling and removing the items and restoring the site on which they are located. Purchased software that is integral to the functionality of the related equipment is capitalised as part of that equipment.
When parts of an item of property, plant and equipment have different useful lives, they are accounted for as separate items (major components) of property, plant and equipment.
Subsequent Costs
The cost of replacing part of an item of property, plant and equipment is recognised in the carrying amount of the item if it is probable that the future economic benefits embodied within the part will flow to the Group and its cost can be measured reliably. The costs of the day-to-day servicing of property, plant and equipment are recognised in profit and loss as incurred.
Property, plant and equipment are stated at cost less accumulated depreciation. The following depreciation rates have been used:
Motor Vehicles 16% - 36% diminishing value & straight line (USA)
Leasehold Improvements 9% - 26.4% diminishing value & straight line (USA)
Information Technology 33% - 67% diminishing value & straight line (USA)
Furniture & Fittings 10% - 80.4% diminishing value & straight line (USA)
Kitchen Equipment 13% - 39.6% diminishing value & straight line (USA)
Office Equipment 10% - 60% diminishing value & straight line (USA)
Where an asset is disposed of, the gain or loss recognised in the Statement of Comprehensive Income is calculated as the difference between the sale price and the carrying amount of the asset.
i) Leased Assets
Operating Leases
Operating lease payments are recognised as an expense in the periods the amounts are payable in the Statement of Comprehensive Income on a straight line basis.
j) Intangible Assets
The Group’s intangible assets have finite useful lives with the exception of Goodwill and are stated at cost less accumulated amortisation. The intangible assets are amortised in the Statement of Comprehensive Income on a straight line basis over the period during which benefits are expected to be derived, which is up to 10 years. Where there has been an impairment in the value, the balance has been written off in the Statement of Comprehensive Income.
Subsequent expenditure is capitalised only when it increases the future economic benefits embodied in the intangible asset to which it relates. All other expenditure is recognised in the Statement of Comprehensive Income when incurred.

PAGE 28 PAGE 29
BURGER FUEL WORLDWIDE LIMITED ANNUAL REPORT 2019
3) SPECIFIC ACCOUNTING POLICIES (CONTINUED)
As part of a business combination, an acquirer may acquire a right that it had previously granted to the acquiree to use one or more of the acquirer’s recognised or unrecognised assets. An example of such rights include a right to use the acquirer’s trade name under a franchise agreement. A reacquired right is an identifiable intangible asset that the acquirer recognises separately from goodwill. Reacquired rights are initially valued at the present value of the expected future cash flows, which is subsequently used as cost and amortised on a straight-line basis over its useful life, being the remaining contractual period without considering contractual extension possibilities, but not exceeding 10 years.
k) Employee Benefits
Short-term Benefits
Short-term employee benefit obligations are measured on an undiscounted basis and are expensed as the related service is provided.
A provision is recognised for the amount expected to be paid under short-term cash bonus or profit-sharing plans if the Group has a present legal or constructive obligation to pay this amount as a result of past service provided by the employee and the obligation can be estimated reliably.
The Group pays contributions to superannuation plans, such as KiwiSaver and 401(k) in the US. The Group has no further payment obligations once the contributions have been paid. The contributions are recognised as an employee benefit expense when they are due. Prepaid contributions are recognised as an asset to the extent that a cash refund or a reduction in the future payments is available.
l) Taxation
Income tax expense comprises current and deferred tax. Current and deferred tax are recognised as an expense or income in the profit or loss, except when they relate to items that are recognised outside profit or loss (whether in other comprehensive income or directly in equity), in which case the tax is also recognised outside profit or loss.
Current tax is the expected tax payable on the taxable income for the year, using tax rates enacted or substantively enacted at the reporting date, and any adjustment to tax payable in respect of previous years.
Deferred tax is provided using the liability method, providing for temporary differences between the carrying amounts of assets and liabilities for financial reporting purposes and the amounts used for taxation purposes. Temporary differences are not provided for the initial recognition of assets or liabilities that affect neither accounting nor taxable profit. The amount of deferred tax provided is based on the expected manner of realisation or settlement of the carrying amounts of assets and liabilities, using tax rates enacted or substantively enacted
at the balance date. A deferred tax asset is recognised only to the extent that it is probable that future taxable profits will be available against which the asset can be utilised. Deferred tax assets are reduced to the extent that it is no longer probable that the related tax benefit will be realised.
m) Goods and Services Tax (GST) & Value Added Tax (VAT)
The Statement of Comprehensive Income and Cash Flows has been prepared so that all components are stated exclusive of GST and VAT. All items in the Statement of Financial Position are stated net of GST and VAT, with the exception of receivables and payables, which include GST and VAT invoiced. The operations of the Group comprise both exempt and non-exempt supplies for GST and VAT purposes.
n) Foreign Currency
Foreign Currency Transactions
Transactions in foreign currencies are translated into the functional currencies of the entities within the Group at exchange rates at the date of the transactions. Monetary assets and liabilities denominated in foreign currencies at the reporting date are retranslated to the functional currency at the exchange rate at that date. The foreign currency gain or loss on monetary items is the difference between amortised cost in the functional currency at the beginning of the period, adjusted for effective interest and payments during the period, and the amortised cost in foreign currency translated at the exchange rate at the end of the period. Foreign currency differences arising on retranslation are recognised in the profit or loss.
Foreign Operations
The assets and liabilities of foreign operations are translated to New Zealand dollars at exchange rates at the reporting date. The revenue and expenses of foreign operations are translated to New Zealand dollars at the average exchange rates for the period where this rate approximates the rate at the date of the transaction.
Foreign currency differences are recognised in the Foreign Currency Translation Reserve (FCTR). When a foreign operation is disposed of, in part or in full, the relevant amount in the FCTR is transferred to the Statement of Comprehensive Income.
o) Statement of Cash Flows
Cash and cash equivalents comprise cash at bank and call deposits. Investing activities comprise the purchase and sale of fixed assets, acquisition of a subsidiary and intangible assets along with any funding made available or repaid from franchisees. Financing activities comprise any changes in equity and debt and the payment of dividends (if any). Operating activities include all transactions and other events that are not investing or financing activities.
NOTES TO THE CONSOLIDATED FINANCIAL STATEMENTS FOR THE YEAR ENDED 31 MARCH 2019
3) SPECIFIC ACCOUNTING POLICIES (CONTINUED)
p) Earnings and Net Tangible Assets Per Share
The Group presents basic and diluted Earnings Per Share (EPS) data for its ordinary shares. Basic EPS is calculated by dividing the profit or loss attributable to ordinary shareholders of the Group by the weighted average number of shares outstanding during the year. Diluted EPS is calculated by adjusting the profit or loss attributable to ordinary shareholders and the weighted average number of ordinary shares outstanding for the effects of all dilutive potential ordinary shares, which includes share options granted to employees.
The Group also presents Net Tangible Assets Per Share for its ordinary shares and it is calculated by dividing the net tangible assets of the Group by the number of shares outstanding at the end of the year.
q) Segment Reporting
Operating segments have been identified based on the information provided to the chief operating decision maker; being the Board of Directors.
The Group operates in four operating segments – these consist of the following geographical locations, New Zealand, Australia, United States of America and the Middle East.
There have been no changes from prior years in the measurement methods used to determine reported segment profit or loss.
r) Goodwill
Goodwill represents the future economic benefits arising from a business combination that are not individually identified and separately recognised. Goodwill is carried at cost less accumulated impairment losses. Refer to Note 14.1 for a description of impairment testing procedures.
s) Impairment Testing of Goodwill, Other Intangible Assets and Non-financial Assets
Impairment assessment purposes, assets are grouped at the lowest levels for which there are largely independent cash inflows (cash-generating units). As a result, some assets are tested individually for impairment and some are tested at cash-generating unit level. Goodwill is allocated to those cash-generating units that are expected to benefit from synergies of the related business combination and represent the lowest level within the Group at which management monitors goodwill.
Cash-generating units to which goodwill has been allocated (determined by the Group’s management as equivalent to its operating segments) are tested for impairment at least annually. All other individual assets or cash-generating units are tested for impairment whenever events or changes in circumstances indicate that the carrying amount may not be recoverable.
An impairment loss is recognised for the amount by which the asset’s or cash-generating unit’s carrying amount exceeds its recoverable amount, which is the higher of fair value less costs to sell and value-in-use. To determine the value-in-use, management estimates expected future cash flows from each cash-generating unit and determines a suitable interest rate in order to calculate the present value of those cash flows.
The data used for impairment testing procedures are directly linked to the Group’s latest approved budget, adjusted as necessary to exclude the effects of future reorganisations and asset enhancements. Discount factors are determined individually for each cash-generating unit and reflect management’s assessment of respective risk profiles, such as market and asset-specific risks factors.
The carrying amounts of the Group’s non-financial assets, other than inventories and deferred tax assets are reviewed at each reporting date to determine whether there is any indication of impairment. If any such indication exists then the asset’s recoverable amount is estimated.
An impairment loss is recognised if the carrying amount of an asset exceeds its recoverable amount. Impairment losses are recognised in the Statement of Comprehensive Income.
Impairment losses for cash-generating units reduce first the carrying amount of any Goodwill allocated to that cash-generating unit. Any remaining impairment loss is charged pro rata to the other assets in the cash-generating unit. With the exception of Goodwill, all assets are subsequently reassessed for indications that an impairment loss previously recognised may no longer exist. An impairment charge is reversed if the cash-generating unit’s recoverable amount exceeds its carrying amount.
4) NEW STANDARDS ADOPTED AND NEW STANDARDS AND INTERPRETATIONS NOT ADOPTED
(a) New Standards adopted as at 1 April 2018
NZ IFRS 15 Revenue from Contracts with Customers
NZ IFRS 15 Revenue from Contracts with Customers and the related Clarifications to IFRS 15 Revenue from Contracts with Customers (NZ IFRS 15) replace NZ IAS 18 Revenue (NZ IAS 18), NZ IAS 11 Construction Contracts (NZ IAS 11), and several revenue-related interpretations. The new standard has been applied retrospectively without restatement, with the cumulative effect of initial application recognised as an adjustment to the opening balance of retained earnings at 1 April 2018. In accordance with the transition guidance, NZ IFRS 15 has only been applied to contracts that are incomplete as at 1 April 2018.
NOTES TO THE CONSOLIDATED FINANCIAL STATEMENTS FOR THE YEAR ENDED 31 MARCH 2019

PAGE 30 PAGE 31
BURGER FUEL WORLDWIDE LIMITED ANNUAL REPORT 2019
4) NEW STANDARDS ADOPTED AND NEW STANDARDS AND INTERPRETATIONS NOT ADOPTED (CONTINUED)
The adoption of NZ IFRS 15 has mainly affected the following areas:
• Franchising fees
• Master licensing agreement fees
Franchise Agreement fees
Under NZ IAS 18 Revenue, revenue from the sale of franchises in New Zealand for the right to operate for 10 years was recognised when the contracts between the Group and franchisees and had been signed. Revenue arising from this source was recognised in full at that point in time when the contract was signed as the Group determined that it had no further obligations to fulfil under the agreement, requiring it to defer revenue.
However, with the revenue recognition model changing from a risk and rewards determination to one of control, NZ IFRS 15 requires franchise fees to be recognised on a systematic (i.e. straight line) basis over the life of the franchise agreement, in line with the satisfaction of the Group’s performance obligations, that is, the granting of franchise rights. As a result, some of the revenue that had previously been recognised under NZ IAS 18 needs to be written back and released on a straight-line basis over the remaining life of the outstanding contract periods.
Master Licensing Agreement (MLA) fees
Under NZ IAS 18 Revenue, revenue from signing of an MLA for the right to operate for 20 years in a particular country was recognised when the MLAs had been signed. Revenue arising from this source was recognised in full at that point in time when the contract was signed as the Group determined that it had no further obligations to fulfil under the agreement, requiring it to defer revenue.
Similar to franchise fees, the MLA amounts received in cash at the time of signing the agreement, under NZ IFRS 15 are now required to be recognised over a period of time, in line with the satisfaction of the Group’s performance obligations, that is, the granting of licence rights.
On the date of initial application of NZ IFRS 15 on 1 April 2018, the impact to retained earnings of the Group is as follows:
Impact Area Retained Earnings Effect
Franchising fees 1,138,106 Master Licence fees 863,789 IFRS 15 Tax adjustment (560,707)
Total 1,441,188
NZ IFRS 9 Financial Instruments
NZ IFRS 9 Financial Instruments (NZ IFRS 9) replaces NZ IAS 39 Financial Instruments: Recognition and Measurement (NZ IAS 39). It makes major changes to the previous guidance on the classification and measurement of financial assets and introduces an ‘expected credit loss’ model for the impairment of financial assets. It also considers accounting for derivatives and hedge accounting arrangements, neither of which have been used by the Group.
When adopting NZ IFRS 9, the Group applied transitional relief that is provided for in this standard and opted not to restate prior periods. Differences arising from the adoption of NZ IFRS 9 in relation to classification, measurement and impairment have been recognised in retained earnings on the date of initial application, 1 April 2018. The Group’s trade and other receivables, loans receivable and investments in financial assets measured at amortised cost, are affected by applying NZ IFRS 9’s expected credit loss model. Contract assets arising from NZ IFRS 15 are also affected by applying NZ IFRS 9’s expected credit loss model however the Group did not have any of these financial assets on the date of initial application.
The adoption of NZ IFRS 9 has not impacted the classification and measurement of financial assets or the Group’s decision not to use hedge accounting. It has however, had an impact on the way impairment losses have been calculated, although this has not resulted in any quantitative change to the amount of impairment determined.
From 1 April 2018, NZ IFRS 9 and NZ IFRS 15 have been adopted, without restating comparative information. The impact of the new standards has been recognised in the opening balance sheet of 1 April 2018. The table below summarises the adjustments recognised for each individual account. Accounts that were not affected by the changes have not been included.
31 March
2018 as
originally
presented
1 April
2018
IFRS 9
adjustments
1 April
2018
IFRS 15
adjustments
1 April 2018
restated
Contract
Liabilities - - (2,001,895) (2,001,895)
Deferred
Tax Asset 188,180 - 560,707 748,887
Retained
Earnings 13,203,245 - (1,441,188) 11,762,057
NOTES TO THE CONSOLIDATED FINANCIAL STATEMENTS FOR THE YEAR ENDED 31 MARCH 2019
4) NEW STANDARDS ADOPTED AND NEW STANDARDS AND INTERPRETATIONS NOT ADOPTED (CONTINUED)
(b) New Standards approved but not yet adopted
NZ IFRS 16 – Leases (effective date from 1 April 2019)
NZ IFRS 16 sets out the principles for the recognition, measurement, presentation and disclosure of leases. It provides much improved transparency and comparability of the Groups’ lease assets and lease liabilities for investors and other users of general purpose financial statements and applies to all Tier 1 and Tier 2 for-profit reporting entities, and is effective for annual periods beginning on or after 1 January 2019.
The Standard eliminates the classification of leases as either operating leases or finance leases. Instead, there is a single lessee model which requires a lessee to recognise on its statement of financial position assets and liabilities for all leases with a term of more than 12 months, unless the underlying asset is of low value.
NZ IFRS 16 will significantly impact the Group’s Statement of Financial Position as they hold the head leases on all the New Zealand franchised and Company owned stores. In addition to the head office & warehouse leases, the Group at 31 March 2019 holds the head leases on all 56 Burger Fuel stores in New Zealand with 53 of these being franchised stores. The value of the leases that will be capitalised in the Group’s Statement of Financial Position at 1 April 2019 is currently estimated to be $30.7M.
The BFW occupied leases
The Group will be recognising an estimated $7.2M right of use asset and an offsetting lease liability as at 1 April 2019 for the current occupied leases. These current occupied leases will be amortised to the Statement of Comprehensive Income over the expected lease term of the underlying right of use assets as depreciation expense, estimated to be $0.6M per annum.
The BFW non - occupied leases
The Group will be recognising an estimated $23.5M lease receivable and offsetting lease liability as at 1 April 2019 for the current non-occupied leases that have been licenced to the franchisees on the same terms. These current non-occupied leases will be recognised in the Statement of Comprehensive Income as interest income & interest expense over the term of the lease. This is estimated to be an expense of $1.3M per annum in FY20 but will be negated with a lease income entry in the financial statements to recognise the fact that the leased premises have been licenced to the franchisees.
The right of use asset & lease liability amount is calculated to the lease expiry together with periods covered by an option to extend, if the Group is reasonably certain to exercise that option. The Group’s operating lease commitments as at 31 March 2019 are set out in Note 22.
The indicative impacts of implementing NZ IFRS 16 are as follows for all leases that the Group is a party to:
Initial recognition and measurement:
• Initial measurement of the right of use (‘ROU’) assets (occupied leases) and lease receivable (non-occupied leases) would include the initial present value of the lease liability, the initial direct costs, prepayments made to lessor, less any lease incentives received from the lessor and restoration, removal and dismantling costs; and
• Recognition of a lease liability, which would reflect the initial measurement of the present value of lease payments, including reasonably certain renewals. The lease payments are discounted using the Group’s incremental borrowing rate.
• Reduction of rent expense in the Statement of Comprehensive Income of an estimated $760K.
Subsequent measurement:
• ROU asset: Depreciate the ROU asset based on NZ IAS 16 ‘Property, plant and equipment’ and impairment test using NZ IAS 36 ‘Impairment of Assets’;
• Lease receivable: Accrete receivable based on the effective interest method, using a discount rate determined at lease commencement (as long as a reassessment and a change in the discount rate have not occurred) and reduce the receivable by payments made and the Lease liability: Accrete liability based on the effective interest method, using a discount rate determined at lease commencement (as long as a reassessment and a change in the discount rate have not occurred) and reduce the liability by payments made.
NZ IFRS 16 will have a material impact on the Group’s financial statements and will be dependent on the leases that the Group is a party to as at the beginning of the year ended 31 March 2020. The following is an estimate of the impact on the fiscal year 2020 financial statements.
NOTES TO THE CONSOLIDATED FINANCIAL STATEMENTS FOR THE YEAR ENDED 31 MARCH 2019

PAGE 32 PAGE 33
BURGER FUEL WORLDWIDE LIMITED ANNUAL REPORT 2019
NOTES TO THE CONSOLIDATED FINANCIAL STATEMENTSFOR THE YEAR ENDED 31 MARCH 2019
Occupied Leases Non-Occupied Leases Total Leases
Right of use asset $7,225,814 - $7,225,814
Lease Receivable - $23,479,443 $23,479,443
Lease Liability ($7,225,814) ($23,479,443) ($30,705,257)
- - -
Depreciation $614,454 - $614,454
Interest Expense $408,748 $1,328,178 $1,736,926
Interest Income - ($1,328,178) ($1,328,178)
1,023,202 - 1,023,202
5) REVENUE
2019 2018
$ $
Sale of Goods 8,687,830 12,616,536
Franchising Fees 361,480 495,000
Training Fees 30,000 15,000
Royalties 5,938,200 6,007,718
Advertising Fees 3,854,686 3,872,596
Property Management Fees 55,000 55,000
Gain on Sale of Fixed Assets 7,576 -
Foreign Exchange Gains / (Losses) 40,791 (42,290)
Other Income 1,924,352 1,669,594
20,899,915 24,689,154
4) NEW STANDARDS ADOPTED AND NEW STANDARDS AND INTERPRETATIONS NOT ADOPTED (CONTINUED)
NOTES TO THE CONSOLIDATED FINANCIAL STATEMENTS FOR THE YEAR ENDED 31 MARCH 2019
6) EXPENSES
2019 2018
$ $
Operating expenses include:
Cost of Sales 3,690,870 6,327,304
Rental and Operating Lease Costs 760,285 1,011,274
Loss on Disposal of Property, Plant and Equipment 73,477 190,547
Loss on Disposal of US Entity (refer Note 31) - 880,846
Directors’ Fees (refer Note 24) 120,000 120,000
Wages and Salaries 4,687,672 5,149,328
Contributions to a defined contribution plan 159,275 161,099
Key management personnel costs: (refer Note 24)
- Salary and other short-term benefits 2,680,416 2,694,584
Auditors’ remuneration – Audit Services – Baker Tilly Staples Rodway:
- Audit of Financial Statements 88,721 84,870
- Tax and other compliance services 35,766 19,208
Other Operating Expenses 3,031,875 3,326,541
Provision for Doubtful Debts (refer Note 9) (31,709) 129,417
Write-off of obsolete signage (refer Note 10) - 165,505
Advertising Expenditure 3,112,323 3,892,396
18,408,971 24,152,919
The above key management personnel costs include remuneration of the Group Chief Executive and the members of the executive team.

PAGE 34 PAGE 35
BURGER FUEL WORLDWIDE LIMITED ANNUAL REPORT 2019
NOTES TO THE CONSOLIDATED FINANCIAL STATEMENTS FOR THE YEAR ENDED 31 MARCH 2019
7) INCOME TAX
2019 2018
$ $
Taxation expense is represented by:
Current Tax 652,366 520,811
Deferred Tax (32,928) (93,215)
619,438 427,596
Profit / (Loss) before income tax expense 1,855,779 (35,466)
Timing differences & non-deductible expenses:
50% entertainment 50,896 61,337
Write-off of US Debtors - (1,148,504)
Non-deductible expenditure 189,955 -
Depreciation & Amortisation 33,832 12,513
IFRS 15 Adjustment 24,854 -
Accruals 34,763 12,301
Prepayments (18,854) 4,429
Make good provision 1,200 1,200
Holiday pay not paid out within 63 days 114,660 (20,036)
Deemed Income relating to closure of US operations - 724,518
Provision for Doubtful Debts (31,709) 129,417
US Depreciation - (25,278)
Other - (2,004)
399,597 (250,107)
Taxable Profit / (Loss) 2,255,376 (285,573)
Profit / (Loss) made by Australian and US Entities (103,354) 2,862,866
Non-taxable Middle East Income (14,984) (912,287)
Tax Losses utilised - -
Net Taxable Profit 2,137,038 1,665,006
Taxation at the company’s effective tax rate 598,371 466,202
Deferred tax movement P&L (32,928) (93,215)
Under Provision of Prior Period 53,995 54,609
Total income tax expense per statement of comprehensive income 619,438 427,596
NOTES TO THE CONSOLIDATED FINANCIAL STATEMENTS FOR THE YEAR ENDED 31 MARCH 2019
2019 2018
Reconciliation of deferred tax asset: $ $
Deferred tax on temporary differences
Opening balance 188,180 94,965
Over provision of prior period (51,244) 14,223
Opening IFRS 15 adjustment 560,707 -
Brand Asset (26,133) -
Provision for employee benefits 32,105 (5,610)
Provisions for make good 336 336
Allowance for impaired assets (8,879) 70,000
Depreciation 9,473 3,504
Accruals 9,734 12,112
Deferred revenue 6,959 -
Prepayments (5,279) (1,350)
715,959 188,180
Opening Balance 188,180 94,965
Charged to profit or loss 18,316 78,992
Opening adjustment to retained earnings for IFRS 15 560,707 -
Over provision of prior period (51,244) 14,223
Closing Balance 715,959 188,180
The Group has $3,627,539 of unrecognised losses to be carried forward (2018: $4,032,111). The potential benefit of these losses is $952,832 (2018: $1,128,991) which has not been recognised in the financial statements. The losses carried forward relate to the Australian and US operations which are not currently profitable.
The Group has recognised a deferred tax asset of $715,959 (2018: $188,180) with respect to other temporary differences. This has been recognised as it is probable that future taxable profit will be available to allow the asset to be utilised.
The weighted average tax rate of the Group is effectively 28% based on earnings in NZ, USA and Australia (2018: 28% based on operating in New Zealand, USA and Australia). There are no other tax jurisdictions, other than New Zealand, USA and Australia, in which the Group earns taxable income.
7) INCOME TAX (CONTINUED)
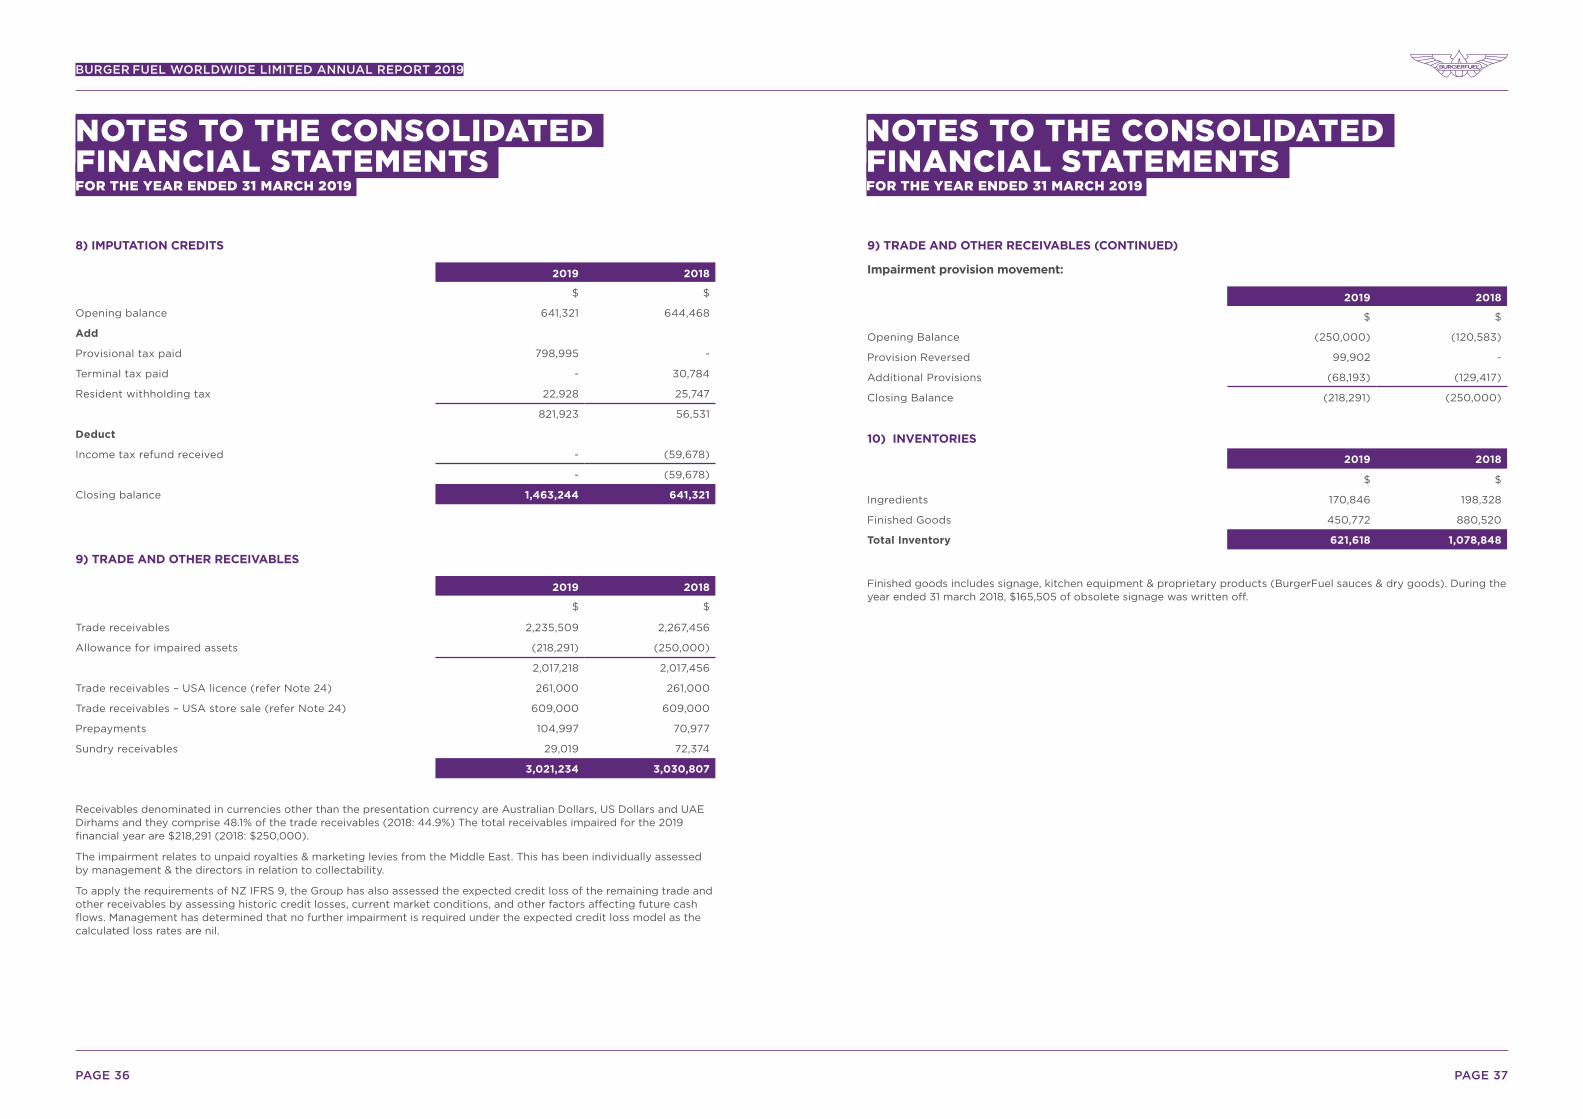
PAGE 36 PAGE 37
BURGER FUEL WORLDWIDE LIMITED ANNUAL REPORT 2019
NOTES TO THE CONSOLIDATED FINANCIAL STATEMENTS FOR THE YEAR ENDED 31 MARCH 2019
8) IMPUTATION CREDITS
2019 2018
$ $
Opening balance 641,321 644,468
Add
Provisional tax paid 798,995 -
Terminal tax paid - 30,784
Resident withholding tax 22,928 25,747
821,923 56,531
Deduct
Income tax refund received - (59,678)
- (59,678)
Closing balance 1,463,244 641,321
9) TRADE AND OTHER RECEIVABLES
2019 2018
$ $
Trade receivables 2,235,509 2,267,456
Allowance for impaired assets (218,291) (250,000)
2,017,218 2,017,456
Trade receivables – USA licence (refer Note 24) 261,000 261,000
Trade receivables – USA store sale (refer Note 24) 609,000 609,000
Prepayments 104,997 70,977
Sundry receivables 29,019 72,374
3,021,234 3,030,807
Receivables denominated in currencies other than the presentation currency are Australian Dollars, US Dollars and UAE Dirhams and they comprise 48.1% of the trade receivables (2018: 44.9%) The total receivables impaired for the 2019 financial year are $218,291 (2018: $250,000).
The impairment relates to unpaid royalties & marketing levies from the Middle East. This has been individually assessed by management & the directors in relation to collectability.
To apply the requirements of NZ IFRS 9, the Group has also assessed the expected credit loss of the remaining trade and other receivables by assessing historic credit losses, current market conditions, and other factors affecting future cash flows. Management has determined that no further impairment is required under the expected credit loss model as the calculated loss rates are nil.
NOTES TO THE CONSOLIDATED FINANCIAL STATEMENTS FOR THE YEAR ENDED 31 MARCH 2019
Impairment provision movement:
2019 2018
$ $
Opening Balance (250,000) (120,583)
Provision Reversed 99,902 -
Additional Provisions (68,193) (129,417)
Closing Balance (218,291) (250,000)
10) INVENTORIES
2019 2018
$ $
Ingredients 170,846 198,328
Finished Goods 450,772 880,520
Total Inventory 621,618 1,078,848
Finished goods includes signage, kitchen equipment & proprietary products (BurgerFuel sauces & dry goods). During the year ended 31 march 2018, $165,505 of obsolete signage was written off.
9) TRADE AND OTHER RECEIVABLES (CONTINUED)

PAGE 38 PAGE 39
BURGER FUEL WORLDWIDE LIMITED ANNUAL REPORT 2019
NOTES TO THE CONSOLIDATED FINANCIAL STATEMENTS FOR THE YEAR ENDED 31 MARCH 2019
11) PROPERTY, PLANT & EQUIPMENT
2019 Motor vehicles
Office equipment
Furniture & fittings IT
$ $ $ $
Cost
Balance 1 April 2018 952,001 108,851 1,229,636 1,245,953
Additions 28,660 735 123,060 226,478
Disposals (21,505) (486) (34,247) (22,994)
Cost at 31 March 2019 959,156 109,100 1,318,449 1,449,437
Depreciation and impairment losses
Balance 1 April 2018 745,403 74,714 726,355 963,255
Depreciation for the year 60,683 6,409 123,710 196,170
Foreign exchange impact (691) - - (122)
Balance 31 March 2019 805,395 81,123 850,065 1,159,303
Net Book Value
Balance 1 April 2018 206,598 34,137 503,281 282,698
Depreciation for the year (60,683) (6,409) (123,710) (196,170)
Additions 28,660 735 123,060 226,478
Disposals (21,505) (486) (34,247) (22,994)
Foreign exchange impact 691 - - 122
Net Book Value at 31 March 2019 153,761 27,977 468,384 290,134
2019Kitchen
equipmentLeasehold
improvements Total
$ $ $
Cost
Balance 1 April 2018 711,013 1,672,597 5,920,051
Additions 214,476 277,390 870,799
Disposals (63,463) - (142,695)
Cost at 31 March 2019 862,026 1,949,987 6,648,155
Depreciation and impairment losses
Balance 1 April 2018 329,313 693,883 3,532,923
Depreciation for the year 78,853 111,518 577,343
Foreign exchange impact - - (813)
Balance 31 March 2019 408,166 805,401 4,109,453
-
Net Book Value 453,860
Balance 1 April 2018 381,700 978,714 2,387,128
Depreciation for the year (78,853) (111,518) (577,343)
Additions 214,476 277,390 870,799
Disposals (63,463) - (142,695)
Foreign exchange impact - - 813
Net Book Value at 31 March 2019 453,860 1,144,586 2,538,702
NOTES TO THE CONSOLIDATED FINANCIAL STATEMENTS FOR THE YEAR ENDED 31 MARCH 2019
11) PROPERTY, PLANT & EQUIPMENT (CONTINUED)

PAGE 40 PAGE 41
BURGER FUEL WORLDWIDE LIMITED ANNUAL REPORT 2019
NOTES TO THE CONSOLIDATED FINANCIAL STATEMENTS FOR THE YEAR ENDED 31 MARCH 2019
2018 Motor vehicles
Office equipment
Furniture & fittings IT
$ $ $ $
Cost
Balance 1 April 2017 1,104,942 108,285 1,143,943 1,049,018
Additions 157,663 1,715 437,177 284,637
Disposals (310,604) (1,149) (351,484) (87,702)
Cost at 31 March 2018 952,001 108,851 1,229,636 1,245,953
Depreciation and impairment losses
Balance 1 April 2017 668,926 68,670 622,397 779,708
Depreciation for the year 69,345 6,871 102,153 187,002
Foreign exchange impact 7,132 (827) 1,805 (3,455)
Balance 31 March 2018 745,403 74,714 726,355 963,255
Net Book Value
Balance 1 April 2017 436,016 39,615 521,546 269,310
Depreciation for the year (69,345) (6,871) (102,153) (187,002)
Additions 157,663 1,715 437,177 284,637
Disposals (310,604) (1,149) (351,484) (87,702)
Foreign exchange impact (7,132) 827 (1,805) 3,455
Net Book Value at 31 March 2018 206,598 34,137 503,281 282,698
11) PROPERTY, PLANT & EQUIPMENT (CONTINUED)
2018Kitchen
equipmentLeasehold
improvements Total
$ $ $
Cost
Balance 1 April 2017 598,527 2,264,153 6,268,868
Additions 434,726 582,811 1,898,729
Disposals (322,240) (1,174,367) (2,247,546)
Cost at 31 March 2018 711,013 1,672,597 5,920,051
Depreciation and impairment losses
Balance 1 April 2017 269,330 581,676 2,990,707
Depreciation for the year 59,221 110,735 535,327
Foreign exchange impact 762 1,472 6,889
Balance 31 March 2018 329,313 693,883 3,532,923
-
Net Book Value 453,860
Balance 1 April 2017 329,197 1,682,477 3,278,161
Depreciation for the year (59,221) (110,735) (535,327)
Additions 434,726 582,811 1,898,729
Disposals (322,240) (1,174,367) (2,247,546)
Foreign exchange impact (762) (1,472) (6,889)
Net Book Value at 31 March 2018 381,700 978,714 2,387,128
The gain on sale recorded in the Statement of Comprehensive Income was $7,576 (2018: Nil), relating to the sale of motor vehicles.
In 2018 all the assets in Australia were written off or sold to the New Zealand entity and the US entity BF Indiana Two LLC was sold to the Founding Director. (Refer note 31 for additional information on the US entity sale).
NOTES TO THE CONSOLIDATED FINANCIAL STATEMENTS FOR THE YEAR ENDED 31 MARCH 2019
11) PROPERTY, PLANT & EQUIPMENT (CONTINUED)

PAGE 42 PAGE 43
BURGER FUEL WORLDWIDE LIMITED ANNUAL REPORT 2019
NOTES TO THE CONSOLIDATED FINANCIAL STATEMENTS FOR THE YEAR ENDED 31 MARCH 2019
Subsidiary Companies Country of Incorporation Interest Held 2019 Interest Held 2018
BF Lease Company Limited New Zealand 100% 100%
BF Lease Company No 1 Limited New Zealand 100% 100%
BF Lease Company No 2 Limited New Zealand 100% 100%
BF Lease Company No 3 Limited New Zealand 100% 100%
BF Lease Company No 4 Limited New Zealand 100% 100%
BF Lease Company No 5 Limited New Zealand 100% 100%
BF Lease Company No 6 Limited New Zealand 100% 100%
BF Lease Company No 7 Limited New Zealand 100% 100%
BF Lease Company No 8 Limited New Zealand 100% 100%
BF Lease Company No 9 Limited New Zealand 100% 100%
BF Lease Company No 10 Limited New Zealand 100% 100%
BF Lease Company No 11 Limited New Zealand 100% 100%
BF Lease Company No 12 Limited New Zealand 100% 100%
BF Lease Company No 13 Limited New Zealand 100% 100%
BF Lease Company No 14 Limited New Zealand 100% 100%
BF Lease Company No 15 Limited New Zealand 100% 100%
BF Lease Company No 16 Limited New Zealand 100% 100%
BF Lease Company No 17 Limited New Zealand 100% 100%
BF Lease Company No 18 Limited New Zealand 100% 100%
BF Lease Company No 19 Limited New Zealand 100% 100%
BF Lease Company No 20 Limited New Zealand 100% 100%
BF Lease Company No 21 Limited New Zealand 100% 100%
BF Lease Company No 22 Limited New Zealand 100% 100%
BF Lease Company No 23 Limited New Zealand 100% 100%
BF Lease Company No 24 Limited New Zealand 100% 100%
BF Lease Company No 25 Limited New Zealand 100% 100%
BF Lease Company No 26 Limited New Zealand 100% 100%
BF Lease Company No 27 Limited New Zealand 100% 100%
BF Lease Company No 28 Limited New Zealand 100% 100%
BF Lease Company No 29 Limited New Zealand 100% 100%
BF Lease Company No 30 Limited New Zealand 100% 100%
BF Lease Company No 31 Limited New Zealand 100% 100%
BF Lease Company No 32 Limited New Zealand 100% 100%
12) INVESTMENT IN SUBSIDIARIES
The Parent Company’s investment in the subsidiaries comprises shares at cost. All subsidiaries have a 31 March balance date.
NOTES TO THE CONSOLIDATED FINANCIAL STATEMENTS FOR THE YEAR ENDED 31 MARCH 2019
Subsidiary Companies Country of Incorporation Interest Held 2019 Interest Held 2018
BF Lease Company No 33 Limited New Zealand 100% 100%
BF Lease Company No 34 Limited New Zealand 100% 100%
BF Lease Company No 35 Limited New Zealand 100% 100%
BF Lease Company No 36 Limited New Zealand 100% 100%
BF Lease Company No 37 Limited New Zealand 100% 100%
BF Lease Company No 38 Limited New Zealand 100% 100%
BF Lease Company No 39 Limited New Zealand 100% 100%
BF Lease Company No 40 Limited New Zealand 100% 100%
BF Lease Company No 41 Limited New Zealand 100% 100%
BF Lease Company No 42 Limited New Zealand 100% 100%
BF Lease Company No 43 Limited New Zealand 100% 100%
BF Lease Company No 44 Limited New Zealand 100% 100%
BF Lease Company No 45 Limited New Zealand 100% 100%
BF Lease Company No 46 Limited New Zealand 100% 100%
BF Lease Company No 47 Limited New Zealand 100% 100%
BF Lease Company No 48 Limited New Zealand 100% 100%
BF Lease Company No 49 Limited New Zealand 100% 100%
BF Lease Company No 50 Limited New Zealand 100% 100%
Burger Fuel (Dubai) NZ Limited New Zealand 100% 100%
Burger Fuel (ME) DMCC Dubai 100% 100%
Burger Fuel International Limited New Zealand 100% 100%
Burger Fuel (Australia) Pty Limited New Zealand 100% 100%
Burger Fuel (Australia) No2 Pty Limited New Zealand 100% 100%
Burger Fuel International Management Limited New Zealand 100% 100%
Burger Fuel Limited New Zealand 100% 100%
BurgerFuel Henderson Limited New Zealand 100% 100%
Burger Fuel Takapuna Limited New Zealand 100% 100%
Winner Winner Limited New Zealand 100% 100%
Shake Out Limited New Zealand 100% 100%
Concept Brands Limited New Zealand 100% -
Burger Fuel Pty Limited (formerly Kincro Holdings Pty Limited) Australia 100% 100%
Burger Fuel Australia Pty Limited Australia 100% 100%
Burger Fuel (USA) Inc. United States of America 100% 100%
Burger Fuel (USA) Management Inc. United States of America 100% 100%
12) INVESTMENT IN SUBSIDIARIES (CONTINUED)

PAGE 44 PAGE 45
BURGER FUEL WORLDWIDE LIMITED ANNUAL REPORT 2019
NOTES TO THE CONSOLIDATED FINANCIAL STATEMENTS FOR THE YEAR ENDED 31 MARCH 2019
The principal activities of the subsidiaries are:
Burger Fuel Limited – Franchise systems – gourmet burger restaurants.
Burger Fuel International Limited – Holds patents, trademarks and licences and holds the international Master Franchise Agreements.
Burger Fuel International Management Limited – Owns the BurgerFuel Australia operation and holds the international Master Franchise Agreements.
Burger Fuel (Australia) Pty Limited – Non trading.
Burger Fuel (Australia) No2 Pty Limited – Non trading.
Burger Fuel Australia Pty Limited – Non trading.
Burger Fuel Pty Limited – Administration and sauce manufacturing.
Burger Fuel (ME) DMCC – Dubai based trading company
Burger Fuel (Dubai) NZ Limited – Holding company of the subsidiary in Dubai.
BurgerFuel Henderson Limited – New Zealand based company trading as restaurant.
Burger Fuel Takapuna Limited – New Zealand based company trading as restaurant.
Burger Fuel (USA) Inc. – Non trading.
Burger Fuel (USA) Management Inc. – USA Management Company.
Winner Winner Limited – Non trading.
Shake Out Limited – New Zealand based company trading as restaurant.
Concept Brands Limited - Franchise systems – Shake Out and Winner Winner brands.
All other companies are head lease holders for store premises in New Zealand.
12) INVESTMENT IN SUBSIDIARIES (CONTINUED) 13) LOANS
2019 2018
$ $
Loans to Third Parties
Advance to Supplier 157,606 133,000
Advances to staff 13,294 -
Impairment provision - -
170,900 133,000
Total Loans 170,900 133,000
Current 170,900 133,000
Non-current - -
170,900 133,000
Advances to suppliers and staff
The advance to a supplier is to assist ilabb Limited with the stock holding of the BurgerFuel uniforms. The loan is interest bearing 3% (2018: 3%), secured over the uniform inventory and is repayable on demand. Two advances to staff have been made during the year that are unsecured, interest bearing (0% & 5%) and are payable in regular instalments.
NOTES TO THE CONSOLIDATED FINANCIAL STATEMENTS FOR THE YEAR ENDED 31 MARCH 2019

PAGE 46 PAGE 47
BURGER FUEL WORLDWIDE LIMITED ANNUAL REPORT 2019
2019 Key Money
Brand Assets Goodwill
Reacquired Rights
Domain Name Patent
Trade Marks Total
$ $ $ $ $ $ $ $
Cost
Balance 1 April 2018 90,000 100,000 1,639,279 250,760 62,305 36,127 949,268 3,127,739
Acquisitions - 121,333 - - 13,408 459 59,047 194,247
Balance at 31 March 2019 90,000 221,333 1,639,279 250,760 75,713 36,586 1,008,315 3,321,986
Amortisation
Balance 1 April 2018 84,957 2,917 - 27,862 54,557 24,166 408,091 602,550
Current year amortisation 4,655 13,639 - 27,862 20,193 2,817 105,482 174,648
Balance 31 March 2019 89,612 16,556 - 55,724 74,750 26,983 513,573 777,198
Net Book Value
Balance 1 April 2018 5,043 97,083 1,639,279 222,898 7,748 11,961 541,177 2,525,189
Additions - 121,333 - - 13,408 459 59,047 194,247
Amortisation (4,655) (13,639) - (27,862) (20,193) (2,817) (105,482) (174,648)
Net Book Value at 31 March 2019 388 204,777 1,639,279 195,036 963 9,603 494,742 2,544,788
NOTES TO THE CONSOLIDATED FINANCIAL STATEMENTS FOR THE YEAR ENDED 31 MARCH 2019
As disclosed in Note 29 The Group purchased the “Winner Winner” brand in December 2017
14) INTANGIBLE ASSETS
14.1) Impairment testing
Impairment
The goodwill of the Takapuna and Henderson stores have been impairment tested. Based on the impairment testing results, no impairment loss on Goodwill is recorded in the 2019 financial year (2018: Nil). In assessing impairment, management estimates the recoverable amount of each asset or cash-generating unit based on expected future cash flows and uses an interest rate to discount to present values. Estimation uncertainty relates to assumptions about future operating results and the determination of a suitable discount rate.
For the purpose of annual impairment testing, goodwill is allocated to the following cash-generating units, which are the units expected to benefit from the synergies of the business combinations in which the Goodwill arises.
NOTES TO THE CONSOLIDATED FINANCIAL STATEMENTS FOR THE YEAR ENDED 31 MARCH 2019
2018 Key Money
Brand Assets Goodwill
Reacquired Rights
Domain Name Patent
Trade Marks Total
$ $ $ $ $ $ $ $
Cost
Balance 1 April 2017 90,000 - 1,890,039 - 53,973 36,127 838,510 2,908,649
Adjustment - - (250,760) 250,760 - - - -
Acquisitions - 100,000 - - 8,332 - 110,758 219,090
Balance at 31 March 2018 90,000 100,000 1,639,279 250,760 62,305 36,127 949,268 3,127,739
90,000 100,000 1,639,279 250,760 62,305 36,127 949,268 3,127,739
Amortisation
Balance 1 April 2017 80,302 - - - 44,960 23,115 336,297 484,674
Current year amortisation 4,655 2,917 - 27,862 9,597 1,051 71,794 117,876
Balance 31 March 2018 84,957 2,917 - 27,862 54,557 24,166 408,091 602,550
Net Book Value
Balance 1 April 2017 9,698 - 1,890,039 - 9,013 13,012 502,213 2,423,975
Adjustment - - (250,760) 250,760 - - - -
Additions - 100,000 - - 8,332 - 110,758 219,090
Amortisation (4,655) (2,917) - (27,862) (9,597) (1,051) (71,794) (117,876)
Net Book Value at 31 March 2018 5,043 97,083 1,639,279 222,898 7,748 11,961 541,177 2,525,189
14) INTANGIBLE ASSETS (CONTINUED)

PAGE 48 PAGE 49
BURGER FUEL WORLDWIDE LIMITED ANNUAL REPORT 2019
NOTES TO THE CONSOLIDATED FINANCIAL STATEMENTS FOR THE YEAR ENDED 31 MARCH 2019
2019 2018
$ $
New Zealand Retail – Henderson Store 701,427 701,427
New Zealand Retail – Takapuna Store 937,852 937,852
Goodwill allocation at 31 March 1,639,279 1,639,279
Growth Rates Discount Rates
2019 2018 2019 2018
New Zealand Retail – Henderson Store 2.0% 2.0% 11% 9.8%
New Zealand Retail – Takapuna Store 2.0% 2.0% 11% 9.8%
The reacquired rights will be amortised over the life of the franchise agreement at the time of purchase being 9.5 years.
14.2) Growth rates
The growth rates reflect the long-term average growth rates for the product line and industry of the segments (all
publicly available).
14.3) Discount rates
The discount rates reflect appropriate adjustments relating to market risk and specific risk factors of each unit.
14.4) Cash flow assumptions
Management’s key assumptions include stable profit margins, based on past experience in this market. The Group’s management believes that this is the best available input for forecasting this mature market. Cash flow projections reflect stable profit margins achieved immediately before the budget period. No expected efficiency improvements have been taken into account and prices and wages reflect publicly available forecasts of inflation for the industry.
The Group have used different discount and growth rates to determine the value-in-use of the cash-generating units and have concluded that there has been no indication of impairment loss in Goodwill value. An increase of 2% in discount with no increase in growth rate from the 2019 year would still not have generated impairment loss.
Apart from the considerations described in determining the value-in-use of the cash-generating units described above, management is not currently aware of any other probable changes that would necessitate changes in its key estimates.
The present value of the expected cash flows of each segment is determined by applying a suitable discount rate.
14) INTANGIBLE ASSETS (CONTINUED)
The recoverable amounts of the cash-generating units were determined based on value-in-use calculations, covering a detailed forecast period, followed by an extrapolation of expected cash flows for the units’ remaining useful lives using the growth rates determined by management.
NOTES TO THE CONSOLIDATED FINANCIAL STATEMENTS FOR THE YEAR ENDED 31 MARCH 2019
2019 2018
$ $
Trade payables 1,190,185 1,317,169
Payroll liabilities 6,304 86,127
GST payable 197,134 183,266
Accrued expenses 104,826 70,318
1,489,449 1,656,880
Payables denominated in currencies other than the presentation currency comprise 0.5% of the trade payables (2018: 2.3%).
Current Contract Liability 263,215 -
Non-Current Contract Liability 1,751,831 -
2,015,046 -
Contract Liability Franchise Fees MLA Total
Opening adjustment for adoption of IFRS 15 1,138,736 863,159 2,001,895
Current year revenue recognised – IFRS 15 Adjustment (183,484) (60,663) (244,147)
Franchise fees booked to Balance Sheet in FY19 269,000 - 269,000
Revenue recognised – Franchise fees (11,702) - (11,702)
Balance 31 March 2019 1,212,550 802,496 2,015,046
2019 2018
$ $
Store Closure Provision
Opening balance 36,850 35,650
Provisions made during the year 1,200 1,200
Provisions used during the year - -
38,050 36,850
15) TRADE AND OTHER PAYABLES AND CONTRACT LIABILITIES
The contract liability amount as at the 31 March 2018 is the balance of the existing franchise and MLA fees spread over the life of the agreement which is typically 10 & 20 years in length, respectively. The remaining balance was recognised in opening retained earnings.
Any new franchise or MLA fees after 1 April 2018 are booked onto the balance sheet and are unwound to revenue over the life of the agreement.
16) PROVISIONS

PAGE 50 PAGE 51
BURGER FUEL WORLDWIDE LIMITED ANNUAL REPORT 2019
NOTES TO THE CONSOLIDATED FINANCIAL STATEMENTS FOR THE YEAR ENDED 31 MARCH 2019
Holiday Pay Provision 2019 2018
Opening balance 298,405 337,023
Provisions made during the year 178,349 (13,424)
Provisions used during the year (62,123) (25,194)
414,631 298,405
Total Provisions 452,681 335,255
Current 414,631 298,405
Non-current 38,050 36,850
Total Provisions 452,681 335,255
Store Closure Provision
This is the make good provision that is set aside to cover the costs of returning premises that are occupied by
BurgerFuel back to their original condition, after taking into account the normal wear and tear of these premises.
Holiday Pay Provision
This is the allocation of the 8% annual leave entitlement that each full-time and part-time employee is entitled to as part of their employment, which is accrued throughout the year
17) CASH AND CASH EQUIVALENTS
2019 2018
$ $
Cash at bank 3,344,795 3,695,192
Cash on deposit 2,158,678 2,605,686
5,503,473 6,300,878
At balance date there is $20,000 (2018: $20,000) in restricted cash for bonds issued to the NZX. Refer note 22 for further information.
18) CONTRIBUTED EQUITY
Number of Shares Share Capital
2019 2018 2019 2018
$ $
Opening ordinary shares on issue 59,633,550 59,633,550 16,034,443 16,034,443
Share buyback and cancellation (5,250,408) - (1,946,945) -
Authorised & issued ordinary shares on issue at 31 March 54,383,142 59,633,550 14,087,498 16,034,443
Less: IPO Capital Costs (223,432) (223,432)
Contributed Equity 13,864,066 15,811,011
16) PROVISIONS (CONTINUED)
NOTES TO THE CONSOLIDATED FINANCIAL STATEMENTS FOR THE YEAR ENDED 31 MARCH 2019
Burger Fuel Worldwide Limited was listed on the New Zealand Alternative Stock Exchange (NZAX) on the 27 July 2007. The Company has 54,383,142 authorised and fully paid ordinary shares on issue. All shares have equal voting rights and share equally in dividends and any surplus on winding up. The shares have no par value.
No Dividends were paid in the 2019 financial year (2018: NIL).
5,250,408 BFW Shares were purchased (and cancelled) from Franchise Brands LLC during the 2019 financial year. This occurred in four separate tranches with the fifth and final tranche of 712,947 to be settled on 28 April 2019. No shares were issued or cancelled during the 2018 financial year.
19) RETAINED EARNINGS
2019 2018
$ $
Retained Earnings / (Accumulated Losses)
Closing Balance 31 March 2018 (2,336,651) (1,873,589)
Effect of changes in accounting policies resulting from the
adoption of IFRS 15 & IFRS 9 (Note 4) (1,441,188) -
Opening Balance 1 April 2018 (3,777,839) (1,873,589)
Net surplus / (Deficit) for the year 1,236,341 (463,062)
Closing Balance (2,541,498) (2,336,651)
20) OTHER RESERVES
2019 2018
$ $
Foreign Currency Translation Reserve
Opening Balance (271,115) (305,222)
Movements (52,968) 34,107
Closing Balance (324,083) (271,115)
Nature and Purpose of Reserves:
Foreign Currency Translation Reserve
Translation differences arising on the translation of the results of subsidiaries with functional currencies other than New Zealand dollars are recognised directly in the Foreign Currency Translation Reserve. The cumulative amounts are
released to profit or loss upon disposal of these subsidiaries.
18) CONTRIBUTED EQUITY (CONTINUED)

PAGE 52 PAGE 53
BURGER FUEL WORLDWIDE LIMITED ANNUAL REPORT 2019
2019 2018
$ $
Financial Assets
Cash 5,503,473 6,300,878
Loans (Current) 170,900 133,000
Trade Receivables 2,887,218 2,887,456
Sundry Receivables 29,019 72,375
8,590,610 9,393,709
Other Financial Liabilities
Trade Payables 1,498,449 1,656,880
21) FINANCIAL INSTRUMENTS AND RISK MANAGEMENT
Categories of Financial Instruments
NOTES TO THE CONSOLIDATED FINANCIAL STATEMENTS FOR THE YEAR ENDED 31 MARCH 2019
Financial risk management objectives
Management provides services to the business, co-ordinates access to domestic and international financial markets, monitors and manages the financial risks relating to the operations of the Group through internal risk reports which analyse exposures by degree and magnitude of risks. These risks include market risk (including currency risk), credit risk, liquidity risk and cash flow interest rate risk
The Management reports quarterly to the Group’s audit committee, who monitors risk and policies implemented to mitigate risk exposures.
Market risk
The Group’s activities expose it primarily to the financial risks of changes in foreign currency exchange rates and interest rates. Market risk exposures are analysed by sensitivity analysis. There has not been significant change to
BurgerFuel’s exposure to market risks or the manner in which it manages and measures the risk.
Foreign currency risk management
The Group’s foreign exchange risk is limited to its US Dollar, Australian Dollar & UAE Dirham bank accounts and the trading of its Australian, US & United Arab Emirates subsidiaries. It maintains amounts in these foreign bank accounts and transfers funds when foreign exchange rates are favourable.
Foreign currency sensitivity analysis
The Group is mainly exposed to Australian Dollars, US Dollars and UAE Dirhams. The following table details the Group’s sensitivity to a 10% increase and decrease in the NZ$ against the Australian, UAE & USA currency. 10% is the sensitivity rate used when reporting foreign currency risk internally to key management personnel and represents management’s assessment of the reasonably possible change in foreign exchange rates. The sensitivity analysis includes only outstanding foreign currency denominated monetary items and adjusts their translation at year end for a 10% change in foreign currency rates.
The sensitivity analysis includes external loans as well as loans to foreign operations within the Group. A positive number below indicates an increase in profit.
NOTES TO THE CONSOLIDATED FINANCIAL STATEMENTS FOR THE YEAR ENDED 31 MARCH 2019
GROUP
10% Strengthening 10% Weakening
2019 2018 2019 2018
$000 $000 $000 $000
Profit / (Loss) before tax 90 72 (99) (79)
Equity 65 52 (71) (51)
Interest rate sensitivity analysis
The sensitivity analysis below has been determined based on the exposure to interest rates at the balance date. For floating rate liabilities, the analysis is prepared assuming the amount of liability outstanding at the balance date was outstanding for the whole year. A 100 basis point increase or decrease is used when reporting interest rate risk internally to key management personnel and represents management’s assessment of the reasonably possible change in interest rates.
The Group has a USD overdraft facility and has exposure to floating interest rates on this facility. This USD overdraft facility has an effect on the interest paid on the Group’s cash and cash equivalent accounts.
If the interest rates had been 100 basis points higher and all other variables were held constant, the Group’s operating
result for the year ended 31 March 2019 would have been $55,035 higher (2018: $63,008 higher).
Interest rate risk
The Group has cash flow interest rate risk from financial instruments that attract interest. Interest rate risk is the risk that the value of the Group’s assets and liabilities will fluctuate due to changes in market interest rates. The Group is exposed to interest rate risk primarily through its cash balances and advances.
The Group manages its interest rate risk by maintaining minimal variable rate cash balances. Excess cash resources are placed into fixed rate term deposits where appropriate.
Interest rate risk profile
2019 Weighted average effective
interest rate %
Greater than 1 year
Less than 1 year
Non - interest bearing Total
$ $ $ $
Financial Assets
Cash and cash equivalent 1.46% - 5,503,473 - 5,503,473
Advance to Supplier 3.00% - 157,606 - 157,606
Advances to Staff 5.00% - 3,540 9,754 13,294
Trade and other receivables 3.75% - 1,107,308 1,808,929 2,916,237
- 6,771,927 1,818,683 8,590,610
Financial Liabilities 870,000
Trade payables - - - 1,498,449 1,498,449
- - 1,498,449 1,498,449
21) FINANCIAL INSTRUMENTS AND RISK MANAGEMENT (CONTINUED)

PAGE 54 PAGE 55
BURGER FUEL WORLDWIDE LIMITED ANNUAL REPORT 2019
Credit risk
Credit risk is the risk that the counter party to a transaction with the Group will fail to discharge its obligations, causing the Group to incur a financial loss. The Group has adopted a policy of only dealing with creditworthy counterparties, as a means of mitigating the risk of financial loss from defaults. The credit ratings of its counterparties are continuously monitored by management and the aggregate value of transactions concluded is spread amongst approved counterparties.
Financial instruments that potentially subject the Group to concentrations of credit risk consist principally of cash, trade debtors, loans and advances.
The carrying amount of financial assets recorded in the financial statements, which is net of impairment losses, represents the Group’s maximum exposure to credit risk without taking account of the value of any collateral obtained. The maximum credit risk exposures are:
NOTES TO THE CONSOLIDATED FINANCIAL STATEMENTS FOR THE YEAR ENDED 31 MARCH 2019
2018 Weighted average effective
interest rate %
Greater than 1 year
Less than 1 year
Non - interest bearing Total
$ $ $ $
Financial Assets
Cash and cash equivalent 1.25% - 6,300,878 - 6,300,878
Advance to Supplier 3.00% - 133,000 - 133,000
Trade and other receivables 3.75% 870,000 - 2,089,831 2,959,831
870,000 6,433,878 2,089,831 9,393,709
Financial Liabilities 870,000
Trade payables - - - 1,656,880 1,656,880
- - 1,656,880 1,656,880
2019 2018
$ $
Cash and bank balances 5,503,473 6,300,878
Loans, advances and receivables 3,087,137 3,092,830
Maximum exposures are net of any recognised provisions, and at balance date no loans or advances are past due or considered to be impaired (2018: $Nil). Trade receivables of $218,291 are impaired with no further amounts past due
(2018: $250,000 past due).
Cash
The Group’s major concentration of credit risk relates to cash deposits with ASB Limited in New Zealand, CBA Bank
Limited in Australia & Bank of America Merrill Lynch.
Receivables
The Group has a credit policy, which is used to manage its exposure to credit risk. As part of this policy, limits on exposures have been set, lending is subject to defined criteria and loans are monitored on a regular basis. The trade receivable are payable on the 10th of the following month and loans are subject a loan agreement which stipulates
monthly repayments or payable on demand. No security is held.
21) FINANCIAL INSTRUMENTS AND RISK MANAGEMENT (CONTINUED)
NOTES TO THE CONSOLIDATED FINANCIAL STATEMENTS FOR THE YEAR ENDED 31 MARCH 2019
Capital management
The Group’s capital includes share capital, reserves and retained earnings as shown in the Statements of Financial Position. The Group’s objectives when managing capital are to safeguard the Group’s ability to continue as a going concern in order to provide returns for shareholders, and to maintain an optimal capital structure to reduce the cost of capital. In order to maintain or adjust the required capital structure the Group may issue new shares, sell assets to reduce debt and/or adjust amounts paid to investors.
The Group is not subject to any externally imposed capital requirements.
Liquidity risk
Liquidity risk is the risk that the Group will encounter difficulty in raising funds at short notice to meet commitments associated with financial instruments. The Group maintains sufficient funds to meet the commitments based on historical and forecasted cash flow requirements. The exposure is being reviewed on an ongoing basis from daily procedures to monthly reporting.
Ultimate responsibility for liquidity risk management rests with the board of directors, which has built an appropriate liquidity risk management framework for the management of short, medium and long-term funding and liquidity management requirements. Liquidity risk is managed by maintaining adequate reserves and banking facilities, by continuously monitoring forecast and actual cash flows and matching the maturity profiles of financial assets and liabilities. All payables are due within 6 months of balance date (2018: 6 months).
The Group expects to meet its obligations from operating cash flows and proceeds of maturing financial assets.
22) COMMITMENTS
Lease Commitments
Operating leases relate to the store leases. Non-cancellable operating lease rentals are payable as follows:
2019 2018
Total future minimum payments
Total future minimum payments
$ $
Less than one year 3,322,224 2,959,767
Between one and five years 3,915,507 2,692,496
More than five years 565,402 179,596
7,803,133 5,831,859
Payments made under operating leases are recognised in the Statement of Comprehensive Income on a straight-line basis over the term of the lease. The Group holds the head lease over all of its franchisee sites and in turn licenses each of these sites to its franchisees under the same terms and conditions. At balance date, the current annual rent expense of leases under this arrangement including occupied leases, was $3,654,182 (2018: $3,544,384).
Capital Commitments
At 31 March 2019, the Group has no contractual commitments (2018: Nil).
21) FINANCIAL INSTRUMENTS AND RISK MANAGEMENT (CONTINUED)

PAGE 56 PAGE 57
BURGER FUEL WORLDWIDE LIMITED ANNUAL REPORT 2019
2019 2018
Total future minimum payments
Total future minimum payments
$ $
NZX Bond 20,000 20,000
20,000 20,000
23) CONTINGENCIES
The Group has no contingencies at balance date (2018: Nil).
Indemnity / Guarantees
BurgerFuel has deposits in place to cover certain commitments the banks have provided:
NOTES TO THE CONSOLIDATED FINANCIAL STATEMENTS FOR THE YEAR ENDED 31 MARCH 2019
24) RELATED PARTY TRANSACTIONS
Transactions with Related Parties
During the year the following related party transactions took place:
Group Relationship
Nature
of transaction
2019
$
2018
$
Neo Corporate
Trustees Limited &
Redmond Enterprises
Limited
Common
Directorship
Consultancy Expenses
Paid 635,250 605,000
Trumpeter Consulting
Limited
Common
Directorship Directors Fees 50,000 50,000
Peter Brook Director Directors Fees 70,000 70,000
66 Surrey Limited Director Head Office Rental 465,101 438,002
Trumpeter Consulting
Limited
Common
Directorship
Consultancy Expenses
Paid 16,000 44,000
Christopher Mason Major ShareholderPurchased USA Licence agreement - 261,000
Christopher Mason Major Shareholder Purchased USA Store - 609,000
The Burger Fuel Worldwide Limited Chief Executive Officer is the sole director of Neo Corporate Trustees Limited, Redmond Enterprises Limited & 66 Surrey Limited. The head office rental is the premises at 66 Surrey Crescent, Grey Lynn, Auckland and the Redmond Enterprises & Neo Corporate Trustees Limited consultancy fee relates to the remuneration of the CEO.
The Burger Fuel USA licence agreement was sold to the Founding Director Christopher Mason for NZD$261,000. This transaction occurred on the 5th March 2018. At the same time Christopher Mason also purchased the equity of the Group’s US subsidiary company BF Indiana Two LLC for NZD$609,000. This company owned the BurgerFuel store in Indianapolis, USA. Christopher Mason also purchased the Burger Fuel USA Franchising Inc company which was non-trading and had no assets as at transaction date. As at 31 March 2019 the $261,000 licence fee & $609,000 sale proceeds were still outstanding (2018: $261,000 licence fee and $609,000 sale proceeds outstanding). These amounts are payable within 24 months of the transaction date and are secured over Chris Mason’s BFW shares. Interest of 3.75% is payable on the outstanding balance.
22) COMMITMENTS (CONTINUED)
NOTES TO THE CONSOLIDATED FINANCIAL STATEMENTS FOR THE YEAR ENDED 31 MARCH 2019
2019 2018
$ $
Salaries and other short-term employee benefits 2,680,416 2,694,584
KiwiSaver Employer Contribution 49,406 46,827
Directors’ Fees 120,000 120,000
2,849,822 2,861,411
Key Management Compensation
Key management personnel compensation costs include remuneration of the Group Chief Executive, Founding Director, Directors and the members of the executive team. The compensation paid or payable to key management for employee services is shown above.
25) EARNINGS PER SHARE
The basic earnings per share are calculated by dividing the profit attributed to owners of the Group by the weighted average number of ordinary shares in issue during the year.
2019 2018
$ $
Surplus / (Deficit) attributable to the owners of the Group 1,236,341 (463,062)
Weighted average number of ordinary shares on issue 56,697,165 59,633,550
Basic earnings / (loss) per share (cents) 2.18 (0.78)
Diluted earnings / (loss) per share (cents) 2.18 (0.78)
Diluted earnings per share is calculated by adjusting the weighted average number of ordinary shares outstanding to assume conversion of all dilutive potential ordinary shares. There is no difference between the basic and diluted number of shares on issue.
24) RELATED PARTY TRANSACTIONS (CONTINUED)

PAGE 58 PAGE 59
BURGER FUEL WORLDWIDE LIMITED ANNUAL REPORT 2019
26) RECONCILIATION OF NET SURPLUS / (DEFICIT) AFTER TAXATION TO NET CASH FLOWS PROVIDED FROM OPERATING ACTIVITIES
2019 2018
$ $
Net surplus / (deficit) after tax 1,236,341 (463,062)
Add: Non-cash items
Amortisation 174,648 117,876
Depreciation 577,343 535,327
Deferred tax asset 32,928 93,215
Deferred tax asset – IFRS 15 adjustment to retained earnings (560,707) -
Loss on disposal of property, plant and equipment 73,477 190,547
Loss on Disposal of US Entity - 880,846
Unrealised exchange loss / (gain) (40,791) 42,290
IFRS 15 Adjustment to retained earnings (1,441,188) -
Provision for Doubtful Debts 31,709 129,417
(1,152,581) 1,989,518
NOTES TO THE CONSOLIDATED FINANCIAL STATEMENTS FOR THE YEAR ENDED 31 MARCH 2019
Add: Items classified as investing or financing activities
Gain on sale of assets (7,576) -
Add: Working capital movements
(Increase) / decrease in trade and other receivables 41,282 (655,384)
(Increase) / decrease in inventories 457,230 95,261
(Decrease) / increase in taxation payable (296,637) 236,873
Increase / (decrease) in accounts payable and accruals,
provisions and contract liability 1,910,622 (372,262)
2,112,497 (695,512)
Net cash flows provided from operating activities 2,188,681 830,944
27) SEGMENT REPORTING
Operating Segments
The Group operates in four operating segments; these operating segments have been divided into the following geographical regions, New Zealand, Australia, USA and the Middle East. All the segment’s operations are made up of franchising fees, royalties and sales to franchisees. The segments are in the business of Franchise Systems - Gourmet Burger Restaurants. New Zealand’s segment result is also due to the amortisation of intangible assets.
The amounts provided to the Board with respect to total liabilities are measured in a manner consistent with that of the financial statements. These liabilities are allocated based on the operations of the segment.
NOTES TO THE CONSOLIDATED FINANCIAL STATEMENTS FOR THE YEAR ENDED 31 MARCH 2019
Acquisition of Property, Plant & Equipment & Intangible Assets.
2019 New Zealand Australia Middle East USA Consolidated
$ $ $ $ $
Revenue
Sales 8,592,548 - 95,282 - 8,687,830
Royalties 4,872,084 - 1,064,777 1,339 5,938,200
Franchising fees 300,186 - 48,217 13,077 361,480
Training fees 30,000 - - - 30,000
Property management fees 55,000 - - - 55,000
Advertising fees 3,640,806 - 213,880 - 3,854,686
Foreign exchange gain (52,884) (24,053) 29 117,699 40,791
Sundry income 1,341,460 80,169 - 510,299 1,931,928
Interest received 86,185 1,067 - 40,499 127,751
Total Revenue 18,865,385 57,183 1,422,185 682,913 21,027,666
Interest Expense 10,087 838 - - 10,925
Depreciation 572,522 - 4,821 - 577,343
Amortisation 174,648 - - - 174,648
Segment Result before Income Tax 1,042,405 51,669 663,002 98,703 1,855,779
Income Tax Expense 617,956 - - 1,482 619,438
Segment Assets 13,749,506 372,1111 120,059 874,998 15,116,674
Segment Liabilities 4,017,543 - 62,370 38,276 4,118,189
Other 1,063,470 - - - 1,063,470
27) SEGMENT REPORTING (CONTINUED)

PAGE 60 PAGE 61
BURGER FUEL WORLDWIDE LIMITED ANNUAL REPORT 2019
28) SUBSEQUENT EVENTS
Since balance date BFW has bought back & cancelled 712,947 BFW shares from Franchise Brands. This has reduced the total number of BFW shares to 53,670,195. This had no impact on the Consolidated Statement of Comprehensive Income but will reduce the Group’s cash and cash equivalents and equity by NZD$269,240. (2018 Subsequent events: 3,143,355 shares bought back from Franchise Brands on 17 July 2018 which occurred in the current year).
29) ACQUISITION OF BRAND ASSETS
Acquisition of “Winner Winner” Brand Asset
On 18th December 2017, the Group acquired the Intellectual Property rights to Winner Winner, with the view to becoming the concept Franchisor. Winner Winner currently has one store in Hamilton. This outlet has not been purchased by BFW. It will continue to be operated by the founders of Winner Winner, but will now become the first franchised store under BFW.
The Brand Asset purchase was for $100,000 and this will be amortised on a straight line basis over 10 years. In 2019 BFW purchased an additional $121,333 of Intellectual property for the Winner Winner Brand.
2018 New Zealand Australia Middle East USA Consolidated
$ $ $ $ $
Revenue
Sales 10,734,127 132,722 144,806 1,604,881 12,616,536
Royalties 4,674,358 140,126 1,193,234 - 6,007,718
Franchising fees 495,000 - - - 495,000
Training fees 15,000 - - - 15,000
Property management fees 55,000 - - - 55,000
Advertising fees 3,527,531 105,434 239,631 - 3,872,596
Foreign exchange gain 57,671 (37,082) 20 (62,899) (42,290)
Sundry income 1,473,212 14,106 129,678 52,598 1,669,594
Interest received 84,037 1,015 - - 85,052
Total Revenue 21,115,936 356,321 1,707,369 1,594,580 24,774,206
Interest Expense 3,514 36 - - 3,550
Depreciation 528,194 - 7,133 - 535,327
Amortisation 117,876 - - - 117,876
Segment Result before Income tax 2,303,494 (162,871) 912,287 (3,088,376) (35,466)
Income Tax Expense 444,452 - - (16,856) 427,596
Segment Assets 14,100,561 504,861 102,706 935,902 15,644,030
Segment Liabilities 2,551,850 (216,682) 23,456 82,161 2,440,785
27) SEGMENT REPORTING (CONTINUED)
NOTES TO THE CONSOLIDATED FINANCIAL STATEMENTS FOR THE YEAR ENDED 31 MARCH 2019
Acquisition of Property, Plant & Equipment & Intangible Assets.
Other 784,111 - 770 1,332,938 2,117,819
30) NET TANGIBLE ASSET PER SHARE
The net tangible asset per share is calculated by dividing the net tangible assets of the Group by the total number of ordinary shares in issue during the year.
31) DISPOSAL OF SUBSIDIARIES
On 5th March 2018 the Group disposed of BF Indiana Two LLC, the subsidiary that owned and operated the Company owned store in Indiana USA.
The subsidiary was disposed of for a consideration of $609,000. The consideration relating to the sale was deferred for a period of 24 months from the date of the transaction.
As a result of the sale control was lost over the following assets:
2019 2018
$ $
Total Assets 15,116,674 15,644,030
Less Intangible Assets (3,260,747) (2,713,369)
Total Tangible Assets 11,855,927 12,930,661
Total Liabilities (4,118,189) (2,440,785)
Net Tangible Assets 7,737,738 10,489,876
Total ordinary shares on issue 54,383,142 59,633,550
Net Tangible Assets per share
($ per Share) 0.14 0.18
Current Assets
Cash and Cash Equivalents 1,384
Inventory – Raw Materials 40,533
Inventory - Uniforms 17,395
59,312
Non-Current Assets
Property, Plant and Equipment 752,885
Leasehold Improvements 560,262
1,313,147
Write back of Rent Free Period (131,713)
Capital Written off 249,100
Net Assets Disposed of 1,489,846
As a result of the sale the Group has recorded a loss on disposal. The loss is calculated as follows:
Consideration Received 609,000
Net Assets disposed of 1,489,846
Loss on Disposal (880,846)
NOTES TO THE CONSOLIDATED FINANCIAL STATEMENTS FOR THE YEAR ENDED 31 MARCH 2019

PAGE 62 PAGE 63
BURGER FUEL WORLDWIDE LIMITED ANNUAL REPORT 2019
Statement of Directors and Officers Interests
Directors and Officers held the following equity securities in the Company:
Beneficially held at 31/03/19
Non-beneficially held at 31/03/19
Beneficially held at 31/03/18
Non-beneficially held at 31/03/18
Peter Brook 336,596 - 336,596 -
Christopher Mason 6,586,309 - 6,586,309 -
Josef Roberts 33,376,335 - 33,223,473 -
Alan Dunn 324,656 - 324,656 -
Tyrone Foley (Officer) 14,874 - 14,874 -
Mark Piet (Officer) 21,667 - 21,667 -
John Pfannenbecker resigned as a director on the 2nd November 2017 Christopher Mason resigned as a director on the 5th March 2018
Remuneration of Directors2019
12 Months2018
12 Months
$ $
Peter Brook 70,000 70,000
Christopher Mason (resigned as a director on the 5th March 2018) - 402,292
Josef Roberts 635,250 605,000
Alan Dunn 50,000 50,000
Remuneration of Employees (Excluding Executive Directors) 2019 12 Months
Number of Employees
2018 12 Months
Number of Employees
$100,000-$110,000 5 1
$110,000-$120,000 3 1
$120,000-$130,000 - 2
$130,000-$140,000 1 -
$140,000-$150,000 3 2
$150,000-$160,000 - 1
$170,000-$180,000 1 2
$200,000-$210,000 1 1
$220,000-$230,000 - 1
$230,000-$240,000 1 -
$240,000-$250,000 1 -
$250,000-$260,000 1 -
Date of Transaction
Shares Acquired
(Disposed)Consideration Paid
(received)Nature of
relevant interest
Peter Brook - - - Shares Held in Associated Trust
Christopher Mason - - - Shares Held in Associated Trust
Josef Roberts - 152,862 - Shares Held in an Independent Trust
Alan Dunn - - - Shares Held in Associated Trust
Tyrone Foley (Officer) - - - Beneficial Owner
Mark Piet (Officer) - - - Beneficial Owner
Substantial Security Holders
The following information is given pursuant to section 293 of the Financial Markets Conduct Act 2013. As at 31 March 2019, details of the Substantial Security Holders in the company and their relevant interests in the company’s shares are as follows:
Substantial Security Holder Number of Voting Securities %
Mason Roberts Holdings Limited 39,962,644 73.48%
E&P Foundation Trustee Limited 2,747,138 5.05%
The total number of voting securities of the Company on issue at 31 March 2019 was 54,383,142 fully paid ordinary shares.
The following share transactions took place during the financial year
SHAREHOLDER INFORMATIONFOR THE YEAR ENDED 31 MARCH 2019
SHAREHOLDER INFORMATIONFOR THE YEAR ENDED 31 MARCH 2019

PAGE 64 PAGE 65
BURGER FUEL WORLDWIDE LIMITED ANNUAL REPORT 2019
Twenty Largest Security Holders as at 31 March 2019
Shareholder Number of Shares %
MASON ROBERTS HOLDINGS LIMITED 39,962,644 73.5%
E & P FOUNDATION TRUSTEE LIMITED 2,747,138 5.1%
NATIONAL NOMINEES NEW ZEALAND LIMITED 1,969,393 3.6%
FRANCHISE BRANDS LLC 712,947 1.3%
CUSTODIAL SERVICES LIMITED 692,370 1.3%
CARTALLEN TRUSTEE LIMITED 478,623 0.9%
JBWERE (NZ) NOMINEES LIMITED 369,296 0.7%
PETER CLYNTON BROOK 336,596 0.6%
TRUMPETER TRUSTEES (2007) LIMITED 324,656 0.6%
ASB NOMINEES LIMITED 160,000 0.3%
STERLING NOMINEES LIMITED 140,886 0.3%
BRIAN KELLY LIMITED 133,400 0.3%
CITIBANK NOMINEES (NEW ZEALAND) LIMITED 133,267 0.3%
LAPHROAIG TRUSTEE COMPANY (NZ) LIMITED 123,576 0.2%
MATTHEW JAMES PRINGLE 75,000 0.1%
BRAD WILLIAM MCFARLANE 70,470 0.1%
INVESTMENT CUSTODIAL SERVICES LIMITED 65,500 0.1%
FORSYTH BARR CUSTODIANS LIMITED 60,100 0.1%
JONATHAN LAURIE BUCKLEY 57,9 15 0.1%
ROSEMARY ELIZABETH DOWLER 50,000 0.1%
48,663,777 89.6%
Domicile of Security Holdings
Location Holders Units Units %
NZ 2,366 53,315,100 98.04%
U.S.A. 15 756,280 1.39%
Australia 89 172,577 0.32%
United Kingdom 17 65,340 0.12%
United Arab Emirates 4 49,017 0.09%
Canada 4 5,058 0.01%
Singapore 1 3,500 0.01%
France 2 3,000 0.01%
Austria 1 2,000 0.01%
China 1 2,000 0.00%
Japan 2 1,870 0.00%
Ireland 1 1,600 0.00%
Germany 1 1,500 0.00%
Hong Kong 1 1,000 0.00%
Norway 1 1,000 0.00%
Taiwan 1 1,000 0.00%
South Africa 1 1,000 0.00%
Switzerland 1 300 0.00%
2,509 54,383,142 100.0%
SHAREHOLDER INFORMATIONFOR THE YEAR ENDED 31 MARCH 2019
SHAREHOLDER INFORMATIONFOR THE YEAR ENDED 31 MARCH 2019

PAGE 66 PAGE 67
BURGER FUEL WORLDWIDE LIMITED ANNUAL REPORT 2019
Spread of Security Holders
Shareholding Size Number of Holders Total Shares Held %
1 – 99 7 232 0.0%
100 – 199 34 4,359 0.0%
200 – 499 165 57,399 0.1%
500 – 999 170 111,764 0.2%
1,000 – 1,999 1,356 1,513,056 2.8%
2,000 – 4,999 503 1,272,811 2.3%
5,000 – 9,999 135 769,866 1.4%
10,000 – 49,999 119 1,989,878 3.7%
50,000 – 99,999 6 378,985 0.7%
100,000 – 499,999 9 2,200,300 3.8%
500,000 – 999,999 2 1,405,317 2.6%
1,000,000 – 99,999,999 3 44,679,175 82.4%
2,509 54,383,142 100.0%
SHAREHOLDER INFORMATIONFOR THE YEAR ENDED 31 MARCH 2019
CORPORATE GOVERNANCE FOR THE YEAR ENDED 31 MARCH 2019
The Board of Directors is responsible for the corporate governance of the Group. “Corporate Governance” involves the direction and control of the business by the Directors and the accountability of Directors to shareholders and other stakeholders for the performance of the Group and compliance with
applicable laws and standards.
Role of the Board
The Board is elected by the Shareholders of the Company. At each Annual Meeting one third of the directors will retire by rotation. The Directors to retire are those who wish to retire, or those who have been longest in office since last being elected.
The Board of Directors is responsible for the overall direction of Burger Fuel Worldwide Limited’s business and affairs on behalf of all shareholders. The Board’s key role is to ensure that corporate management is continuously and effectively striving for above-average performance, taking account of risk.
The Board:
• Establishes the objectives of Burger Fuel Worldwide Limited;
• Approves major strategies for achieving these objectives;
• Oversees risk management and compliance;
• Sets in place the policy framework within which BurgerFuel operates; and
• Monitors management performance against this background.
The Board has delegated the day-to-day leadership and management of the Group to the Group Chief Executive Officer and the Chief Operating Officer.
The Board monitors financial results and compares them to annual plans and forecasts / budgets on a regular basis, and on a quarterly basis reviews the Group’s performance against its strategic planning objectives.
Board size and Composition
Unlike the NZX Listing Rules for NZSX listed companies, the NZAX Listing Rules do not require that the Company have any independent directors. However, in the interests of good governance, and notwithstanding that there is no requirement under the NZAX Listing Rules, the Directors have decided to adopt a governance policy whereby at least two of the Directors of the Board will be “independent” as defined in the NZX Listing Rules. The size and composition of the Board is determined by the
Company’s constitution. As at 31 March 2019, there were three Directors, a Chief Operating Officer, and a Chief Financial Officer / Company Secretary. The Chairman of the Board and the Chairman of the Audit Committee are non-executive and independent of the role of the Chief Executive Officer, Chief Financial Officer and Chief Operating Officer.
Audit Committee
Although not required by the NZAX Listing Rules, to assist the Board in the execution of its responsibilities, an Audit Committee is in operation.
(i) Risk Management
The Audit Committee is required to establish a framework of internal control mechanisms to ensure proper management of the Group’s affairs and that key business and financial risks are identified and controls and procedures are in place to effectively manage those risks. The Audit Committee is accountable to the Board for the recommendation of the external auditors, directing and monitoring the audit function and reviewing the adequacy and quality of the annual audit process.
(ii) Additional Assurance
The Committee provides the Board with additional assurance regarding the accuracy of financial information for inclusion in the Group’s annual report, including the financial statements. The Committee is also responsible for ensuring that Burger Fuel Worldwide Limited has an effective internal control framework. These controls include the safeguarding of assets, maintaining proper accounting records, complying with legislation, including resource management and health and safety issues, ensuring the reliability of financial information and assessing and overviewing business risk. The Committee also deals with governmental and New
Zealand Stock Exchange requirements.
(iii) Share Trading Policy
The Company has adopted a formal Securities Trading Policy (“Policy”) to address insider trading requirements.
The Policy is modelled on the Listed Companies Association Securities Trading Policy and Guidelines and is administered by the Audit Committee and restricts share trading in a number of ways.
(iv) Insurance and Indemnification
Burger Fuel Worldwide Limited provides indemnity insurance cover to directors, officers and employees of the Group except where there is conduct involving a wilful breach of duty, improper use of inside information
or criminality.

PAGE 68 PAGE 69
BURGER FUEL WORLDWIDE LIMITED ANNUAL REPORT 2019
CORPORATE GOVERNANCE FOR THE YEAR ENDED 31 MARCH 2019
Constitution
A full copy of the Company’s constitution is available on
the Company’s website (www.burgerfuel.com).
Board Remuneration
Directors are entitled to Directors’ fees, reasonable travelling, accommodation and other expenses incurred in the course of performing duties or exercising powers as Directors.
Peter Brook, the Chairman, receives an annual fee of $70,000 and Alan Dunn the independent, non-executive Director receives an annual fee of $50,000. The Company Secretary attends to all company secretarial and corporate governance matters.
Conflict of Interest
The Board has guidelines dealing with the disclosure of interests by Directors and the participation and voting at Board meetings where any such interests are discussed. The Group maintains an interests register in which particulars of certain transactions and matters involving Directors must be recorded.
Directors & Officers Board & Audit Committee Attendance Record
Directors Board Meetings Audit Committee Meetings
Peter Brook (Chair) 6 3
Josef Roberts 6 3
Alan Dunn 6 3
Officers
Tyrone Foley (Chief Operating Officer) 6 3
Mark Piet (Chief Financial Officer / Company Secretary) 6 3
Registered Office Grant Thornton New Zealand Limited 152 Fanshawe Street Auckland 1011
Company Number 1947191
Date of Incorporation 14 June 2007
Directors Peter Brook - Chairman (Independent) Alan Dunn (Independent) Josef Roberts (Executive)
Board Executives Tyrone Foley (Chief Operating Officer) Mark Piet (Chief Financial Officer / Company Secretary)
Business Headquarters 66 Surrey Crescent Grey Lynn Auckland 1021
Auditor Baker Tilly Staples Rodway Level 9, Tower Centre 45 Queen Street Auckland 1010
Accountant Grant Thornton New Zealand Limited Level 4, 152 Fanshawe Street Auckland 1011
Bridgepoint Group Accounting Pty Ltd Suite 301, 8 West Street, North Sydney NSW 2060 Australia
Citrin Cooperman 529 Fifth Avenue New York, NY 10017 USA
Bankers ASB Bank Limited CBA Bank Limited (Australia) Emirates NBD (UAE) Bank of America Merrill Lynch (USA)
Solicitors Kensington Swan, 18 Viaduct Harbour Avenue, Auckland 1011.
Wiggin and Dana LLP, Two Liberty Place, 50 S. 16th Street, Suite 2925, PA, 19102, USA.
FC Law Partners P.O Box 133238, Auckland 1146.
Missingham Law, P.O Box796, Shortland Street Mail Centre, Auckland 1140.
Corporate Council Limited Solicitors, P.O Box 37-322, Parnell, Auckland 1151.
Katz Korin Solicitors, 334 N. Senate AveIndianapolis, IN 46205, USA.
Buddle Findlay, 83 Victoria Street, Christchurch 8140.
COMPANY DIRECTORY AS AT 31 MARCH 2019

www.bugerfuel.com | www.shakeout.co | www.winnerwinner.co.nz