Embed Size (px)
Citation preview

Bursa Announcement
Fourth Quarter and Twelve Months Ended 31 March 2018
3 months ended 3 months ended 12 months ended 12 months ended
31 Mar 2018 31 Mar 2017 31 Mar 2018 31 Mar 2017
RM’000 RM’000 RM’000 RM’000
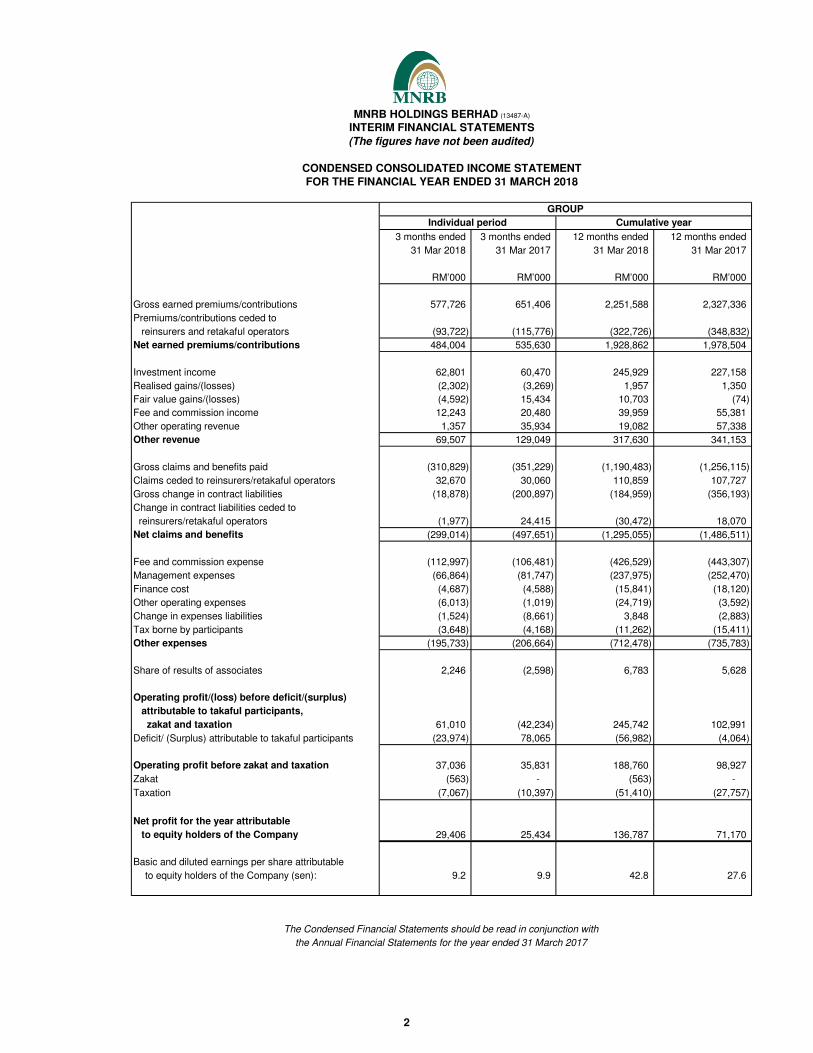
Gross earned premiums/contributions 577,726 651,406 2,251,588 2,327,336
Premiums/contributions ceded to
reinsurers and retakaful operators (93,722) (115,776) (322,726) (348,832)
Net earned premiums/contributions 484,004 535,630 1,928,862 1,978,504
Investment income 62,801 60,470 245,929 227,158
Realised gains/(losses) (2,302) (3,269) 1,957 1,350
Fair value gains/(losses) (4,592) 15,434 10,703 (74)
Fee and commission income 12,243 20,480 39,959 55,381
Other operating revenue 1,357 35,934 19,082 57,338
Other revenue 69,507 129,049 317,630 341,153
Gross claims and benefits paid (310,829) (351,229) (1,190,483) (1,256,115)
Claims ceded to reinsurers/retakaful operators 32,670 30,060 110,859 107,727
Gross change in contract liabilities (18,878) (200,897) (184,959) (356,193)
Change in contract liabilities ceded to
reinsurers/retakaful operators (1,977) 24,415 (30,472) 18,070
Net claims and benefits (299,014) (497,651) (1,295,055) (1,486,511)
Fee and commission expense (112,997) (106,481) (426,529) (443,307)
Management expenses (66,864) (81,747) (237,975) (252,470)
Finance cost (4,687) (4,588) (15,841) (18,120)
Other operating expenses (6,013) (1,019) (24,719) (3,592)
Change in expenses liabilities (1,524) (8,661) 3,848 (2,883)
Tax borne by participants (3,648) (4,168) (11,262) (15,411)
Other expenses (195,733) (206,664) (712,478) (735,783)
Share of results of associates 2,246 (2,598) 6,783 5,628
Operating profit/(loss) before deficit/(surplus)
attributable to takaful participants,
zakat and taxation 61,010 (42,234) 245,742 102,991
Deficit/ (Surplus) attributable to takaful participants (23,974) 78,065 (56,982) (4,064)
Operating profit before zakat and taxation 37,036 35,831 188,760 98,927
Zakat (563) - (563) -
Taxation (7,067) (10,397) (51,410) (27,757)
Net profit for the year attributable
to equity holders of the Company 29,406 25,434 136,787 71,170
Basic and diluted earnings per share attributable
to equity holders of the Company (sen): 9.2 9.9 42.8 27.6
MNRB HOLDINGS BERHAD (13487-A)
INTERIM FINANCIAL STATEMENTS
(The figures have not been audited)
CONDENSED CONSOLIDATED INCOME STATEMENT
GROUP
FOR THE FINANCIAL YEAR ENDED 31 MARCH 2018
Individual period Cumulative year
The Condensed Financial Statements should be read in conjunction with
the Annual Financial Statements for the year ended 31 March 2017
2

3 months ended 3 months ended 12 months ended 12 months ended
31 Mar 2018 31 Mar 2017 31 Mar 2018 31 Mar 2017
RM’000 RM’000 RM’000 RM’000
Net profit for the year 29,406 25,434 136,787 71,170
Other comprehensive income/(losses):
Other comprehensive income/(losses) to be reclassified
to income statement in subsequent years:
Effects of post acquisition foreign exchange
translation reserve on investment in associate (7,464) (937) (21,011) 15,220
Effects of foreign exchange translation reserve
on investment in subsidiary (548) (94) (1,472) 1,700
Net gain/(loss) on AFS financial assets:
Net gain/ (loss) on fair value changes (9,624) 20,425 (10,648) (3,871)
Realised gain transferred to income statement 4,574 5,457 3,092 946
Deferred tax relating to net loss
on AFS financial assets 80 80 820 316
Other comprehensive losses/(income) attributable to participants 1,843 (12,932) 4,055 2,741
Other comprehensive income not to be reclassified to
income statement in subsequent years:
Revaluation of land and buildings 1,927 1,929 3,950 3,905
Deferred tax relating to revaluation of land
and buildings (57) (147) (219) (305)
Other comprehensive income attributable to participants (658) (718) (2,519) (2,536)
Total comprehensive income for the year 19,479 38,497 112,835 89,286
Individual period Cumulative year
The Condensed Financial Statements should be read in conjunction with
the Annual Financial Statements for the year ended 31 March 2017
MNRB HOLDINGS BERHAD (13487-A)
INTERIM FINANCIAL STATEMENTS
(The figures have not been audited)
CONDENSED CONSOLIDATED STATEMENT OF COMPREHENSIVE INCOME
GROUP
FOR THE FINANCIAL YEAR ENDED 31 MARCH 2018
3
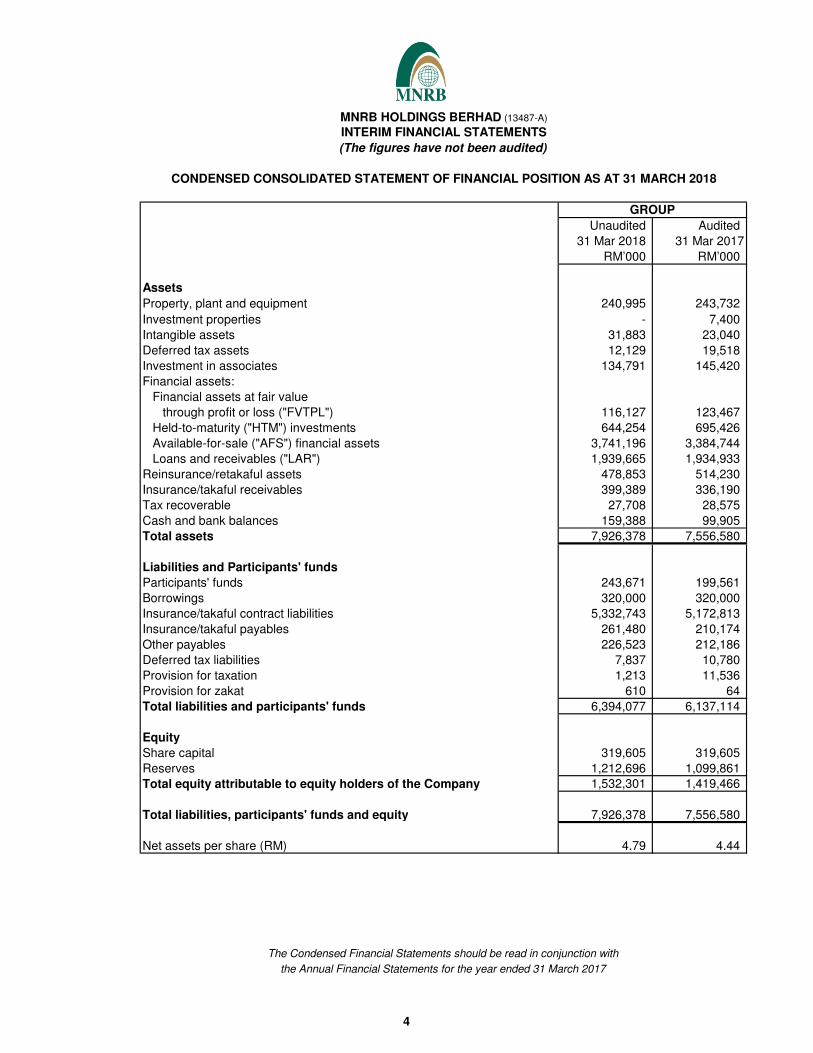
Unaudited Audited
31 Mar 2018 31 Mar 2017
RM’000 RM’000
Assets
Property, plant and equipment 240,995 243,732
Investment properties - 7,400
Intangible assets 31,883 23,040
Deferred tax assets 12,129 19,518
Investment in associates 134,791 145,420
Financial assets:
Financial assets at fair value
through profit or loss ("FVTPL") 116,127 123,467
Held-to-maturity ("HTM") investments 644,254 695,426
Available-for-sale ("AFS") financial assets 3,741,196 3,384,744
Loans and receivables ("LAR") 1,939,665 1,934,933
Reinsurance/retakaful assets 478,853 514,230
Insurance/takaful receivables 399,389 336,190
Tax recoverable 27,708 28,575
Cash and bank balances 159,388 99,905
Total assets 7,926,378 7,556,580
Liabilities and Participants' funds
Participants' funds 243,671 199,561
Borrowings 320,000 320,000
Insurance/takaful contract liabilities 5,332,743 5,172,813
Insurance/takaful payables 261,480 210,174
Other payables 226,523 212,186
Deferred tax liabilities 7,837 10,780
Provision for taxation 1,213 11,536
Provision for zakat 610 64
Total liabilities and participants' funds 6,394,077 6,137,114
Equity
Share capital 319,605 319,605
Reserves 1,212,696 1,099,861
Total equity attributable to equity holders of the Company 1,532,301 1,419,466
Total liabilities, participants' funds and equity 7,926,378 7,556,580
Net assets per share (RM) 4.79 4.44
MNRB HOLDINGS BERHAD (13487-A)
INTERIM FINANCIAL STATEMENTS
GROUP
(The figures have not been audited)
CONDENSED CONSOLIDATED STATEMENT OF FINANCIAL POSITION AS AT 31 MARCH 2018
The Condensed Financial Statements should be read in conjunction with
the Annual Financial Statements for the year ended 31 March 2017
4

Foreign Retained
exchange profits Net
Share translation AFS Revaluation brought profit for
capital reserve reserve reserve forward the year Total
RM’000 RM’000 RM’000 RM’000 RM’000 RM’000 RM’000
At 1 April 2013,
previously stated 213,070 16,728 8,472 30,660 757,963 1,026,893
Consolidation Adjustment
Effects of adopting MFRS 1 - - - - -
At 1 April 2017 319,605 55,696 3,659 42,730 997,776 - 1,419,466
Total comprehensive (loss)/income
for the year - (22,483) (2,681) 1,212 - 136,787 112,835
At 31 March 2018 319,605 33,213 978 43,942 997,776 136,787 1,532,301 2,753,515
Foreign Retained
exchange profits Net
Share Share translation AFS Revaluation brought profit for
capital premium reserve reserve reserve forward the year Total
RM’000 RM’000 RM’000 RM’000 RM’000 RM’000 RM’000 RM’000
At 1 April 2012,
At 1 April 2016 213,070 105,051 38,776 3,527 41,666 928,090 - 1,330,180
Total comprehensive income
for the year - - 16,921 132 1,064 - 71,170 89,286
Issuance of bonus share 106,535 (105,051) - - (1,484) -
At 31 March 2017 319,605 - 55,697 3,659 42,730 928,090 69,686 1,419,466
CONDENSED STATEMENT OF CHANGES IN EQUITYFOR THE FINANCIAL YEAR ENDED 31 MARCH 2017
The Condensed Financial Statements should be read in conjunction with
Reserves
Non-distributable Distributable
GROUP
Attributable to Equity Holders of the Company
MNRB HOLDINGS BERHAD (13487-A)
INTERIM FINANCIAL STATEMENTS
(The figures have not been audited)
FOR THE FINANCIAL YEAR ENDED 31 MARCH 2018
CONDENSED STATEMENT OF CHANGES IN EQUITY
Distributable
GROUP
Attributable to Equity Holders of the Company
Reserves
Non-distributable
the Annual Financial Statements for the year ended 31 March 2017
5
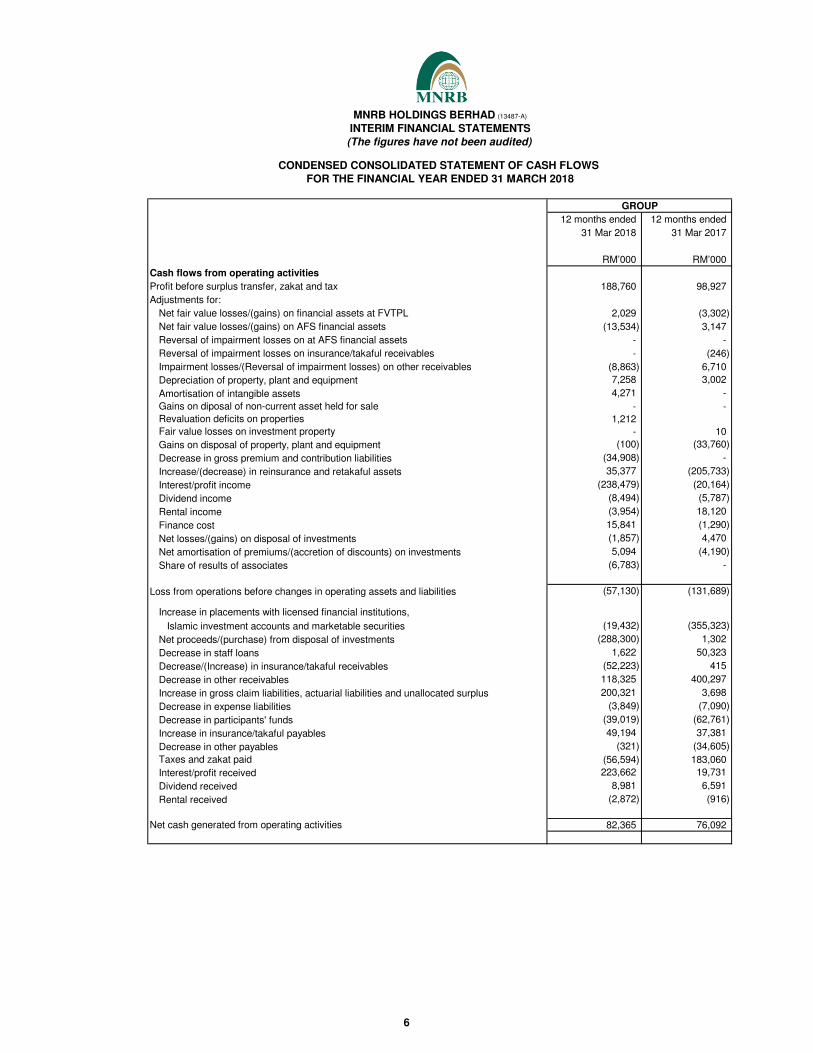
12 months ended 12 months ended
31 Mar 2018 31 Mar 2017
RM’000 RM’000
Cash flows from operating activities
Profit before surplus transfer, zakat and tax 188,760 98,927
Adjustments for:
Net fair value losses/(gains) on financial assets at FVTPL 2,029 (3,302)
Net fair value losses/(gains) on AFS financial assets (13,534) 3,147
Reversal of impairment losses on at AFS financial assets - -
Reversal of impairment losses on insurance/takaful receivables - (246)
Impairment losses/(Reversal of impairment losses) on other receivables (8,863) 6,710
Depreciation of property, plant and equipment 7,258 3,002
Amortisation of intangible assets 4,271 -
Gains on diposal of non-current asset held for sale - -
Revaluation deficits on properties 1,212
Fair value losses on investment property - 10
Gains on disposal of property, plant and equipment (100) (33,760)
Decrease in gross premium and contribution liabilities (34,908) -
Increase/(decrease) in reinsurance and retakaful assets 35,377 (205,733)
Interest/profit income (238,479) (20,164)
Dividend income (8,494) (5,787)
Rental income (3,954) 18,120
Finance cost 15,841 (1,290)
Net losses/(gains) on disposal of investments (1,857) 4,470
Net amortisation of premiums/(accretion of discounts) on investments 5,094 (4,190)
Share of results of associates (6,783) -
Loss from operations before changes in operating assets and liabilities (57,130) (131,689)
Islamic investment accounts and marketable securities (19,432) (355,323)
Net proceeds/(purchase) from disposal of investments (288,300) 1,302
Decrease in staff loans 1,622 50,323
Decrease/(Increase) in insurance/takaful receivables (52,223) 415
Decrease in other receivables 118,325 400,297
Increase in gross claim liabilities, actuarial liabilities and unallocated surplus 200,321 3,698
Decrease in expense liabilities (3,849) (7,090)
Decrease in participants' funds (39,019) (62,761)
Increase in insurance/takaful payables 49,194 37,381
Decrease in other payables (321) (34,605)
Taxes and zakat paid (56,594) 183,060
Interest/profit received 223,662 19,731
Dividend received 8,981 6,591
Rental received (2,872) (916)
Net cash generated from operating activities 82,365 76,092
MNRB HOLDINGS BERHAD (13487-A)
INTERIM FINANCIAL STATEMENTS
(The figures have not been audited)
CONDENSED CONSOLIDATED STATEMENT OF CASH FLOWS
GROUP
Increase in placements with licensed financial institutions,
FOR THE FINANCIAL YEAR ENDED 31 MARCH 2018
6
MNRB HOLDINGS BERHAD (13487-A)
INTERIM FINANCIAL STATEMENTS
(The figures have not been audited)
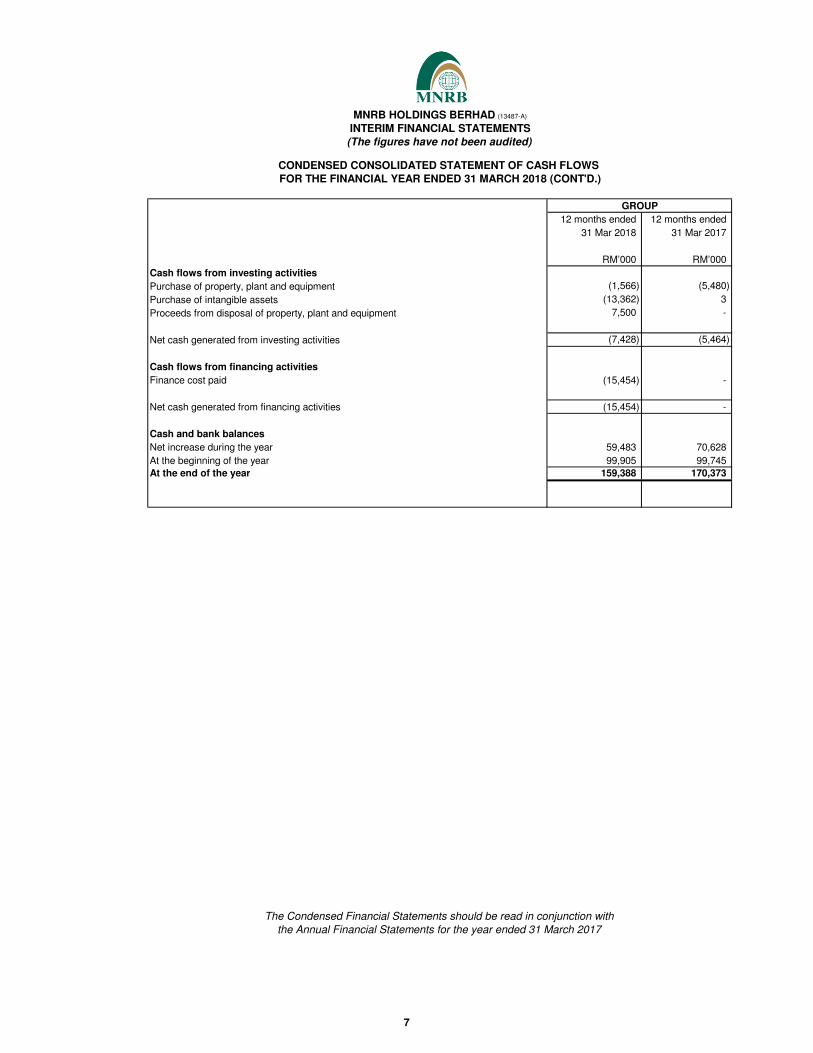
12 months ended 12 months ended
31 Mar 2018 31 Mar 2017
RM’000 RM’000
Cash flows from investing activities
Purchase of property, plant and equipment (1,566) (5,480)
Purchase of intangible assets (13,362) 3
Proceeds from disposal of property, plant and equipment 7,500 -
Net cash generated from investing activities (7,428) (5,464)
Cash flows from financing activities
Finance cost paid (15,454) -
Net cash generated from financing activities (15,454) -
Cash and bank balances
Net increase during the year 59,483 70,628
At the beginning of the year 99,905 99,745
At the end of the year 159,388 170,373
The Condensed Financial Statements should be read in conjunction with
the Annual Financial Statements for the year ended 31 March 2017
CONDENSED CONSOLIDATED STATEMENT OF CASH FLOWS
FOR THE FINANCIAL YEAR ENDED 31 MARCH 2018 (CONT'D.)
GROUP
7
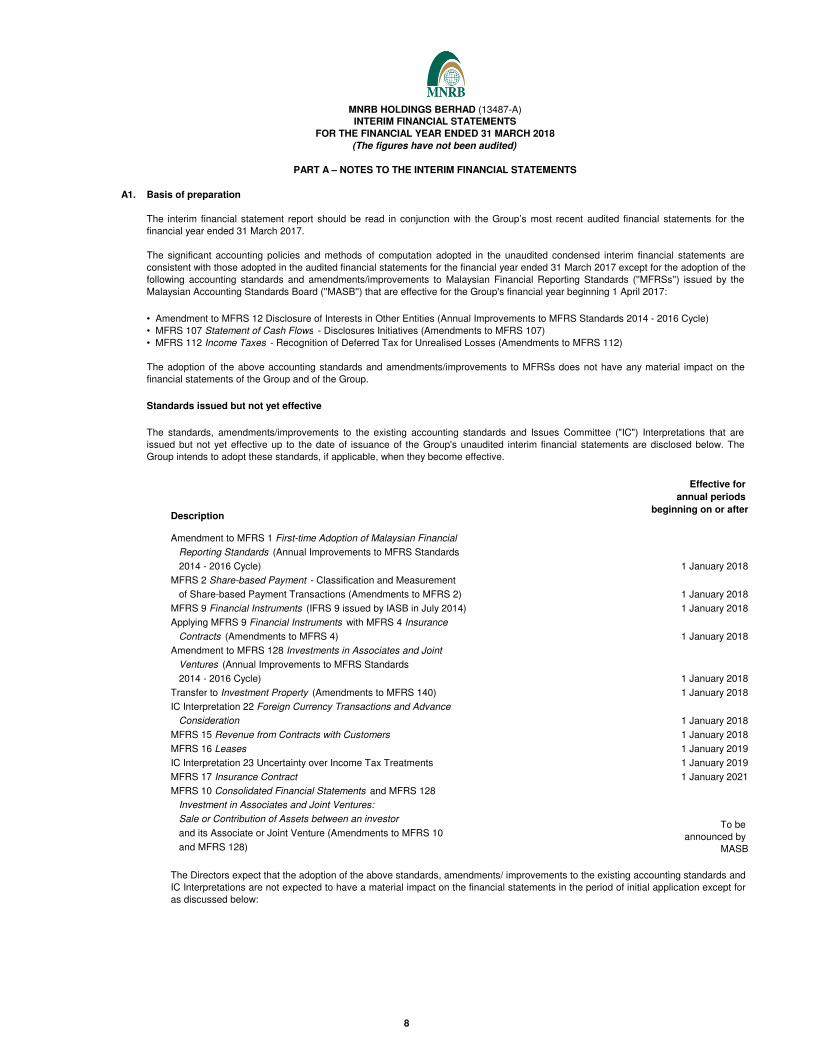
A1. Basis of preparation
• Amendment to MFRS 12 Disclosure of Interests in Other Entities (Annual Improvements to MFRS Standards 2014 - 2016 Cycle)
• MFRS 107 Statement of Cash Flows - Disclosures Initiatives (Amendments to MFRS 107)
• MFRS 112 Income Taxes - Recognition of Deferred Tax for Unrealised Losses (Amendments to MFRS 112)
Standards issued but not yet effective
Amendment to MFRS 1 First-time Adoption of Malaysian Financial
Reporting Standards (Annual Improvements to MFRS Standards
2014 - 2016 Cycle) 1 January 2018
MFRS 2 Share-based Payment - Classification and Measurement
of Share-based Payment Transactions (Amendments to MFRS 2) 1 January 2018
MFRS 9 Financial Instruments (IFRS 9 issued by IASB in July 2014) 1 January 2018
Applying MFRS 9 Financial Instruments with MFRS 4 Insurance
Contracts (Amendments to MFRS 4) 1 January 2018
Amendment to MFRS 128 Investments in Associates and Joint
Ventures (Annual Improvements to MFRS Standards
2014 - 2016 Cycle) 1 January 2018
Transfer to Investment Property (Amendments to MFRS 140) 1 January 2018
IC Interpretation 22 Foreign Currency Transactions and Advance
Consideration 1 January 2018
MFRS 15 Revenue from Contracts with Customers 1 January 2018
MFRS 16 Leases 1 January 2019
IC Interpretation 23 Uncertainty over Income Tax Treatments 1 January 2019
MFRS 17 Insurance Contract 1 January 2021
MFRS 10 Consolidated Financial Statements and MFRS 128
Investment in Associates and Joint Ventures:
Sale or Contribution of Assets between an investor
and its Associate or Joint Venture (Amendments to MFRS 10
and MFRS 128)
To be
announced by
MASB
The Directors expect that the adoption of the above standards, amendments/ improvements to the existing accounting standards and
IC Interpretations are not expected to have a material impact on the financial statements in the period of initial application except for
as discussed below:
The standards, amendments/improvements to the existing accounting standards and Issues Committee ("IC") Interpretations that are
issued but not yet effective up to the date of issuance of the Group's unaudited interim financial statements are disclosed below. The
Group intends to adopt these standards, if applicable, when they become effective.
Effective for
annual periods
beginning on or afterDescription
MNRB HOLDINGS BERHAD (13487-A)
INTERIM FINANCIAL STATEMENTS
FOR THE FINANCIAL YEAR ENDED 31 MARCH 2018
(The figures have not been audited)
PART A – NOTES TO THE INTERIM FINANCIAL STATEMENTS
The interim financial statement report should be read in conjunction with the Group’s most recent audited financial statements for the
financial year ended 31 March 2017.
The significant accounting policies and methods of computation adopted in the unaudited condensed interim financial statements are
consistent with those adopted in the audited financial statements for the financial year ended 31 March 2017 except for the adoption of the
following accounting standards and amendments/improvements to Malaysian Financial Reporting Standards (''MFRSs'') issued by the
Malaysian Accounting Standards Board (''MASB'') that are effective for the Group's financial year beginning 1 April 2017:
The adoption of the above accounting standards and amendments/improvements to MFRSs does not have any material impact on the
financial statements of the Group and of the Group.
8
MNRB HOLDINGS BERHAD (13487-A)
INTERIM FINANCIAL STATEMENTS
FOR THE FINANCIAL YEAR ENDED 31 MARCH 2018
(The figures have not been audited)
PART A – NOTES TO THE INTERIM FINANCIAL STATEMENTS
(i) Classification and measurement
(ii) Impairment
(iii) Hedge accounting
The requirements for general hedge accounting have been simplified for hedge effectiveness testing and may result in more
designations of hedged items for accounting purposes.
The Group does not expect a significant impact to the financial statements on applying the hedge accounting.
The Group plans to adopt the new standard on the required effective date. The Group had performed a preliminary assessment on the
gaps under all three aspects of MFRS 9. This preliminary assessment is based on currently available information and may be subject to
changes arising from further detailed analyses or additional reasonable and supportable information being made available to the Group.
Overall, the Group does not anticipate significant impact to the financial statements except for the effect of potentially higher impairment
losses under the expected credit loss model. The Group will perform a detailed assessment to determine the extent of the anticipated
impacts.
- A new asset category measured at fair value through other comprehensive income (“FVOCI”) is introduced. This applies to debt
instruments with contractual cash flow characteristics that are solely payments of principle and interest and held in a model whose
objective is achieved by both collecting contractual cash flows and selling financial assets;
- The held-to-maturity (“HTM”) and available-for-sale (“AFS”) asset categories will be removed;
MFRS 9 Financial Instruments
The International Accounting Standards Board ("IASB") issued the final version of IFRS 9 Financial Instruments which reflects all phases
of the financial instruments project and replaces IAS3 9 Financial Instruments: Recognition and Measurement and all previous versions of
IFRS 9. The standard introduces new requirements for classification and measurement, impairment and hedge accounting. IFRS 9 is
effective for annual periods beginning on or after 1 January 2018, with early application permitted. Retrospective application is required,
but restatement of comparative information is not compulsory.
The areas with expected significant impact from application of MFRS 9 are summarised below:
The classification and measurement of financial assets is determined on the basis of the contractual cash flow characteristics and
the objective of the business model associated with holding the asset. Key changes include the following:
The Group is currently in the process of finalising the financial impacts of applying the ECL requirements of MFRS 9.
The Group does not expect a significant impact to the financial statements on applying the classification and measurement
requirements.
- A new asset category for non-traded equity investments measured at FVOCI is introduced; and
-Classification of financial liabilities will remain largely unchanged, other than the fair value gains and losses attributable to changes
in ‘own credit risk’ for financial liabilities designated and measured at fair value through profit or loss ("FVTPL") to be presented in
other comprehensive income ("OCI"). The remainder of the change in fair value is presented in profit or loss, unless presentation of
the fair value change in respect of the liability's credit risk in OCI would create or enlarge an accounting mismatch in profit or loss.
Loans and receivables ("LAR") are held to collect contractual cash flows and are representing solely payments of principal and
interest. Thus, the Group expects that these will continue to be measured at amortised cost under MFRS 9. However, the Group will
analyse the contractual cash flow characteristics of those instruments in more detail before concluding whether all those instruments
meet the criteria for amortised cost measurement under MFRS 9.
The MFRS 9 impairment requirements are based on an Expected Credit Loss (“ECL”) model that replaces the Incurred Loss model
under the current accounting standard. The Group expects to recognise either a 12-month (Stage 1) or lifetime ECL (Stage 2 and 3),
depending on whether there has been a significant increase in credit risk since initial recognition. The ECL model applies to financial
assets measured at amortised cost or at FVOCI, irrevocable loan commitments and financial guarantee contracts, which will include
loans, advances and financing and debt instruments held by the Group. The ECL model also applies to contract assets under MFRS
15 Revenue from Contracts with Customers and lease receivables under MFRS 117 Leases. Appropriate impairment methodology
will be adopted for calculating allowances for impairment losses.
9
MNRB HOLDINGS BERHAD (13487-A)
INTERIM FINANCIAL STATEMENTS
FOR THE FINANCIAL YEAR ENDED 31 MARCH 2018
(The figures have not been audited)
PART A – NOTES TO THE INTERIM FINANCIAL STATEMENTS
MFRS 15 Revenue from Contracts with Customers
MFRS 16 Leases
(i) Lessee
(ii) Lessor
Applying MFRS 9 Financial Instruments with MFRS 4 Insurance Contracts
(Amendments to MFRS 4)
The Group has opted not to utilise the exemptions permitted under this Amendment and will fully adopt MFRS 9 effective from 1
January 2018.
MFRS 16 sets out the principles for the recognition, measurement, presentation and disclosure of leases and requires lessees to
account for all leases under a single on balance sheet model, similar to the accounting for finance leases under MFRS 117. The
standard will supersede MFRS 117 Leases , IC Interpretation 4 Determining whether an Arrangement contains a Lease , IC
Interpretation 115 Operating Lease-Incentives and IC Interpretation 127 Evaluating the Substance of Transactions Involving the
Legal Form of a Lease .
At the commencement date of a lease, a lessee will recognise a liability to make lease payments and an asset representing the right
to use the underlying asset during the lease term. Subsequently, lessees will be required to recognise interest expense on the lease
liability and the depreciation expense on the right-of-use asset.
Lessor accounting under MFRS 16 is substantially the same as the accounting under MFRS 117. Lessors will continue to classify all
leases using the same classification principle as in MFRS 117 and distinguish between two types of leases: operating and finance
leases.
The standard is effective for annual periods beginning on or after 1 January 2019. Early application is permitted but not before an
entity applies MFRS 15. A lessee can choose to apply the standard using either a full retrospective or a modified retrospective
approach. The Group plans to assess the potential effect of MFRS 16 on its financial statement in the near future.
In December 2016, the MASB issued amendments to MFRS 4 to address issues arising from the different effective dates of MFRS 9
and the upcoming new insurance contracts standard (IFRS 17) to be issued by the International Accounting Standards Board.
The amendments introduce two alternative options for entities issuing contracts within the scope of MFRS 4, notably a temporary
exemption and an overlay approach. The temporary exemption enables eligible entities to defer the implementation date of MFRS 9
for annual periods beginning before 1 January 2021 at the latest whilst the overlay approach allows an entity applying MFRS 9 to
reclassify between profit or loss and other comprehensive income an amount that results in the profit or loss at the end of the
reporting period for the designated financial assets being the same as if an entity had applied MFRS 139 to these designated
financial assets.
MFRS 15 was issued in 2014 and establishes a five-step model to account for revenue arising from contracts with customers. Under
MFRS 15, revenue is recognised at an amount that reflects the consideration to which an entity expects to be entitled in exchange
for transferring goods or services to a customer.
The new revenue standard will supersede all current revenue recognition requirements under MFRS. Either a full retrospective
application or a modified retrospective application is required for annual periods beginning on or after 1 January 2018. Early adoption
is permitted. The Group expects to apply MFRS 15 fully retrospective. Given that takaful contracts are scoped out of MFRS 15, the
Group thus, does not expect the impact to be significant.
10

MNRB HOLDINGS BERHAD (13487-A)
INTERIM FINANCIAL STATEMENTS
FOR THE FINANCIAL YEAR ENDED 31 MARCH 2018
(The figures have not been audited)
PART A – NOTES TO THE INTERIM FINANCIAL STATEMENTS
A2. Auditors’ Report on preceding annual financial statements
A3. Seasonal or cyclical factors
A4. Unusual items affecting assets, liabilities, equity, net income or cash flows
A5. Changes in estimates
There were no material changes in estimates used in the preparation of this interim financial report.
A6. Issuances, cancellations, repurchase, resale and repayments of debt and equity securities
A7. Dividend paid
No dividend was paid during the fourth quarter ended 31 March 2018.
A8. Segmental reporting
Financial year ended 31 March 2018
Investment Reinsurance Takaful Retakaful Intra-Group
Holding Business Business Business Adjustments Consolidated
RM’000 RM’000 RM’000 RM’000 RM’000 RM’000
Revenue
External 3,171 1,369,377 1,058,965 42,004 - 2,473,517
Inter-segment 35,075 1,576 723 64 (37,116) 322
38,246 1,370,953 1,059,688 42,068 (37,116) 2,473,839
Results
Segment results 7,576 122,242 106,365 3,967 (1,191) 238,959
Share of results of associates 592 6,192 - - - 6,784
Operating profit/(loss) before
surplus/(deficit) attributable to takaful
participants, zakat and taxation 8,168 128,434 106,365 3,967 (1,191) 245,743
Surplus attributable to takaful participants - - (56,982) - - (56,982)
Operating profit/ (loss) before
zakat and taxation 8,168 128,434 49,383 3,967 (1,191) 188,761
Zakat and taxation (703) (39,289) (11,619) 636 (999) (51,974)
Net profit/(loss) for the year
attributable to equity holders
of the Company 7,465 89,145 37,764 4,603 (2,190) 136,787
There were no unusual items affecting assets, liabilities, equity, net income or cash flows of the Group during the financial year ended 31
March 2018.
During the financial year ended 31 March 2018, the operations of the Group were not materially affected by any seasonal factors. With
regard to cyclical factors, the performance of the Group is directly correlated with the industry cycle and the economic performance of the
countries in which the Group has business dealings with.
The auditors’ report on the audited financial statements for the financial year ended 31 March 2017 was not subject to any qualification.
On 9 June 2017, the Company made a drawdown of RM120 million from the revolving credit facility obtained from AmBank (M) Berhad.
The proceeds from the drawdown were fully utilised towards redeeming the Sukuk Mudharabah Programme of the same amount from
MIDF Amanah Investment Bank Berhad.
11

MNRB HOLDINGS BERHAD (13487-A)
INTERIM FINANCIAL STATEMENTS
FOR THE FINANCIAL YEAR ENDED 31 MARCH 2018
(The figures have not been audited)
PART A – NOTES TO THE INTERIM FINANCIAL STATEMENTS
A8. Segmental reporting (Cont'd)
Financial year ended 31 March 2017
Investment Reinsurance Takaful Retakaful Intra-Group
Holding Business Business Business Adjustments Consolidated
RM’000 RM’000 RM’000 RM’000 RM’000 RM’000
Revenue
External 1,147 1,395,715 1,107,278 28,218 - 2,532,358
Inter-segment 34,469 2,211 723 669 (38,634) (562)
35,616 1,397,926 1,108,001 28,887 (38,634) 2,531,796
Results
Segment results (17,796) 102,290 4,625 10,934 (2,692) 97,361
Share of results of associates 369 5,260 - - - 5,629
Operating profit/(loss) before
surplus/(deficit) attributable to takaful
participants, zakat and taxation (17,427) 107,550 4,625 10,934 (2,692) 102,990
Surplus attributable to takaful participants - - (4,064) - - (4,064)
Operating profit/ (loss) before
zakat and taxation (17,427) 107,550 561 10,934 (2,692) 98,926
Zakat and taxation (405) (18,241) (9,147) 37 - (27,756)
Net profit/(loss) for the year
attributable to equity holders
of the Company (17,832) 89,309 (8,586) 10,971 (2,692) 71,170
A9. Carrying amount of revalued properties
A10. Significant events
(i)
(ii)
(iii)
(iv)
(v)
A11. Subsequent events
There were no significant subsequent events from 31 March 2018 to the date of this report.
A12. Changes in the composition of the Group
During the financial year ended 31 March 2018, the Group had revalued all of its self-occupied and investment properties. The resultant
revaluation surplus of RM1.2 million was recognised in other comprehensive income and accumulated in equity as revaluation reserve.
On 25 January 2018, the Company further subscribed to 20,000,000 new ordinary shares in TIB at a total consideration of
RM20million. With the above subscription, the total issued and paid-up capital of TIB now stands at RM335,000,000.
On 12 February 2018, the Company increased its investment in MRE by subscribing to 53,106,421 new ordinary shares at a total
consideration of RM53,106,421. With the new subscription, the total issued and paid-up capital of MRE now stands at
RM563,106,421.
As announced on 30 November 2017, MNRB Retakaful Berhad ("MRT") had, on 1 December 2017, transferred its family retakaful
and general retakaful businesses to Malaysian Reinsurance Berhad (“MRE”), both wholly-owned subsidiaries of the Company
(“Business Transfer”). The retakaful business of the Group are now carried out by MRE through its Retakaful Division.
The Business Transfer does not have any material effect on the earnings and net assets of the Company for the financial year ended
31 March 2018.
On 5 February 2018, SSB implemented a share capital reduction exercise and reduced its paid-up capital to RM2 from
RM102,000,000.
There were no significant changes in the composition of the Group during the financial year ended 31 March 2018.
Arising from the Business Transfer, MRT’s Retakaful licence was surrendered to Bank Negara Malaysia and as announced on 4
December 2017, MRT changed its name to Sinar Seroja Berhad (“SSB”) with effect from the same date.
On 22 December 2017, the Company subscribed to 20,000,000 new ordinary shares in its wholly owned subsidiary, Takaful IKHLAS
Berhad (“TIB”) at a total consideration of RM20 million.
12
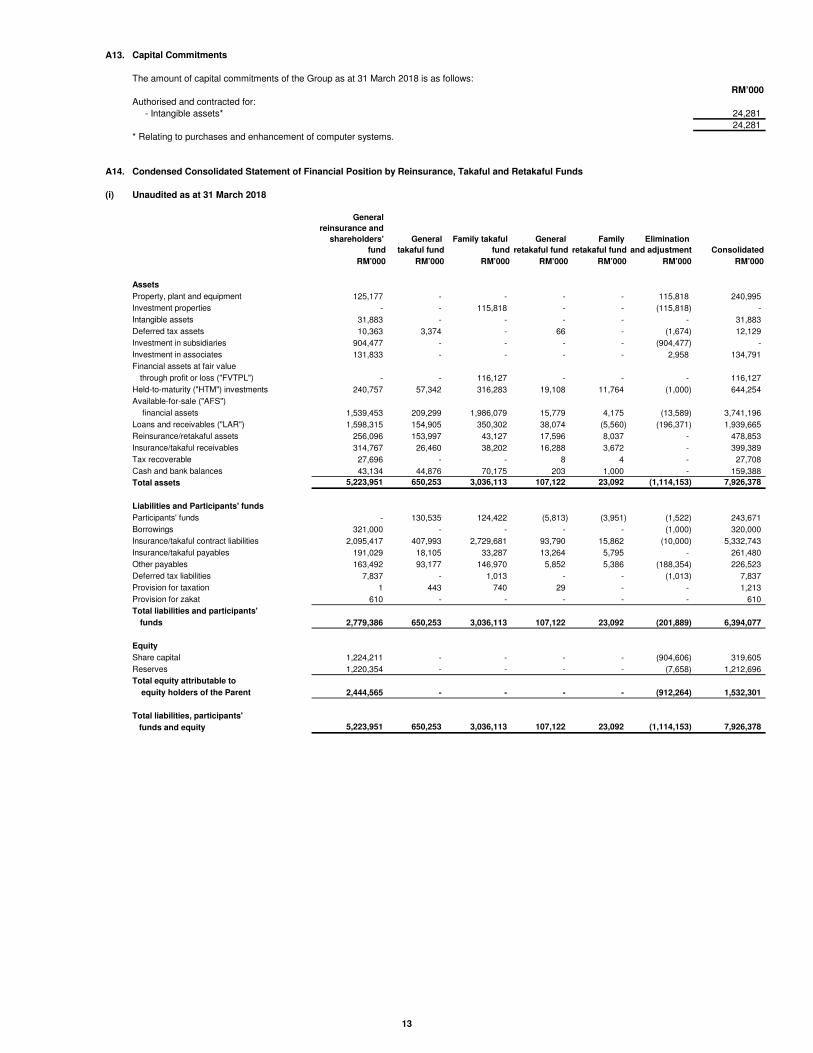
A13. Capital Commitments
The amount of capital commitments of the Group as at 31 March 2018 is as follows:
RM’000
Authorised and contracted for:
- Intangible assets* 24,281
24,281
* Relating to purchases and enhancement of computer systems.
A14. Condensed Consolidated Statement of Financial Position by Reinsurance, Takaful and Retakaful Funds
(i) Unaudited as at 31 March 2018
RM’000 RM’000 RM’000 RM’000 RM’000 RM’000 RM’000
Assets
Property, plant and equipment 125,177 - - - - 115,818 240,995
Investment properties - - 115,818 - - (115,818) -
Intangible assets 31,883 - - - - - 31,883
Deferred tax assets 10,363 3,374 - 66 - (1,674) 12,129
Investment in subsidiaries 904,477 - - - - (904,477) -
Investment in associates 131,833 - - - - 2,958 134,791
Financial assets at fair value
through profit or loss ("FVTPL") - - 116,127 - - - 116,127
Held-to-maturity ("HTM") investments 240,757 57,342 316,283 19,108 11,764 (1,000) 644,254
Available-for-sale ("AFS")
financial assets 1,539,453 209,299 1,986,079 15,779 4,175 (13,589) 3,741,196
Loans and receivables ("LAR") 1,598,315 154,905 350,302 38,074 (5,560) (196,371) 1,939,665
Reinsurance/retakaful assets 256,096 153,997 43,127 17,596 8,037 - 478,853
Insurance/takaful receivables 314,767 26,460 38,202 16,288 3,672 - 399,389
Tax recoverable 27,696 - - 8 4 - 27,708
Cash and bank balances 43,134 44,876 70,175 203 1,000 - 159,388
Total assets 5,223,951 650,253 3,036,113 107,122 23,092 (1,114,153) 7,926,378
Liabilities and Participants' funds
Participants' funds - 130,535 124,422 (5,813) (3,951) (1,522) 243,671
Borrowings 321,000 - - - - (1,000) 320,000
Insurance/takaful contract liabilities 2,095,417 407,993 2,729,681 93,790 15,862 (10,000) 5,332,743
Insurance/takaful payables 191,029 18,105 33,287 13,264 5,795 - 261,480
Other payables 163,492 93,177 146,970 5,852 5,386 (188,354) 226,523
Deferred tax liabilities 7,837 - 1,013 - - (1,013) 7,837
Provision for taxation 1 443 740 29 - - 1,213
Provision for zakat 610 - - - - - 610
Total liabilities and participants'
funds 2,779,386 650,253 3,036,113 107,122 23,092 (201,889) 6,394,077
Equity
Share capital 1,224,211 - - - - (904,606) 319,605
Reserves 1,220,354 - - - - (7,658) 1,212,696
Total equity attributable to
equity holders of the Parent 2,444,565 - - - - (912,264) 1,532,301
Total liabilities, participants'
funds and equity 5,223,951 650,253 3,036,113 107,122 23,092 (1,114,153) 7,926,378
General
reinsurance and
shareholders'
fund
General
takaful fund
Family takaful
fund
General
retakaful fund
Family
retakaful fund
Elimination
and adjustment Consolidated
13
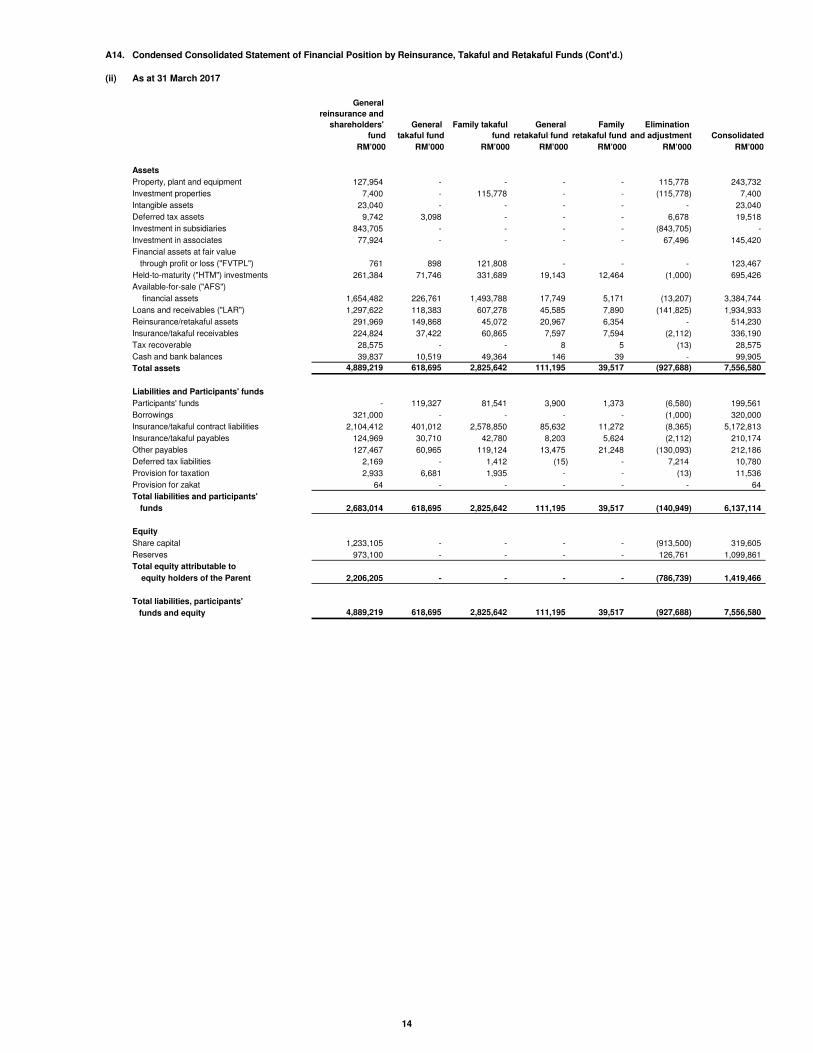
A14. Condensed Consolidated Statement of Financial Position by Reinsurance, Takaful and Retakaful Funds (Cont'd.)
(ii) As at 31 March 2017
RM’000 RM’000 RM’000 RM’000 RM’000 RM’000 RM’000
Assets
Property, plant and equipment 127,954 - - - - 115,778 243,732
Investment properties 7,400 - 115,778 - - (115,778) 7,400
Intangible assets 23,040 - - - - - 23,040
Deferred tax assets 9,742 3,098 - - - 6,678 19,518
Investment in subsidiaries 843,705 - - - - (843,705) -
Investment in associates 77,924 - - - - 67,496 145,420
Financial assets at fair value
through profit or loss ("FVTPL") 761 898 121,808 - - - 123,467
Held-to-maturity ("HTM") investments 261,384 71,746 331,689 19,143 12,464 (1,000) 695,426
Available-for-sale ("AFS")
financial assets 1,654,482 226,761 1,493,788 17,749 5,171 (13,207) 3,384,744
Loans and receivables ("LAR") 1,297,622 118,383 607,278 45,585 7,890 (141,825) 1,934,933
Reinsurance/retakaful assets 291,969 149,868 45,072 20,967 6,354 - 514,230
Insurance/takaful receivables 224,824 37,422 60,865 7,597 7,594 (2,112) 336,190
Tax recoverable 28,575 - - 8 5 (13) 28,575
Cash and bank balances 39,837 10,519 49,364 146 39 - 99,905
Total assets 4,889,219 618,695 2,825,642 111,195 39,517 (927,688) 7,556,580
Liabilities and Participants' funds
Participants' funds - 119,327 81,541 3,900 1,373 (6,580) 199,561
Borrowings 321,000 - - - - (1,000) 320,000
Insurance/takaful contract liabilities 2,104,412 401,012 2,578,850 85,632 11,272 (8,365) 5,172,813
Insurance/takaful payables 124,969 30,710 42,780 8,203 5,624 (2,112) 210,174
Other payables 127,467 60,965 119,124 13,475 21,248 (130,093) 212,186
Deferred tax liabilities 2,169 - 1,412 (15) - 7,214 10,780
Provision for taxation 2,933 6,681 1,935 - - (13) 11,536
Provision for zakat 64 - - - - - 64
Total liabilities and participants'
funds 2,683,014 618,695 2,825,642 111,195 39,517 (140,949) 6,137,114
Equity
Share capital 1,233,105 - - - - (913,500) 319,605
Reserves 973,100 - - - - 126,761 1,099,861
Total equity attributable to
equity holders of the Parent 2,206,205 - - - - (786,739) 1,419,466
Total liabilities, participants'
funds and equity 4,889,219 618,695 2,825,642 111,195 39,517 (927,688) 7,556,580
Consolidated
General
reinsurance and
shareholders'
fund
General
takaful fund
Family takaful
fund
General
retakaful fund
Family
retakaful fund
Elimination
and adjustment
14

A15. Unaudited Condensed Consolidated Income Statement by Reinsurance, Takaful and Retakaful Funds
(i) 12 months ended 31 March 2018
RM’000 RM’000 RM’000 RM’000 RM’000 RM’000 RM’000
Gross earned premiums/contributions 1,288,444 281,073 647,776 25,635 9,896 (1,236) 2,251,588
Premiums/contributions ceded to
reinsurers and retakaful operators (119,494) (118,031) (74,328) (3,358) (7,751) 236 (322,726)
Net earned premiums/contributions 1,168,950 163,042 573,448 22,277 2,145 (1,000) 1,928,862
Investment income 119,733 16,609 112,903 2,628 886 (6,830) 245,929
Realised gains/(losses) (51,651) (317) 5,031 - - 48,894 1,957
Fair value gains/(losses) 10,002 905 204 - - (408) 10,703
Fee and commission income 384,013 27,778 114 3 - (371,949) 39,959
Other operating revenue 76,710 - 12,656 777 27 (71,088) 19,082
Other revenue 538,807 44,975 130,908 3,408 913 (401,381) 317,630
Gross claims and benefit paid (737,182) (169,673) (262,906) (13,203) (11,305) 3,786 (1,190,483)
Claims ceded to reinsurers/retakaful
operators 37,193 73,995 (1,914) (625) 5,996 (3,786) 110,859
Gross change in contract liabilities (27,740) (9,653) (150,831) (7,535) (4,589) 15,389 (184,959)
Change in contract liabilities ceded to
reinsurers/retakaful operators (32,991) 6,042 (1,945) (3,261) 1,683 - (30,472)
Net claims and benefits (760,720) (99,289) (417,596) (24,624) (8,215) 15,389 (1,295,055)
Fee and commission expenses (426,362) (91,683) (231,391) (9,903) (322) 333,132 (426,529)
Management expenses (281,466) (9) - - - 43,500 (237,975)
Finance cost (15,891) - - - - 50 (15,841)
Other operating expenses (43,934) (1,423) - (1,134) - 21,772 (24,719)
Changes in expenses liabilities 3,848 - - - - - 3,848
Tax borne by participants - (1,889) (9,376) - - 3 (11,262)
Other expenses (763,805) (95,004) (240,767) (11,037) (322) 398,457 (712,478)
Share of results of associates - - - - - 6,783 6,783
Operating profit before surplus/
(deficit) attributable to takaful
participants, zakat and taxation 183,232 13,724 45,993 (9,976) (5,479) 18,248 245,742
Deficit/ (Surplus) attributable to takaful
participants - (13,724) (45,993) 9,899 5,490 (12,654) (56,982)
Operating profit before zakat
and taxation 183,232 - - (77) 11 5,594 188,760
Zakat (563) - - - - - (563)
Taxation (50,477) - - 77 (11) (999) (51,410)
Net profit for the year attributable
to equity holders of the Parent 132,192 - - - - 4,595 136,787
General
reinsurance and
shareholders'
fund
General
takaful fund
Family takaful
fund
General
retakaful fund
Family
retakaful fund
Elimination
and adjustment Consolidated
15
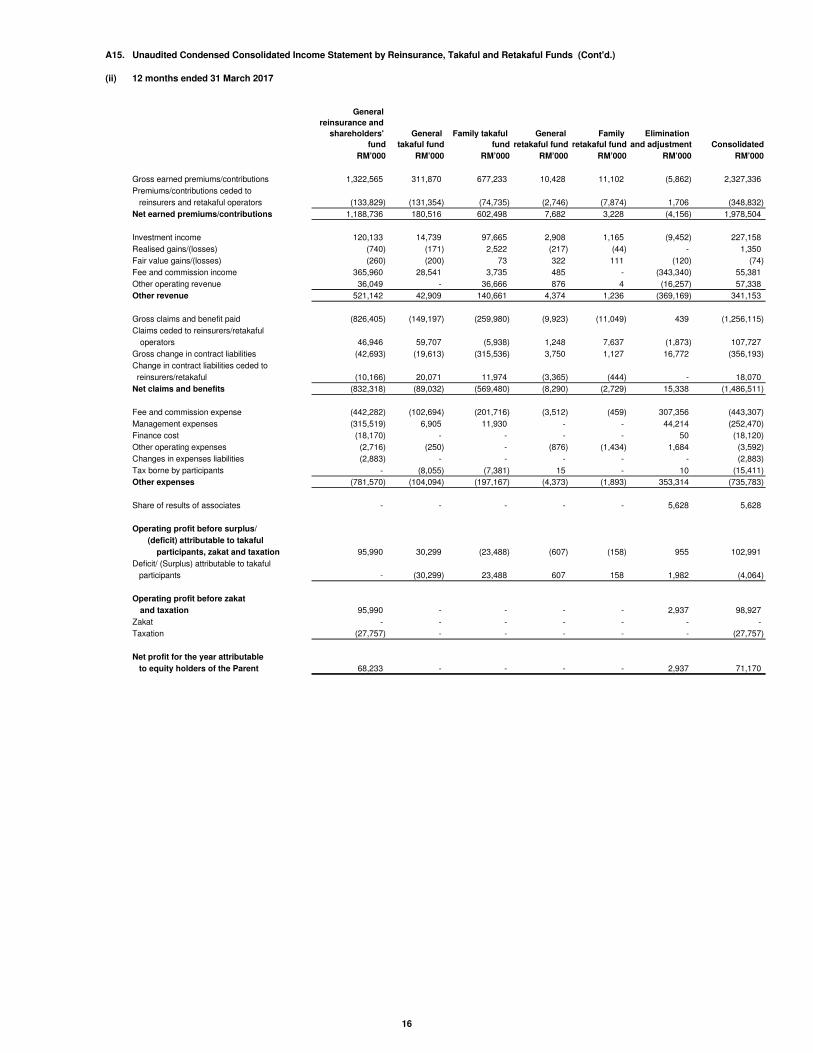
A15. Unaudited Condensed Consolidated Income Statement by Reinsurance, Takaful and Retakaful Funds (Cont'd.)
(ii) 12 months ended 31 March 2017
RM’000 RM’000 RM’000 RM’000 RM’000 RM’000 RM’000
Gross earned premiums/contributions 1,322,565 311,870 677,233 10,428 11,102 (5,862) 2,327,336
Premiums/contributions ceded to
reinsurers and retakaful operators (133,829) (131,354) (74,735) (2,746) (7,874) 1,706 (348,832)
Net earned premiums/contributions 1,188,736 180,516 602,498 7,682 3,228 (4,156) 1,978,504
Investment income 120,133 14,739 97,665 2,908 1,165 (9,452) 227,158
Realised gains/(losses) (740) (171) 2,522 (217) (44) - 1,350
Fair value gains/(losses) (260) (200) 73 322 111 (120) (74)
Fee and commission income 365,960 28,541 3,735 485 - (343,340) 55,381
Other operating revenue 36,049 - 36,666 876 4 (16,257) 57,338
Other revenue 521,142 42,909 140,661 4,374 1,236 (369,169) 341,153
Gross claims and benefit paid (826,405) (149,197) (259,980) (9,923) (11,049) 439 (1,256,115)
Claims ceded to reinsurers/retakaful
operators 46,946 59,707 (5,938) 1,248 7,637 (1,873) 107,727
Gross change in contract liabilities (42,693) (19,613) (315,536) 3,750 1,127 16,772 (356,193)
Change in contract liabilities ceded to
reinsurers/retakaful (10,166) 20,071 11,974 (3,365) (444) - 18,070
Net claims and benefits (832,318) (89,032) (569,480) (8,290) (2,729) 15,338 (1,486,511)
Fee and commission expense (442,282) (102,694) (201,716) (3,512) (459) 307,356 (443,307)
Management expenses (315,519) 6,905 11,930 - - 44,214 (252,470)
Finance cost (18,170) - - - - 50 (18,120)
Other operating expenses (2,716) (250) - (876) (1,434) 1,684 (3,592)
Changes in expenses liabilities (2,883) - - - - - (2,883)
Tax borne by participants - (8,055) (7,381) 15 - 10 (15,411)
Other expenses (781,570) (104,094) (197,167) (4,373) (1,893) 353,314 (735,783)
Share of results of associates - - - - - 5,628 5,628
Operating profit before surplus/
(deficit) attributable to takaful
participants, zakat and taxation 95,990 30,299 (23,488) (607) (158) 955 102,991
Deficit/ (Surplus) attributable to takaful
participants - (30,299) 23,488 607 158 1,982 (4,064)
Operating profit before zakat
and taxation 95,990 - - - - 2,937 98,927
Zakat - - - - - - -
Taxation (27,757) - - - - - (27,757)
Net profit for the year attributable
to equity holders of the Parent 68,233 - - - - 2,937 71,170
General
reinsurance and
shareholders'
fund
Family takaful
fund
General
retakaful fund
Family
retakaful fund
Elimination
and adjustment Consolidated
General
takaful fund
16

A17. Fair values of assets
Level 1 - Quoted prices (unadjusted) in active markets for identical assets or liabilities
Level 2 - Inputs that are based on observable market data, either directly or indirectly
Level 3 - Inputs that are not based on observable market data
(i)
(ii)
(iii)
(iv)
(v)
Description of significant unobservable inputs:
Valuation Significant unobservable
technique
Property, plant and equipment
Office building Income approach Yield 6.0% to 6.25%
Rental per square foot RM4.30 to RM4.96
Comparison Sales price per square feet RM512 to
approach for similar properties RM1,175
Property, plant and equipment
Office building Income approach Yield 6.0% to 6.25%
Rental per square foot RM4.60
Comparison Sales price per square feet RM641 to
approach for similar properties RM1,150
Investment property
Shoplots Income approach Rental per square metre RM2.00
Range
Freehold land and buildings and investment property have been revalued based on valuations performed by
accredited independent valuers having appropriate recognised professional qualification. The valuations are based
on the income and comparison approaches. In arriving at the fair value of the assets, the valuers had also taken into
consideration the future developments in terms of infrastructure in the vicinity of the properties.
inputs
A significant increase or decrease in the unobservable inputs used in the valuation would result in a correspondingly
higher or lower fair value.
There has been no transfer between Level 1 and Level 2 of the fair value hierarchy during the financial year.
31 March 2018
31 March 2017
The fair values of investments in mutual funds, unit trust funds and real estate investment trusts are valued based on
the net asset values of the underlying funds as at the reporting date; and
MFRS 7 Financial Instruments: Disclosures ("MFRS 7") requires the classification of financial instruments measured at fair
value according to a hierarchy that reflects the significance of inputs used in making the measurements, in particular, whether
the inputs used are observable or unobservable. MFRS 13 Fair Value Measurement requires similar disclosure requirements
as MFRS 7, but extends to include all assets and liabilities measured at fair value and/or for which fair values are disclosed.
The following levels of hierarchy are used for determining and disclosing the fair value of the Group and the Company's assets:
The fair values of the Group and Company’s assets are determined as follows:
The carrying amounts of financial assets, such as loans and receivables, insurance/takaful receivables and cash and
bank balances, are reasonable approximation of their fair values due to the relatively short term maturity of these
balances;
The fair values of quoted equities are based on quoted market prices as at the reporting date;
The fair values of Malaysian government securities, government investment issues and unquoted corporate debt
securities are based on indicative market prices from the Bond Pricing Agency of Malaysia ("BPAM");
17

A17. Fair values of assets (cont'd.)
Level 1 Level 2 Level 3 Total
RM'000 RM'000 RM'000 RM'000
Financial year ended 31 March 2018
Assets measured at fair value:
(a) Property, plant and equipment
Freehold land - - 36,000 36,000
Buildings - - 199,984 199,984
- - 235,984 235,984
(b) Financial assets at FVTPL
Shariah approved unit trust funds 116,127 - - 116,127
(c) AFS financial assets
Malaysian government securities - 445,802 - 445,802
Unquoted corporate debt securities - 1,754,339 - 1,754,339
Quoted shares in Malaysia 357,292 - - 357,292
Warrants 273 - - 273
Real estate investment trusts 5,725 - - 5,725
Government investment issues - 1,132,970 - 1,132,970
363,290 3,333,111 - 3,696,400
Level 1 Level 2 Level 3 Total
RM'000 RM'000 RM'000 RM'000
Financial year ended 31 March 2017
Assets measured at fair value:
(a) Property, plant and equipment
Freehold land - - 36,800 36,800
Buildings - - 201,419 201,419
- - 238,219 238,219
(b) Investment property - - 7,400 7,400
(c) Financial assets at FVTPL
Quoted shares in Malaysia 3,790 - - 3,790
Warrants 85 - - 85
Shariah approved unit trust funds 119,592 - - 119,592
123,467 - - 123,467
(d) AFS financial assets
Malaysian government securities - 128,006 - 128,006
Unquoted corporate debt securities - 2,258,038 - 2,258,038
Quoted shares in Malaysia 245,241 - - 245,241
Warrants 346 - - 346
Real estate investment trusts 20,217 - - 20,217
Government investment issues - 688,100 - 688,100
265,804 3,074,144 - 3,339,948
As at the reporting date, the Group and the Company held the following assets that are measured at fair value and/or for which
fair values are disclosed under Levels 1, 2 and 3 of the fair value hierarchy:
18

B1. Review of performance
Investment holding
Reinsurance business
Takaful business
Retakaful business
For the financial year ended 31 March 2018, the Group recorded a revenue of RM2,473.8 million as compared to
RM2,531.8 million reported for previous financial year. This was contributed by the decrease in revenue of both the
reinsurance and takaful subsidiaries.
Revenue for takaful business for the financial year ended 31 March 2018 decreased by 4.4% from RM1,108.0 million to
RM1,059.7 million. This was mainly due to lower gross contributions received.
Revenue for reinsurance business for the financial year ended 31 March 2018 decreased to RM1,371.0 million as
compared to RM1,397.9 million for the previous financial year.
The takaful subsidiary recorded a higher net profit of RM37.8 million in the financial year ended 31 March 2018 as
compared to a net loss of RM8.6 million for the same period last year. This was mainly due to lower management
expenses and higher wakalah fee received from participant funds.
The Group's net profit for the financial year ended 31 March 2018 was RM136.8 million, higher by RM65.6 million or
92.1% as compared to RM71.2 million reported in previous financial year for the reasons stated below.
Net profit for the financial year ended 31 March 2018 increased by 0.2% from RM89.3 million last year to
RM89.1million. The higher profit was due to the business rationalization exercise and termination of unprofitable
MNRB HOLDINGS BERHAD (13487-A)
INTERIM FINANCIAL STATEMENTS
FOR THE FINANCIAL YEAR ENDED 31 MARCH 2018
(The figures have not been audited)
PART B – ADDITIONAL INFORMATION REQUIRED BY THE
LISTING REQUIREMENTS OF BURSA MALAYSIA
Revenue for the financial year ended 31 March 2018 was RM38.2 million which was higher by RM2.63 million compared
to RM35.6 million reported in the corresponding year last year.
Net profit of RM7.5 million reported for the financial year ended 31 March 2018 was higher as compared to a net loss of
RM17.8 million for previous financial year. The higher profit during the year was due to the net gains from the capital
reduction exercise in Sinar Seroja Berhad ("SSB").
Revenue for retakaful business for the financial year ended 31 March 2018 was higher by 45.6% from RM28.9 million to
RM42.1 million, mainly due to the new businesses from the retakaful division of the reinsurance subsidiary.
The retakaful business recorded a net profit of RM4.6 million in the financial year ended 31 March 2018 as compared to
a net profit of RM11.0 million for previous year. The higher net profit in previous year was mainly due to the partial
writeback of Qard impairment.
19

MNRB HOLDINGS BERHAD (13487-A)
INTERIM FINANCIAL STATEMENTS
FOR THE FINANCIAL YEAR ENDED 31 MARCH 2018
(The figures have not been audited)
PART B – ADDITIONAL INFORMATION REQUIRED BY THE
LISTING REQUIREMENTS OF BURSA MALAYSIA
B2. Review of current quarter profitability against immediate preceding quarter
B3. Current year prospects
B4. Explanatory note for variance from profit forecast
There was no profit forecast issued by the Group during the financial year ended 31 March 2018.
B5. Investment income
3 months 3 months 12 months 12 months
ended ended ended ended
31 Mar 2018 31 Mar 2017 31 Mar 2018 31 Mar 2017
RM’000 RM’000 RM’000 RM’000
Financial assets at FVTPL
Dividend income:
- quoted shares in Malaysia 3 23 11 63
- unit trust funds 892 612 1,702 2,409
HTM investments
Interest/profit income 2,639 3,018 17,903 27,722
AFS financial assets
Interest/profit income 42,593 35,252 158,285 113,851
Dividend income:
- quoted shares in Malaysia 1,485 754 6,781 9,255
- unquoted shares in Malaysia - - 103 123
- unit and real estate investment
trusts in Malaysia - 4,492 - 8,188
Loans and receivables
Interest/profit income 16,058 15,962 62,264 64,164
Dividend income from associate 400 - 400 -
Rental income 123 1,417 3,954 5,887
Net amortisation of premiums (1,253) (1,163) (5,094) (4,470)
Investment expenses 212 1,346 (28) (34)
63,153 61,713 246,280 227,158
GROUP
Individual period Cumulative year
The Group recorded a net profit of RM29.4 million in the current quarter as compared to RM36.2 million in the
preceding quarter as a result of lower net profits from the Company's reinsurance subsidiary.
Barring any unforeseen circumstances, the Group is expected to achieve satisfactory results for the current financial
year ending 31 March 2019.
20

MNRB HOLDINGS BERHAD (13487-A)
INTERIM FINANCIAL STATEMENTS
FOR THE FINANCIAL YEAR ENDED 31 MARCH 2018
(The figures have not been audited)
PART B – ADDITIONAL INFORMATION REQUIRED BY THE
LISTING REQUIREMENTS OF BURSA MALAYSIA
B6. Taxation
3 months 3 months 12 months 12 months
ended ended ended ended
31 Mar 2018 31 Mar 2017 31 Mar 2018 31 Mar 2017
RM’000 RM’000 RM’000 RM’000
Operating profit before zakat and tax 37,036 35,831 188,760 98,927
Current tax (17,923) (14,502) (50,017) (29,894)
Deferred tax 10,855 4,104 (1,394) 2,136
(7,068) (10,398) (51,411) (27,758)
Zakat (563) - (563) -
(7,631) (10,398) (51,974) (27,758)
B7. Status of corporate proposal
There was no corporate proposal announced but not completed as at the date of this announcement.
B8. Borrowings and debt securities
The Group borrowings as at 31 March 2018 were as follows:
GROUP
31 Mar 2018
RM’000
Unsecured borrowings:
RM 200.0 million Revolving Credit Facility due in September 2018 200,000
RM 120.0 million Revolving Credit Facility due in December 2018 120,000
320,000
The effective tax rate for the cumulative period was higher than the statutory tax rate mainly due to some of the
management expenses of the Company's takaful subsidiary, that are not claimable as tax deduction and also effect of
deferred tax on the forex loss.
Individual period
GROUP
Cumulative year
21
MNRB HOLDINGS BERHAD (13487-A)
INTERIM FINANCIAL STATEMENTS
FOR THE FINANCIAL YEAR ENDED 31 MARCH 2018
(The figures have not been audited)
PART B – ADDITIONAL INFORMATION REQUIRED BY THE
LISTING REQUIREMENTS OF BURSA MALAYSIA
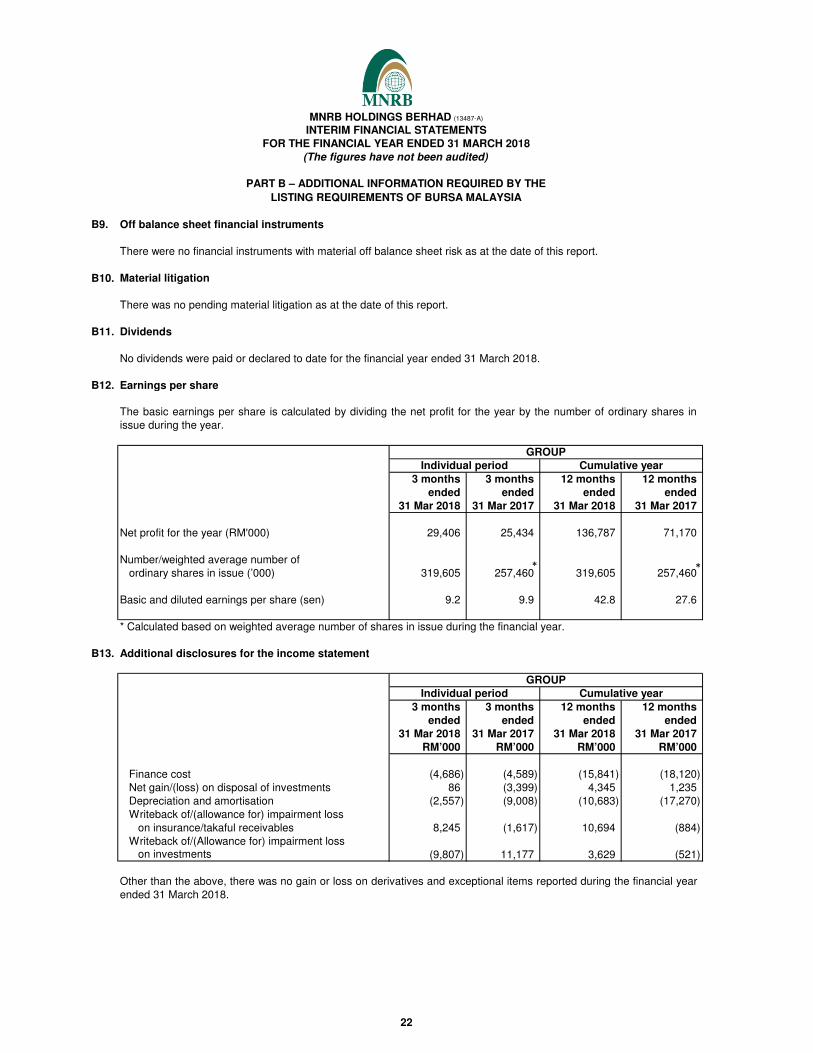
B9. Off balance sheet financial instruments
There were no financial instruments with material off balance sheet risk as at the date of this report.
B10. Material litigation
There was no pending material litigation as at the date of this report.
B11. Dividends
No dividends were paid or declared to date for the financial year ended 31 March 2018.
B12. Earnings per share
3 months 3 months 12 months 12 months
ended ended ended ended
31 Mar 2018 31 Mar 2017 31 Mar 2018 31 Mar 2017
Net profit for the year (RM'000) 29,406 25,434 136,787 71,170
Number/weighted average number of
ordinary shares in issue (’000) 319,605 257,460 319,605 257,460
Basic and diluted earnings per share (sen) 9.2 9.9 42.8 27.6
* Calculated based on weighted average number of shares in issue during the financial year.
B13. Additional disclosures for the income statement
3 months 3 months 12 months 12 months
ended ended ended ended
31 Mar 2018 31 Mar 2017 31 Mar 2018 31 Mar 2017
RM’000 RM’000 RM’000 RM’000
Finance cost (4,686) (4,589) (15,841) (18,120)
Net gain/(loss) on disposal of investments 86 (3,399) 4,345 1,235
Depreciation and amortisation (2,557) (9,008) (10,683) (17,270)
on insurance/takaful receivables 8,245 (1,617) 10,694 (884)
(9,807) 11,177 3,629 (521)
Cumulative year
Other than the above, there was no gain or loss on derivatives and exceptional items reported during the financial year
ended 31 March 2018.
GROUP
Individual period Cumulative year
on investments
Individual period
Writeback of/(allowance for) impairment loss
Writeback of/(Allowance for) impairment loss
GROUP
The basic earnings per share is calculated by dividing the net profit for the year by the number of ordinary shares in
issue during the year.
**
22

MNRB HOLDINGS BERHAD (13487-A)
INTERIM FINANCIAL STATEMENTS
FOR THE FINANCIAL YEAR ENDED 31 MARCH 2018
(The figures have not been audited)
PART B – ADDITIONAL INFORMATION REQUIRED BY THE
LISTING REQUIREMENTS OF BURSA MALAYSIA
B14. Disclosure of realised and unrealised profits
31 Mar 2018 31 March 2017
RM'000 RM'000
Total retained profits of the Group:
Realised 1,057,690 1,061,880
Unrealised 24,370 5,690
1,082,059 1,067,570
Share of realised retained profits from associated companies 21,571 14,787
1,103,630 1,082,357
Less: Consolidation adjustments 30,933 (84,581)
Total retained profits per the statement of changes in equity 1,134,563 997,776
By Order of the Board
NORAZMAN BIN HASHIM (MIA 5817)
LENA BINTI ABD LATIF (LS 8766)
Company Secretaries
Kuala Lumpur
Dated: 30 May 2018
The determination of realised and unrealised profits is computed based on Guidance of Special Matter No.1,
Determination of Realised and Unrealised Profits or Losses in the Context of Disclosure Pursuant to Bursa Securities
Listing Requirements, issued by the Malaysian Institute of Accountants on 20 December 2010.
GROUP
As required by Bursa Securities, the breakdown of the retained profits of the Group as at 31 March 2018, into realised
and unrealised profits, was as follows:
23