Embed Size (px)
Citation preview

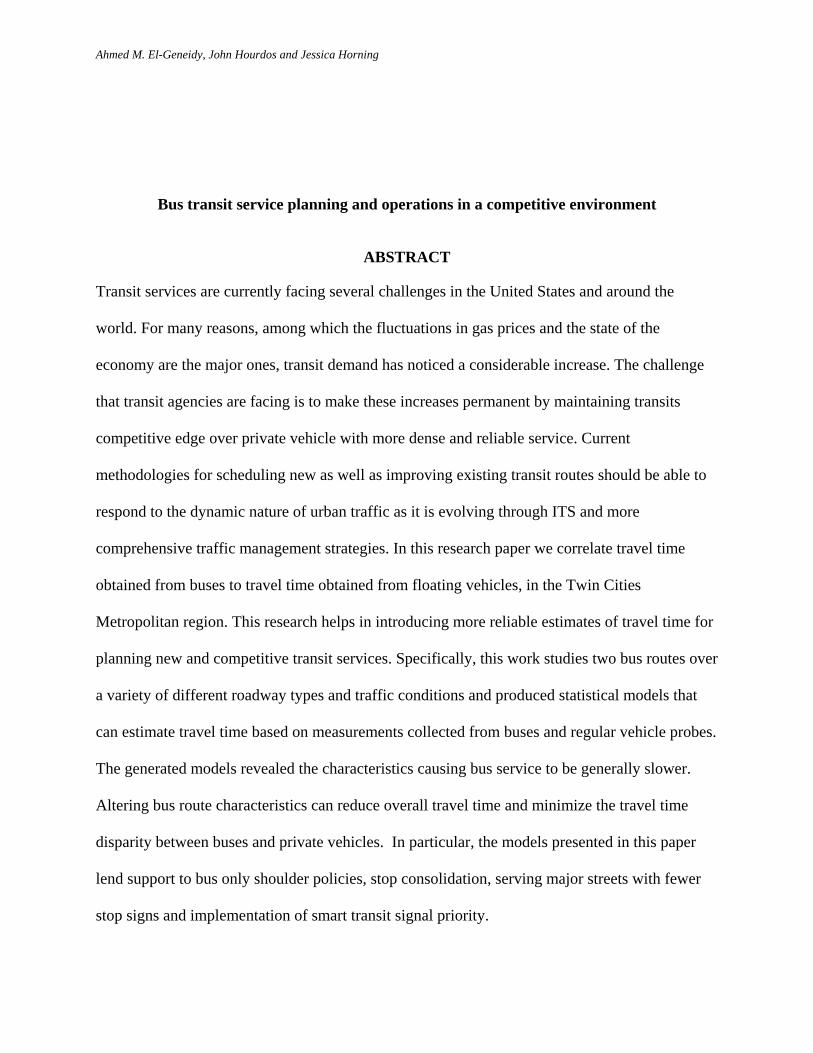
Bus transit service planning and operations in a competitive environment
Ahmed M. El-Geneidy Assistant Professor School of Urban Planning, McGill University, Suite 401, 815 Sherbrooke St. W., Montréal, Québec, H3A 2K6, Tel: 514-398-8741, Fax: 514-398-8376, E-mail: [email protected]
John Hourdos Director, Minnesota Traffic Observatory, Department of Civil Engineering, University of Minnesota 790 Civil Engineering Bldg. 111 Church Street SE Minneapolis, MN 55455 Tel: 612-626-5492 E-mail: [email protected] Jessica Horning Transportation Analyst Cambridge Systematics, Inc. 4800 Hampden Lane, Suite 800 Bethesda, MD 20814 Tel: 301 347 0119 Fax 301 347 0101 Email: [email protected]
April 2009
Word Count: 4321
Number of Figures and Tables: 11
Key Words: Transit Planning, Probe Vehicle, Transit Operation, Run Time, Travel Time
Please reference as: El-Geneidy, A., Hourdos, J., & Horning, J. (2009). Bus transit service planning and operations in a competitive environment. Journal of Public Transportation,12(3) 39-59.
Ahmed M. El-Geneidy, John Hourdos and Jessica Horning
Bus transit service planning and operations in a competitive environment
ABSTRACT
Transit services are currently facing several challenges in the United States and around the
world. For many reasons, among which the fluctuations in gas prices and the state of the
economy are the major ones, transit demand has noticed a considerable increase. The challenge
that transit agencies are facing is to make these increases permanent by maintaining transits
competitive edge over private vehicle with more dense and reliable service. Current
methodologies for scheduling new as well as improving existing transit routes should be able to
respond to the dynamic nature of urban traffic as it is evolving through ITS and more
comprehensive traffic management strategies. In this research paper we correlate travel time
obtained from buses to travel time obtained from floating vehicles, in the Twin Cities
Metropolitan region. This research helps in introducing more reliable estimates of travel time for
planning new and competitive transit services. Specifically, this work studies two bus routes over
a variety of different roadway types and traffic conditions and produced statistical models that
can estimate travel time based on measurements collected from buses and regular vehicle probes.
The generated models revealed the characteristics causing bus service to be generally slower.
Altering bus route characteristics can reduce overall travel time and minimize the travel time
disparity between buses and private vehicles. In particular, the models presented in this paper
lend support to bus only shoulder policies, stop consolidation, serving major streets with fewer
stop signs and implementation of smart transit signal priority.
Ahmed M. El-Geneidy, John Hourdos and Jessica Horning
INTRODUCTION
Transit services are facing several challenges around the world, even more in the United
States. In recent days transit demand has noticed an increase, which some researcher relate to the
increase in gas prices. For such surge in demand to become permanent, transit agencies need to
manage their systems strategically and offer a service that can be competitive to private vehicles.
A competitive service, to private vehicles, is possible when a reliable service to passengers is
present. A reliable service to a passenger is the service that can be easily accessed at origin and
destination, arrives on time, has a short travel time/run time (similar or better than private vehicle
travel time), and has low variance in travel time and accordingly have short waiting time (Furth
& Muller, 2006, 2007; Koenig, 1980; Murray & Wu, 2003; Turnquist, 1978; Welding, 1957).
Achieving such service requires expanding the existing transit operations with routes following
realistic schedules that a bus can adhere to, in addition to improving the existing service in
several aspects. Schedulers mainly rely on utilizing software that is designed based on
operations research methods to introduce schedules for new bus services. Such software takes
into account the expected operating environment. Unfortunately, a generic solution in transit
planning based on optimization is not the best way to go and always requires some kind of
tuning. Some transit agencies utilize floating vehicles driving along corridors where new routes
are planned. The vehicles are used to estimate travel time and compare it to schedules generated
from optimization software prior to implementation of new service. Doing so without having an
accurate understanding of the differences between floating cars and real bus service makes the
outputs questionable. Currently, several agencies are looking forward towards more

Ahmed M. El-Geneidy, John Hourdos and Jessica Horning
implementations of faster services such as limited, express, and Bus Rapid Transit (BRT)
services. By implementing these services transit agencies try to compete with private vehicles
towards attracting more choice riders (Krizek & El-Geneidy, 2007). Implementing any of these
services require a full understanding of the operating environment. In this research paper we
correlate travel time obtained from buses to travel time obtained from floating vehicles, in the
Twin Cities Metropolitan region. This research helps in introducing more reliable estimates of
travel time for planning new and competitive transit services. Previous research concentrating on
relating travel time between buses and floating vehicles along corridors used visualizations and
simple statistics (Bertini & Tantiyanugulchai, 2004). They concentrated mainly on the use of
transit vehicles as probes to estimate corridor travel time for system wide implementation,
although this is not the focus of our study yet findings from our study can be used in a similar
manner as well. The main goal of this research is to better understand the factors affecting bus
travel time towards offering a competitive service to private vehicle in a highly complex
environment. In this research we analyze information from different roadway types (freeways,
arterials, and local streets) to uncover potential traffic flow related dependencies.
Literature review
Travel / Run time
Travel time, or run time, is the amount of time it takes for a bus to travel along its route
or along a specified segment. Abkowitz and Engelstein (1984) found that mean run time is
affected by route length, passenger activity, and number of signalized intersections. Most
researchers agree on the basic factors affecting bus run times (Abkowitz & Engelstein, 1983;

Ahmed M. El-Geneidy, John Hourdos and Jessica Horning
Abkowitz & Tozzi, 1987; Guenthner & Sinha, 1983; Levinson, 1983; Strathman, et al., 2000).
Table 1 contains a summary of known factors affecting run times.
Table 1: Factors affecting transit travel times Variables Description Distance Segment length Intersections Number of signalized intersections Bus stops Number of bus stops Boarding Number of passenger boardings Alighting Number of passenger alightings Time Time period Driver Driver experience Period of service How long the driver has been on service in the study period Departure delay Observed departure time minus scheduled Stop delay time Time lost in stops based on bus configuration (low floor etc.) Nonrecurring events Lift usage, bridge opening etc. Direction Inbound or outbound service Weather Weather related conditions Road Road characteristics
Since buses travel with regular traffic, they are affected by the overall dynamics of the
transportation system, where changes occur on both regular (i.e. peak hour traffic congestion)
and random (i.e. road construction, accidents, special events) bases. These changes influence the
amount of time it takes for a bus to travel from one stop to another and the level of service it
provides to passengers. Street characteristic is another major element affecting the bus travel
time. For example in the Twin Cities region buses are allowed to use the highway shoulders
when the speed along the main lanes drops below 35 miles/hour. Buses can drive as fast as 15
miles/hour faster than the regular traffic sitting in the congested lanes. Yet they cannot exceed
the 35 miles/hour threshold. These special privileges that buses have along the Twin Cities
highway system makes estimating their travel time through regular practices difficult. It also

Ahmed M. El-Geneidy, John Hourdos and Jessica Horning
gives buses an advantage over regular vehicles in terms of speed. Accordingly, relating travel
time from buses in the Twin Cities to floating vehicle can reveal new opportunities for other
agencies around the world.
DATA
The goal of this research is to relate bus travel time to floating cars along a transit
corridor in the Twin Cities Metropolitan Area. This relation helps in introducing more reliable
estimates of travel time for planning new and competitive transit service along the specified
corridor. In addition, it can work as a base for adjusting new bus schedules when compared to
floating vehicles. The Minnesota Valley Transit Authority (MVTA), which is a relatively small
suburban transit provider in the Twin Cities region, is currently planning to expand its service
and upgrade levels of service along the Cedar Avenue. The Cedar Avenue corridor is planned to
incorporate a BRT system in addition to the current regular service. MVTA data collection is
currently limited to semi-annual manual passenger counts and several TrackStick brand Global
Positioning System (GPS) units.
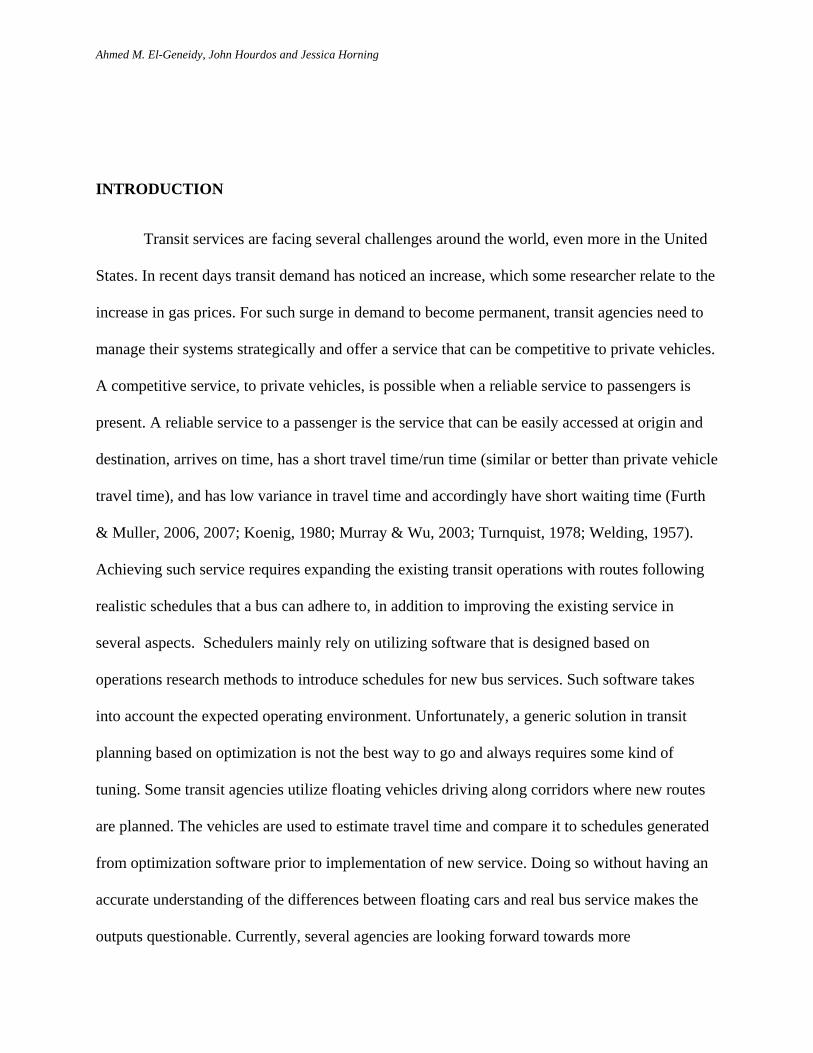
To determine current travel times along the study corridor, the research team collected
travel time data from two MVTA bus routes serving the Cedar Avenue corridor, Routes 442 and
444, shown in Figure 1. Route 442 is a commuter route that runs south along Cedar Avenue and
Highway 77. Of all of the existing MVTA bus routes, Route 442 most closely resembles the
service that will be provided by the Cedar Avenue BRT. Route 444 is also primarily a commuter
route running south along Cedar Avenue and Highway 77. However, after crossing the
Minnesota River, Route 444 turns westward and travels along Highway 13 and several
residential streets. Route 444 was chosen for data collection in order to construct comparisons
between car and bus travel times on freeways, arterials, and local streets.
Ahmed M. El-Geneidy, John Hourdos and Jessica Horning
Figure 1: Studied Routes
Travel time data for buses on these routes were collected using QStarz brand GPS data
loggers provided by the research team and several TrackStick brand GPS units owned by

Ahmed M. El-Geneidy, John Hourdos and Jessica Horning
MVTA. MVTA’s existing GPS units were programmed to take a data point at regular time
intervals - approximately every 7 seconds - so the research team programmed the QStarz units to
record points at the same interval. The research team collected data from buses running on
Route 444 during the month of October 2007. Due to contractor issues, data collection on Route
442 was delayed until the following spring. The research team collected data from buses running
on this route during the months of March and April 2008. During the fall data collection period
no major weather issues were present that might had an effect on travel time. Data from spring
days with inclement weather (i.e., snow storms) were removed from the analysis.
Travel time data for private vehicles on Routes 442 and 444 were collected during the
same time periods using probe vehicles equipped with QStarz GPS units. The research team
recruited student volunteers to drive their personal vehicles along each studied transit route.
Students were instructed to leave the first station on the route at the same time as a bus and to
drive at the speed of traffic until they reached the end of the route.
In order to establish the relationship between travel times for buses and private vehicles
in the study area, each bus trip was matched with a probe vehicle trip that departed at
approximately the same time. After cleaning and matching the car and bus data, this data
collection effort resulted in a sample of 290 matched trips (145 probe vehicle trips matched to
145 bus trips). This sample represents 132 matched trips on Route 442 and 178 matched trips on
Route 444. These trips were distributed throughout the day during AM, PM, and off peak
periods.
Using these data, it is possible to determine travel times along transit routes.
Unfortunately, it is not possible to accurately determine when buses make stops to serve
passengers. Many of the stops along Routes 442 and 444 are located on the nearside of

Ahmed M. El-Geneidy, John Hourdos and Jessica Horning
signalized or high traffic intersections. Due to this combination of stop placement and the small
amount of passenger activity at most stops (one passenger boarding or alighting at non-park &
ride stops) it is not possible to distinguish actual passenger stops from regular traffic stops.
Methodology
In order to determine current travel times along the studied corridor and examine the
relationship between travel times for personal vehicles and buses, the research team used two
levels of analysis. This paper first presents a comparison of travel times for different vehicle
types along Routes 442 and 444 as a whole. It then presents a comparison of travel times for
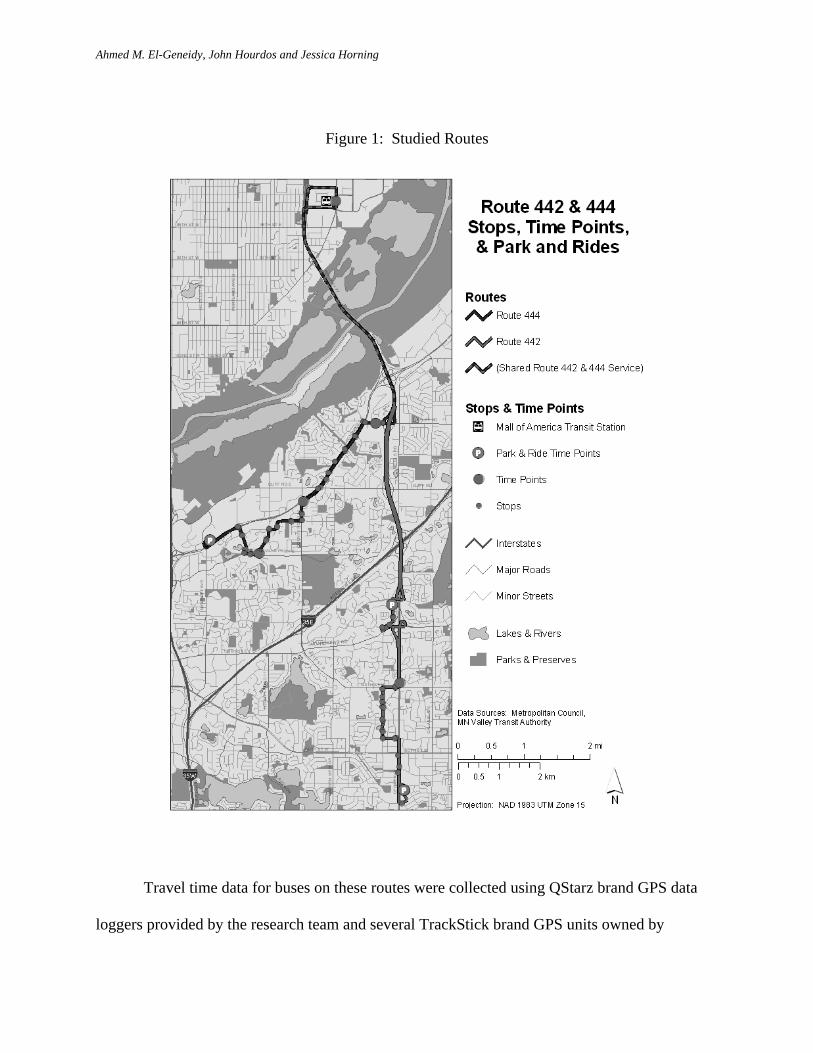
different vehicle types along smaller route segments. Routes 442 and 444 provide service to a
variety of areas and travel along different types of roads. In order to evaluate the impact of these
different route characteristics on bus and private vehicle travel time, the research team divided
the two routes into smaller segments with similar attributes (i.e. speed, travel direction, road
classification, etc.) for analysis. Figure 2 illustrates these segments.
Ahmed M. El-Geneidy, John Hourdos and Jessica Horning
Figure 2: Route 442 & 444 Analysis Segments
Using travel time data for the routes and the analysis segments, the research team
conducted basic statistical analyses to determine travel time patterns. We also used paired t-tests
to examine the relationship between car and bus run times. Using only the data for the analysis
segments, the research team estimated two different multivariate regression models to determine
the influence of various route characteristics on travel time for both buses and private vehicles.
The specifications of the models are shown below:
(1) Run time = f (northbound, AM, PM, length, freeway, vehicle, signals, stop signs, bus
stops, ramp meters)

Ahmed M. El-Geneidy, John Hourdos and Jessica Horning
(2) Natural Log of Difference between Car and Bus Run time = f (northbound, AM, PM,
length, freeway, county road, signals, bus stops, meters, route)
The first model examines the factors contributing to travel time for probe vehicles and
buses along analysis segments. The covariates in the regressions represent the most theoretically
relevant variables included in empirical studies of this type. A dummy variable for whether each
vehicle is a bus or probe is included in this model. Several variables such as number of traffic
signals and bus stops are also included to control for operating environment. Run time is
expected be less for private vehicles relative to buses. Run time is also expected to be less for
vehicles traveling on freeway segments relative to vehicles traveling on arterials or residential
streets. It is expected to increase with the number of possible stops in a segment, number of
traffic signals, number of stop signs, and length of the segment. Vehicles traveling during AM
or PM peak hours are expected to have longer run times relative to vehicles traveling during off
peak hours.

Ahmed M. El-Geneidy, John Hourdos and Jessica Horning
Table 2: Variable Descriptions Variable Description Run time The run time along an analysis segment (see Figure 2)
LN Difference Run time The natural log of the difference between run times for a private vehicle and bus traveling on the same analysis segment during the same time of day.
Northbound (Traveling Towards Downtown)
A dummy variable that equals one if the car or bus is traveling northbound (towards downtown Minneapolis).
AM Peak A dummy variable that equals one if the observed car or bus trip started during the AM peak.
PM Peak A dummy variable that equals one if the observed car or bus trip started during the PM peak.
Length of Segment The length of the analysis segment in kilometers.
Freeway A dummy variable that equals one if the car or bus is traveling on a freeway segment (no stops and a speed limit of 60 mph).
County Road A dummy variable that equals one if the car or bus is traveling on an arterial or county road segment (signalized stops and a speed limit of 40 mph)
Vehicle A dummy variable that equals one if the observed vehicle is a car.
# of Traffic Signals The number of traffic signals located on the analysis segment.
# of Stop Signs The number of stop signs located on the analysis segment.
# of Bus Stops The number of bus stops located on the analysis segment. This variable includes all possible bus stops, not the number of stops actually made.
# of Ramp Meters The number of active ramp meters located on the analysis segment. This variable is equal to zero for all off peak observations.
Route A dummy variable that equals one if the observed trip is along the Route 442.
The second model evaluates the impact of different route characteristics on the difference
between run time for buses and private vehicles. The difference in run time equals the run time
for a private vehicle along a segment minus the run time for a bus traveling along the same
segment at the same time of day. The dependent variable for this model is the natural log of the
difference in run times. This functional form not only helps linearize a nonlinear relationship but

Ahmed M. El-Geneidy, John Hourdos and Jessica Horning
it also gives us a quite useful interpretation for the coefficients of the independent variables. As
a result, the coefficients in this model can be interpreted as the percent change in the difference
in run times that results from a one-unit increase in the independent variable. For this model, the
research team hypothesized that the same relationships exist with the independent variables, with
the exception that the AM and PM peak variables may have negative coefficients because buses
may use shoulder lanes in some areas to bypass congested traffic. If the numbers of bus stops and
traffic signals have significant positive coefficients in both of these models, it is an indication
that providing BRT service with consolidated stops and ITS improvements such as signal
priority will lead to significant run time savings. Table 2 describes each of the dependent and
independent variables used in the models.
TRAVEL TIME ANALYSIS
Route Travel time Analysis
Using travel time data for the routes, the research team conducted basic statistical
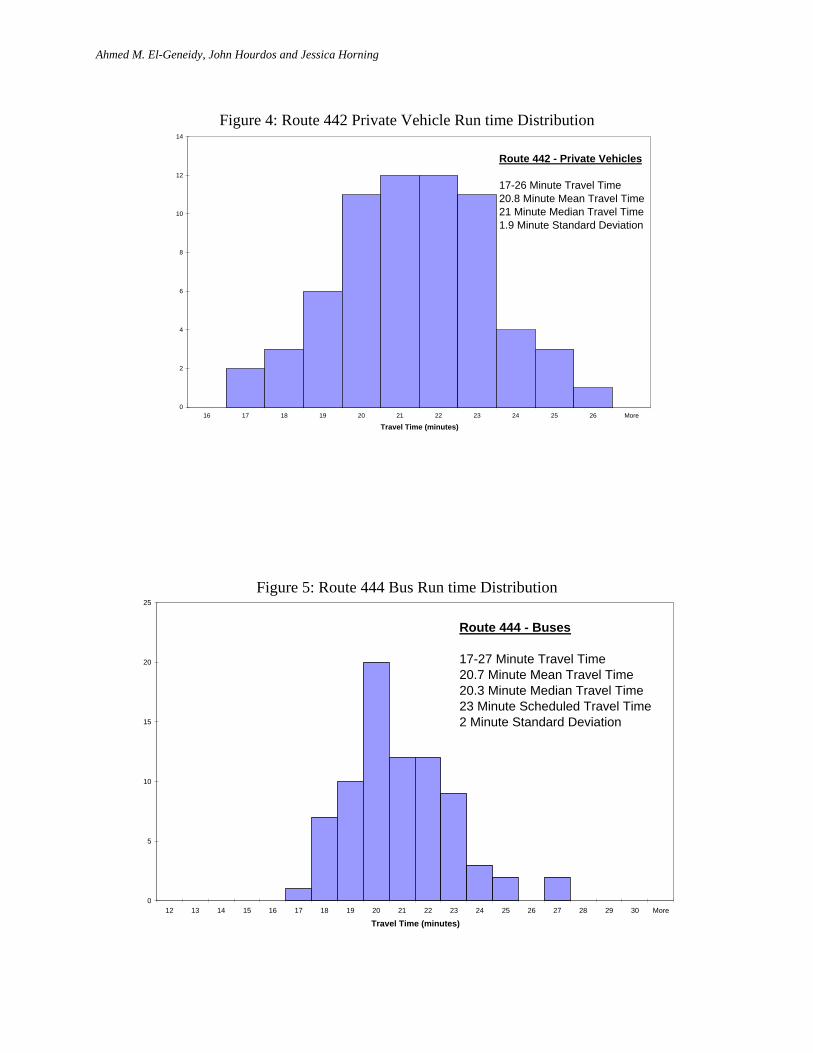
analyses to determine run time patterns. Figures 3 - 6 show the run time distributions for buses
and private vehicles on Routes 442 and 444. For the 132 matched trips on Route 442 run time
for buses ranged from 21 to 42 minutes. Run time for private vehicles on this route ranged from
17 to 26 minutes with a median value of 21 minutes. The standard deviation of personal vehicle
run times is, not surprisingly, smaller than the standard deviation for buses. This clearly
indicates that bus run time is subjected to higher variation. The median observed run time for
buses is 3.6 minutes longer than that for personal vehicles.
For the 178 matched trips on Route 444, run time for buses ranged from 17 to 27 minutes
with a median value of 20.3 minutes. Run time for private vehicles on this route ranged from 13

Ahmed M. El-Geneidy, John Hourdos and Jessica Horning
to 24 minutes. The standard deviation of personal vehicle run times on this route is slightly
larger than the standard deviation for buses. This indicates a lower variation in running time
along the bus route, which can be related mainly to the length of the route. However, it is again
the case that the median observed run time for personal vehicles is equal to the minimum
observed run time for buses. The difference between median observed run times for buses and
personal vehicles on this route is almost the same as that found for Route 442. This fact suggests
that the route type, residential or arterial, does not affect the relationship between bus and private
vehicle travel times. The median run time for buses on this route is 3.5 minutes longer than that
for personal vehicles. Since this finding need to be validated statistically, a detailed statistical
analysis is presented in the following section.
Figure 3: Route 442 Bus Run time Distribution
0
2
4
6
8
10
12
14
16
15 16 17 18 19 20 21 22 23 24 25 26 27 28 29 30 31 32 33 34 35 More
Travel Time (minutes)
Route 442 - Buses
21-42 Minute Travel Time24.8 Minute Mean Travel Time24.6 Minute Median Travel Time25 Minute Scheduled Travel Time3 Minute Standard Deviation
Ahmed M. El-Geneidy, John Hourdos and Jessica Horning
Figure 4: Route 442 Private Vehicle Run time Distribution
0
2
4
6
8
10
12
14
16 17 18 19 20 21 22 23 24 25 26 More
Travel Time (minutes)
Route 442 - Private Vehicles
17-26 Minute Travel Time20.8 Minute Mean Travel Time21 Minute Median Travel Time1.9 Minute Standard Deviation
Figure 5: Route 444 Bus Run time Distribution
0
5
10
15
20
25
12 13 14 15 16 17 18 19 20 21 22 23 24 25 26 27 28 29 30 More
Travel Time (minutes)
Route 444 - Buses
17-27 Minute Travel Time20.7 Minute Mean Travel Time20.3 Minute Median Travel Time23 Minute Scheduled Travel Time2 Minute Standard Deviation

Ahmed M. El-Geneidy, John Hourdos and Jessica Horning
Figure 6: Route 444 Private Vehicle Run time Distribution
0
2
4
6
8
10
12
14
16
18
20
11 12 13 14 15 16 17 18 19 20 21 22 23 24 25 26
Travel Time (minutes)
Route 444 - Private Vehicles
13 - 24 Minute Travel Time17.1 Minute Mean Travel Time16.8 Minute Median Travel Time 2.3 Minute Standard Deviation
Statistical Analysis
Paired T-Tests
After examining the distributions of run times, the research team used paired t-tests to
examine the relationship between car and bus run times along routes and route segments. Table
3 presents the results of each of the t-test comparisons. Both of the route level comparisons are
significant at the 99% level of confidence. At the route level, the mean difference between run
times for buses and private vehicles is 3.98 minutes for Route 442 and 3.59 minutes for Route
444. The difference in bus and car run times at the route level ranges from 3.08 to 4.87 minutes
for Route 442 and from 2.91 to 4.26 minutes for Route 444. This statistical analysis indicates
that for the bus service to be competitive along either one of the studied routes it needs a certain
amount of travel time savings ranging from 2.91 to 4.87 minutes.
Ahmed M. El-Geneidy, John Hourdos and Jessica Horning
Table 3: Paired T-Test Comparisons Road
Type Mean Difference (minutes)
95% Confidence Interval of the Difference
t Sig.
Lower Upper Route 442 Route -3.98 -4.87 -3.08 -8.87 .000 Route 444 Route -3.59 -4.26 -2.91 -10.56 .000 All Segments - -0.52 -0.59 -0.45 -13.95 .000 Segment 1 Local Street -0.74 -1.13 -0.35 -3.81 .000 Segment 2 Freeway -0.91 -1.45 -0.36 -3.32 .002 Segment 3 Local Street -0.40 -0.82 0.02 -1.95 .059 Segment 4 Arterial -0.48 -0.60 -0.36 -8.33 .000 Segment 5 Local Street -0.46 -0.75 -0.16 -3.06 .003 Segment 6 Arterial -0.38 -0.93 0.17 -1.40 .171 Segment 7 Arterial -0.60 -0.92 -0.28 -3.85 .001 Segment 8 Local Street -0.89 -1.13 -0.65 -7.43 .000 Segment 9 Arterial -0.22 -0.37 -0.07 -2.93 .007 Segment 10 Local Street -0.59 -0.88 -0.31 -4.30 .000 Segment 11 Arterial -0.08 -0.14 -0.03 -3.11 .003 Segment 12 Local Street -0.35 -0.68 -0.02 -2.10 .040 Segment 13 Freeway -0.05 -0.22 0.13 -0.55 .586 Segment 14 Arterial -1.53 -1.83 -1.12 -10.19 .000 Segment 15 Local Street -0.85 -1.05 -0.66 -8.57 .000 Segment 16 Local Street -0.35 -0.56 -0.13 -3.19 .002 Segment 17 Arterial -0.11 -0.32 0.10 -1.029 .307 Segment 18 Local Street 0.23 -0.03 0.48 1.79 .080 Segment 19 Local Street -0.83 -1.18 -0.48 -4.83 .000
All but three of the t-tests conducted at the route segment level are significant at the 90%
level of confidence. Segments 6 and 13 are mainly the first two segments in each route, while
segment 13 is part of a 2.5 miles segment along highway 77. Observing the statistical output can
help in identifying the sections where improvements in run time are needed and can lead to
substantial saving and in making the transit service a competitive one. The second step is to
understand the built environment along the selected corridors and the effects of each variable on
run time to help in maximizing the savings in run time.
Ahmed M. El-Geneidy, John Hourdos and Jessica Horning
Regression Models
Using only the data for the analysis segments, the research team estimated two
multivariate regression models to determine the influence of various route characteristics on
travel time for both buses and private vehicles. The first model examines the factors contributing
to travel time for probe vehicles and buses along analysis segments. In this model observed run
time (in seconds) along a route segment is used as the dependent variable. Table 4 shows the
output for this model. Note that statistically significant variables are in bold.
Table 4: Run time Model
Independent Variables B t
(Constant) 20.06 4.77 ***
Traveling towards Downtown -10.75 -4.22 ***
AM Peak 11.26 3.51 ***
PM Peak 17.02 5.22 ***
Length of Segment 37.51 26.24 ***
Traveling on Freeway -11.04 -1.15
Vehicle is a Car -30.27 -12.28 ***
# of Traffic Signals 25.85 25.25 ***
# of Stop Signs 15.80 7.42 ***
# of Possible Bus Stops 8.70 13.05 ***
# of Ramp Meters -6.42 -1.66 *
Adjusted R-square: 0.69
N: 2,138
Dependent Variable: Segment Run time (seconds) * Significant at the 90% level; *** significant at the 99% level
This model has an R-square of 0.69 with all variables having a statistically significant
effect on run time except for the freeway variable. In addition, all variables in the model have
the expected sign and follow transit operation theory. For example, run time increases by 37.51
seconds for each kilometer a vehicle must travel. Relative to run times during off peak hours,

Ahmed M. El-Geneidy, John Hourdos and Jessica Horning
run time along each segment increase by 11.26 seconds during the AM peak and 17.02 seconds
during the PM peak, holding all else constant.
For each traffic signal on a route segment run time increases by 25.85 seconds. There are
currently 8 traffic signals located on the Cedar Avenue corridor that the planned service will pass
through. If transit signal priority (TSP) is provided at these lights for buses, this would lead to a
3.4 minute run time savings. Each stop sign on a route segment increases run time by 15.8
seconds. By running straight down the Cedar Avenue corridor and avoiding residential areas
with stop signs currently served by Route 442, the bus service will gain additional travel time
savings. Route 442 currently travels through 4 stop signs, which add just over a minute to the
route’s run time. Similarly, each possible bus stop along a route segment increases run time by
8.7 seconds, whether the bus actually stops to serve passengers or not.1 By consolidating bus
stops and cutting the number of possible stops along Cedar Avenue in half, the bus will achieve
more run time reductions. The 20 possible stops along Route 442 currently account for 2.7
minutes of each bus’s run time. The Cedar Avenue limited or BRT, alternatively, will serve a
longer segment of the corridor with only 10 possible stops, adding only 1.35 minutes to each
bus’s travel time.
Variables in this model with a negative effect on run time are direction of travel, number
of ramp meters, traveling on the freeway, and traveling in a car. All else held constant,
northbound trips have a 10.75 second shorter run time on each route segment. Each ramp meter
reduces run time by 6.42 seconds. As expected, type of vehicle has the largest negative impact
1 Unfortunately, using the data collected by handheld GPS units taking points at regular time (as opposed to distance) intervals, it was not possible for the research team to determine when buses actually stopped to serve passengers. In future research, the number of actual stops made as well as the number of possible stops should be included as variables in this model.

Ahmed M. El-Geneidy, John Hourdos and Jessica Horning
on travel time. On each route segment private vehicles have a 30.27 second shorter travel time
than buses. Route 442 is divided into 8 segments southbound and 9 segments northbound, which
translates into a 4 minute shorter travel time for cars traveling south and 4 ½ minute shorter
travel time for cars traveling north relative to buses, all else being equal. This difference can be
easily minimized if the City and the transit agency implemented some of the above mentioned
strategies for travel time savings.
The second model evaluates the impact of different route characteristics on the difference
between run time for buses and private vehicles. The dependent variable for this model is the
natural log of the difference in run times. As a result, the coefficients in this model can be
interpreted as the percent change in the difference in run times that results from a one-unit
increase in the independent variable. Table 5 shows the outputs of this model.
This model has an R-square of 0.18 with the majority of variables having a statistically
significant impact on the log of the difference between bus and car run times. Again, the
variables in this model have the expected signs and follow transit operation theory. The
difference between car and bus run times is 18% greater during the AM peak hours relative to off
peak hours, all else held constant. For each additional kilometer traveled, the difference between
car and bus run times increases by 16%. Each traffic signal increases the run time difference by
19% due to buses’ slower acceleration time and other factors. For each possible stop the
difference in run time increases by 3%, whether the bus stops or not. The small magnitude of
this variable could be because of the large number of possible stops and small number of actual
stops being made on the studied routes. Alternatively, some of the impact of stops may be
attributed to traffic signals in this model due to the prevalence of stops located on the nearside of
signalized intersections along the Cedar corridor. Regardless, these results show that

Ahmed M. El-Geneidy, John Hourdos and Jessica Horning
consolidating bus stops and implementing TSP as part of the Cedar Avenue corridor will help to
reduce the travel time disparity between buses and private vehicles in the region and increase the
attractiveness of transit service.
Table 5: Run time Difference Model
Independent Variables B t
(Constant) -0.99 -9.20 ***
Traveling towards Downtown -0.21 -3.01 ***
AM Peak 0.18 1.98 **
PM Peak -0.08 -0.86
Length of Segment 0.16 3.78 ***
Traveling on Freeway -1.07 -3.46 ***
Traveling on County Road -0.08 -0.84
# of Traffic Signals 0.19 7.04 ***
# of Possible Bus Stops 0.03 1.93 **
# of Ramp Meters 0.04 0.28
Route 442 -0.08 -1.03
Adjusted R-square: 0.18
N: 762
Dependent Variable: Natural Log of Difference between Car and Bus Run time
* Significant at the 90% level; ** significant at the 95% level; and
*** significant at the 99% level
Several factors have a statistically significant negative impact on the difference between
run times for private vehicles and buses. The difference between car and bus run times is 21%
less for northbound trips heading towards downtown Minneapolis. On freeway route segments
buses actually had a shorter travel time than personal vehicles on average, all else being equal.
Ahmed M. El-Geneidy, John Hourdos and Jessica Horning
This is likely due to the fact that buses can bypass congested traffic and ramp queues on freeway
segments of the Cedar Avenue corridor by using bus only shoulder lanes.
CONCLUSIONS/RECOMMENDATIONS
The analysis presented in this paper highlights several issues related to the Cedar Avenue
transit corridor in particular and to transit planning in general. This research has evaluated
conditions along the Cedar Avenue corridor that will influence bus and private vehicle travel
time. It has also outlined an innovative approach for estimating travel time for new transit lines
based on GPS data collected by probe vehicles. The statistical analyses utilized in this research
were conducted at two levels: the route level and the route segment level. The research team’s
analysis of route level travel time patterns shows that Cedar Avenue corridor buses have greater
variation in their run times than vehicles. However, for both of the studied routes the median
travel time for private vehicles was equal to the minimum travel time for buses. The difference
between median car and bus travel times for both routes was approximately 3.5 minutes.
The analysis of route segment level data provides a more detailed understanding of the
relationship between vehicle type, route characteristics, and run time. While personal vehicles
have an inherent travel time advantage over buses under existing conditions on the Cedar
Avenue corridor (and most major arterials), our analysis shows that altering route characteristics
can reduce overall travel time and minimize the travel time disparity between buses and cars. In
particular, the models presented in this paper lend support to bus stop consolidation and
implementation of transit signal priority along the Cedar Avenue corridor. Providing transit
signal priority at the eight traffic signals currently located on the corridor would reduce bus
travel time by 4 minutes for southbound trips and 4 ½ minutes for northbound trips. This

Ahmed M. El-Geneidy, John Hourdos and Jessica Horning
strategy would also eliminate the travel time advantage of private vehicles over buses on the
corridor, according to our second model. Reducing the number of possible bus stops between
from 20 to 7, will remove an additional 1.7 minutes from the current bus travel time along this
section of the corridor. Bus only shoulder policies seem to have a great effect on the
competiveness of transit vehicles over regular cars, accordingly it is recommended to use this
policy in other regions and when running bus service along congested freeway corridors. Finally,
by running straight down the Cedar Avenue corridor and avoiding smaller, local streets, the bus
will save an additional 1 minute in travel time that is currently spend at stop signs. In addition to
these travel time savings, remaining on the main corridor where there are freeway-like conditions
will help to reduce the difference between travel time for buses and personal vehicles even more.
Under these conditions, travel time via BRT running along this corridor would be approximately
2.5 minutes shorter than median run time via personal vehicle. This travel time would increase
the amenity value of the BRT, attract ridership, and help to ensure the competitiveness of this
transit line.
In conclusion, it should be noted that the analyses presented in this paper are based on a
very limited run time dataset collected using handheld GPS units. This project was adapted to
focus on the Cedar Avenue corridor and a new methodology was developed to predict travel time
for a transit provider with no existing ITS data collection systems. Due to the placement of
many MVTA bus stops on the nearside of signalized intersections the research team was not able
to determine when actual passenger stops were being made. Also, budgetary restrictions
prevented MVTA or the research team from being able to collect passenger counts for the entire
study period. It is recommended that MVTA should implement an AVL and APC system.

Ahmed M. El-Geneidy, John Hourdos and Jessica Horning
Future research should ensure to budget for passenger counts for the entire study period.
The number of possible stops and actual should be included in the future to better model the
effects of bus stop consolidations. Other data that should be included in these models and may be
available from transit agencies with more advanced ITS systems include: smart card use, lift use,
bus-only shoulder use, etc.
ACKNOWLEDGMENT
This research was funded through Hennepin County, Minnesota, accordingly acknowledgements
should be given to Robb Luckow and Larry Blackstad from the office on Hennepin County
Community Works & Transit. The authors would like to express their appreciation to Michael
Abegg from MVTA for his support in collecting the data. Also acknowledgments should be
given to the students who volunteered to drive the probe vehicles. We would like to thank the
Minnesota Traffic Observatory who supported this research and provided the adequate facilities
for conducting the analysis. Finally the authors would like to thank the three anonymous
reviewers for their feedback on the earlier version of the manuscript.
REFERENCES
Abkowitz, M., & Engelstein, I. (1983). Factors affecting running time on transit routes.
Transportation Research Part A, 17(2), 107-113.
Abkowitz, M., & Engelstein, I. (1984). Methods for maintaining transit service regularity.
Transportation Research Record, 961, 1-8.
Abkowitz, M., & Tozzi, J. (1987). Research contributing to managing transit service reliability.
Journal of Advanced Transportation, 21(spring), 47-65.

Ahmed M. El-Geneidy, John Hourdos and Jessica Horning
Bertini, R., & Tantiyanugulchai, S. (2004). Transit buses as traffic probes: Use of geolocation
data for empirical evaluation. Transportation Research Record(1870), 35-45.
Furth, P., & Muller, T. (2006). Service reliability and hidden waiting time: Insights from
automatic vehicle location data. Transportation Research Record, 1955, 79-87.
Furth, P., & Muller, T. (2007). Service reliability and optimal running time schedules. Paper
presented at the Transportation Research Board 86th Annual Meeting.
Guenthner, R. P., & Sinha, K. C. (1983). Modeling bus delays due to passengers boardings and
alightings. Transportation Research Record, 915, 7-13.
Koenig, J. G. (1980). Indicators of urban accessibility: Theory and application. Transportation,
9, 145-172.
Krizek, K. J., & El-Geneidy, A. M. (2007). Segmenting preferences and habits of transit users
and non-users. Journal of Public Transportation, 10(3), 71-94.
Levinson, H. (1983). Analyzing transit travel time performance. Transportation Research
Record, 915, 1-6.
Murray, A., & Wu, X. (2003). Accessibility tradeoffs in public transit planning. [Article].
Journal of Geographical Systems, 5(1), 93-107.
Strathman, J. G., Dueker, K. J., Kimpel, T. J., Gerhart, R. L., Turner, K., Taylor, P., et al. (2000).
Service reliability impacts of computer-aided dispatching and automatic location
technology: A Tri-Met case study. Transportation Quarterly, 54(3), 85-102.
Turnquist, M. (1978). A model for investigating the effect of service frequency and reliability on
bus passenger waiting times. Transportation Research Record, 1978, 70-73.
Welding, P. I. (1957). The instability of a close-interval service. Operational Research
Quarterly, 8(3), 133-142.

Ahmed M. El-Geneidy, John Hourdos and Jessica Horning
BIOGRAPHICAL SKETCH
Ahmed El-Geneidy
Ahmed is an Assistant Professor at McGill University, Quebec, Canada. His research interests
include land use and transportation planning, transit operations and planning, travel behaviour
analysis including both motorized (Auto and Transit) and non-motorized (Bicycle and
pedestrian) modes of transportation, travel behaviour of disadvantaged populations (seniors and
people with disabilities) and measurements of accessibility and mobility in urban contexts.
John Hourdos
John is the director of the Minnesota Traffic Observatory, at the department of Civil
Engineering, University of Minnesota, Minnesota, USA. His research focuses on microscopic
simulation, traffic model calibration, incident detection and prevention. Recently, in
collaboration with the ITS Institute he designed, assembled, and deployed an array of advanced
Traffic Detection and Surveillance Stations in the highest freeway accident area in the Twin
Cities.
Jessica Horning
Is a transportation planner at Cambridge Systematics, Bethesda, MD, USA. Jessica has a Masters
degree from the University of Minnesota in Urban Planning. Jessica’s research interest includes

Ahmed M. El-Geneidy, John Hourdos and Jessica Horning
land use and transportation planning, transit planning and operations and active transportation
especially cycling.