Embed Size (px)
Citation preview
Bus User Survey 2008
07094 January 2009
TABLE OF CONTENTS
1 EXECUTIVE SUMMARY .................................................................................................... 4
2 INTRODUCTION ................................................................................................................ 6
2.1 BACKGROUND ........................................................................................................... 6 2.2 RESEARCH OBJECTIVES ......................................................................................... 7
3 METHODOLOGY ............................................................................................................... 8
3.1 INTRODUCTION ......................................................................................................... 8 3.2 SAMPLE SELECTION ................................................................................................. 8 3.3 OVERVIEW OF FIELDWORK ..................................................................................... 8 3.4 PILOT .......................................................................................................................... 9 3.5 QUESTIONNAIRE ....................................................................................................... 9 3.6 COMPLETION RATES ................................................................................................ 9 3.7 DATA EDITING ............................................................................................................ 9 3.8 WEIGHTING .............................................................................................................. 10
4 FINDINGS: PASSENGER CHARACTERISTICS ............................................................ 11
4.1 KEY FINDINGS ......................................................................................................... 11 4.2 GENDER ................................................................................................................... 12 4.3 AGE ........................................................................................................................... 14 4.4 EMPLOYMENT ......................................................................................................... 19 4.5 OCCUPATION OF CHIEF INCOME EARNER .......................................................... 21 4.6 ETHNICITY ................................................................................................................ 23 4.7 PHYSICAL AND MENTAL DISABILITIES ................................................................. 28 4.8 WHEELCHAIR USERS ............................................................................................. 31 4.9 HOME LOCATION ..................................................................................................... 32
5 FINDINGS: JOURNEY CHARACTERISTICS .................................................................. 34
5.1 KEY FINDINGS ......................................................................................................... 34 5.2 DAY OF WEEK .......................................................................................................... 35 5.3 SHIFT TIME BAND .................................................................................................... 37 5.4 MAIN JOURNEY PURPOSE ..................................................................................... 38 5.5 ACCESS MODE ........................................................................................................ 44 5.6 EGRESS MODE ........................................................................................................ 46 5.7 ROUTE TYPE ............................................................................................................ 48 5.8 BUS TYPE ................................................................................................................. 50
6 FINDINGS: TICKET INFORMATION ............................................................................... 54
6.1 KEY FINDINGS ......................................................................................................... 54 6.2 TICKET TYPE ............................................................................................................ 55 6.3 TICKET TYPE (GROUPED) ...................................................................................... 56
7 FINDINGS: TRAVEL BEHAVIOUR ................................................................................. 58
7.1 KEY FINDINGS ......................................................................................................... 58 7.2 FREQUENCY OF USE: BUS ROUTE SURVEYED ON ............................................. 59 7.3 FREQUENCY OF USE: ANY LONDON BUS ............................................................ 61 7.4 FREQUENCY OF USE: ANY LONDON NIGHT BUS ................................................ 65 7.5 FREQUENCY OF USE: UNDERGROUND/DLR ....................................................... 66 7.6 FREQUENCY OF USE: MAINLINE TRAIN ................................................................ 68 7.7 HOUSEHOLD CAR(S) ............................................................................................... 70 7.8 ACCESS TO A CAR FOR THIS JOURNEY ............................................................... 73 7.9 FREQUENCY OF USE: CAR/VAN ............................................................................ 76
8 FINDINGS: AREA ANALYSIS ......................................................................................... 79
8.1 DAY BUS USAGE BY RESIDENCE .......................................................................... 79 8.2 NIGHT BUS USAGE BY RESIDENCE ...................................................................... 80
9 FINDINGS: COMPARISONS WITH 1999 ........................................................................ 83
9.1 KEY FINDINGS ......................................................................................................... 83 9.2 GENDER: 1999 TO 2008 ........................................................................................... 83 9.3 AGE: 1999 TO 2008 ................................................................................................... 85 9.4 EMPLOYMENT STATUS: 1999 TO 2008 .................................................................. 85 9.5 TICKET TYPE (GROUPED): 1999 TO 2008 .............................................................. 86 9.6 FREQUENCY OF USE OF ANY LONDON BUS: 1999 TO 2008 ............................... 87 9.7 MAIN JOURNEY PURPOSE: 1999 TO 2008 ............................................................. 88
10 APPENDICES ............................................................................................................... 90
10.1 APPENDIX A: QUESTIONNAIRE .............................................................................. 90 10.2 APPENDIX B: COMPLETION RATES ....................................................................... 91
CONFIDENTIALITY
Please note that the copyright in the attached report is owned by TfL and the provision of information under Freedom of Information Act does not give the recipient a right to re-use the information in a way that would infringe copyright (for example, by publishing and issuing copies to the public).
Brief extracts of the material may be reproduced under the fair dealing provisions of the Copyright, Designs and Patents Act 1988 for the purposes of research for non-commercial purposes, private study, criticism, review and news reporting.
Details of the arrangements for reusing the material owned by TfL for any other purpose can be obtained by contacting us at [email protected].
Research conducted by Research International
1 EXECUTIVE SUMMARY
Please note that, although comparisons have been made between the demographics of bus passengers and those of the London resident population, bus passengers in London include 11% who are not residents of London (13% among night bus passengers).
As is true of the London population, day bus passengers are slightly more likely to be female than male. By contrast, the majority of night bus passengers (65%) are male. These figures have not changed since the previous wave of the Bus User Survey took place in 2003.
Contrary to the popular image, older people are less likely to be bus passengers than other age groups. People aged 60 or older make up 16% of Londoners, but make up only 10% of day bus passengers and 1% of night bus passengers. There has been a slight decline in the percentage of people aged over 70 taking day buses (from 5% of 2003 passengers to 4% in 2008). Generally speaking, people aged 55 or over continue to use night buses very little – just 3% of the night service passengers fall into this age category compared with 21% of the London population.
Bus passengers are now less likely to be white British or white Irish than they have been in the past. The figures are 33% (down from 41% in 2003) for day bus passengers and 24% (down from 26%) for night bus passengers. Day bus passengers of a white other background have increased by three percentage points to 19% (though the proportion of night bus passengers who are white other has decreased by two percentage points to 31%). The percentage of Londoners who are white British or white Irish is 61%.1
The percentage of passengers who live in a household where the head is in a high, intermediate or junior managerial position (this approximates to ABC1 households) is 57% on day services and 55% on night services. Although this is not directly comparable (as the information is collected differently) the percentage of Londoners who are classified as ABC1 is 55%,suggesting that bus passengers are not primarily those on lower incomes, but are representative of the profile of Londoners.
London bus passengers are less likely to have a mental or physical disability (9% of day passengers and 8% of night passengers) than the London population as a whole, 15% of whom classify themselves as disabled in some way.2 As a context, the London Travel Demand Survey shows that Londoners who have a mental or physical disability are less likely to travel in the capital on any given day (65%) than those who do not have a disability (87%).
During the day white passengers are equally likely to take a bus to work as black, Asian and minority ethnic (BAME) passengers (both at 49%). However, BAME passengers are more likely to take a night bus to work (52%) than white passengers (44%). Meanwhile, white passengers are more than twice as likely to use a night bus for leisure (31%) as BAME passengers (15%).
Around a quarter of bus passengers now use Oyster ‘Pay As You Go’ (PAYG) (24% of day bus passengers and 28% of night bus passengers) and this has clearly led to the fall in the use of cash – now used by only 2% of day bus passengers and by 3% of night bus passengers. This is 1 London ethnicity figures are taken from Office for National Statistics 2006 population projections based on
census 2001 figures. 2 London disability figures are derived from answers to Q13 of the census 2001: ‘do you have any long-term
illness, health problem or disability which limits your daily activities or the work you can do?’
consistent with findings from the Greater London Bus Passenger Survey which shows that 1.7% of bus passengers use a cash to pay for their fare.3
There has also been a decline in the use of bus passes to 17% for day bus passengers (down from 46% 2003) and 18% for night bus passengers (down from 44% in 2003); this has coincided with an increase in the use of Travelcards to 35% among day bus passengers (up from 22% in 2003) and 43% among night bus passengers (up from 34% in 2003).
Bus passengers make far more use of the London Underground and Docklands Light Railway (DLR) than they did five years ago. Just under a third (31%) of day bus passengers and 44% of night bus passengers are frequent users of the London Underground/DLR. The 2003 figures were 20% and 33% for day and night bus passengers, respectively. The usage of mainline trains has also increased slightly among bus passengers, though not dramatically so.
Broadly speaking, passengers who live in inner or central London travel by bus more often than residents of outer London. On average, residents of the Kingston area travel by bus least whilst residents in postcode areas beginning with SE are the most frequent bus users. However, for night buses, frequent users are as likely to come from areas north of the centre.
Just under half of day bus passengers come from a household that owns a car, however only a third of night bus passengers are from car-owning households. Regarding mode choice, nearly a quarter of day bus passengers had access to car which they could have used instead of taking the bus to make their trip.
CHANGES SINCE 1999 Below are some comparisons over all three waves of BUS (1999, 2003 and 2008). These comparisons refer to day bus passengers only as these are the only available figures from 1999.
Perhaps the most noticeable trend over the last nine years has been the change in the age profile of bus passengers. The last three waves of BUS have seen an increase in the percentage of passengers aged between 25 and 45 years old (from 37% to 45%). During the same period, the percentage of passengers aged over 60 has halved from 20% to 10%. Related to this, the employment profile of bus passengers has also seen some changes over the last nine years - the percentage of retired passengers is now 7%, down from 9% in 2003 and 15% in 1999.
Following TfL fares policy changes, there has been a dramatic fall over the last nine years in the number of cash and saver tickets being used by bus passengers; the current figure is 3%. Bus passes (17%) and Freedom Passes (8%) are also used less than they were during previous waves of the survey. The new Oyster Pay As You Go is now used by 24% of day bus passengers and by 28% of night bus passengers.
3 Greater London Bus Passenger Survey Quarter 71 Report published by MVA
2 INTRODUCTION
2.1 BACKGROUND
The Bus User Survey (BUS 2008) is a research study commissioned by Transport for London to establish and understand the profile of London bus passengers. It also provides details of their travel behaviour, including the purpose of their journeys and access and egress modes.
The key aim of the study, as stipulated in the brief, is to provide market information on bus passenger journeys in terms of demographics such as age, gender, ethnicity, employment status, purpose of journey and ticket used. The study is a repeat of previous surveys conducted in 1999 and 2003. The 1999 survey was conducted in the spring and did not include night buses, as these were sampled in a separate study in 1996, namely the Night Bus Services Customer Profile Research.
The BUS 2008 covers a large and representative sample of people using buses within London. However, the sample does not include those travelling on mobility buses, Dial-a-Ride buses, school buses and any buses operated under non-standard contracts; these were all excluded in the 2003 and the 2008 samples. It is worth noting that in 2003 Routemasters, which were still in mainstream circulation, were sampled in 16 day shifts. This year we made a decision not to sample Routemasters, which now operate exclusively on heritage routes.
As part of the 2008 survey Research International has re-weighted the 2003 data, and this report provides a direct comparison between the 2003 and 2008 results where applicable. An additional section compares key findings between all three waves of the Bus User Survey: 1999, 2003 and 2008.
2.2 RESEARCH OBJECTIVES
The key objective of BUS is to determine the profile of passengers who use bus services in London, in terms of the characteristics of their journeys and demographics. According to the project brief, the specific objectives are:
1. to determine the profile of bus passengers who board buses at bus stops within the M25 (the profile information required includes characteristics and purpose of journey, demographics, ticket purchased, age, gender, ethnicity, employment status, occupation of chief income earner and disabilities);
2. to identify passengers’ access modes to and egress modes from the bus they were being surveyed on;
3. to establish how frequently the bus services were used; and
4. to determine differences in the profile of bus users by time of day (including nights) and day of week (including weekends).
3 METHODOLOGY
3.1 INTRODUCTION
The 2008 Bus User Survey was conducted using a self-completion questionnaire, which was distributed to all passengers boarding the bus routes sampled. Full details of all aspects of the survey methodology can be found in the technical report, also produced by Research International.
3.2 SAMPLE SELECTION
The survey sample of 600 shifts (450 day and 150 night) was selected on the basis of the peak vehicle requirement (PVR), a proxy for the number of vehicles on each route. This allowed the length of the route and the frequency of buses to be taken into account when selecting the target sample. It was vital for the sampling procedure used in 2008 to replicate that of 2003 to ensure that the two surveys could be compared. Please refer to the technical report for further details on sampling.
3.3 OVERVIEW OF FIELDWORK
The key facts regarding the fieldwork of the Bus User Survey 2008 are as follows:
• The main fieldwork took place between Tuesday May 6th and Thursday July 24th 2008 before school summer holidays.
• 450 day shifts and 150 night shifts were sampled. All shifts were satisfactorily completed on time and to schedule.
• All day shifts lasted three hours and all night shifts five hours.
• 350 unique routes were sampled and completed out of the 575 routes which were eligible for sampling.
• Shifts were carried out by teams of fieldworkers on sampled buses. These teams distributed questionnaires and pens to all passengers boarding the bus and collected the completed questionnaires from all passengers as they alighted.
• The survey methodology closely resembled that of previous waves of BUS. One change was the use of five fieldworkers on shifts taking place on busy articulated buses. Less busy articulated buses were assigned teams of three fieldworkers and all other shifts were assigned two.
• All questionnaires were given serial numbers at the printing stage, and distributed in such a way that the names and numbers of the bus stops where all passengers boarded and alighted could be recorded.
3.4 PILOT
Before the main fieldwork period began a pilot study was conducted to test both the questionnaire and the survey methodology. A number of changes were made to the 2003 questionnaire to adapt it for the 2008 survey; TfL was also keen to monitor the impact of these changes on response rates. Overall response rates for the 2008 survey were closely comparable to those of previous waves of the survey.
3.5 QUESTIONNAIRE
In the 2008 wave of the survey one questionnaire was used for all shifts. This was a departure from the two separate questionnaires used for day and night shifts in 2003. A copy of the 2008 questionnaire is attached as Appendix A.
In summary, the differences between the 2003 and 2008 questionnaire are:
• the removal of 2003 Q6: ‘Do you have a transport photocard for London?’;
• the addition of Q12: ‘Do you ever need to use a wheelchair when travelling in London?’; and
• the addition of Q15: ‘Which of the following best describes the occupation of the chief income- earner in your household?’
3.6 COMPLETION RATES
71,484 questionnaires were distributed across 600 completed shifts and 67,548 were returned: an overall response rate of 94.5%. Overall completion rates varied by question; the highest was Q1 (journey purpose - 86.00%) and the lowest was Q6c (frequency of use of any London night bus - 36.47%). Broadly speaking, completion rates were slightly higher during day shifts than they were during night shifts. Please see Appendix B for a full breakdown of completion rates by question number.
3.7 DATA EDITING
Owing to the fact that respondents completed the questionnaires without supervision, it was necessary to apply a range of validation checks to the data before analysis. These checks were designed to ensure that illogical answers were removed from the database, and to provide a single code variable for any questions for which the data entry system allowed multicode answers. The main checks were:
• All questionnaires without a valid answer to Q1 (journey purpose) were removed from the dataset for the purpose of analysis, as was done in the 2003 wave of the survey.
• A number of data checks were carried out on the questionnaire data to ensure that all answers were logical. These were based on responses to Q1 (journey purpose), Q2 (age) and Q4 (employment status). Please see the BUS 2008 Technical Report for a detailed explanation of all checks.
• 3,515 ‘other’ answers were recoded back to closed codes by RI in consultation with TfL.
3.8 WEIGHTING
Following data entry, weighting was applied to questionnaires to account for variance in the achieved sample compared with the targeted sample. Responses within each stratum4 were measured against the target responses on the basis of the following three factors:
• shifts sampled in each stratum compared with the target sample shifts in each stratum;
• shifts completed in each stratum compared with shifts sampled in each stratum; and
• the response rate in each stratum compared with the overall response rate.
The multiplication of these factors resulted in a weight for each of the 75 strata. The stratum weight was then applied to every case in that given stratum. Finally, the weights of every case in the dataset were averaged to 1.00 in order to maintain a base size that would be comparable with the original unweighted dataset.
Two weights were applied to the dataset; one each within day and night shifts and one comparing the overall dataset across day and night shifts. Please see the technical report for a further explanation of the weighting process.
4 Each shift is classified into a stratum based on three factors: day, timeband and geography. For a detailed
breakdown of each stratum please refer to the BUS Technical Report.
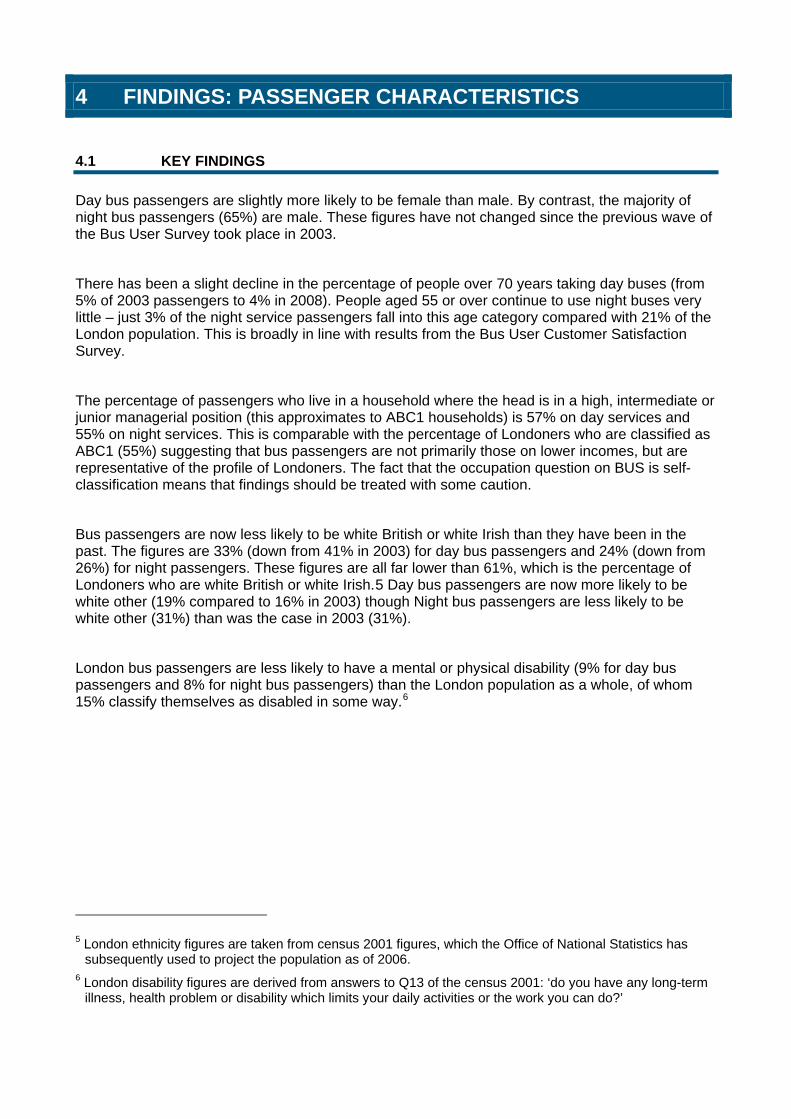
4 FINDINGS: PASSENGER CHARACTERISTICS
4.1 KEY FINDINGS
Day bus passengers are slightly more likely to be female than male. By contrast, the majority of night bus passengers (65%) are male. These figures have not changed since the previous wave of the Bus User Survey took place in 2003.
There has been a slight decline in the percentage of people over 70 years taking day buses (from 5% of 2003 passengers to 4% in 2008). People aged 55 or over continue to use night buses very little – just 3% of the night service passengers fall into this age category compared with 21% of the London population. This is broadly in line with results from the Bus User Customer Satisfaction Survey.
The percentage of passengers who live in a household where the head is in a high, intermediate or junior managerial position (this approximates to ABC1 households) is 57% on day services and 55% on night services. This is comparable with the percentage of Londoners who are classified as ABC1 (55%) suggesting that bus passengers are not primarily those on lower incomes, but are representative of the profile of Londoners. The fact that the occupation question on BUS is self-classification means that findings should be treated with some caution.
Bus passengers are now less likely to be white British or white Irish than they have been in the past. The figures are 33% (down from 41% in 2003) for day bus passengers and 24% (down from 26%) for night passengers. These figures are all far lower than 61%, which is the percentage of Londoners who are white British or white Irish.5 Day bus passengers are now more likely to be white other (19% compared to 16% in 2003) though Night bus passengers are less likely to be white other (31%) than was the case in 2003 (31%).
London bus passengers are less likely to have a mental or physical disability (9% for day bus passengers and 8% for night bus passengers) than the London population as a whole, of whom 15% classify themselves as disabled in some way.6
5 London ethnicity figures are taken from census 2001 figures, which the Office of National Statistics has
subsequently used to project the population as of 2006. 6 London disability figures are derived from answers to Q13 of the census 2001: ‘do you have any long-term
illness, health problem or disability which limits your daily activities or the work you can do?’
4.2 GENDER
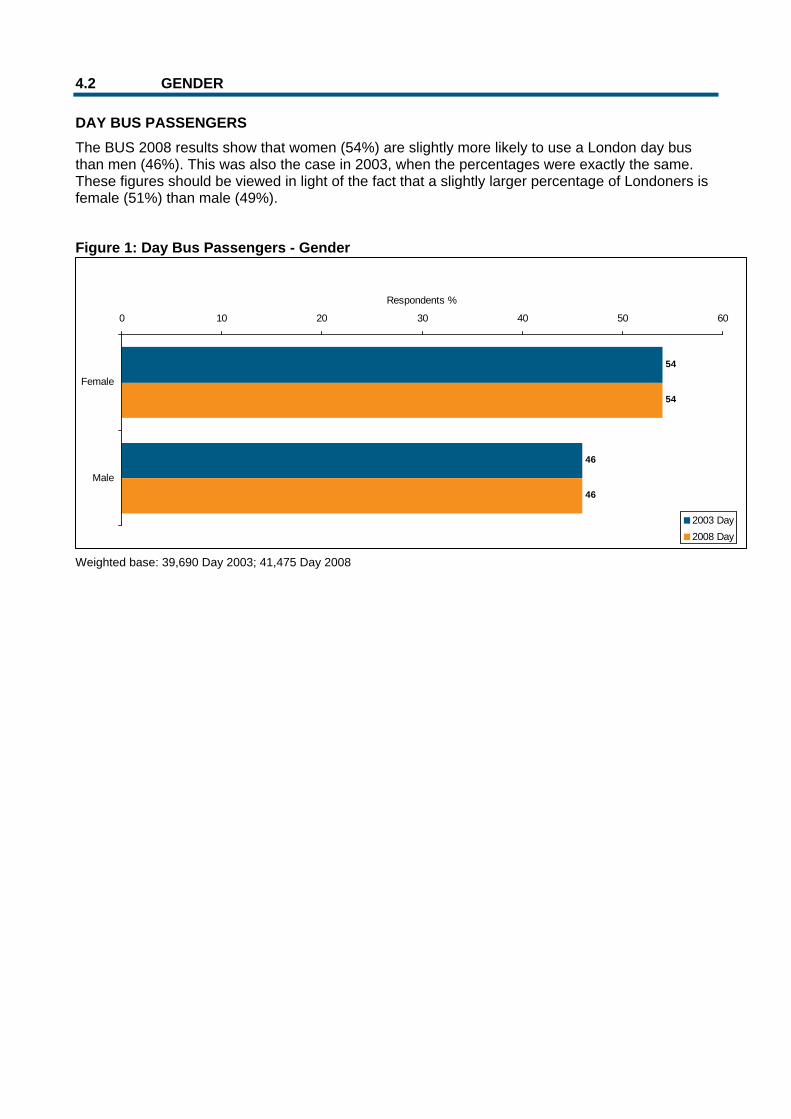
DAY BUS PASSENGERS The BUS 2008 results show that women (54%) are slightly more likely to use a London day bus than men (46%). This was also the case in 2003, when the percentages were exactly the same. These figures should be viewed in light of the fact that a slightly larger percentage of Londoners is female (51%) than male (49%).
Figure 1: Day Bus Passengers - Gender
Weighted base: 39,690 Day 2003; 41,475 Day 2008
54
46
54
46
0 10 20 30 40 50 60
Female
Male
Respondents %
2003 Day2008 Day
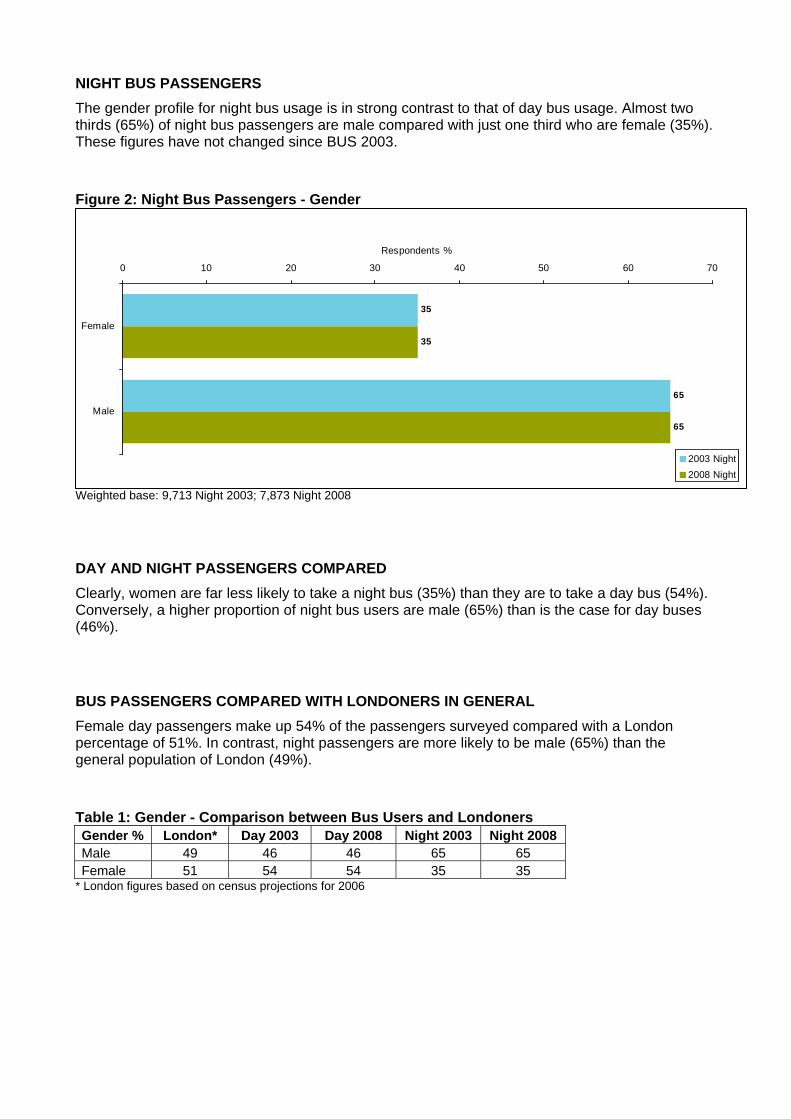
NIGHT BUS PASSENGERS The gender profile for night bus usage is in strong contrast to that of day bus usage. Almost two thirds (65%) of night bus passengers are male compared with just one third who are female (35%). These figures have not changed since BUS 2003.
Figure 2: Night Bus Passengers - Gender
Weighted base: 9,713 Night 2003; 7,873 Night 2008
DAY AND NIGHT PASSENGERS COMPARED Clearly, women are far less likely to take a night bus (35%) than they are to take a day bus (54%). Conversely, a higher proportion of night bus users are male (65%) than is the case for day buses (46%).
BUS PASSENGERS COMPARED WITH LONDONERS IN GENERAL
Female day passengers make up 54% of the passengers surveyed compared with a London percentage of 51%. In contrast, night passengers are more likely to be male (65%) than the general population of London (49%).
Table 1: Gender - Comparison between Bus Users and Londoners Gender % London* Day 2003 Day 2008 Night 2003 Night 2008 Male 49 46 46 65 65 Female 51 54 54 35 35
* London figures based on census projections for 2006
35
65
35
65
0 10 20 30 40 50 60 70
Female
Male
Respondents %
2003 Night2008 Night
4.3 AGE
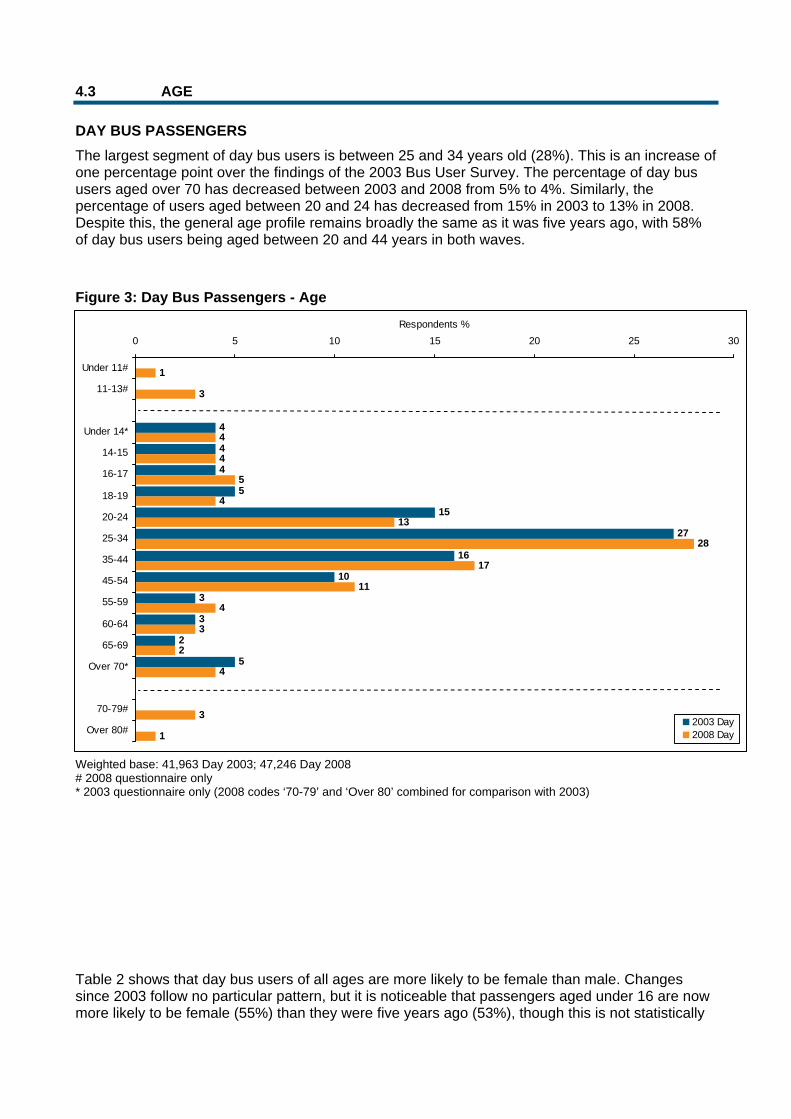
DAY BUS PASSENGERS The largest segment of day bus users is between 25 and 34 years old (28%). This is an increase of one percentage point over the findings of the 2003 Bus User Survey. The percentage of day bus users aged over 70 has decreased between 2003 and 2008 from 5% to 4%. Similarly, the percentage of users aged between 20 and 24 has decreased from 15% in 2003 to 13% in 2008. Despite this, the general age profile remains broadly the same as it was five years ago, with 58% of day bus users being aged between 20 and 44 years in both waves.
Figure 3: Day Bus Passengers - Age
Weighted base: 41,963 Day 2003; 47,246 Day 2008 # 2008 questionnaire only * 2003 questionnaire only (2008 codes ‘70-79’ and ‘Over 80’ combined for comparison with 2003)
Table 2 shows that day bus users of all ages are more likely to be female than male. Changes since 2003 follow no particular pattern, but it is noticeable that passengers aged under 16 are now more likely to be female (55%) than they were five years ago (53%), though this is not statistically
4
4
4
5
15
27
16
10
3
3
2
5
1
3
4
4
5
4
13
28
17
11
4
3
2
4
3
1
0 5 10 15 20 25 30
Under 11#
11-13#
Under 14*
14-15
16-17
18-19
20-24
25-34
35-44
45-54
55-59
60-64
65-69
Over 70*
70-79#
Over 80#
Respondents %
2003 Day2008 Day
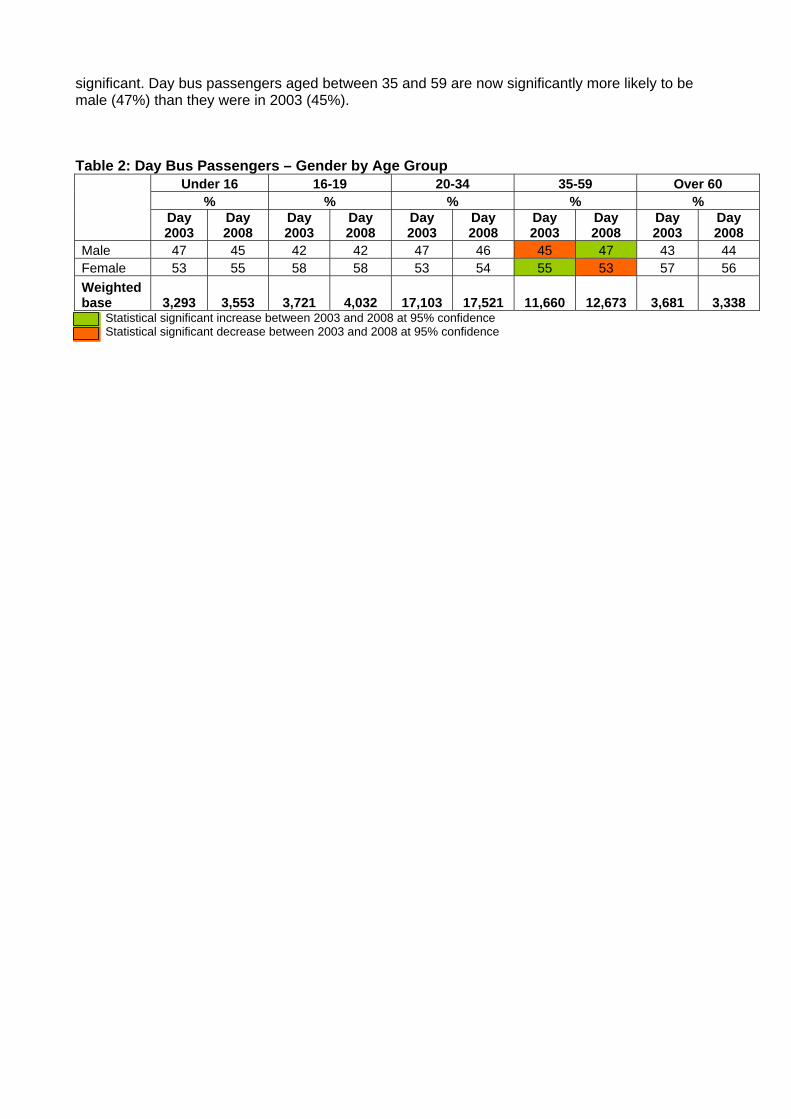
significant. Day bus passengers aged between 35 and 59 are now significantly more likely to be male (47%) than they were in 2003 (45%).
Table 2: Day Bus Passengers – Gender by Age Group
Under 16 16-19 20-34 35-59 Over 60 % % % % %
Day 2003
Day 2008
Day 2003
Day 2008
Day 2003
Day 2008
Day 2003
Day 2008
Day 2003
Day 2008
Male 47 45 42 42 47 46 45 47 43 44 Female 53 55 58 58 53 54 55 53 57 56 Weighted base 3,293 3,553 3,721 4,032 17,103 17,521 11,660 12,673 3,681 3,338
Statistical significant increase between 2003 and 2008 at 95% confidence Statistical significant decrease between 2003 and 2008 at 95% confidence
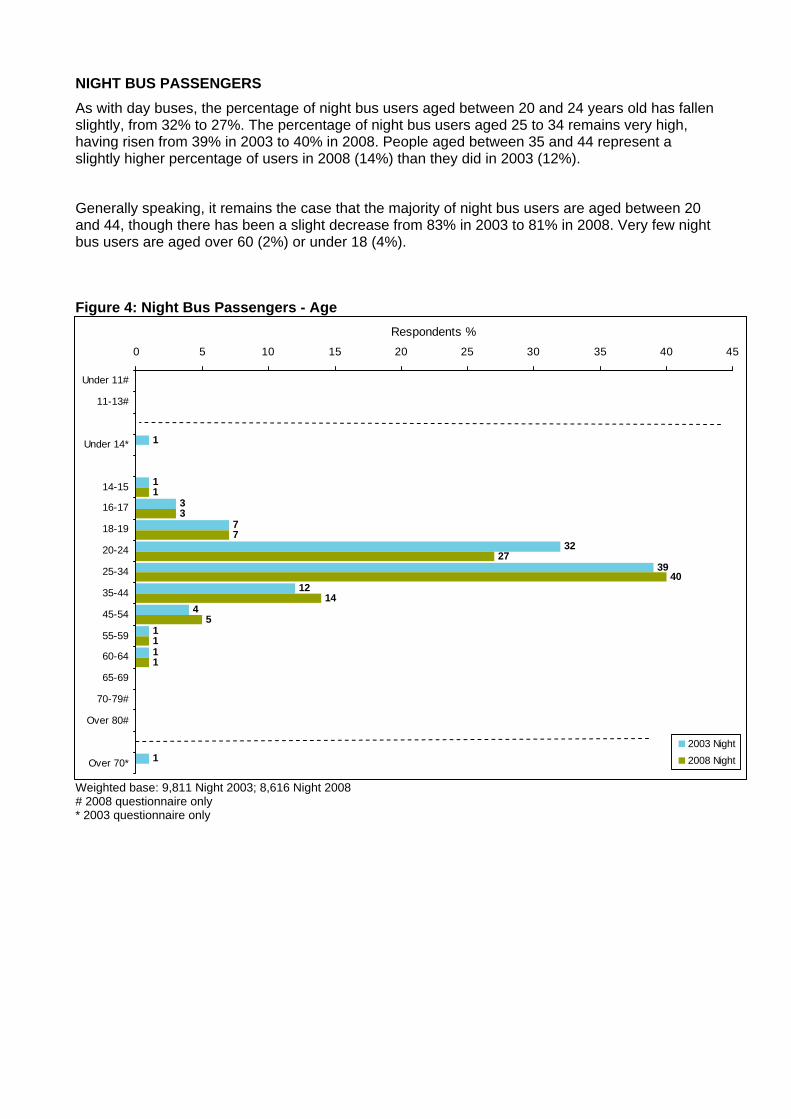
NIGHT BUS PASSENGERS As with day buses, the percentage of night bus users aged between 20 and 24 years old has fallen slightly, from 32% to 27%. The percentage of night bus users aged 25 to 34 remains very high, having risen from 39% in 2003 to 40% in 2008. People aged between 35 and 44 represent a slightly higher percentage of users in 2008 (14%) than they did in 2003 (12%).
Generally speaking, it remains the case that the majority of night bus users are aged between 20 and 44, though there has been a slight decrease from 83% in 2003 to 81% in 2008. Very few night bus users are aged over 60 (2%) or under 18 (4%).
Figure 4: Night Bus Passengers - Age
Weighted base: 9,811 Night 2003; 8,616 Night 2008 # 2008 questionnaire only * 2003 questionnaire only
1
1
3
7
32
39
12
4
1
1
1
1
3
7
40
14
5
1
1
27
0 5 10 15 20 25 30 35 40 45
Under 11#
11-13#
Under 14*
14-15
16-17
18-19
20-24
25-34
35-44
45-54
55-59
60-64
65-69
70-79#
Over 80#
Over 70*
Respondents %
2003 Night2008 Night

Table 3: Night Bus Passengers – Gender by Age Group
Under 16 16-19 20-34 35-59 Over 60 % % % % %
Night 2003
Night 2008
Night 2003
Night 2008
Night 2003
Night 2008
Night 2003
Night 2008
Night 2003
Night 2008
Male 47 47 56 57 64 64 75 76 73 71 Female 53 53 44 43 36 36 25 24 27 29 Weighted base 179 82 902 757 6,898 5,343 1,544 1,479 130 133
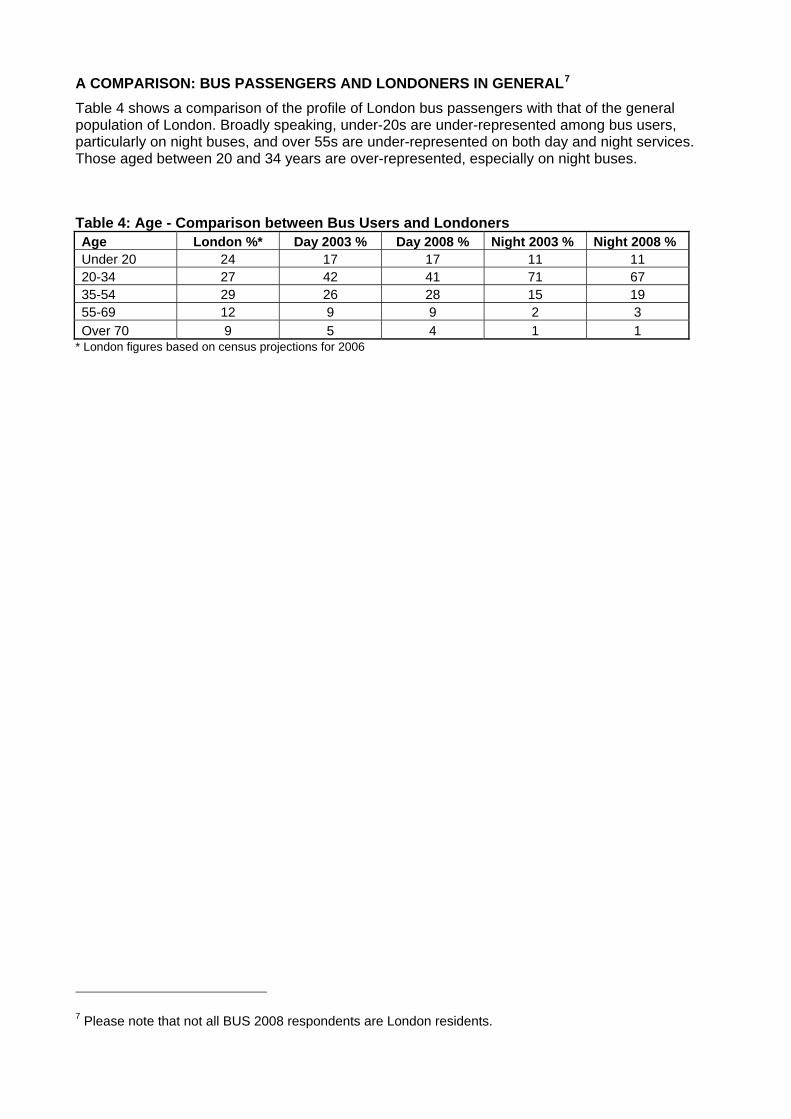
A COMPARISON: BUS PASSENGERS AND LONDONERS IN GENERAL7 Table 4 shows a comparison of the profile of London bus passengers with that of the general population of London. Broadly speaking, under-20s are under-represented among bus users, particularly on night buses, and over 55s are under-represented on both day and night services. Those aged between 20 and 34 years are over-represented, especially on night buses.
Table 4: Age - Comparison between Bus Users and Londoners Age London %* Day 2003 % Day 2008 % Night 2003 % Night 2008 % Under 20 24 17 17 11 11 20-34 27 42 41 71 67 35-54 29 26 28 15 19 55-69 12 9 9 2 3 Over 70 9 5 4 1 1
* London figures based on census projections for 2006
7 Please note that not all BUS 2008 respondents are London residents.
4.4 EMPLOYMENT
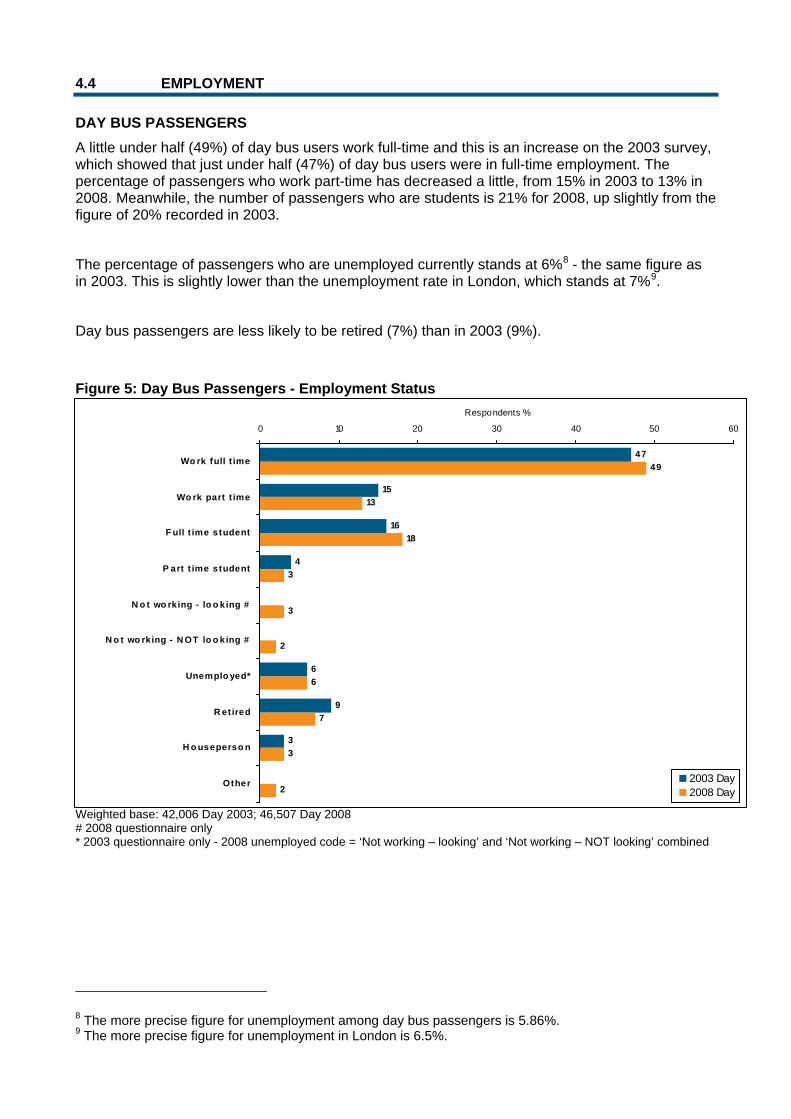
DAY BUS PASSENGERS A little under half (49%) of day bus users work full-time and this is an increase on the 2003 survey, which showed that just under half (47%) of day bus users were in full-time employment. The percentage of passengers who work part-time has decreased a little, from 15% in 2003 to 13% in 2008. Meanwhile, the number of passengers who are students is 21% for 2008, up slightly from the figure of 20% recorded in 2003.
The percentage of passengers who are unemployed currently stands at 6%8 - the same figure as in 2003. This is slightly lower than the unemployment rate in London, which stands at 7%9.
Day bus passengers are less likely to be retired (7%) than in 2003 (9%).
Figure 5: Day Bus Passengers - Employment Status
Weighted base: 42,006 Day 2003; 46,507 Day 2008 # 2008 questionnaire only * 2003 questionnaire only - 2008 unemployed code = ‘Not working – looking’ and ‘Not working – NOT looking’ combined
8 The more precise figure for unemployment among day bus passengers is 5.86%. 9 The more precise figure for unemployment in London is 6.5%.
47
15
16
4
6
9
3
49
13
18
3
3
6
7
2
3
2
0 10 20 30 40 50 60
Wo rk full t ime
Wo rk part t ime
F ull t ime student
P art t ime student
N o t wo rking - lo o king #
N o t wo rking - N OT lo o king #
Unemplo yed*
R etired
H o useperso n
Other
Respondents %
2003 Day2008 Day
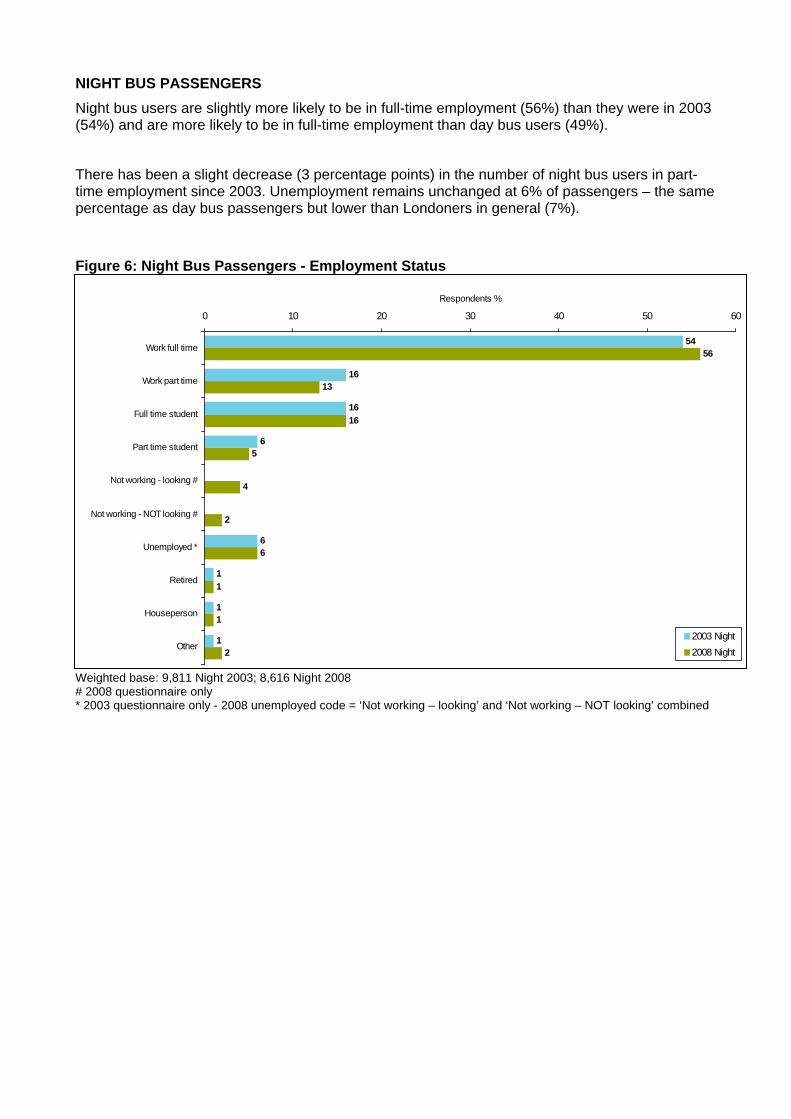
NIGHT BUS PASSENGERS Night bus users are slightly more likely to be in full-time employment (56%) than they were in 2003 (54%) and are more likely to be in full-time employment than day bus users (49%).
There has been a slight decrease (3 percentage points) in the number of night bus users in part-time employment since 2003. Unemployment remains unchanged at 6% of passengers – the same percentage as day bus passengers but lower than Londoners in general (7%).
Figure 6: Night Bus Passengers - Employment Status
Weighted base: 9,811 Night 2003; 8,616 Night 2008 # 2008 questionnaire only * 2003 questionnaire only - 2008 unemployed code = ‘Not working – looking’ and ‘Not working – NOT looking’ combined
54
16
16
6
6
1
1
1
56
13
16
5
4
2
6
1
1
2
0 10 20 30 40 50 60
Work full time
Work part time
Full time student
Part time student
Not working - looking #
Not working - NOT looking #
Unemployed *
Retired
Houseperson
Other
Respondents %
2003 Night2008 Night
4.5 OCCUPATION OF CHIEF INCOME EARNER
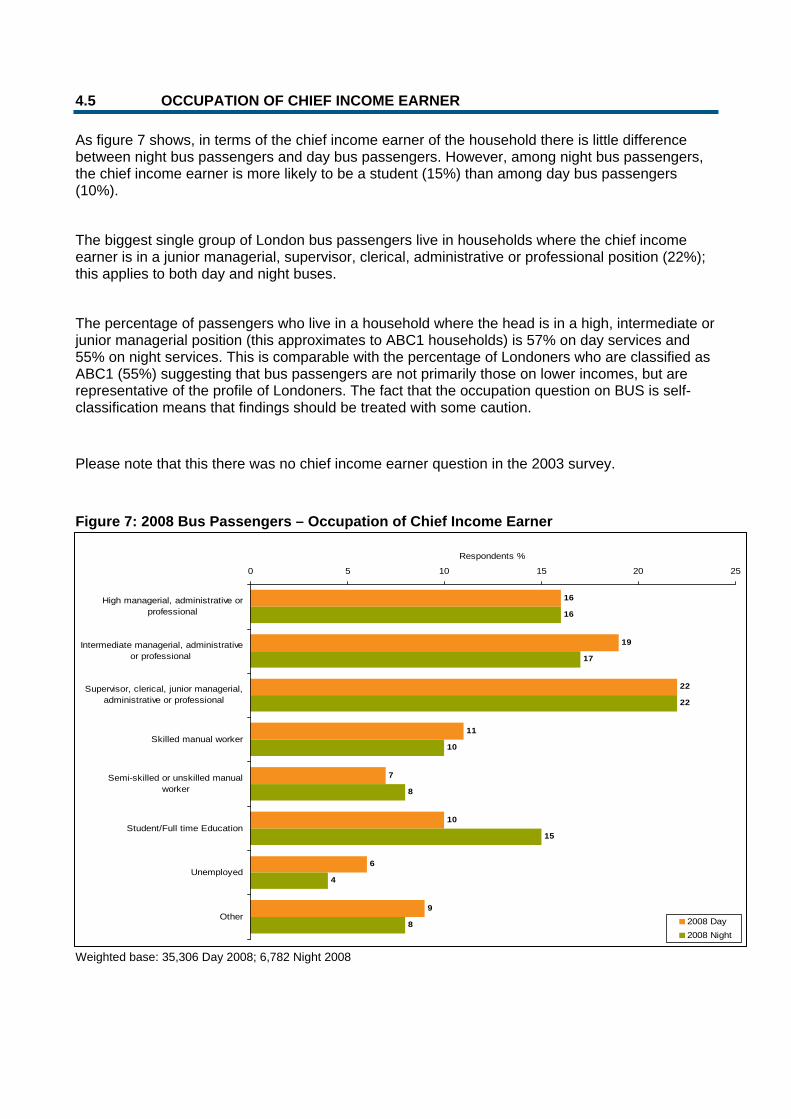
As figure 7 shows, in terms of the chief income earner of the household there is little difference between night bus passengers and day bus passengers. However, among night bus passengers, the chief income earner is more likely to be a student (15%) than among day bus passengers (10%).
The biggest single group of London bus passengers live in households where the chief income earner is in a junior managerial, supervisor, clerical, administrative or professional position (22%); this applies to both day and night buses.
The percentage of passengers who live in a household where the head is in a high, intermediate or junior managerial position (this approximates to ABC1 households) is 57% on day services and 55% on night services. This is comparable with the percentage of Londoners who are classified as ABC1 (55%) suggesting that bus passengers are not primarily those on lower incomes, but are representative of the profile of Londoners. The fact that the occupation question on BUS is self-classification means that findings should be treated with some caution.
Please note that this there was no chief income earner question in the 2003 survey.
Figure 7: 2008 Bus Passengers – Occupation of Chief Income Earner
Weighted base: 35,306 Day 2008; 6,782 Night 2008
16
19
22
11
7
10
6
9
16
17
22
10
8
15
4
8
0 5 10 15 20 25
High managerial, administrative orprofessional
Intermediate managerial, administrativeor professional
Supervisor, clerical, junior managerial,administrative or professional
Skilled manual worker
Semi-skilled or unskilled manualworker
Student/Full time Education
Unemployed
Other
Respondents %
2008 Day2008 Night
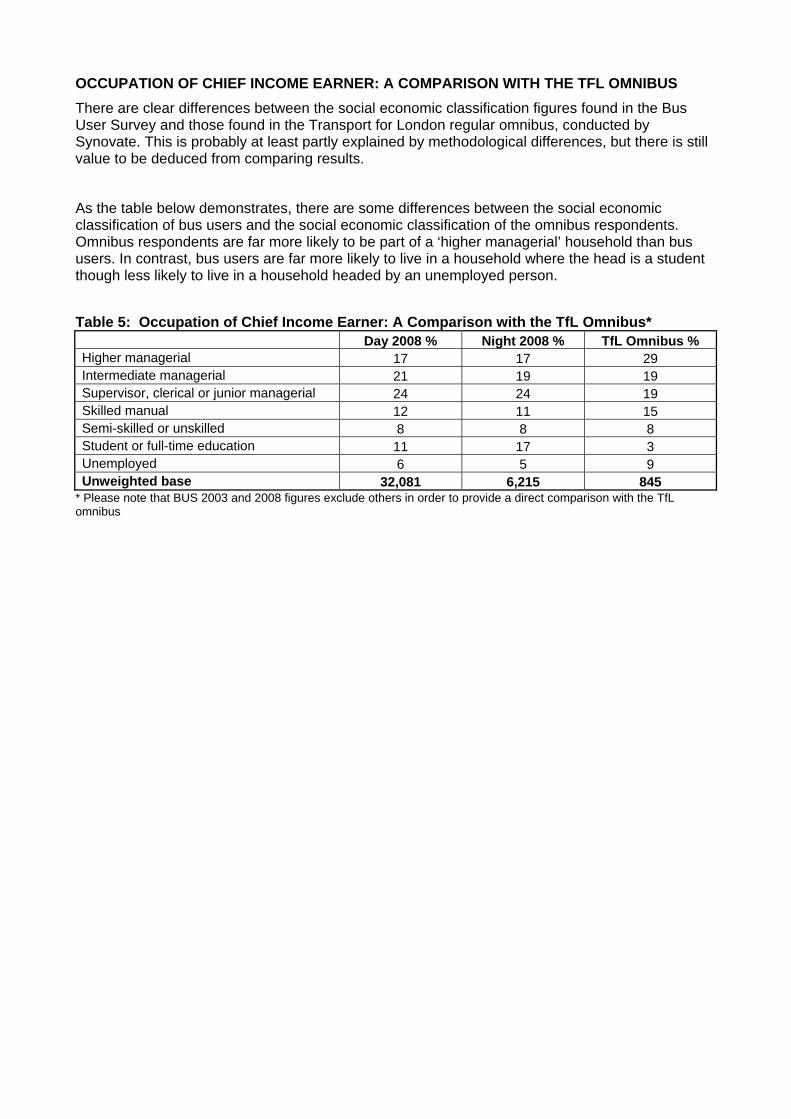
OCCUPATION OF CHIEF INCOME EARNER: A COMPARISON WITH THE TFL OMNIBUS There are clear differences between the social economic classification figures found in the Bus User Survey and those found in the Transport for London regular omnibus, conducted by Synovate. This is probably at least partly explained by methodological differences, but there is still value to be deduced from comparing results.
As the table below demonstrates, there are some differences between the social economic classification of bus users and the social economic classification of the omnibus respondents. Omnibus respondents are far more likely to be part of a ‘higher managerial’ household than bus users. In contrast, bus users are far more likely to live in a household where the head is a student though less likely to live in a household headed by an unemployed person.
Table 5: Occupation of Chief Income Earner: A Comparison with the TfL Omnibus* Day 2008 % Night 2008 % TfL Omnibus % Higher managerial 17 17 29 Intermediate managerial 21 19 19 Supervisor, clerical or junior managerial 24 24 19 Skilled manual 12 11 15 Semi-skilled or unskilled 8 8 8 Student or full-time education 11 17 3 Unemployed 6 5 9 Unweighted base 32,081 6,215 845
* Please note that BUS 2003 and 2008 figures exclude others in order to provide a direct comparison with the TfL omnibus
4.6 ETHNICITY
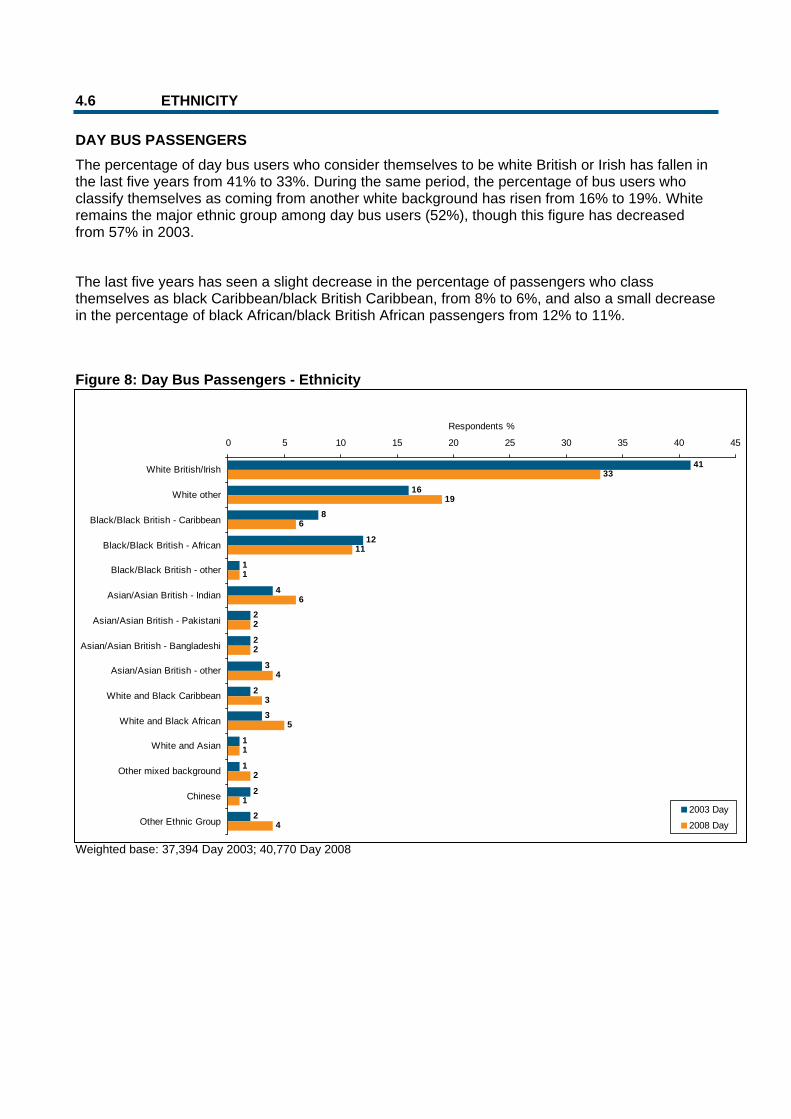
DAY BUS PASSENGERS The percentage of day bus users who consider themselves to be white British or Irish has fallen in the last five years from 41% to 33%. During the same period, the percentage of bus users who classify themselves as coming from another white background has risen from 16% to 19%. White remains the major ethnic group among day bus users (52%), though this figure has decreased from 57% in 2003.
The last five years has seen a slight decrease in the percentage of passengers who class themselves as black Caribbean/black British Caribbean, from 8% to 6%, and also a small decrease in the percentage of black African/black British African passengers from 12% to 11%.
Figure 8: Day Bus Passengers - Ethnicity
Weighted base: 37,394 Day 2003; 40,770 Day 2008
41
16
8
12
1
4
2
2
3
2
3
1
1
2
2
33
19
6
11
1
6
2
2
4
3
5
1
2
1
4
0 5 10 15 20 25 30 35 40 45
White British/Irish
White other
Black/Black British - Caribbean
Black/Black British - African
Black/Black British - other
Asian/Asian British - Indian
Asian/Asian British - Pakistani
Asian/Asian British - Bangladeshi
Asian/Asian British - other
White and Black Caribbean
White and Black African
White and Asian
Other mixed background
Chinese
Other Ethnic Group
Respondents %
2003 Day
2008 Day
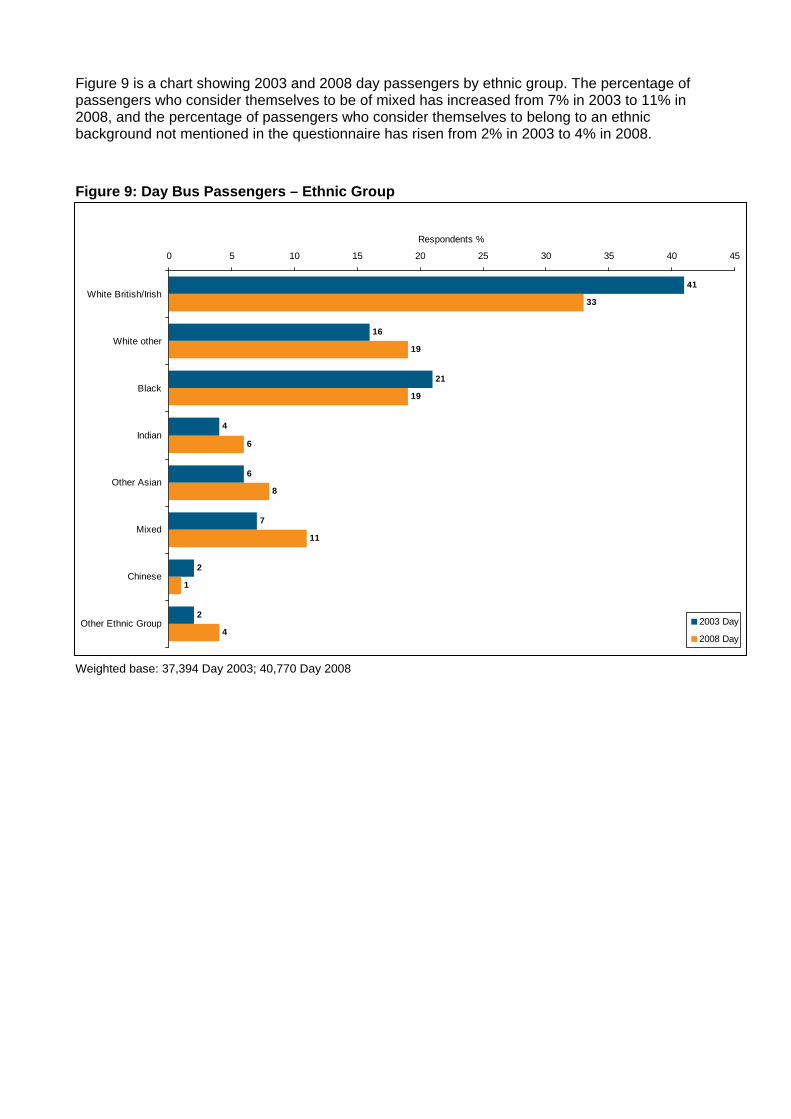
Figure 9 is a chart showing 2003 and 2008 day passengers by ethnic group. The percentage of passengers who consider themselves to be of mixed has increased from 7% in 2003 to 11% in 2008, and the percentage of passengers who consider themselves to belong to an ethnic background not mentioned in the questionnaire has risen from 2% in 2003 to 4% in 2008.
Figure 9: Day Bus Passengers – Ethnic Group
Weighted base: 37,394 Day 2003; 40,770 Day 2008
41
16
21
4
6
7
2
2
33
19
19
6
8
11
1
4
0 5 10 15 20 25 30 35 40 45
White British/Irish
White other
Black
Indian
Other Asian
Mixed
Chinese
Other Ethnic Group
Respondents %
2003 Day
2008 Day
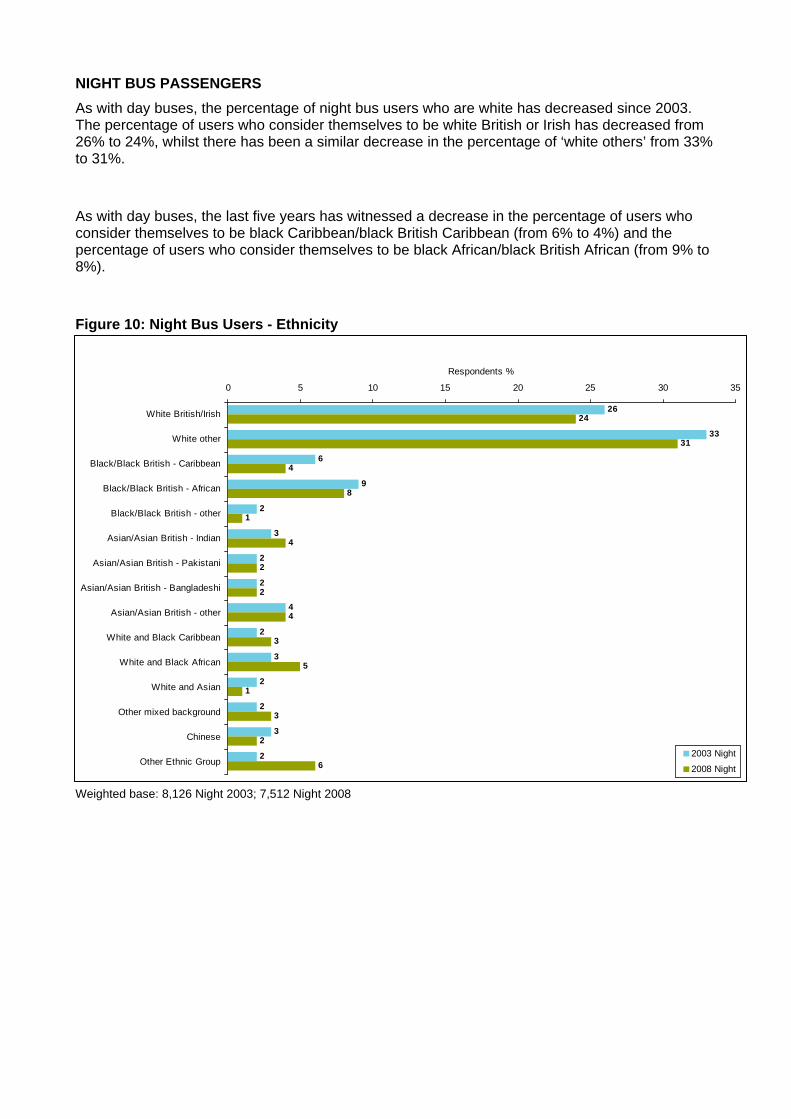
NIGHT BUS PASSENGERS As with day buses, the percentage of night bus users who are white has decreased since 2003. The percentage of users who consider themselves to be white British or Irish has decreased from 26% to 24%, whilst there has been a similar decrease in the percentage of ‘white others’ from 33% to 31%.
As with day buses, the last five years has witnessed a decrease in the percentage of users who consider themselves to be black Caribbean/black British Caribbean (from 6% to 4%) and the percentage of users who consider themselves to be black African/black British African (from 9% to 8%).
Figure 10: Night Bus Users - Ethnicity
Weighted base: 8,126 Night 2003; 7,512 Night 2008
26
33
6
9
2
3
2
2
4
2
3
2
2
3
2
24
31
4
8
1
4
2
2
4
3
5
1
3
2
6
0 5 10 15 20 25 30 35
White British/Irish
White other
Black/Black British - Caribbean
Black/Black British - African
Black/Black British - other
Asian/Asian British - Indian
Asian/Asian British - Pakistani
Asian/Asian British - Bangladeshi
Asian/Asian British - other
White and Black Caribbean
White and Black African
White and Asian
Other mixed background
Chinese
Other Ethnic Group
Respondents %
2003 Night
2008 Night
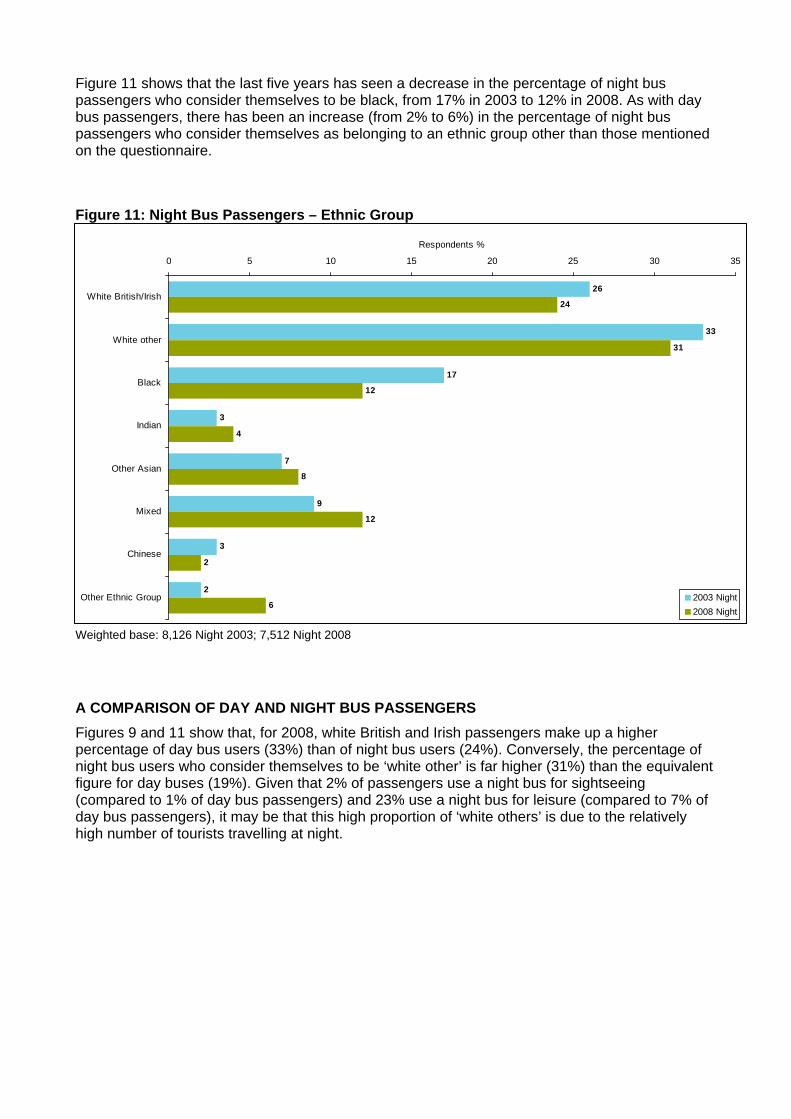
Figure 11 shows that the last five years has seen a decrease in the percentage of night bus passengers who consider themselves to be black, from 17% in 2003 to 12% in 2008. As with day bus passengers, there has been an increase (from 2% to 6%) in the percentage of night bus passengers who consider themselves as belonging to an ethnic group other than those mentioned on the questionnaire.
Figure 11: Night Bus Passengers – Ethnic Group
Weighted base: 8,126 Night 2003; 7,512 Night 2008
A COMPARISON OF DAY AND NIGHT BUS PASSENGERS
Figures 9 and 11 show that, for 2008, white British and Irish passengers make up a higher percentage of day bus users (33%) than of night bus users (24%). Conversely, the percentage of night bus users who consider themselves to be ‘white other’ is far higher (31%) than the equivalent figure for day buses (19%). Given that 2% of passengers use a night bus for sightseeing (compared to 1% of day bus passengers) and 23% use a night bus for leisure (compared to 7% of day bus passengers), it may be that this high proportion of ‘white others’ is due to the relatively high number of tourists travelling at night.
26
33
17
3
7
9
3
2
24
31
12
4
8
12
2
6
0 5 10 15 20 25 30 35
White British/Irish
White other
Black
Indian
Other Asian
Mixed
Chinese
Other Ethnic Group
Respondents %
2003 Night2008 Night
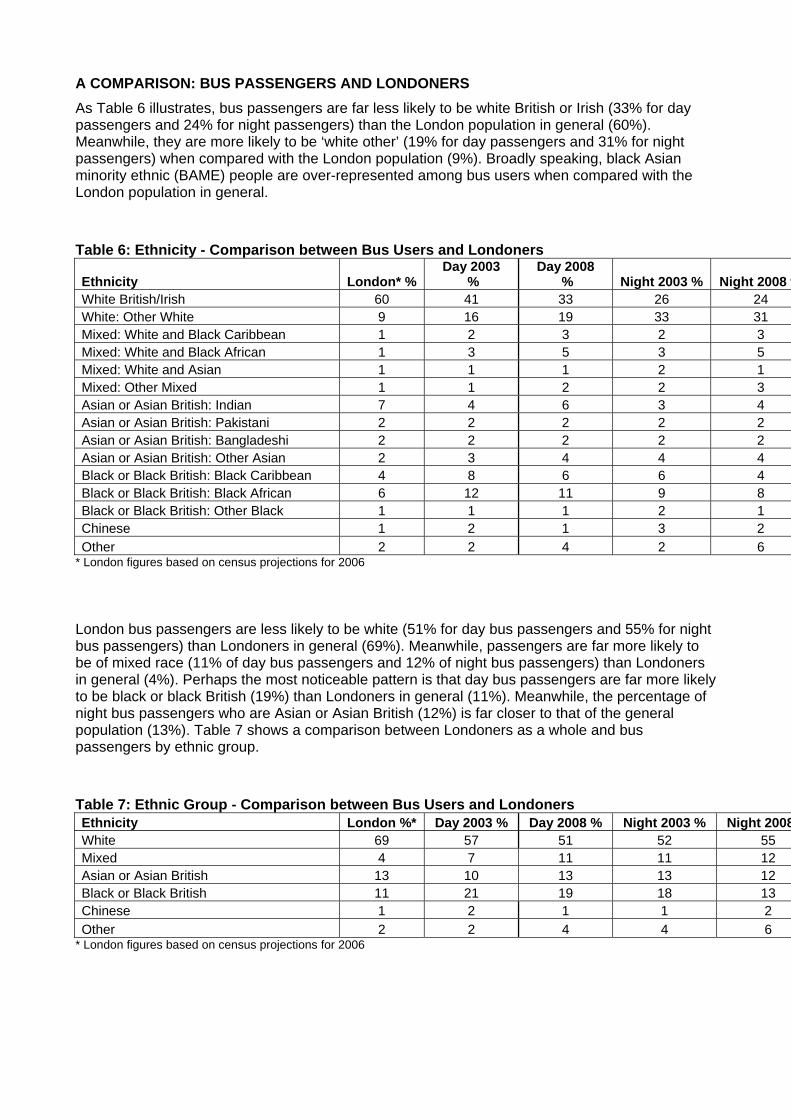
A COMPARISON: BUS PASSENGERS AND LONDONERS As Table 6 illustrates, bus passengers are far less likely to be white British or Irish (33% for day passengers and 24% for night passengers) than the London population in general (60%). Meanwhile, they are more likely to be ‘white other’ (19% for day passengers and 31% for night passengers) when compared with the London population (9%). Broadly speaking, black Asian minority ethnic (BAME) people are over-represented among bus users when compared with the London population in general.
Table 6: Ethnicity - Comparison between Bus Users and Londoners
Ethnicity London* % Day 2003
% Day 2008
% Night 2003 % Night 2008 %White British/Irish 60 41 33 26 24 White: Other White 9 16 19 33 31 Mixed: White and Black Caribbean 1 2 3 2 3 Mixed: White and Black African 1 3 5 3 5 Mixed: White and Asian 1 1 1 2 1 Mixed: Other Mixed 1 1 2 2 3 Asian or Asian British: Indian 7 4 6 3 4 Asian or Asian British: Pakistani 2 2 2 2 2 Asian or Asian British: Bangladeshi 2 2 2 2 2 Asian or Asian British: Other Asian 2 3 4 4 4 Black or Black British: Black Caribbean 4 8 6 6 4 Black or Black British: Black African 6 12 11 9 8 Black or Black British: Other Black 1 1 1 2 1 Chinese 1 2 1 3 2 Other 2 2 4 2 6
* London figures based on census projections for 2006
London bus passengers are less likely to be white (51% for day bus passengers and 55% for night bus passengers) than Londoners in general (69%). Meanwhile, passengers are far more likely to be of mixed race (11% of day bus passengers and 12% of night bus passengers) than Londoners in general (4%). Perhaps the most noticeable pattern is that day bus passengers are far more likely to be black or black British (19%) than Londoners in general (11%). Meanwhile, the percentage of night bus passengers who are Asian or Asian British (12%) is far closer to that of the general population (13%). Table 7 shows a comparison between Londoners as a whole and bus passengers by ethnic group.
Table 7: Ethnic Group - Comparison between Bus Users and Londoners Ethnicity London %* Day 2003 % Day 2008 % Night 2003 % Night 2008White 69 57 51 52 55 Mixed 4 7 11 11 12 Asian or Asian British 13 10 13 13 12 Black or Black British 11 21 19 18 13 Chinese 1 2 1 1 2 Other 2 2 4 4 6
* London figures based on census projections for 2006
4.7 PHYSICAL AND MENTAL DISABILITIES
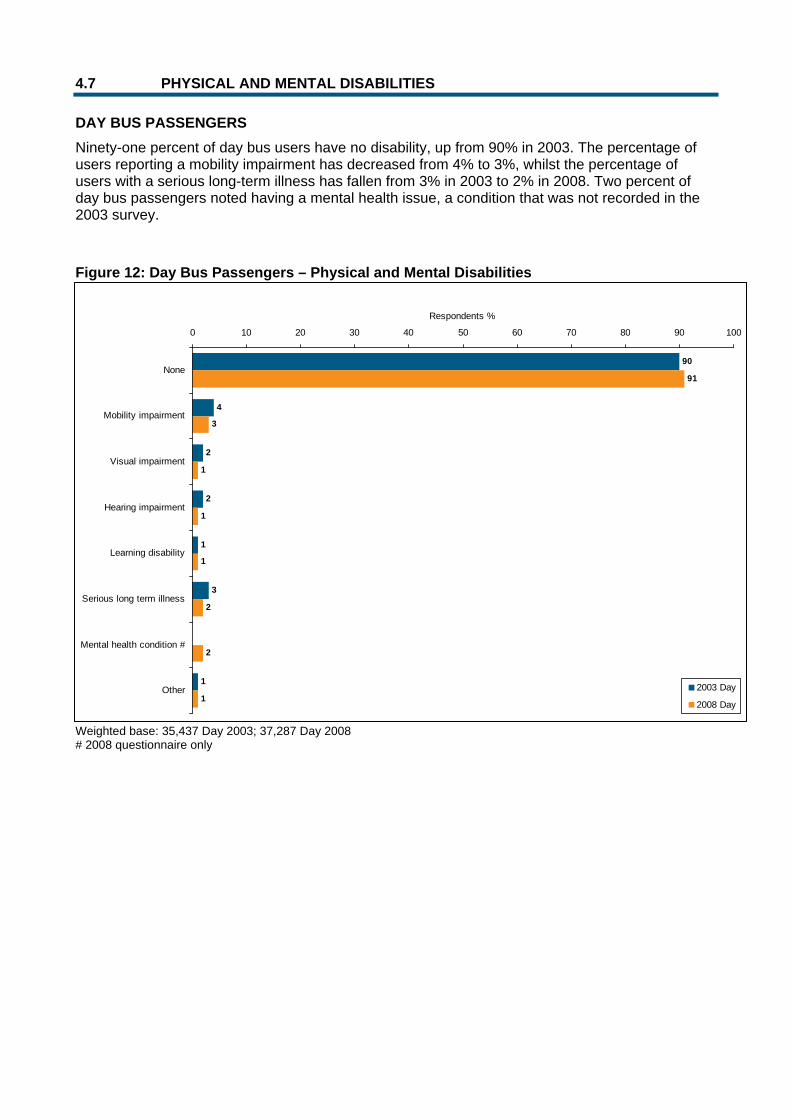
DAY BUS PASSENGERS Ninety-one percent of day bus users have no disability, up from 90% in 2003. The percentage of users reporting a mobility impairment has decreased from 4% to 3%, whilst the percentage of users with a serious long-term illness has fallen from 3% in 2003 to 2% in 2008. Two percent of day bus passengers noted having a mental health issue, a condition that was not recorded in the 2003 survey.
Figure 12: Day Bus Passengers – Physical and Mental Disabilities
Weighted base: 35,437 Day 2003; 37,287 Day 2008 # 2008 questionnaire only
90
4
2
2
1
3
1
91
3
1
1
1
2
2
1
0 10 20 30 40 50 60 70 80 90 100
None
Mobility impairment
Visual impairment
Hearing impairment
Learning disability
Serious long term illness
Mental health condition #
Other
Respondents %
2003 Day
2008 Day
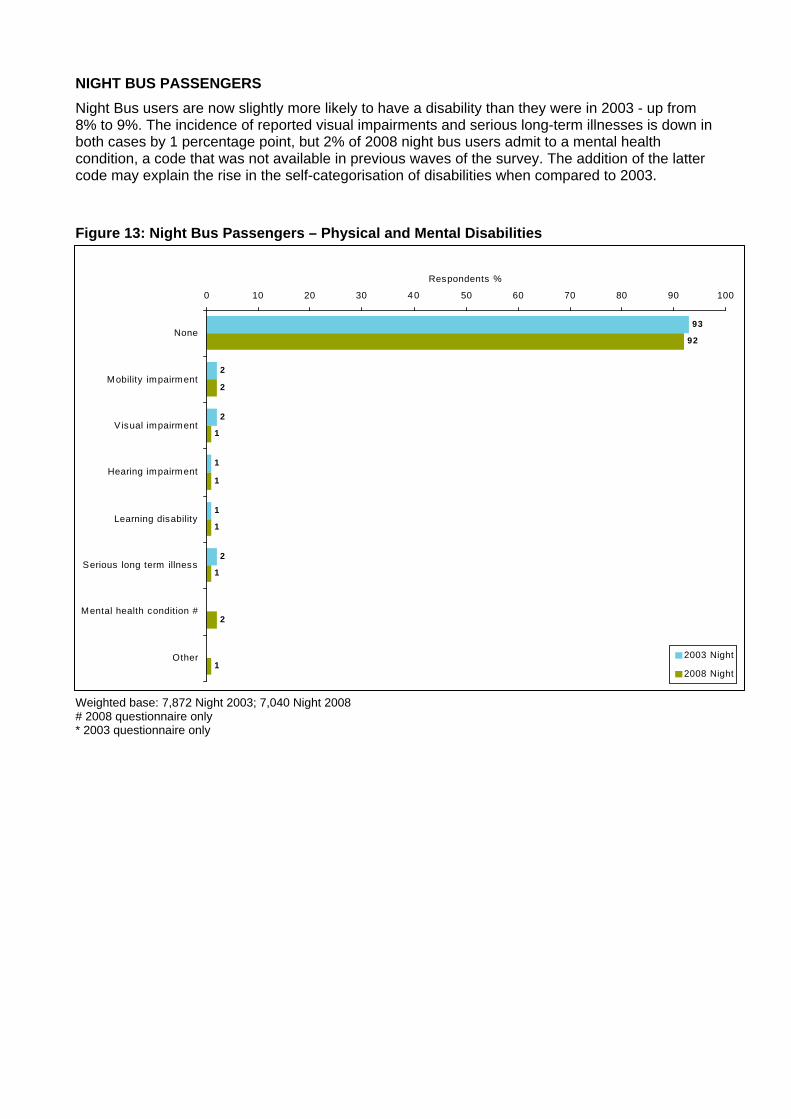
NIGHT BUS PASSENGERS Night Bus users are now slightly more likely to have a disability than they were in 2003 - up from 8% to 9%. The incidence of reported visual impairments and serious long-term illnesses is down in both cases by 1 percentage point, but 2% of 2008 night bus users admit to a mental health condition, a code that was not available in previous waves of the survey. The addition of the latter code may explain the rise in the self-categorisation of disabilities when compared to 2003.
Figure 13: Night Bus Passengers – Physical and Mental Disabilities
Weighted base: 7,872 Night 2003; 7,040 Night 2008 # 2008 questionnaire only * 2003 questionnaire only
93
2
2
1
1
2
92
2
1
1
1
1
2
1
0 10 20 30 40 50 60 70 80 90 100
None
Mobility impairment
Visual impairment
Hearing impairment
Learning disability
Serious long term illness
Mental health condition #
Other
Respondents %
2003 Night
2008 Night
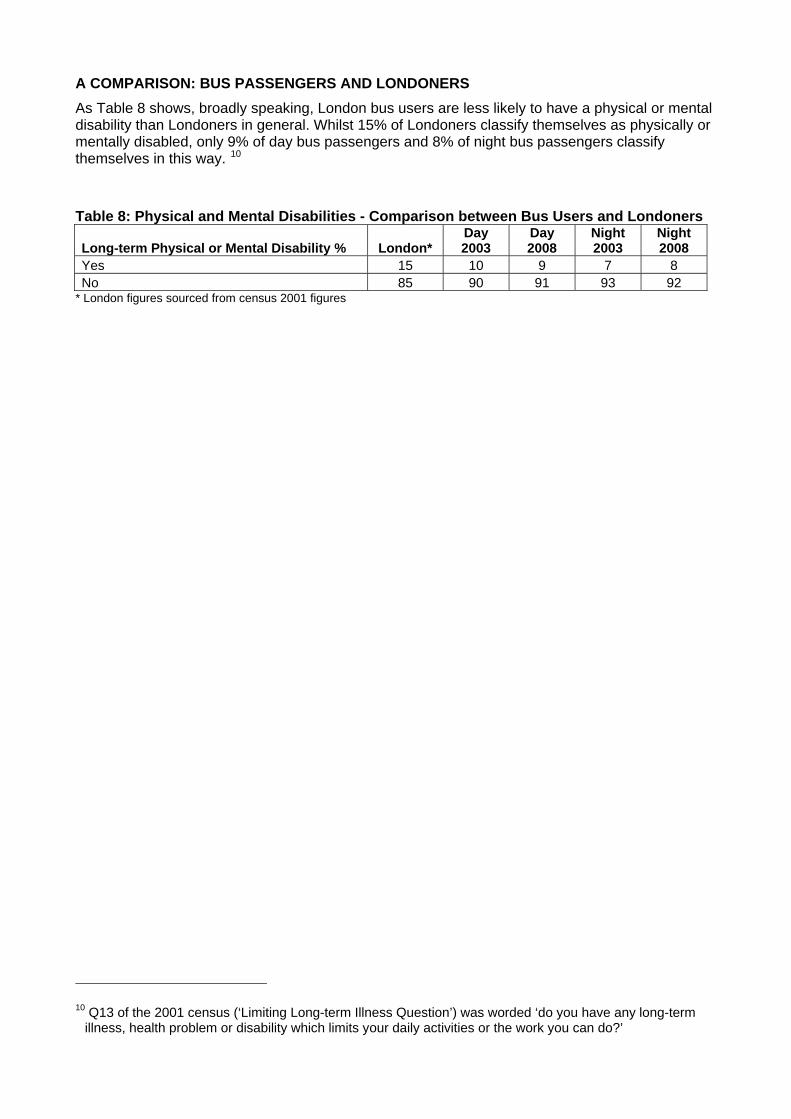
A COMPARISON: BUS PASSENGERS AND LONDONERS As Table 8 shows, broadly speaking, London bus users are less likely to have a physical or mental disability than Londoners in general. Whilst 15% of Londoners classify themselves as physically or mentally disabled, only 9% of day bus passengers and 8% of night bus passengers classify themselves in this way. 10
Table 8: Physical and Mental Disabilities - Comparison between Bus Users and Londoners
Long-term Physical or Mental Disability % London* Day 2003
Day 2008
Night 2003
Night 2008
Yes 15 10 9 7 8 No 85 90 91 93 92
* London figures sourced from census 2001 figures
10 Q13 of the 2001 census (‘Limiting Long-term Illness Question’) was worded ‘do you have any long-term
illness, health problem or disability which limits your daily activities or the work you can do?’
4.8 WHEELCHAIR USERS
DAY AND NIGHT BUS PASSENGERS
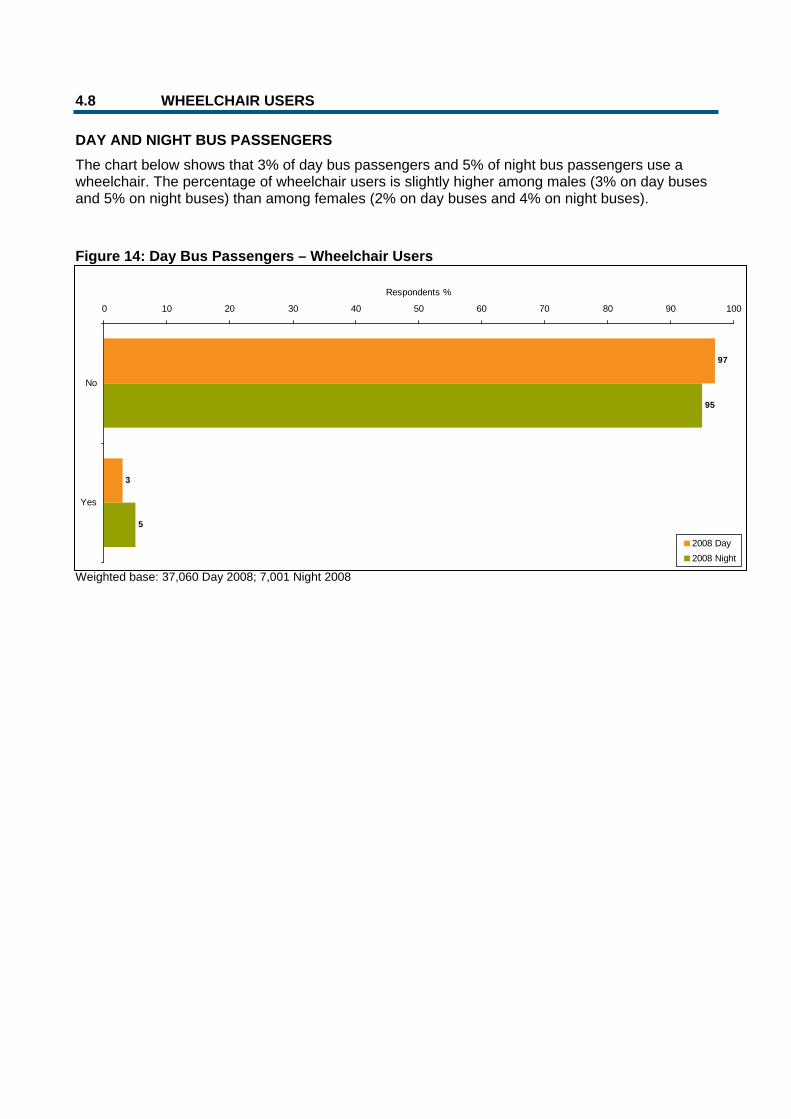
The chart below shows that 3% of day bus passengers and 5% of night bus passengers use a wheelchair. The percentage of wheelchair users is slightly higher among males (3% on day buses and 5% on night buses) than among females (2% on day buses and 4% on night buses).
Figure 14: Day Bus Passengers – Wheelchair Users
Weighted base: 37,060 Day 2008; 7,001 Night 2008
97
3
95
5
0 10 20 30 40 50 60 70 80 90 100
No
Yes
Respondents %
2008 Day2008 Night
4.9 HOME LOCATION
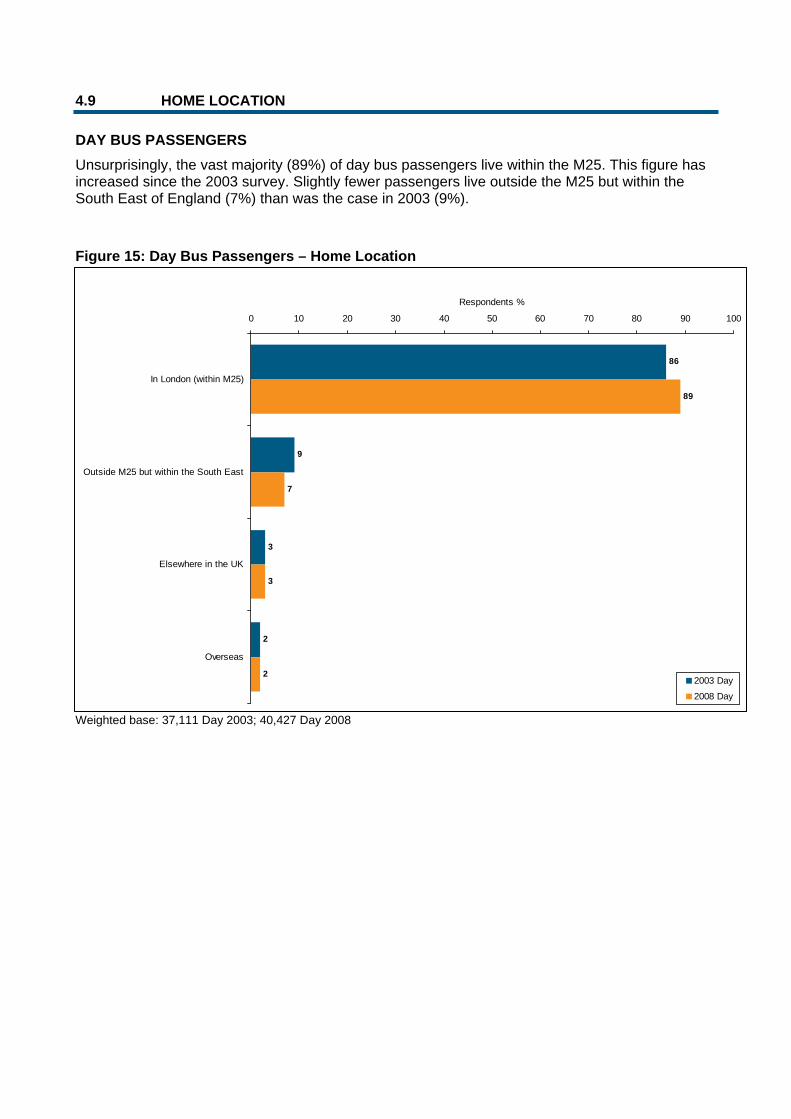
DAY BUS PASSENGERS Unsurprisingly, the vast majority (89%) of day bus passengers live within the M25. This figure has increased since the 2003 survey. Slightly fewer passengers live outside the M25 but within the South East of England (7%) than was the case in 2003 (9%).
Figure 15: Day Bus Passengers – Home Location
Weighted base: 37,111 Day 2003; 40,427 Day 2008
86
9
3
2
89
7
3
2
0 10 20 30 40 50 60 70 80 90 100
In London (within M25)
Outside M25 but within the South East
Elsewhere in the UK
Overseas
Respondents %
2003 Day
2008 Day
NIGHT BUS PASSENGERS
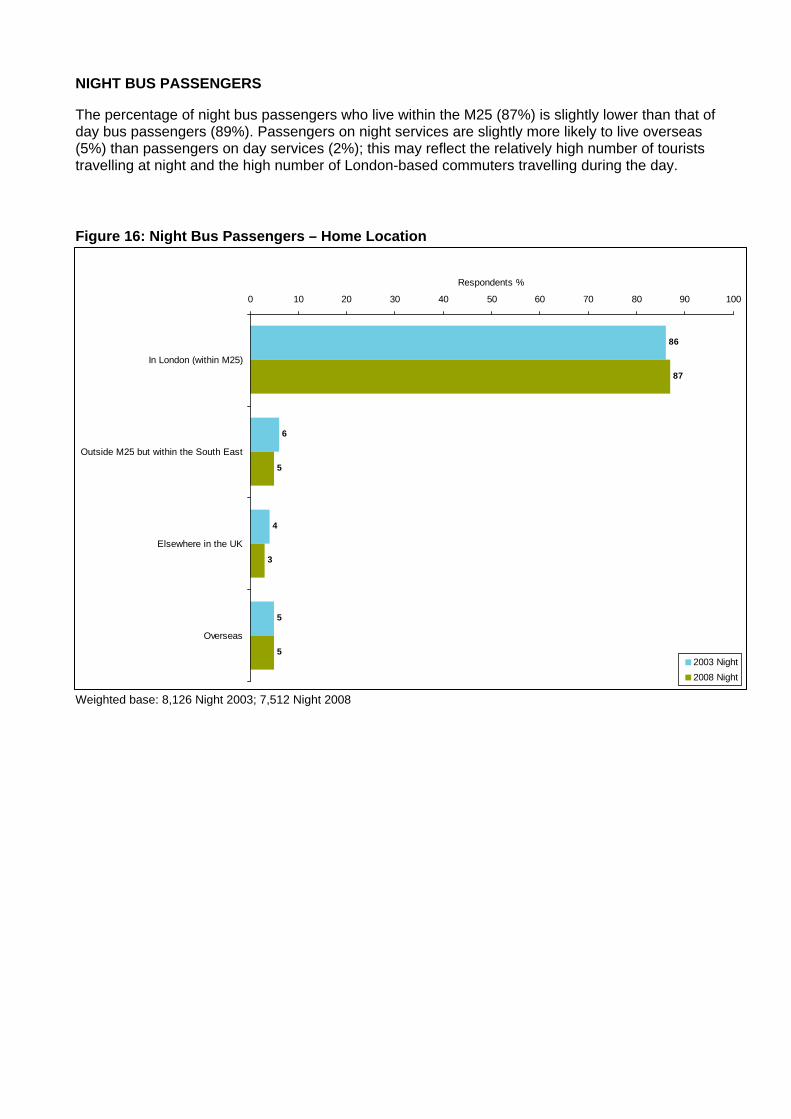
The percentage of night bus passengers who live within the M25 (87%) is slightly lower than that of day bus passengers (89%). Passengers on night services are slightly more likely to live overseas (5%) than passengers on day services (2%); this may reflect the relatively high number of tourists travelling at night and the high number of London-based commuters travelling during the day.
Figure 16: Night Bus Passengers – Home Location
Weighted base: 8,126 Night 2003; 7,512 Night 2008
86
6
4
5
87
5
3
5
0 10 20 30 40 50 60 70 80 90 100
In London (within M25)
Outside M25 but within the South East
Elsewhere in the UK
Overseas
Respondents %
2003 Night2008 Night
5 FINDINGS: JOURNEY CHARACTERISTICS
5.1 KEY FINDINGS
Day bus passengers are more likely to take a bus to or from work (49%) than they were in 2003, when the figure was 45%. This shift is more marked on night bus services, on which 47% of passengers travel to or from work, up from 40% in 2003. In terms of journey purpose by gender, male passengers remain more likely to take a bus to work than their female counterparts; this is the case on both day and night services.
There are also some differences in journey purpose by ethnicity; during the day white passengers are equally likely to travel to work on a bus as BAME passengers (both 49%). However, BAME passengers are more likely to take a night bus to work (52%) than are white passengers (44%). White passengers are more than twice as likely to use a night bus for leisure (31%) as BAME passengers (15%).
With regard to access and egress modes, there has been a noticeable increase in the extent to which the London Underground is used by bus passengers. Eight percent of passengers use this form of transport as a method of accessing a day bus (up from 6% in 2003) and 9% use it as a method of accessing a night bus. The Underground has seen a similar rise in its popularity as a mode of egress, from 8% to 10% among day bus passengers and from 2% to 4% among night bus passengers.
5.2 DAY OF WEEK
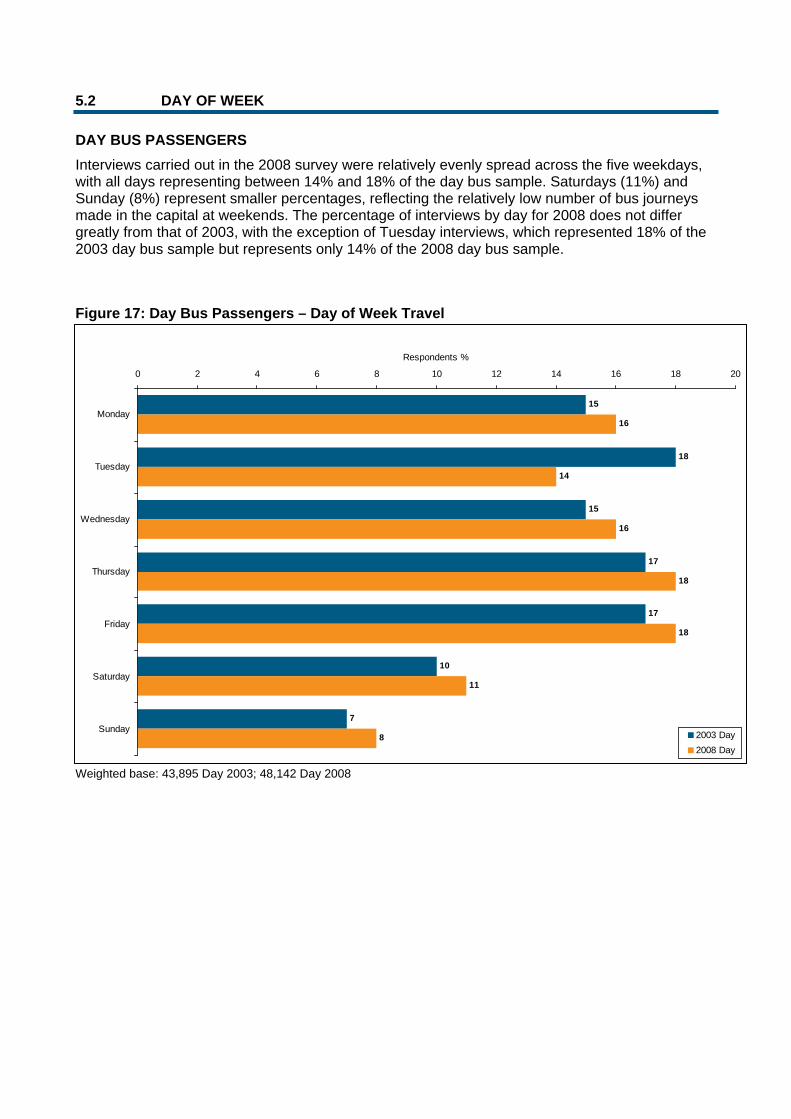
DAY BUS PASSENGERS Interviews carried out in the 2008 survey were relatively evenly spread across the five weekdays, with all days representing between 14% and 18% of the day bus sample. Saturdays (11%) and Sunday (8%) represent smaller percentages, reflecting the relatively low number of bus journeys made in the capital at weekends. The percentage of interviews by day for 2008 does not differ greatly from that of 2003, with the exception of Tuesday interviews, which represented 18% of the 2003 day bus sample but represents only 14% of the 2008 day bus sample.
Figure 17: Day Bus Passengers – Day of Week Travel
Weighted base: 43,895 Day 2003; 48,142 Day 2008
15
18
15
17
17
10
7
16
14
16
18
18
11
8
0 2 4 6 8 10 12 14 16 18 20
Monday
Tuesday
Wednesday
Thursday
Friday
Saturday
Sunday
Respondents %
2003 Day2008 Day
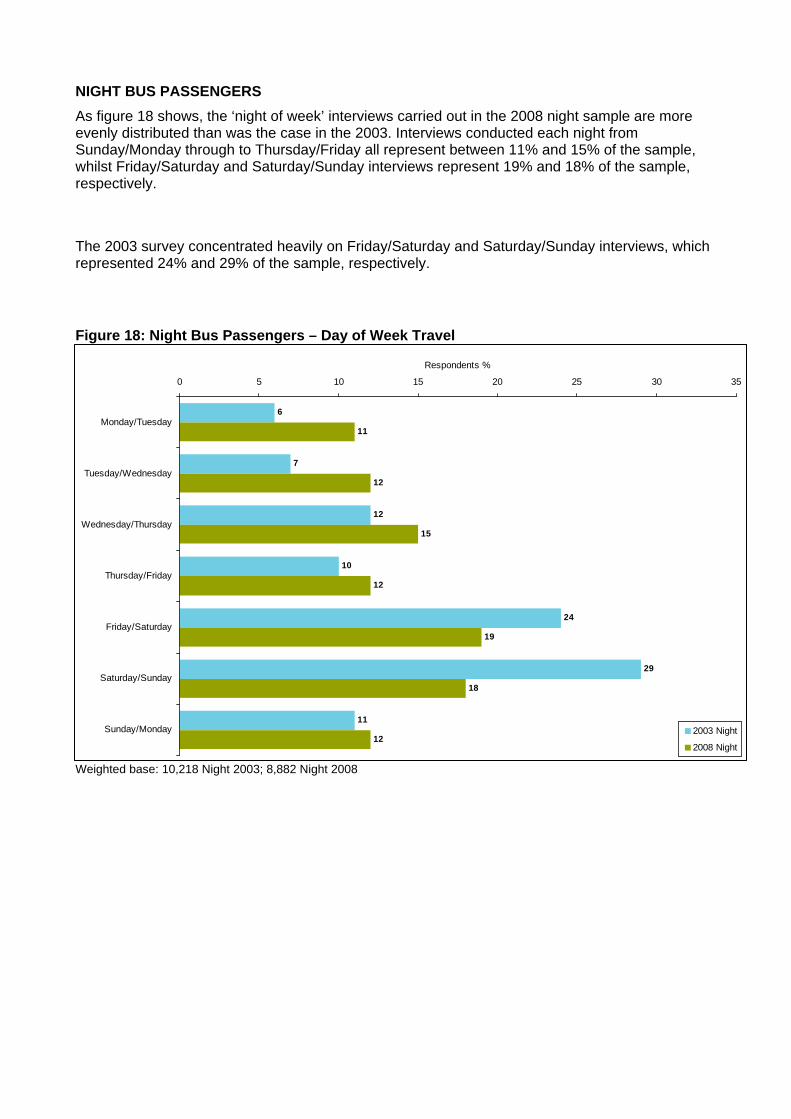
NIGHT BUS PASSENGERS As figure 18 shows, the ‘night of week’ interviews carried out in the 2008 night sample are more evenly distributed than was the case in the 2003. Interviews conducted each night from Sunday/Monday through to Thursday/Friday all represent between 11% and 15% of the sample, whilst Friday/Saturday and Saturday/Sunday interviews represent 19% and 18% of the sample, respectively.
The 2003 survey concentrated heavily on Friday/Saturday and Saturday/Sunday interviews, which represented 24% and 29% of the sample, respectively.
Figure 18: Night Bus Passengers – Day of Week Travel
Weighted base: 10,218 Night 2003; 8,882 Night 2008
6
7
12
10
24
29
11
11
12
15
12
19
18
12
0 5 10 15 20 25 30 35
Monday/Tuesday
Tuesday/Wednesday
Wednesday/Thursday
Thursday/Friday
Friday/Saturday
Saturday/Sunday
Sunday/Monday
Respondents %
2003 Night
2008 Night
5.3 SHIFT TIME BAND
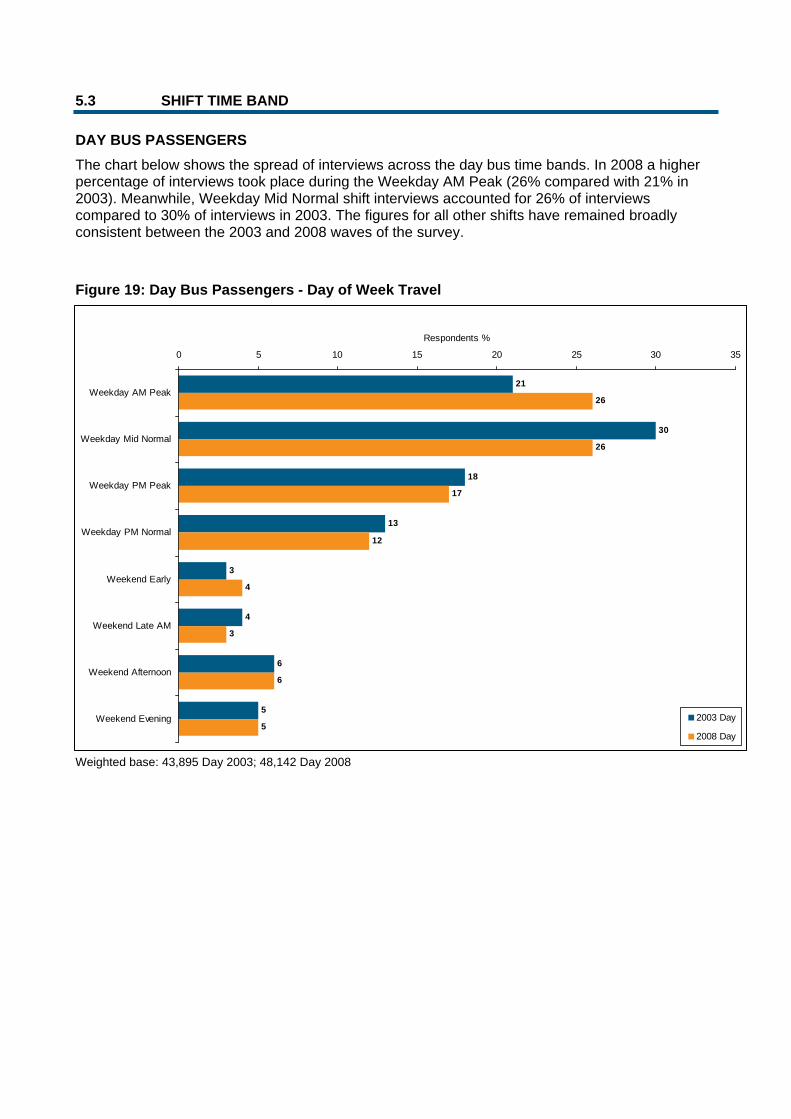
DAY BUS PASSENGERS The chart below shows the spread of interviews across the day bus time bands. In 2008 a higher percentage of interviews took place during the Weekday AM Peak (26% compared with 21% in 2003). Meanwhile, Weekday Mid Normal shift interviews accounted for 26% of interviews compared to 30% of interviews in 2003. The figures for all other shifts have remained broadly consistent between the 2003 and 2008 waves of the survey.
Figure 19: Day Bus Passengers - Day of Week Travel
Weighted base: 43,895 Day 2003; 48,142 Day 2008
21
30
18
13
3
4
6
5
26
26
17
12
4
3
6
5
0 5 10 15 20 25 30 35
Weekday AM Peak
Weekday Mid Normal
Weekday PM Peak
Weekday PM Normal
Weekend Early
Weekend Late AM
Weekend Afternoon
Weekend Evening
Respondents %
2003 Day
2008 Day
5.4 MAIN JOURNEY PURPOSE
DAY BUS PASSENGERS
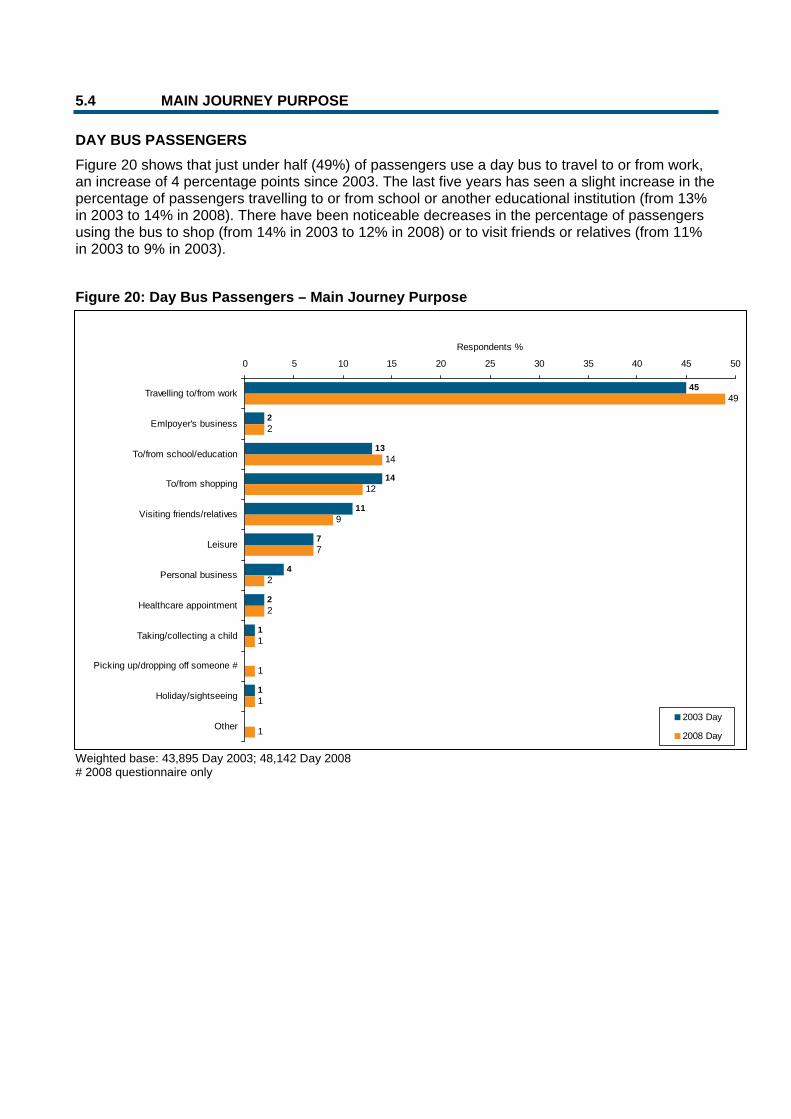
Figure 20 shows that just under half (49%) of passengers use a day bus to travel to or from work, an increase of 4 percentage points since 2003. The last five years has seen a slight increase in the percentage of passengers travelling to or from school or another educational institution (from 13% in 2003 to 14% in 2008). There have been noticeable decreases in the percentage of passengers using the bus to shop (from 14% in 2003 to 12% in 2008) or to visit friends or relatives (from 11% in 2003 to 9% in 2003).
Figure 20: Day Bus Passengers – Main Journey Purpose
Weighted base: 43,895 Day 2003; 48,142 Day 2008 # 2008 questionnaire only
45
2
13
14
11
7
4
2
1
1
49
2
14
12
9
7
2
2
1
1
1
1
0 5 10 15 20 25 30 35 40 45 50
Travelling to/from work
Emlpoyer's business
To/from school/education
To/from shopping
Visiting friends/relatives
Leisure
Personal business
Healthcare appointment
Taking/collecting a child
Picking up/dropping off someone #
Holiday/sightseeing
Other
Respondents %
2003 Day
2008 Day
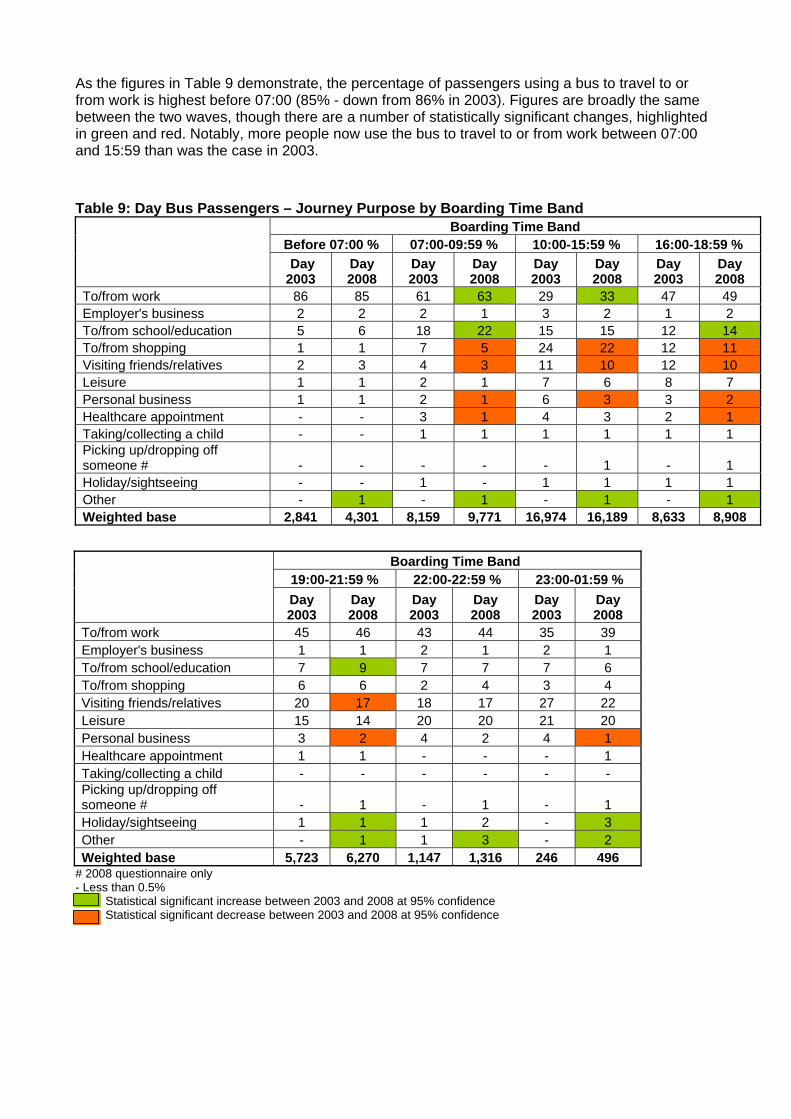
As the figures in Table 9 demonstrate, the percentage of passengers using a bus to travel to or from work is highest before 07:00 (85% - down from 86% in 2003). Figures are broadly the same between the two waves, though there are a number of statistically significant changes, highlighted in green and red. Notably, more people now use the bus to travel to or from work between 07:00 and 15:59 than was the case in 2003.
Table 9: Day Bus Passengers – Journey Purpose by Boarding Time Band
Boarding Time Band Before 07:00 % 07:00-09:59 % 10:00-15:59 % 16:00-18:59 % Day 2003
Day 2008
Day 2003
Day 2008
Day 2003
Day 2008
Day 2003
Day 2008
To/from work 86 85 61 63 29 33 47 49 Employer's business 2 2 2 1 3 2 1 2 To/from school/education 5 6 18 22 15 15 12 14 To/from shopping 1 1 7 5 24 22 12 11 Visiting friends/relatives 2 3 4 3 11 10 12 10 Leisure 1 1 2 1 7 6 8 7 Personal business 1 1 2 1 6 3 3 2 Healthcare appointment - - 3 1 4 3 2 1 Taking/collecting a child - - 1 1 1 1 1 1 Picking up/dropping off someone # - - - - - 1 - 1 Holiday/sightseeing - - 1 - 1 1 1 1 Other - 1 - 1 - 1 - 1 Weighted base 2,841 4,301 8,159 9,771 16,974 16,189 8,633 8,908
Boarding Time Band 19:00-21:59 % 22:00-22:59 % 23:00-01:59 % Day 2003
Day 2008
Day 2003
Day 2008
Day 2003
Day 2008
To/from work 45 46 43 44 35 39 Employer's business 1 1 2 1 2 1 To/from school/education 7 9 7 7 7 6 To/from shopping 6 6 2 4 3 4 Visiting friends/relatives 20 17 18 17 27 22 Leisure 15 14 20 20 21 20 Personal business 3 2 4 2 4 1 Healthcare appointment 1 1 - - - 1 Taking/collecting a child - - - - - - Picking up/dropping off someone # - 1 - 1 - 1 Holiday/sightseeing 1 1 1 2 - 3 Other - 1 1 3 - 2 Weighted base 5,723 6,270 1,147 1,316 246 496
# 2008 questionnaire only - Less than 0.5% Statistical significant increase between 2003 and 2008 at 95% confidence Statistical significant decrease between 2003 and 2008 at 95% confidence
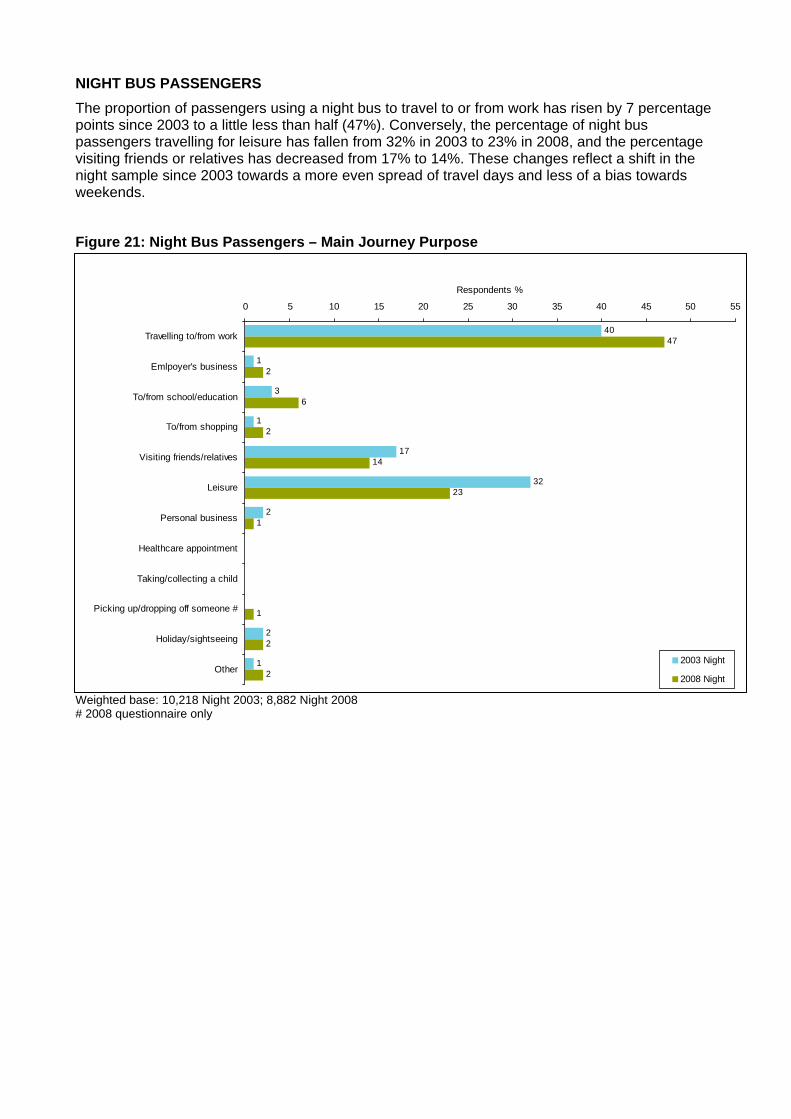
NIGHT BUS PASSENGERS The proportion of passengers using a night bus to travel to or from work has risen by 7 percentage points since 2003 to a little less than half (47%). Conversely, the percentage of night bus passengers travelling for leisure has fallen from 32% in 2003 to 23% in 2008, and the percentage visiting friends or relatives has decreased from 17% to 14%. These changes reflect a shift in the night sample since 2003 towards a more even spread of travel days and less of a bias towards weekends.
Figure 21: Night Bus Passengers – Main Journey Purpose
Weighted base: 10,218 Night 2003; 8,882 Night 2008 # 2008 questionnaire only
40
1
3
1
17
32
2
2
1
47
2
6
2
14
23
1
1
2
2
0 5 10 15 20 25 30 35 40 45 50 55
Travelling to/from work
Emlpoyer's business
To/from school/education
To/from shopping
Visiting friends/relatives
Leisure
Personal business
Healthcare appointment
Taking/collecting a child
Picking up/dropping off someone #
Holiday/sightseeing
Other
Respondents %
2003 Night
2008 Night
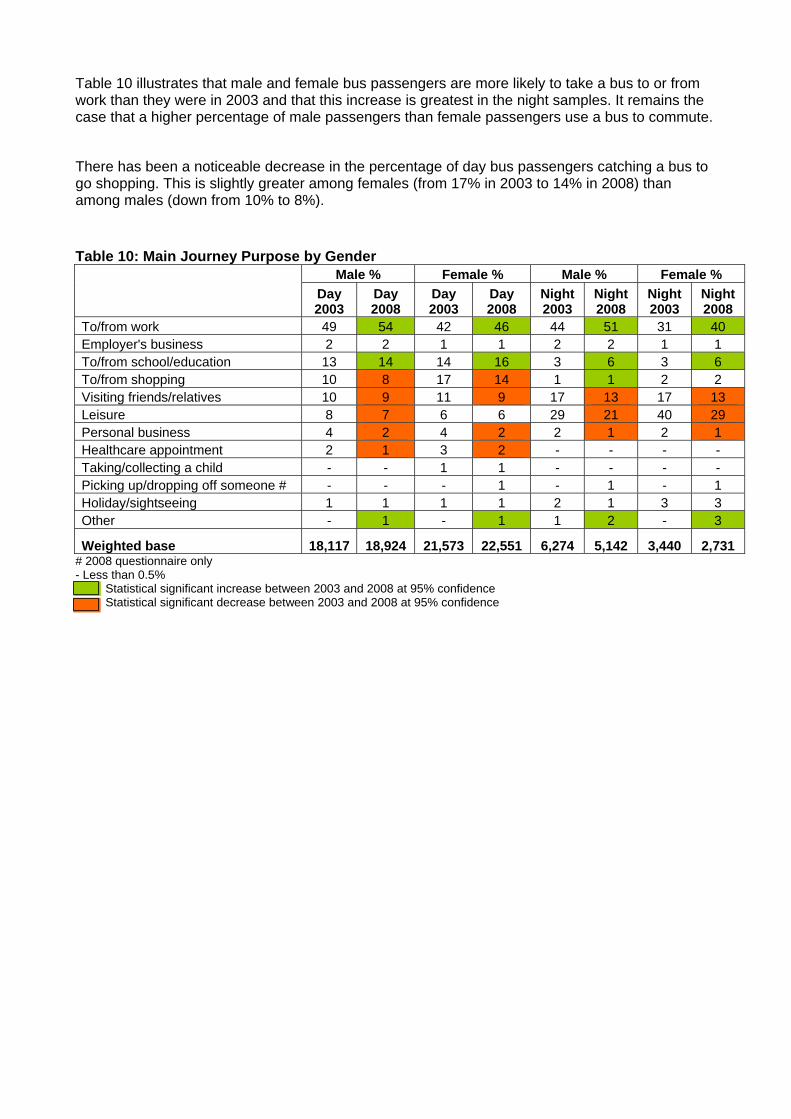
Table 10 illustrates that male and female bus passengers are more likely to take a bus to or from work than they were in 2003 and that this increase is greatest in the night samples. It remains the case that a higher percentage of male passengers than female passengers use a bus to commute.
There has been a noticeable decrease in the percentage of day bus passengers catching a bus to go shopping. This is slightly greater among females (from 17% in 2003 to 14% in 2008) than among males (down from 10% to 8%).
Table 10: Main Journey Purpose by Gender
Male % Female % Male % Female % Day 2003
Day 2008
Day 2003
Day 2008
Night 2003
Night 2008
Night 2003
Night 2008
To/from work 49 54 42 46 44 51 31 40 Employer's business 2 2 1 1 2 2 1 1 To/from school/education 13 14 14 16 3 6 3 6 To/from shopping 10 8 17 14 1 1 2 2 Visiting friends/relatives 10 9 11 9 17 13 17 13 Leisure 8 7 6 6 29 21 40 29 Personal business 4 2 4 2 2 1 2 1 Healthcare appointment 2 1 3 2 - - - - Taking/collecting a child - - 1 1 - - - - Picking up/dropping off someone # - - - 1 - 1 - 1 Holiday/sightseeing 1 1 1 1 2 1 3 3 Other - 1 - 1 1 2 - 3
Weighted base 18,117 18,924 21,573 22,551 6,274 5,142 3,440 2,731 # 2008 questionnaire only - Less than 0.5% Statistical significant increase between 2003 and 2008 at 95% confidence Statistical significant decrease between 2003 and 2008 at 95% confidence
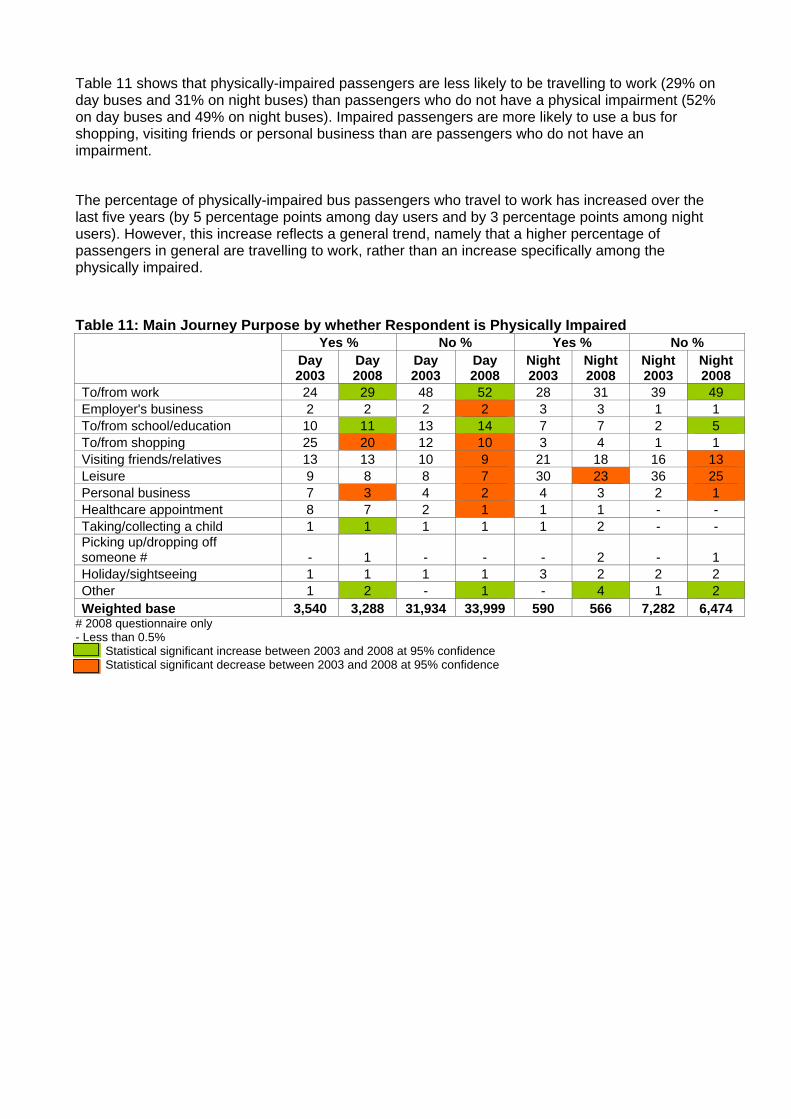
Table 11 shows that physically-impaired passengers are less likely to be travelling to work (29% on day buses and 31% on night buses) than passengers who do not have a physical impairment (52% on day buses and 49% on night buses). Impaired passengers are more likely to use a bus for shopping, visiting friends or personal business than are passengers who do not have an impairment.
The percentage of physically-impaired bus passengers who travel to work has increased over the last five years (by 5 percentage points among day users and by 3 percentage points among night users). However, this increase reflects a general trend, namely that a higher percentage of passengers in general are travelling to work, rather than an increase specifically among the physically impaired.
Table 11: Main Journey Purpose by whether Respondent is Physically Impaired
Yes % No % Yes % No % Day 2003
Day 2008
Day 2003
Day 2008
Night 2003
Night 2008
Night 2003
Night 2008
To/from work 24 29 48 52 28 31 39 49 Employer's business 2 2 2 2 3 3 1 1 To/from school/education 10 11 13 14 7 7 2 5 To/from shopping 25 20 12 10 3 4 1 1 Visiting friends/relatives 13 13 10 9 21 18 16 13 Leisure 9 8 8 7 30 23 36 25 Personal business 7 3 4 2 4 3 2 1 Healthcare appointment 8 7 2 1 1 1 - - Taking/collecting a child 1 1 1 1 1 2 - - Picking up/dropping off someone # - 1 - - - 2 - 1 Holiday/sightseeing 1 1 1 1 3 2 2 2 Other 1 2 - 1 - 4 1 2 Weighted base 3,540 3,288 31,934 33,999 590 566 7,282 6,474
# 2008 questionnaire only - Less than 0.5% Statistical significant increase between 2003 and 2008 at 95% confidence Statistical significant decrease between 2003 and 2008 at 95% confidence
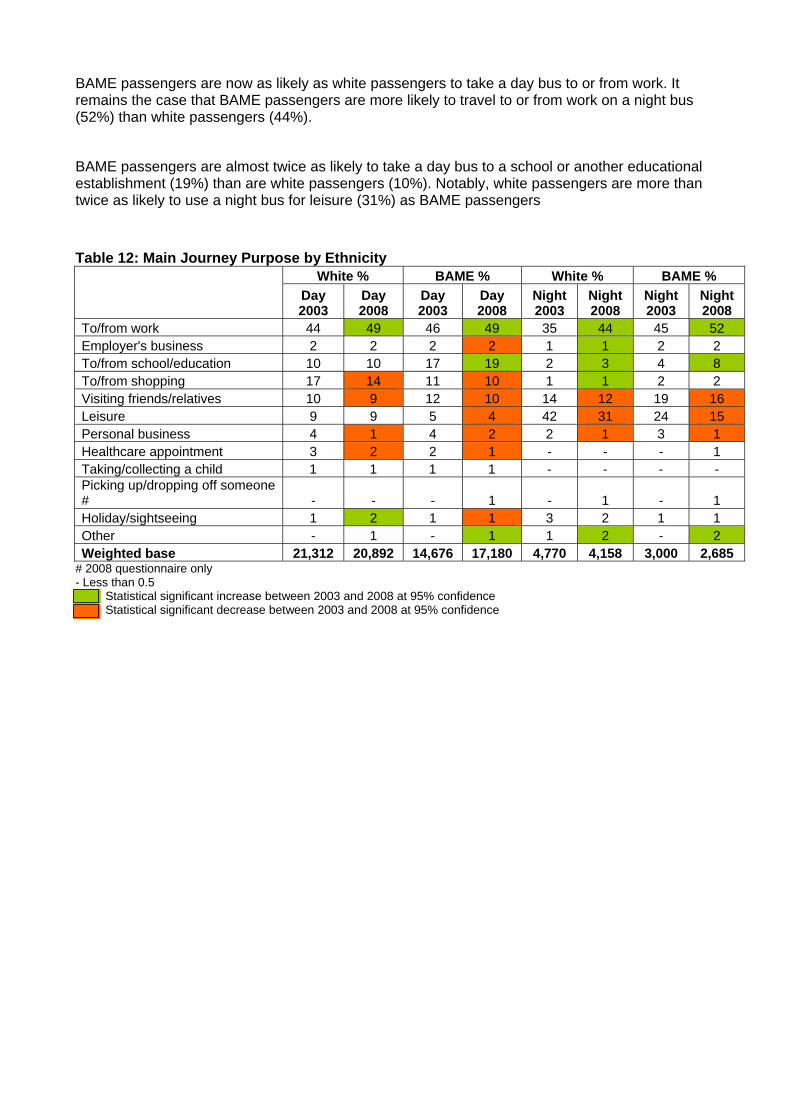
BAME passengers are now as likely as white passengers to take a day bus to or from work. It remains the case that BAME passengers are more likely to travel to or from work on a night bus (52%) than white passengers (44%).
BAME passengers are almost twice as likely to take a day bus to a school or another educational establishment (19%) than are white passengers (10%). Notably, white passengers are more than twice as likely to use a night bus for leisure (31%) as BAME passengers
Table 12: Main Journey Purpose by Ethnicity
White % BAME % White % BAME % Day 2003
Day 2008
Day 2003
Day 2008
Night 2003
Night 2008
Night 2003
Night 2008
To/from work 44 49 46 49 35 44 45 52 Employer's business 2 2 2 2 1 1 2 2 To/from school/education 10 10 17 19 2 3 4 8 To/from shopping 17 14 11 10 1 1 2 2 Visiting friends/relatives 10 9 12 10 14 12 19 16 Leisure 9 9 5 4 42 31 24 15 Personal business 4 1 4 2 2 1 3 1 Healthcare appointment 3 2 2 1 - - - 1 Taking/collecting a child 1 1 1 1 - - - - Picking up/dropping off someone # - - - 1 - 1 - 1 Holiday/sightseeing 1 2 1 1 3 2 1 1 Other - 1 - 1 1 2 - 2 Weighted base 21,312 20,892 14,676 17,180 4,770 4,158 3,000 2,685
# 2008 questionnaire only - Less than 0.5 Statistical significant increase between 2003 and 2008 at 95% confidence Statistical significant decrease between 2003 and 2008 at 95% confidence
5.5 ACCESS MODE
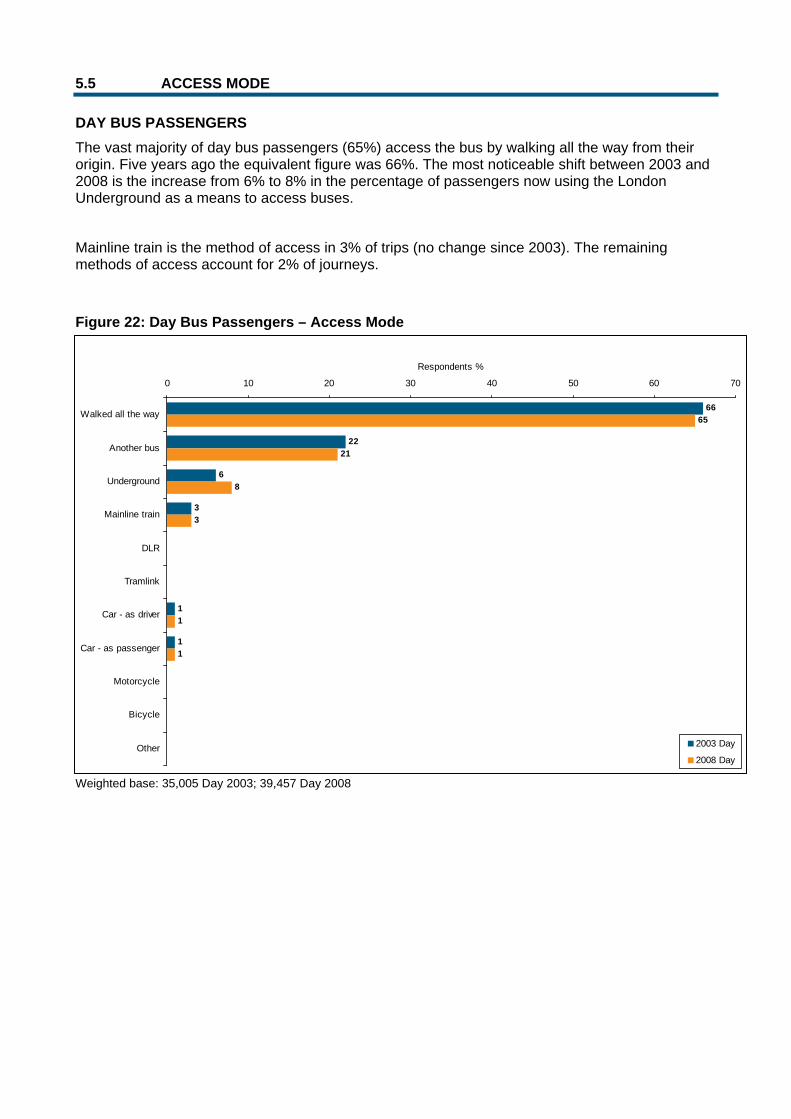
DAY BUS PASSENGERS The vast majority of day bus passengers (65%) access the bus by walking all the way from their origin. Five years ago the equivalent figure was 66%. The most noticeable shift between 2003 and 2008 is the increase from 6% to 8% in the percentage of passengers now using the London Underground as a means to access buses.
Mainline train is the method of access in 3% of trips (no change since 2003). The remaining methods of access account for 2% of journeys.
Figure 22: Day Bus Passengers – Access Mode
Weighted base: 35,005 Day 2003; 39,457 Day 2008
66
22
6
3
1
1
65
21
8
3
1
1
0 10 20 30 40 50 60 70
Walked all the way
Another bus
Underground
Mainline train
DLR
Tramlink
Car - as driver
Car - as passenger
Motorcycle
Bicycle
Other
Respondents %
2003 Day
2008 Day
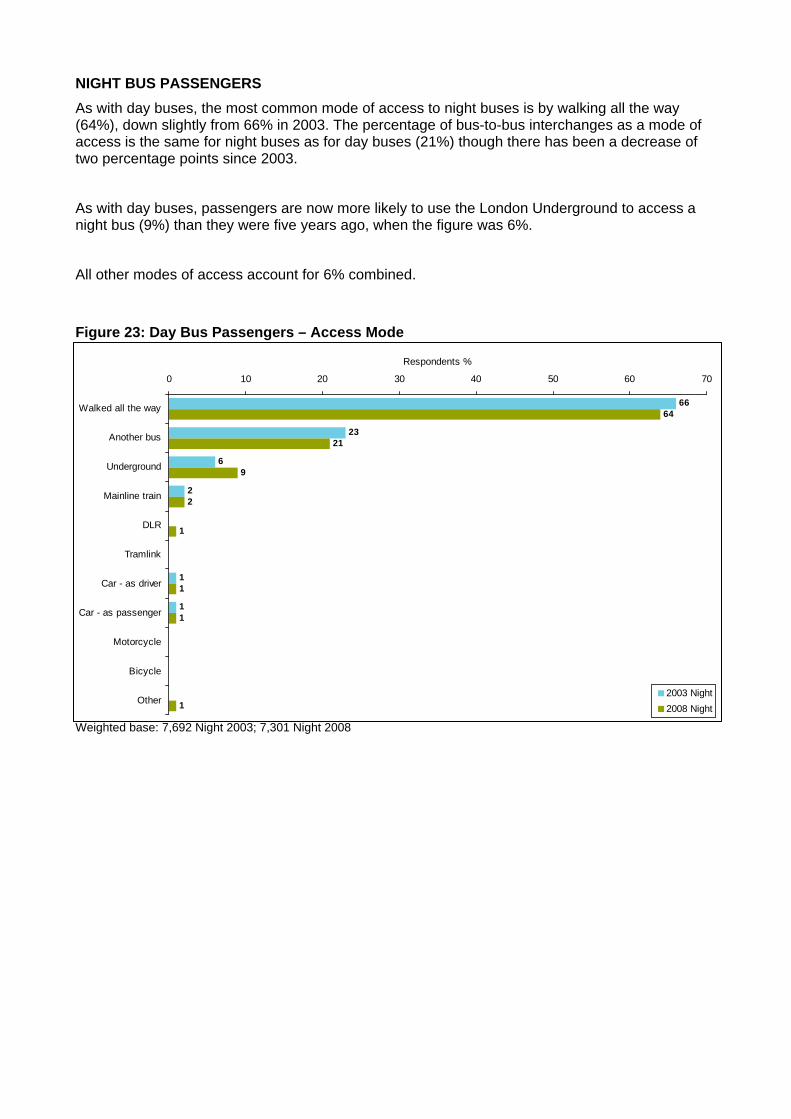
NIGHT BUS PASSENGERS As with day buses, the most common mode of access to night buses is by walking all the way (64%), down slightly from 66% in 2003. The percentage of bus-to-bus interchanges as a mode of access is the same for night buses as for day buses (21%) though there has been a decrease of two percentage points since 2003.
As with day buses, passengers are now more likely to use the London Underground to access a night bus (9%) than they were five years ago, when the figure was 6%.
All other modes of access account for 6% combined.
Figure 23: Day Bus Passengers – Access Mode
Weighted base: 7,692 Night 2003; 7,301 Night 2008
66
23
6
2
1
1
64
21
9
2
1
1
1
1
0 10 20 30 40 50 60 70
Walked all the way
Another bus
Underground
Mainline train
DLR
Tramlink
Car - as driver
Car - as passenger
Motorcycle
Bicycle
Other
Respondents %
2003 Night2008 Night
5.6 EGRESS MODE
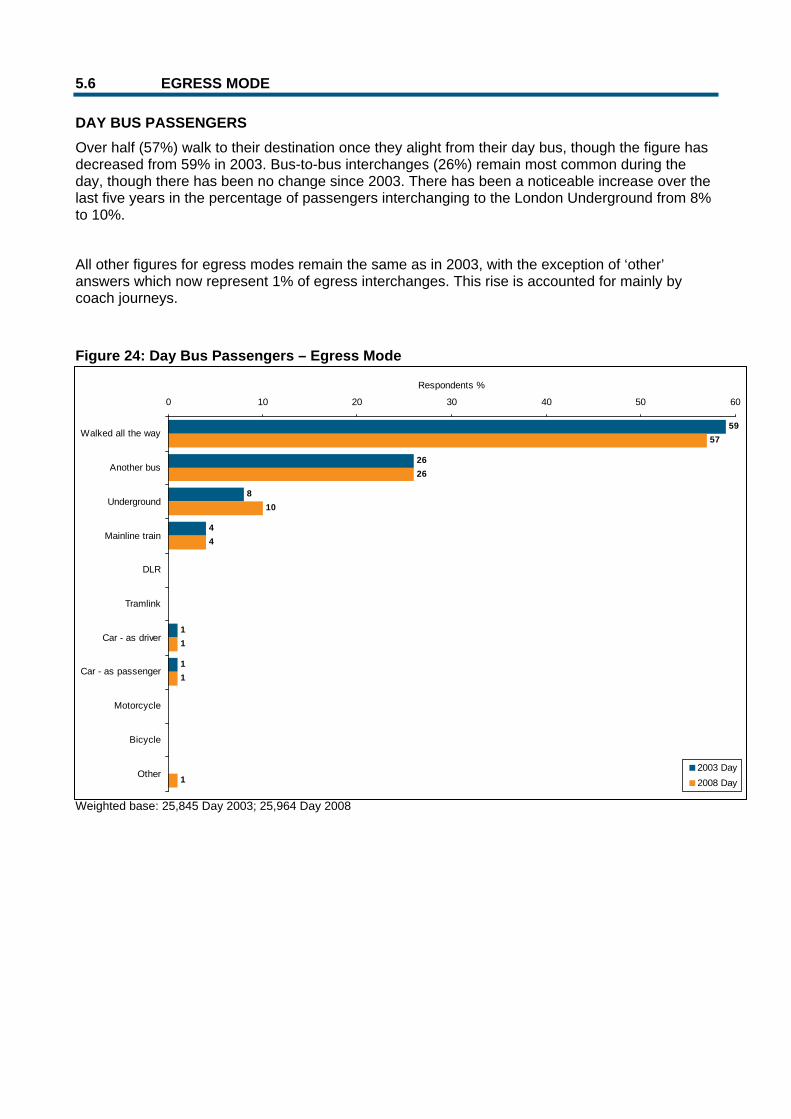
DAY BUS PASSENGERS Over half (57%) walk to their destination once they alight from their day bus, though the figure has decreased from 59% in 2003. Bus-to-bus interchanges (26%) remain most common during the day, though there has been no change since 2003. There has been a noticeable increase over the last five years in the percentage of passengers interchanging to the London Underground from 8% to 10%.
All other figures for egress modes remain the same as in 2003, with the exception of ‘other’ answers which now represent 1% of egress interchanges. This rise is accounted for mainly by coach journeys.
Figure 24: Day Bus Passengers – Egress Mode
Weighted base: 25,845 Day 2003; 25,964 Day 2008
59
26
8
4
1
1
57
26
10
4
1
1
1
0 10 20 30 40 50 60
Walked all the way
Another bus
Underground
Mainline train
DLR
Tramlink
Car - as driver
Car - as passenger
Motorcycle
Bicycle
Other
Respondents %
2003 Day2008 Day
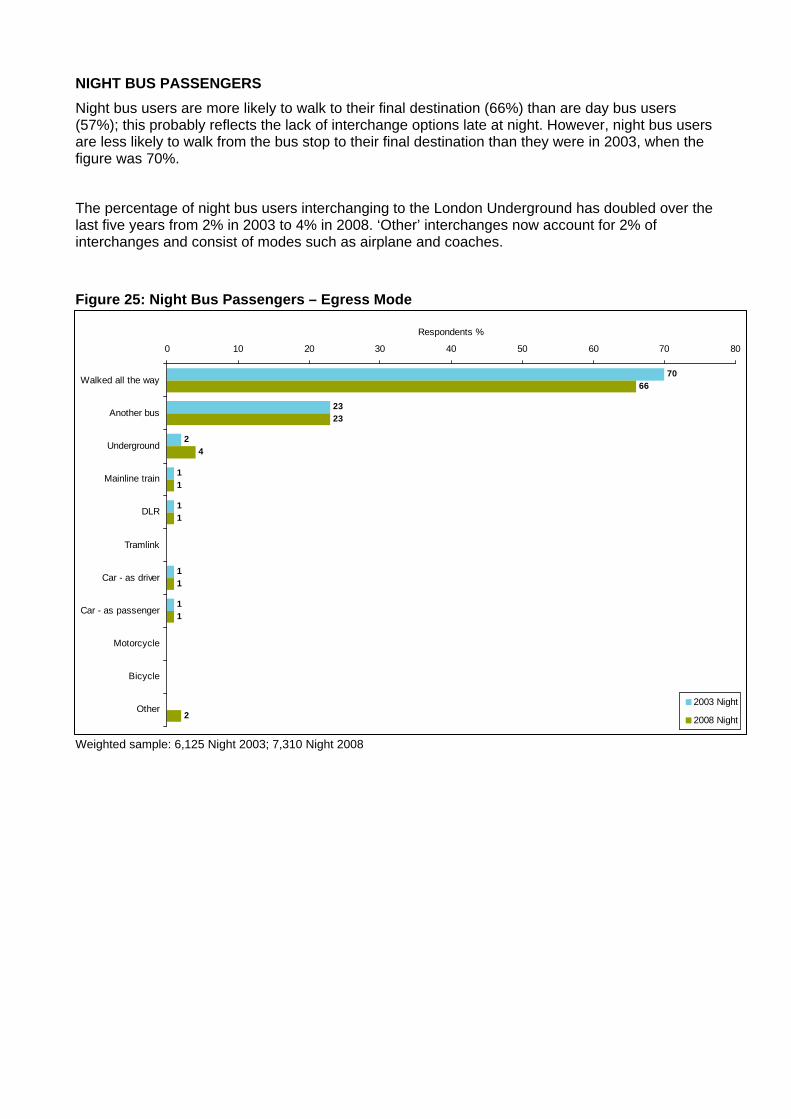
NIGHT BUS PASSENGERS Night bus users are more likely to walk to their final destination (66%) than are day bus users (57%); this probably reflects the lack of interchange options late at night. However, night bus users are less likely to walk from the bus stop to their final destination than they were in 2003, when the figure was 70%.
The percentage of night bus users interchanging to the London Underground has doubled over the last five years from 2% in 2003 to 4% in 2008. ‘Other’ interchanges now account for 2% of interchanges and consist of modes such as airplane and coaches.
Figure 25: Night Bus Passengers – Egress Mode
Weighted sample: 6,125 Night 2003; 7,310 Night 2008
70
23
2
1
1
1
1
66
23
4
1
1
1
1
2
0 10 20 30 40 50 60 70 80
Walked all the way
Another bus
Underground
Mainline train
DLR
Tramlink
Car - as driver
Car - as passenger
Motorcycle
Bicycle
Other
Respondents %
2003 Night
2008 Night
5.7 ROUTE TYPE
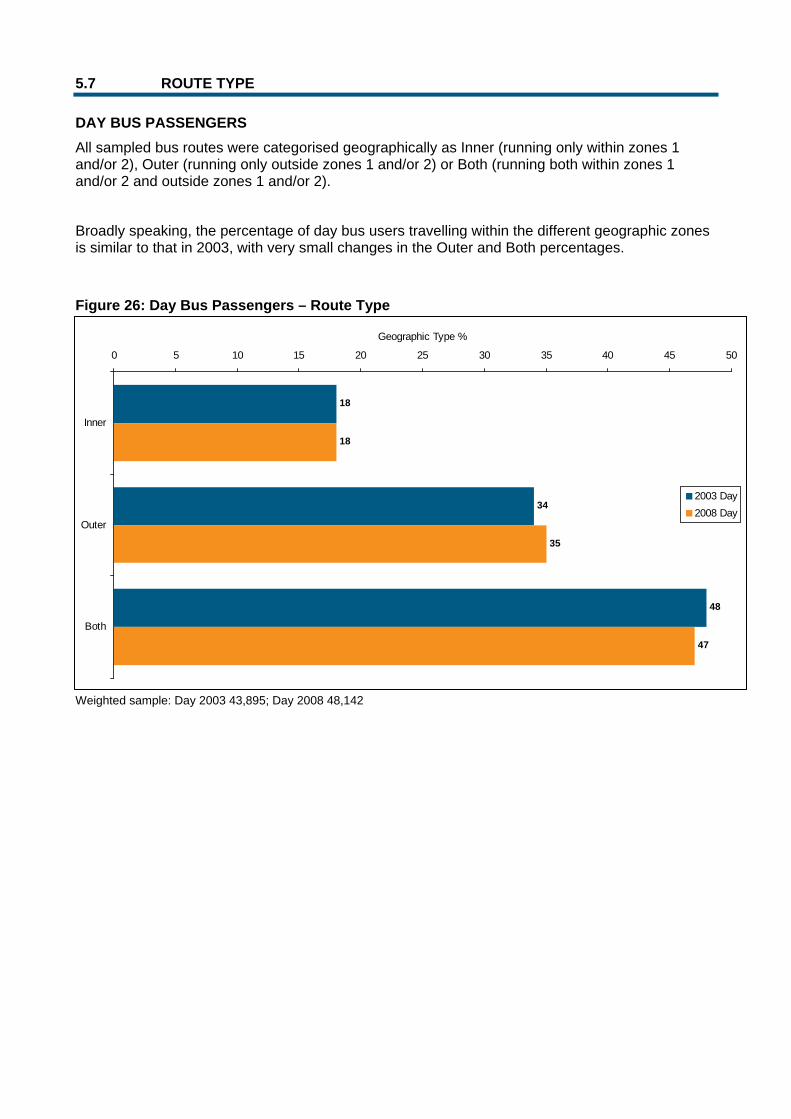
DAY BUS PASSENGERS All sampled bus routes were categorised geographically as Inner (running only within zones 1 and/or 2), Outer (running only outside zones 1 and/or 2) or Both (running both within zones 1 and/or 2 and outside zones 1 and/or 2).
Broadly speaking, the percentage of day bus users travelling within the different geographic zones is similar to that in 2003, with very small changes in the Outer and Both percentages.
Figure 26: Day Bus Passengers – Route Type
Weighted sample: Day 2003 43,895; Day 2008 48,142
18
34
48
18
35
47
0 5 10 15 20 25 30 35 40 45 50
Inner
Outer
Both
Geographic Type %
2003 Day2008 Day
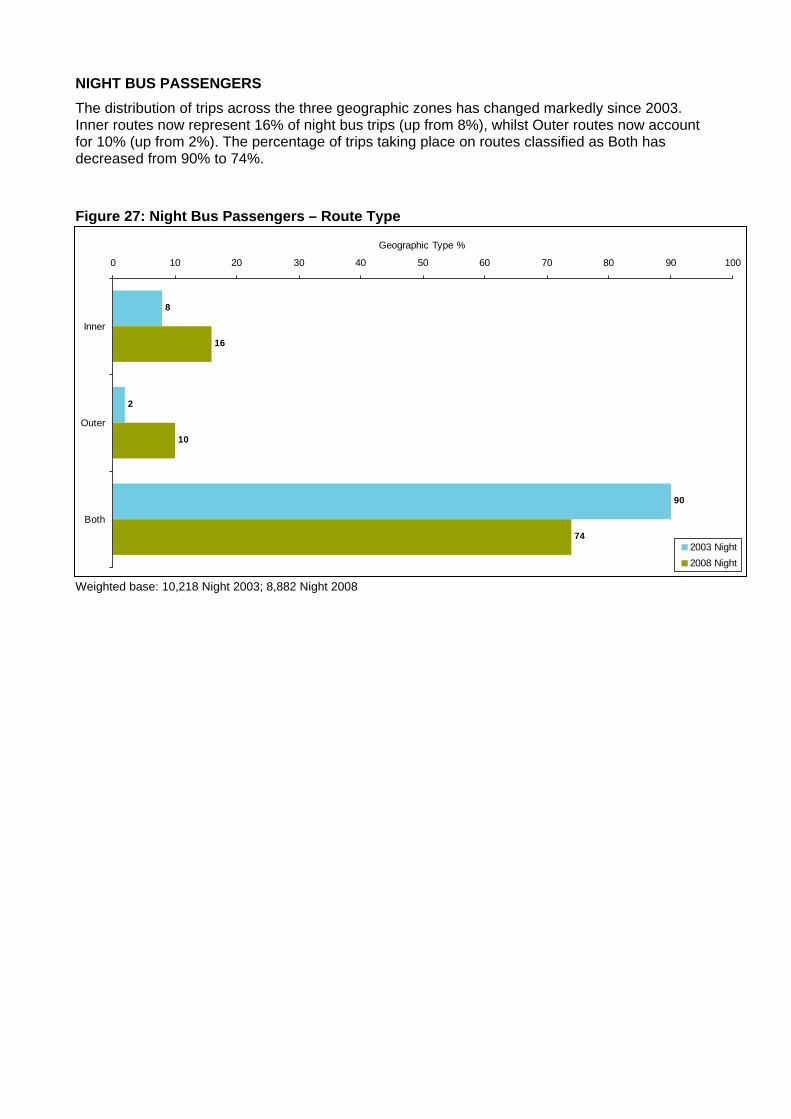
NIGHT BUS PASSENGERS The distribution of trips across the three geographic zones has changed markedly since 2003. Inner routes now represent 16% of night bus trips (up from 8%), whilst Outer routes now account for 10% (up from 2%). The percentage of trips taking place on routes classified as Both has decreased from 90% to 74%.
Figure 27: Night Bus Passengers – Route Type
Weighted base: 10,218 Night 2003; 8,882 Night 2008
8
2
90
16
10
74
0 10 20 30 40 50 60 70 80 90 100
Inner
Outer
Both
Geographic Type %
2003 Night2008 Night
5.8 BUS TYPE
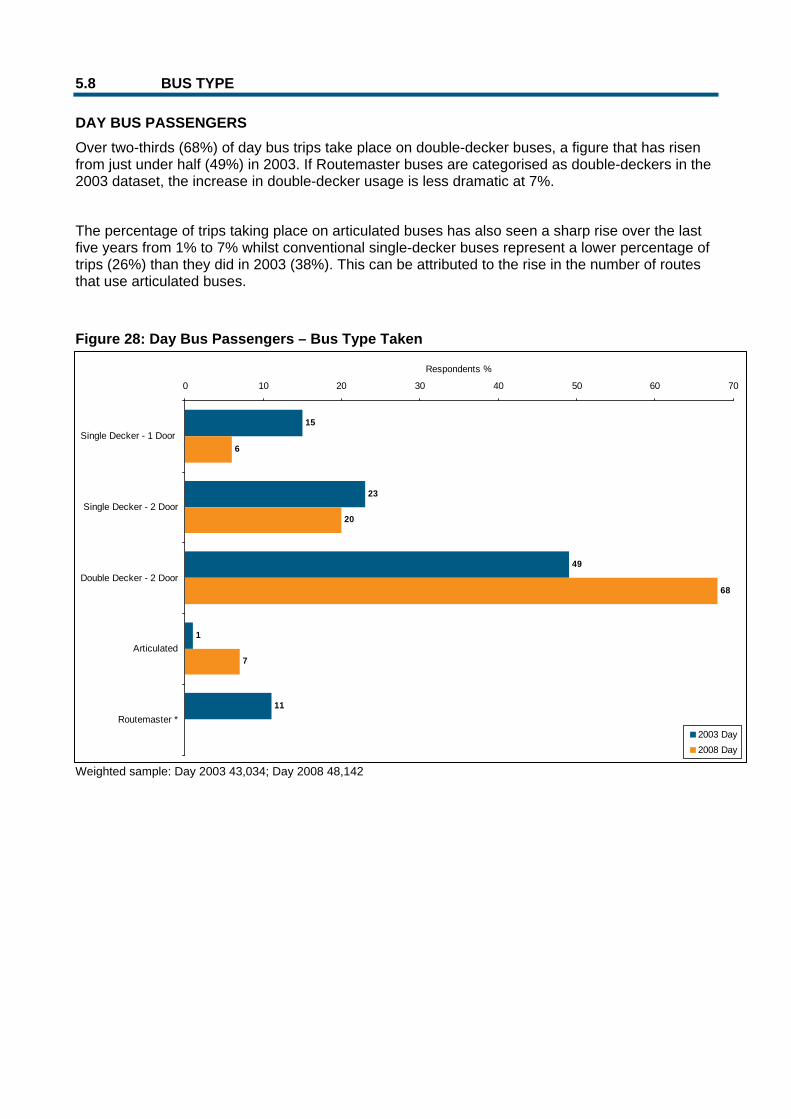
DAY BUS PASSENGERS Over two-thirds (68%) of day bus trips take place on double-decker buses, a figure that has risen from just under half (49%) in 2003. If Routemaster buses are categorised as double-deckers in the 2003 dataset, the increase in double-decker usage is less dramatic at 7%.
The percentage of trips taking place on articulated buses has also seen a sharp rise over the last five years from 1% to 7% whilst conventional single-decker buses represent a lower percentage of trips (26%) than they did in 2003 (38%). This can be attributed to the rise in the number of routes that use articulated buses.
Figure 28: Day Bus Passengers – Bus Type Taken
Weighted sample: Day 2003 43,034; Day 2008 48,142
15
23
49
1
11
6
20
68
7
0 10 20 30 40 50 60 70
Single Decker - 1 Door
Single Decker - 2 Door
Double Decker - 2 Door
Articulated
Routemaster *
Respondents %
2003 Day2008 Day
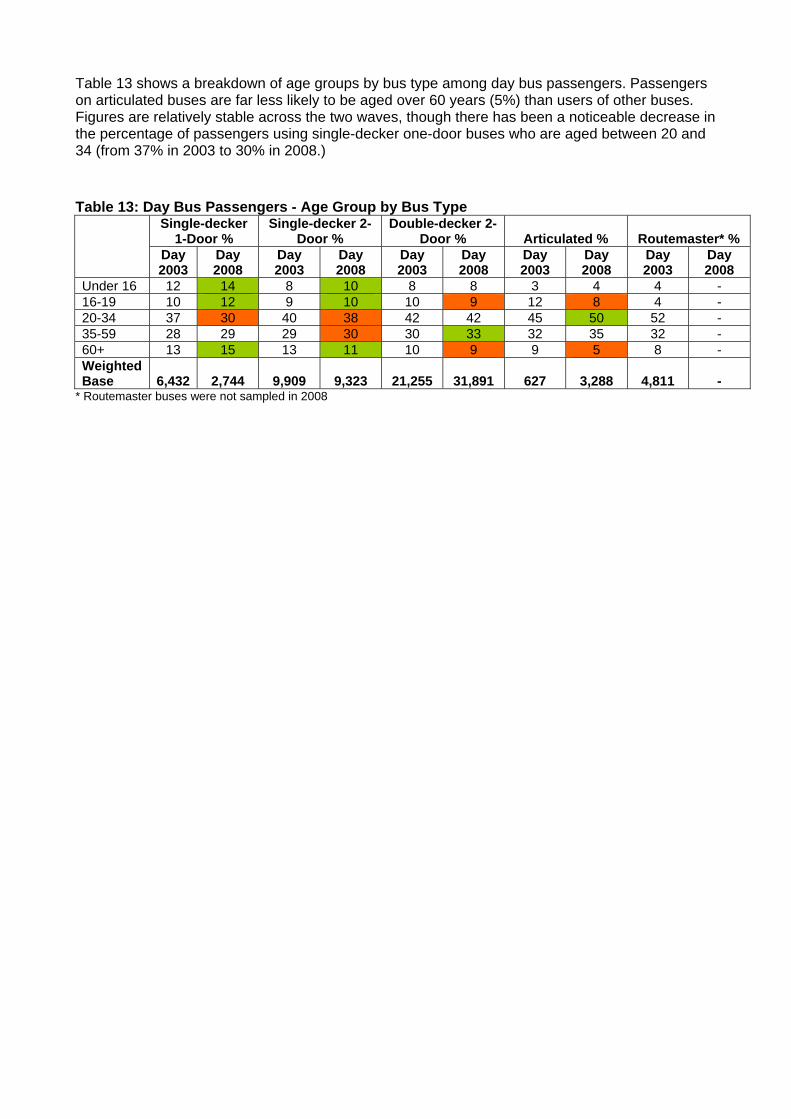
Table 13 shows a breakdown of age groups by bus type among day bus passengers. Passengers on articulated buses are far less likely to be aged over 60 years (5%) than users of other buses. Figures are relatively stable across the two waves, though there has been a noticeable decrease in the percentage of passengers using single-decker one-door buses who are aged between 20 and 34 (from 37% in 2003 to 30% in 2008.)
Table 13: Day Bus Passengers - Age Group by Bus Type
Single-decker 1-Door %
Single-decker 2- Door %
Double-decker 2- Door % Articulated % Routemaster* %
Day 2003
Day 2008
Day 2003
Day 2008
Day 2003
Day 2008
Day 2003
Day 2008
Day 2003
Day 2008
Under 16 12 14 8 10 8 8 3 4 4 - 16-19 10 12 9 10 10 9 12 8 4 - 20-34 37 30 40 38 42 42 45 50 52 - 35-59 28 29 29 30 30 33 32 35 32 - 60+ 13 15 13 11 10 9 9 5 8 - Weighted Base 6,432 2,744 9,909 9,323 21,255 31,891 627 3,288 4,811 -
* Routemaster buses were not sampled in 2008
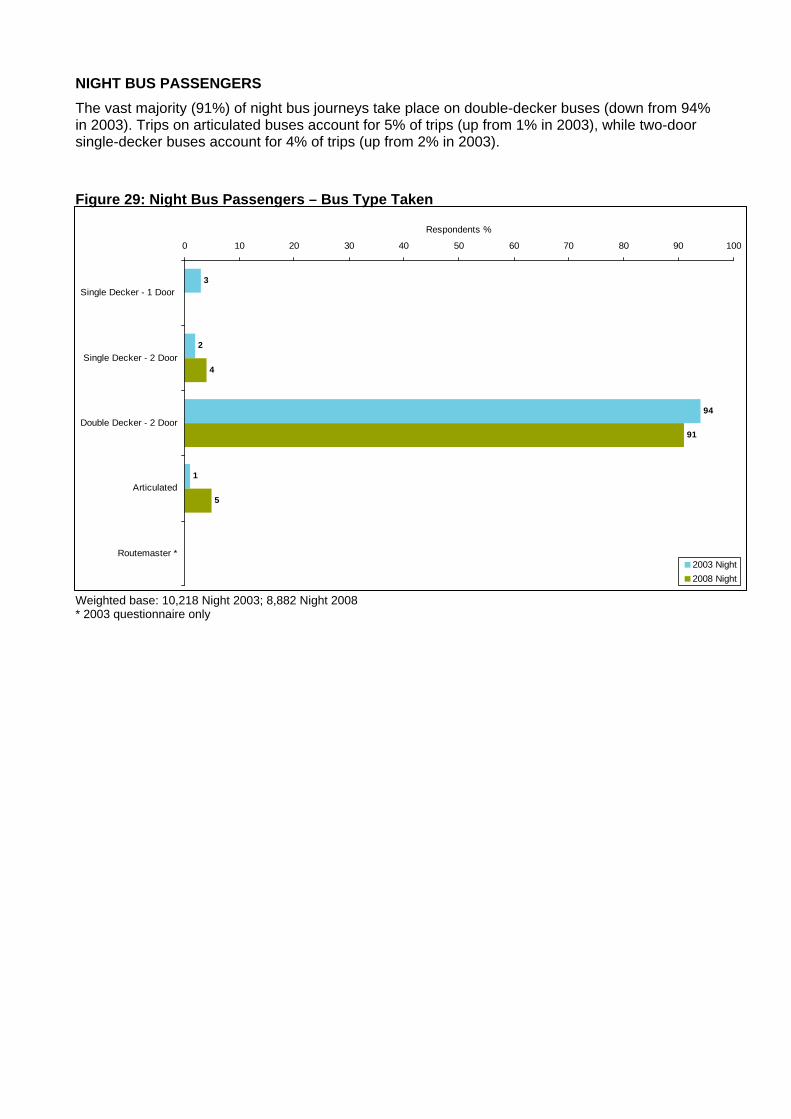
NIGHT BUS PASSENGERS The vast majority (91%) of night bus journeys take place on double-decker buses (down from 94% in 2003). Trips on articulated buses account for 5% of trips (up from 1% in 2003), while two-door single-decker buses account for 4% of trips (up from 2% in 2003).
Figure 29: Night Bus Passengers – Bus Type Taken
Weighted base: 10,218 Night 2003; 8,882 Night 2008 * 2003 questionnaire only
3
2
94
1
4
91
5
0 10 20 30 40 50 60 70 80 90 100
Single Decker - 1 Door
Single Decker - 2 Door
Double Decker - 2 Door
Articulated
Routemaster *
Respondents %
2003 Night2008 Night
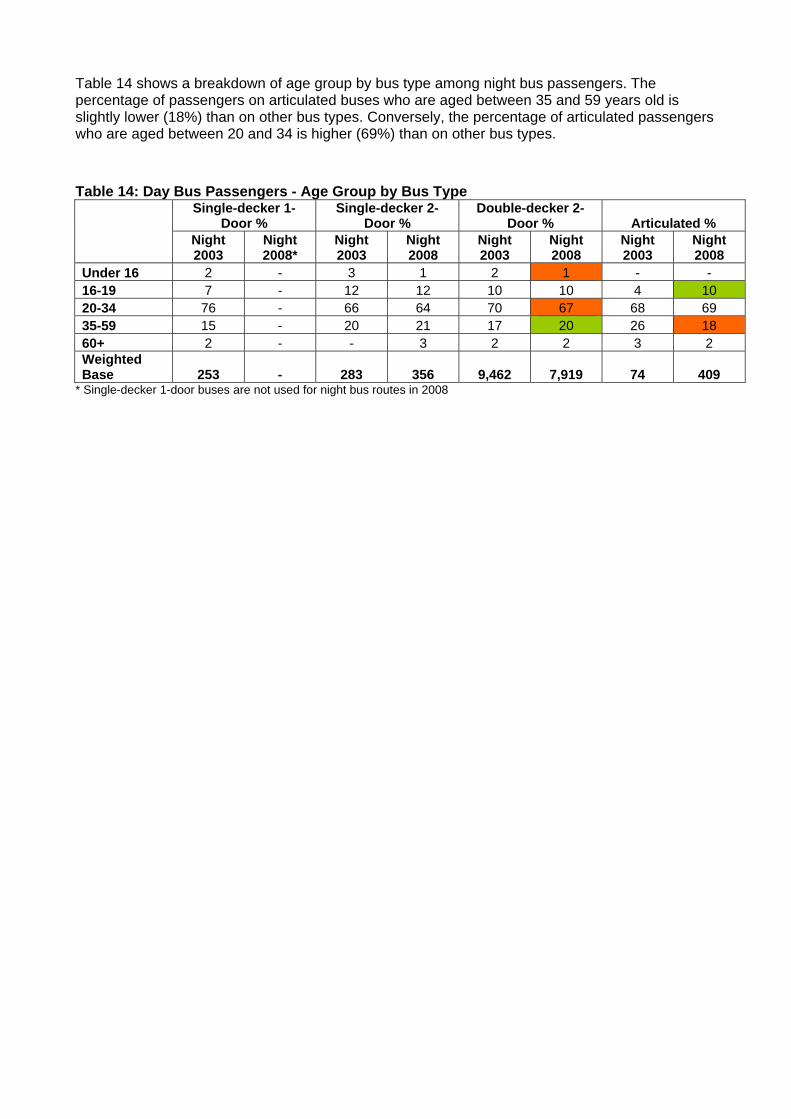
Table 14 shows a breakdown of age group by bus type among night bus passengers. The percentage of passengers on articulated buses who are aged between 35 and 59 years old is slightly lower (18%) than on other bus types. Conversely, the percentage of articulated passengers who are aged between 20 and 34 is higher (69%) than on other bus types.
Table 14: Day Bus Passengers - Age Group by Bus Type
Single-decker 1- Door %
Single-decker 2- Door %
Double-decker 2- Door % Articulated %
Night 2003
Night 2008*
Night 2003
Night 2008
Night 2003
Night 2008
Night 2003
Night 2008
Under 16 2 - 3 1 2 1 - - 16-19 7 - 12 12 10 10 4 10 20-34 76 - 66 64 70 67 68 69 35-59 15 - 20 21 17 20 26 18 60+ 2 - - 3 2 2 3 2 Weighted Base 253 - 283 356 9,462 7,919 74 409
* Single-decker 1-door buses are not used for night bus routes in 2008
6 FINDINGS: TICKET INFORMATION
6.1 KEY FINDINGS
The key findings with regard to ticket information relate to the impact of introducing Oyster Pay As You Go and free tickets for young people as well as the impact of the introduction of cashless buses in central locations.
Around a quarter of bus passengers now use Oyster ‘Pay As You Go’ (PAYG) (24% of day bus passengers and 28% of night bus passengers) and this has clearly led to the fall in the use of cash – now used by only 2% of day bus passengers and by 3% of night bus passengers. This is consistent with findings from the Greater London Bus Passenger Survey which shows that 1.7% of bus passengers use a cash to pay for their fare.11
There has also been a decline in the use of bus passes to 17% for day bus passengers (down from 46% 2003) and 18% for night bus passengers (down from 44% in 2003); this has coincided with an increase in the use of Travelcards to 35% among day bus passengers (up from 22% in 2003) and 43% among night bus passengers (up from 34% in 2003).
11 Greater London Bus Passenger Survey Quarter 71 Report published by MVA
6.2 TICKET TYPE
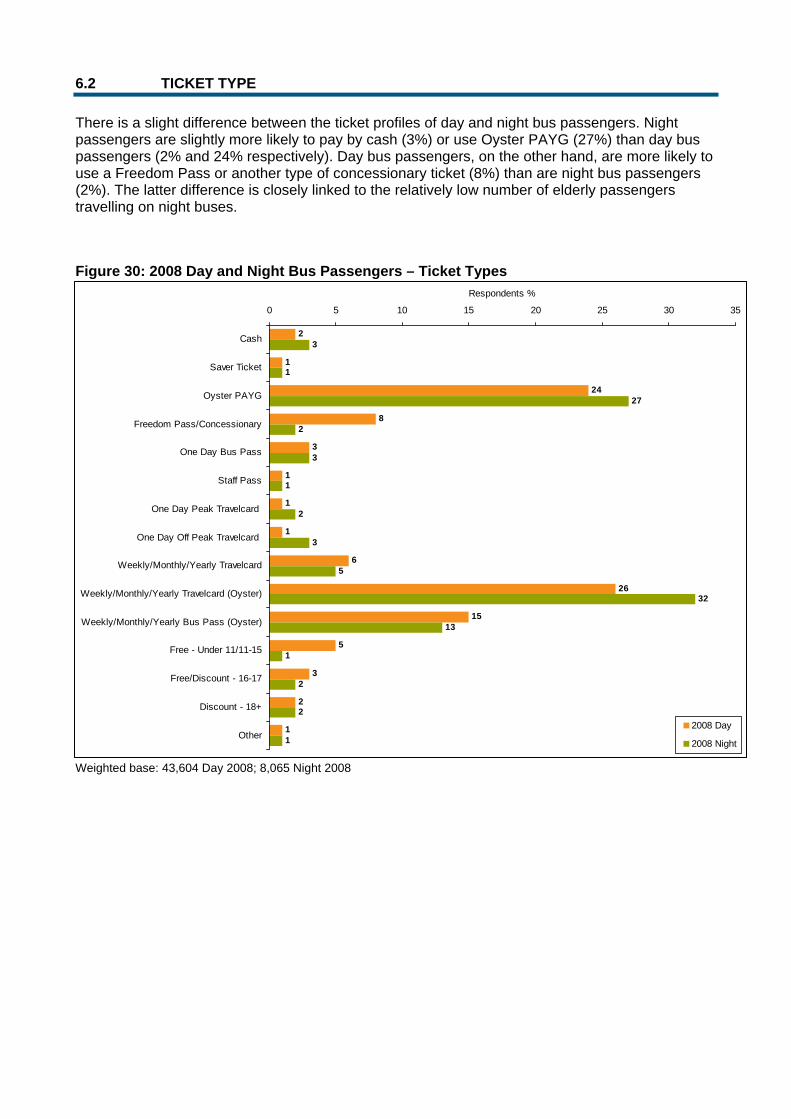
There is a slight difference between the ticket profiles of day and night bus passengers. Night passengers are slightly more likely to pay by cash (3%) or use Oyster PAYG (27%) than day bus passengers (2% and 24% respectively). Day bus passengers, on the other hand, are more likely to use a Freedom Pass or another type of concessionary ticket (8%) than are night bus passengers (2%). The latter difference is closely linked to the relatively low number of elderly passengers travelling on night buses.
Figure 30: 2008 Day and Night Bus Passengers – Ticket Types
Weighted base: 43,604 Day 2008; 8,065 Night 2008
2
1
24
8
3
1
1
1
6
26
15
5
3
2
1
3
1
27
2
3
1
2
3
5
32
13
1
2
2
1
0 5 10 15 20 25 30 35
Cash
Saver Ticket
Oyster PAYG
Freedom Pass/Concessionary
One Day Bus Pass
Staff Pass
One Day Peak Travelcard
One Day Off Peak Travelcard
Weekly/Monthly/Yearly Travelcard
Weekly/Monthly/Yearly Travelcard (Oyster)
Weekly/Monthly/Yearly Bus Pass (Oyster)
Free - Under 11/11-15
Free/Discount - 16-17
Discount - 18+
Other
Respondents %
2008 Day
2008 Night
6.3 TICKET TYPE (GROUPED)
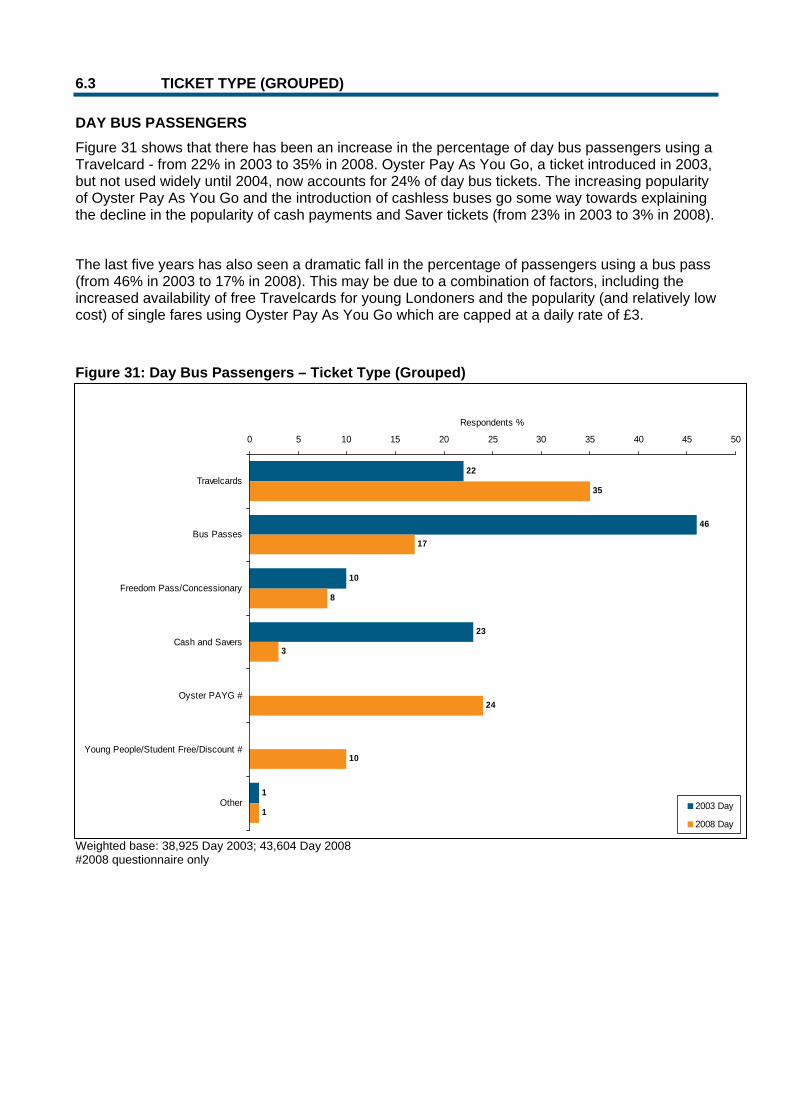
DAY BUS PASSENGERS Figure 31 shows that there has been an increase in the percentage of day bus passengers using a Travelcard - from 22% in 2003 to 35% in 2008. Oyster Pay As You Go, a ticket introduced in 2003, but not used widely until 2004, now accounts for 24% of day bus tickets. The increasing popularity of Oyster Pay As You Go and the introduction of cashless buses go some way towards explaining the decline in the popularity of cash payments and Saver tickets (from 23% in 2003 to 3% in 2008).
The last five years has also seen a dramatic fall in the percentage of passengers using a bus pass (from 46% in 2003 to 17% in 2008). This may be due to a combination of factors, including the increased availability of free Travelcards for young Londoners and the popularity (and relatively low cost) of single fares using Oyster Pay As You Go which are capped at a daily rate of £3.
Figure 31: Day Bus Passengers – Ticket Type (Grouped)
Weighted base: 38,925 Day 2003; 43,604 Day 2008 #2008 questionnaire only
22
46
10
23
1
35
17
8
3
24
10
1
0 5 10 15 20 25 30 35 40 45 50
Travelcards
Bus Passes
Freedom Pass/Concessionary
Cash and Savers
Oyster PAYG #
Young People/Student Free/Discount #
Other
Respondents %
2003 Day
2008 Day
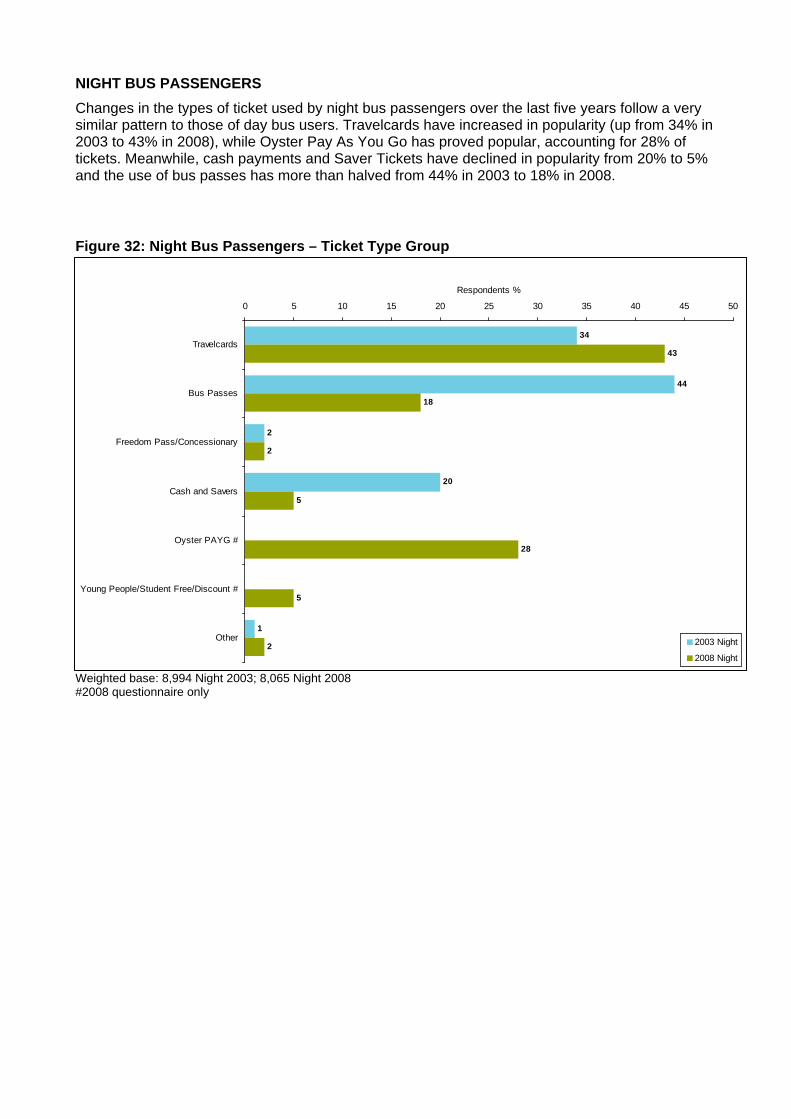
NIGHT BUS PASSENGERS Changes in the types of ticket used by night bus passengers over the last five years follow a very similar pattern to those of day bus users. Travelcards have increased in popularity (up from 34% in 2003 to 43% in 2008), while Oyster Pay As You Go has proved popular, accounting for 28% of tickets. Meanwhile, cash payments and Saver Tickets have declined in popularity from 20% to 5% and the use of bus passes has more than halved from 44% in 2003 to 18% in 2008.
Figure 32: Night Bus Passengers – Ticket Type Group
Weighted base: 8,994 Night 2003; 8,065 Night 2008 #2008 questionnaire only
34
44
2
20
1
43
18
2
5
28
5
2
0 5 10 15 20 25 30 35 40 45 50
Travelcards
Bus Passes
Freedom Pass/Concessionary
Cash and Savers
Oyster PAYG #
Young People/Student Free/Discount #
Other
Respondents %
2003 Night
2008 Night
7 FINDINGS: TRAVEL BEHAVIOUR
7.1 KEY FINDINGS
Bus passengers are now slightly less likely to be frequent users than they were five years ago: 55% of day passengers take any London bus at least five days a week compared with 58% in 2003. On night services, 54% of passengers are frequent travellers, down from 56% five years ago.
Bus passengers make far more use of the London Underground and DLR than they did five years ago. Just under a third (31%) of day bus passengers and 44% of night bus passengers are frequent users of the London Underground/DLR. The 2003 figures were 20% and 33% for day and bus passengers, respectively. Mainline train usage has also increased slightly among bus passengers; 18% of day bus passengers (up from 14%) and 17% of night bus passengers (up from 13%) use the Underground or DLR at least five days a week.
Car/van usage has increased slightly among day bus passengers. The percentage of day bus passengers who are frequent car/van users has increased from 13% to 14% whilst the percentage who use a car less often than once a month has decreased from 16% to 13%, and the percentage who have not used a car in the last three months has fallen by a percentage point to 32%.
The percentage of households who own at least one car is down among both day bus passengers (from 49% in 2003 to 47%) and night bus passengers (from 38% in 2003 to 35%). Similarly, the percentage of passengers who have access to car which they could use instead of the bus is lower than was the case five years ago (down from 26% to 23% among day bus passengers and down from 19% to 17% among night bus passengers).
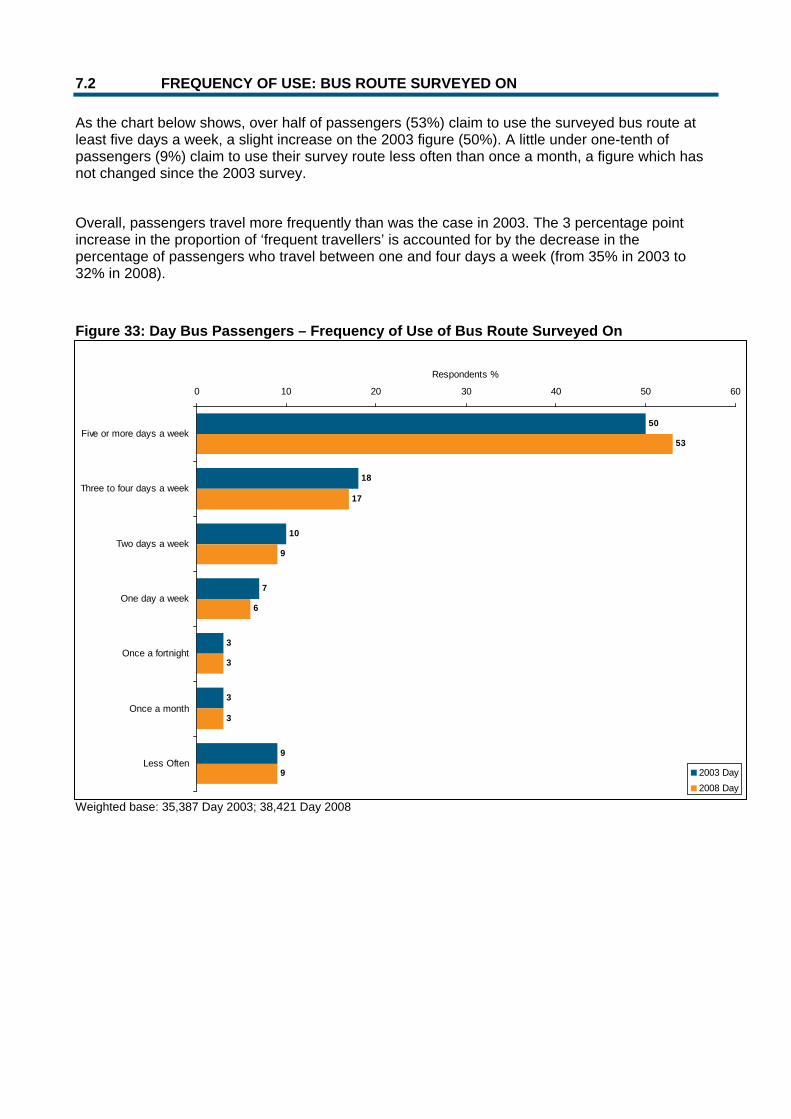
7.2 FREQUENCY OF USE: BUS ROUTE SURVEYED ON
As the chart below shows, over half of passengers (53%) claim to use the surveyed bus route at least five days a week, a slight increase on the 2003 figure (50%). A little under one-tenth of passengers (9%) claim to use their survey route less often than once a month, a figure which has not changed since the 2003 survey.
Overall, passengers travel more frequently than was the case in 2003. The 3 percentage point increase in the proportion of ‘frequent travellers’ is accounted for by the decrease in the percentage of passengers who travel between one and four days a week (from 35% in 2003 to 32% in 2008).
Figure 33: Day Bus Passengers – Frequency of Use of Bus Route Surveyed On
Weighted base: 35,387 Day 2003; 38,421 Day 2008
50
18
10
7
3
3
9
53
17
9
6
3
3
9
0 10 20 30 40 50 60
Five or more days a week
Three to four days a week
Two days a week
One day a week
Once a fortnight
Once a month
Less Often
Respondents %
2003 Day2008 Day
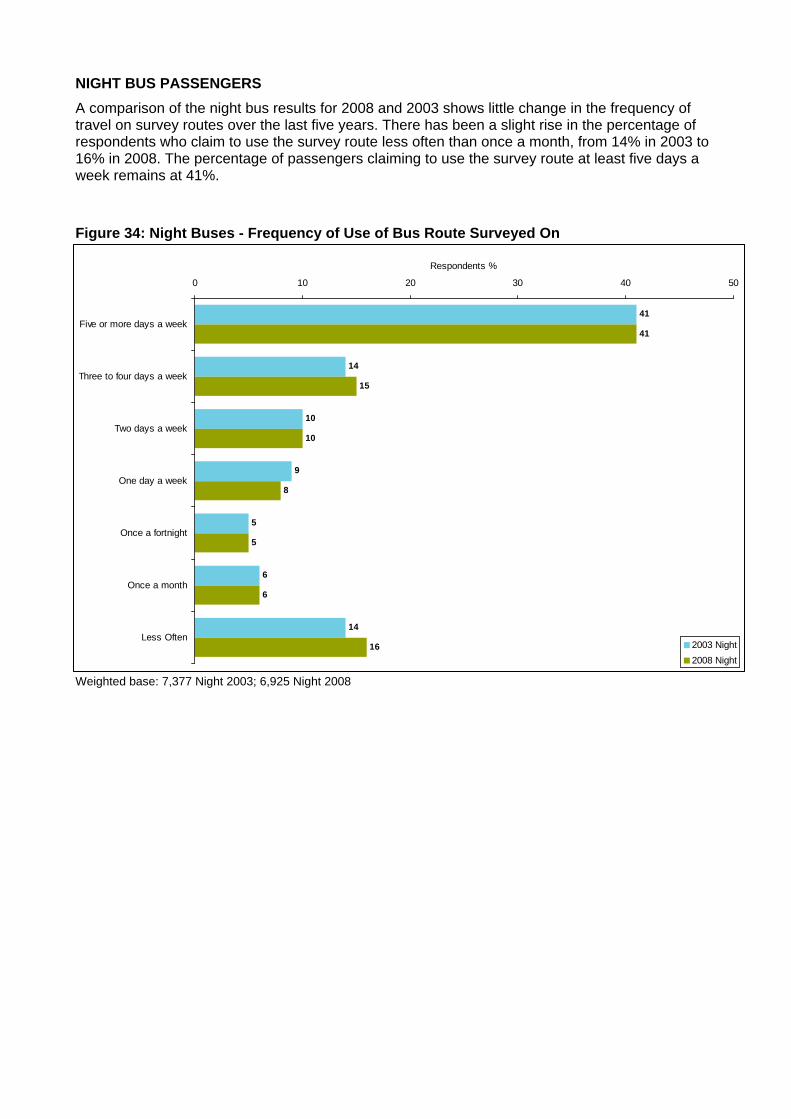
NIGHT BUS PASSENGERS A comparison of the night bus results for 2008 and 2003 shows little change in the frequency of travel on survey routes over the last five years. There has been a slight rise in the percentage of respondents who claim to use the survey route less often than once a month, from 14% in 2003 to 16% in 2008. The percentage of passengers claiming to use the survey route at least five days a week remains at 41%.
Figure 34: Night Buses - Frequency of Use of Bus Route Surveyed On
Weighted base: 7,377 Night 2003; 6,925 Night 2008
41
14
10
9
5
6
14
41
15
10
8
5
6
16
0 10 20 30 40 50
Five or more days a week
Three to four days a week
Two days a week
One day a week
Once a fortnight
Once a month
Less Often
Respondents %
2003 Night2008 Night
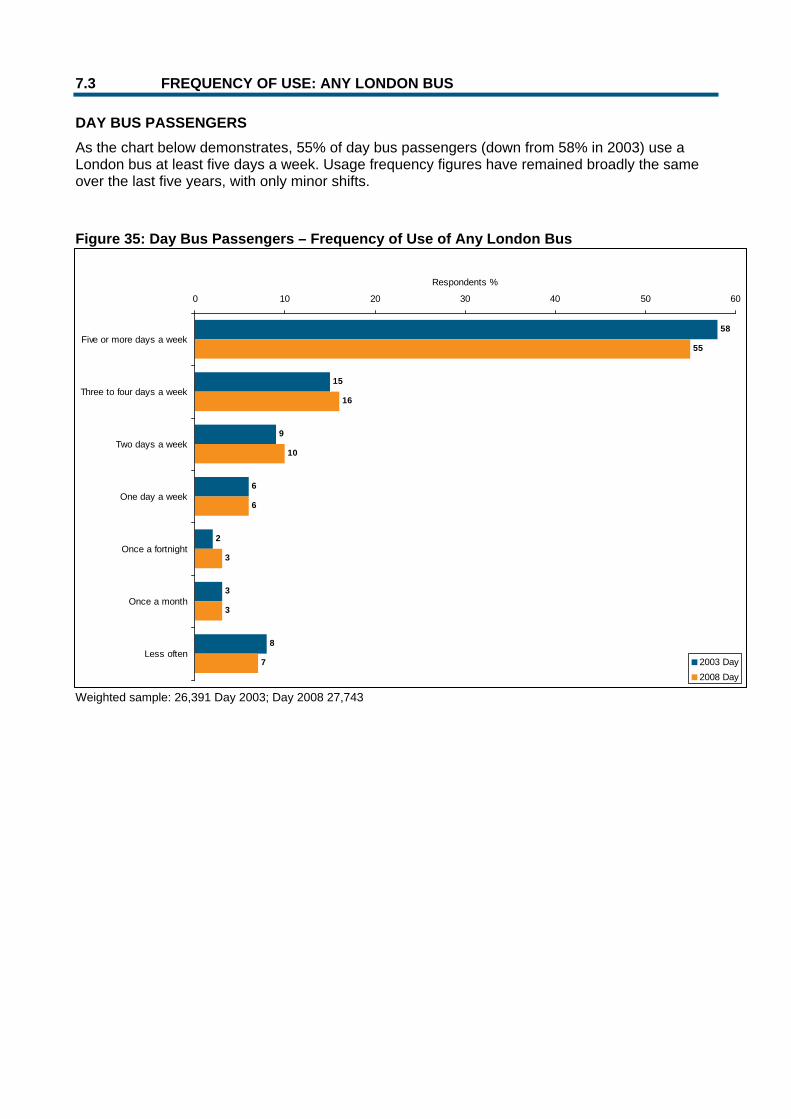
7.3 FREQUENCY OF USE: ANY LONDON BUS
DAY BUS PASSENGERS As the chart below demonstrates, 55% of day bus passengers (down from 58% in 2003) use a London bus at least five days a week. Usage frequency figures have remained broadly the same over the last five years, with only minor shifts.
Figure 35: Day Bus Passengers – Frequency of Use of Any London Bus
Weighted sample: 26,391 Day 2003; Day 2008 27,743
58
15
9
6
2
3
8
55
16
10
6
3
3
7
0 10 20 30 40 50 60
Five or more days a week
Three to four days a week
Two days a week
One day a week
Once a fortnight
Once a month
Less often
Respondents %
2003 Day2008 Day
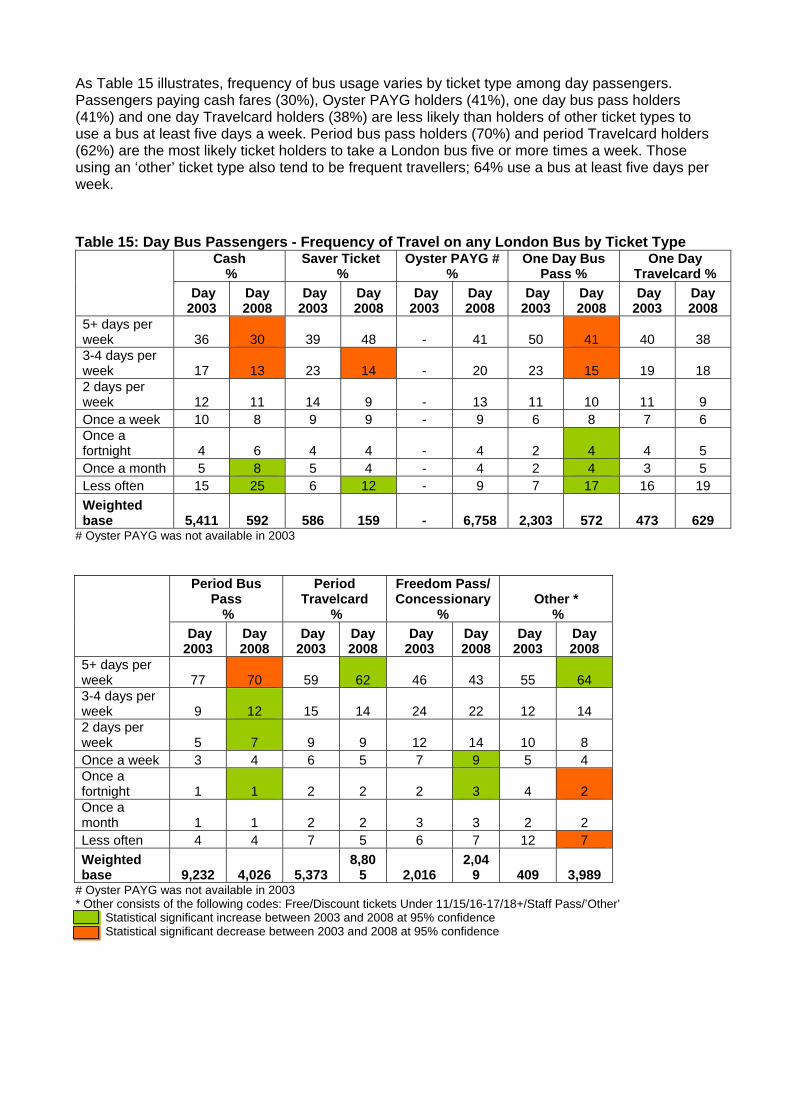
As Table 15 illustrates, frequency of bus usage varies by ticket type among day passengers. Passengers paying cash fares (30%), Oyster PAYG holders (41%), one day bus pass holders (41%) and one day Travelcard holders (38%) are less likely than holders of other ticket types to use a bus at least five days a week. Period bus pass holders (70%) and period Travelcard holders (62%) are the most likely ticket holders to take a London bus five or more times a week. Those using an ‘other’ ticket type also tend to be frequent travellers; 64% use a bus at least five days per week.
Table 15: Day Bus Passengers - Frequency of Travel on any London Bus by Ticket Type
Cash %
Saver Ticket %
Oyster PAYG # %
One Day Bus Pass %
One Day Travelcard %
Day 2003
Day 2008
Day 2003
Day 2008
Day 2003
Day 2008
Day 2003
Day 2008
Day 2003
Day 2008
5+ days per week 36 30 39 48 - 41 50 41 40 38 3-4 days per week 17 13 23 14 - 20 23 15 19 18 2 days per week 12 11 14 9 - 13 11 10 11 9 Once a week 10 8 9 9 - 9 6 8 7 6 Once a fortnight 4 6 4 4 - 4 2 4 4 5 Once a month 5 8 5 4 - 4 2 4 3 5 Less often 15 25 6 12 - 9 7 17 16 19 Weighted base 5,411 592 586 159 - 6,758 2,303 572 473 629
# Oyster PAYG was not available in 2003
Period Bus Pass
%
Period Travelcard
%
Freedom Pass/ Concessionary
% Other *
% Day 2003
Day 2008
Day 2003
Day 2008
Day 2003
Day 2008
Day 2003
Day 2008
5+ days per week 77 70 59 62 46 43 55 64 3-4 days per week 9 12 15 14 24 22 12 14 2 days per week 5 7 9 9 12 14 10 8 Once a week 3 4 6 5 7 9 5 4 Once a fortnight 1 1 2 2 2 3 4 2 Once a month 1 1 2 2 3 3 2 2 Less often 4 4 7 5 6 7 12 7 Weighted base 9,232 4,026 5,373
8,805 2,016
2,049 409 3,989
# Oyster PAYG was not available in 2003 * Other consists of the following codes: Free/Discount tickets Under 11/15/16-17/18+/Staff Pass/’Other’ Statistical significant increase between 2003 and 2008 at 95% confidence Statistical significant decrease between 2003 and 2008 at 95% confidence
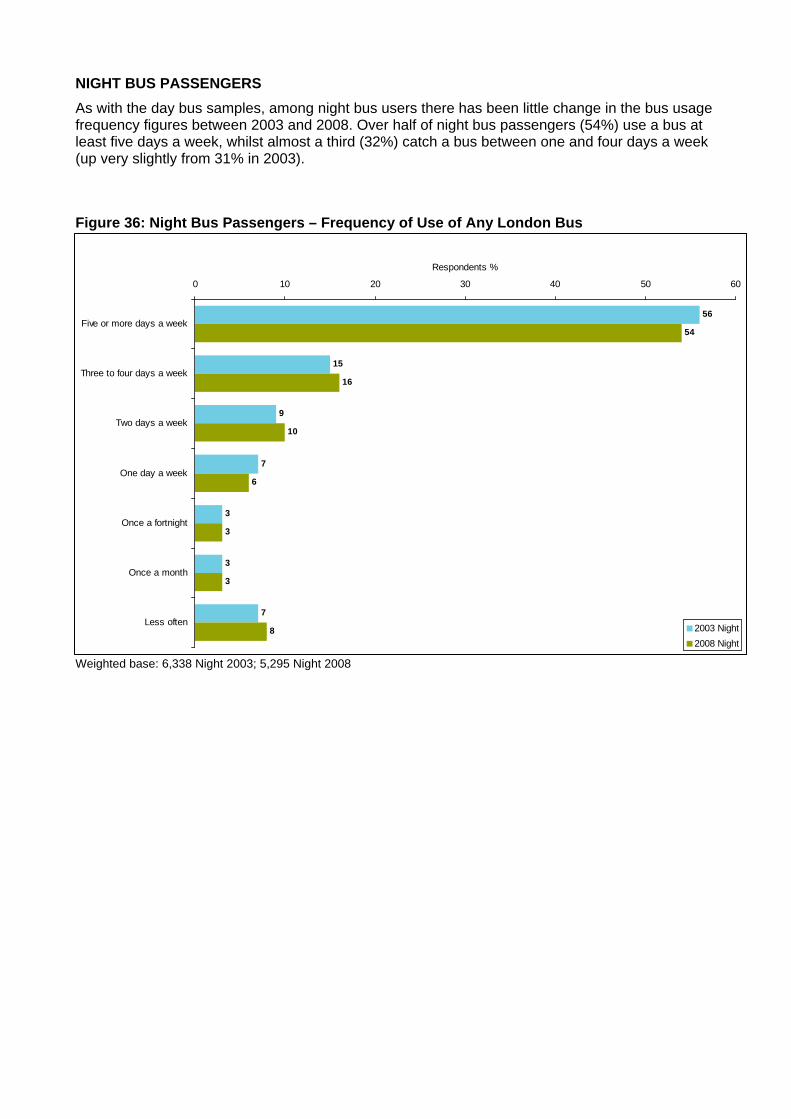
NIGHT BUS PASSENGERS As with the day bus samples, among night bus users there has been little change in the bus usage frequency figures between 2003 and 2008. Over half of night bus passengers (54%) use a bus at least five days a week, whilst almost a third (32%) catch a bus between one and four days a week (up very slightly from 31% in 2003).
Figure 36: Night Bus Passengers – Frequency of Use of Any London Bus
Weighted base: 6,338 Night 2003; 5,295 Night 2008
56
15
9
7
3
3
7
54
16
10
6
3
3
8
0 10 20 30 40 50 60
Five or more days a week
Three to four days a week
Two days a week
One day a week
Once a fortnight
Once a month
Less often
Respondents %
2003 Night2008 Night
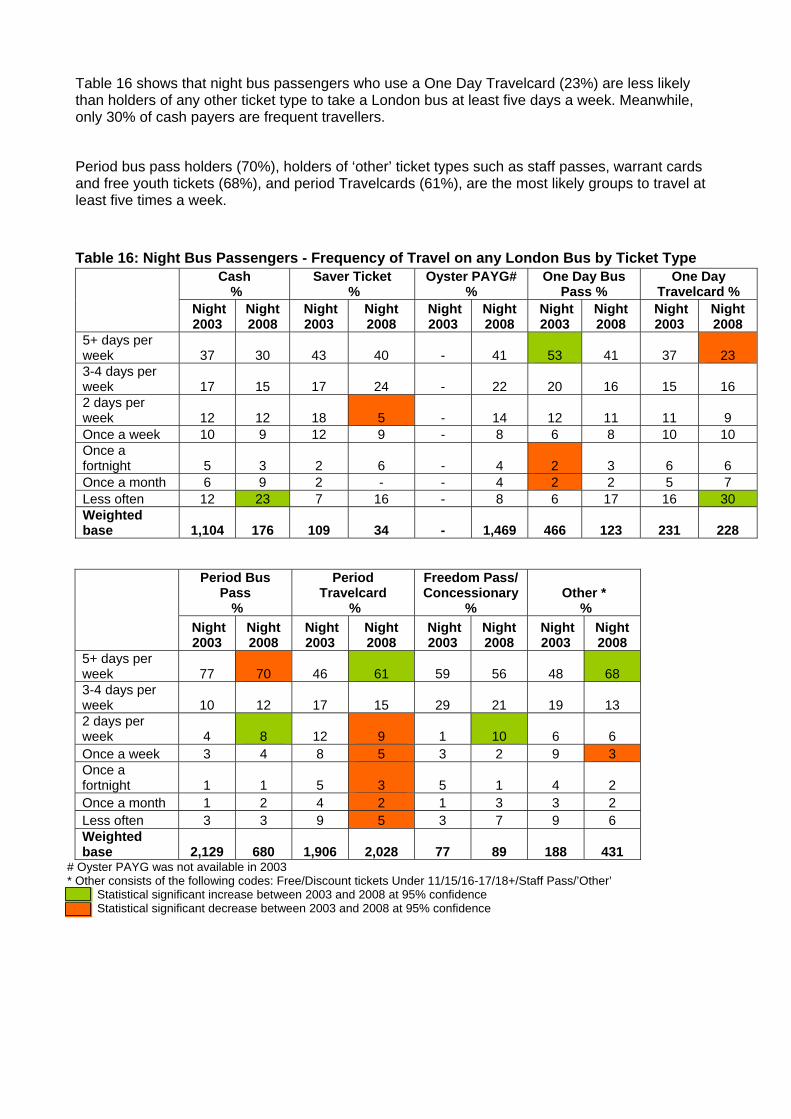
Table 16 shows that night bus passengers who use a One Day Travelcard (23%) are less likely than holders of any other ticket type to take a London bus at least five days a week. Meanwhile, only 30% of cash payers are frequent travellers.
Period bus pass holders (70%), holders of ‘other’ ticket types such as staff passes, warrant cards and free youth tickets (68%), and period Travelcards (61%), are the most likely groups to travel at least five times a week.
Table 16: Night Bus Passengers - Frequency of Travel on any London Bus by Ticket Type
Period Bus Pass
%
Period Travelcard
%
Freedom Pass/ Concessionary
% Other *
% Night 2003
Night 2008
Night 2003
Night 2008
Night 2003
Night 2008
Night 2003
Night 2008
5+ days per week 77 70 46 61 59 56 48 68 3-4 days per week 10 12 17 15 29 21 19 13 2 days per week 4 8 12 9 1 10 6 6 Once a week 3 4 8 5 3 2 9 3 Once a fortnight 1 1 5 3 5 1 4 2 Once a month 1 2 4 2 1 3 3 2 Less often 3 3 9 5 3 7 9 6 Weighted base 2,129 680 1,906 2,028 77 89 188 431
# Oyster PAYG was not available in 2003 * Other consists of the following codes: Free/Discount tickets Under 11/15/16-17/18+/Staff Pass/’Other’ Statistical significant increase between 2003 and 2008 at 95% confidence Statistical significant decrease between 2003 and 2008 at 95% confidence
Cash %
Saver Ticket %
Oyster PAYG# %
One Day Bus Pass %
One Day Travelcard %
Night 2003
Night 2008
Night 2003
Night 2008
Night 2003
Night 2008
Night 2003
Night 2008
Night 2003
Night 2008
5+ days per week 37 30 43 40 - 41 53 41 37 23 3-4 days per week 17 15 17 24 - 22 20 16 15 16 2 days per week 12 12 18 5 - 14 12 11 11 9 Once a week 10 9 12 9 - 8 6 8 10 10 Once a fortnight 5 3 2 6 - 4 2 3 6 6 Once a month 6 9 2 - - 4 2 2 5 7 Less often 12 23 7 16 - 8 6 17 16 30 Weighted base 1,104 176 109 34 - 1,469 466 123 231 228
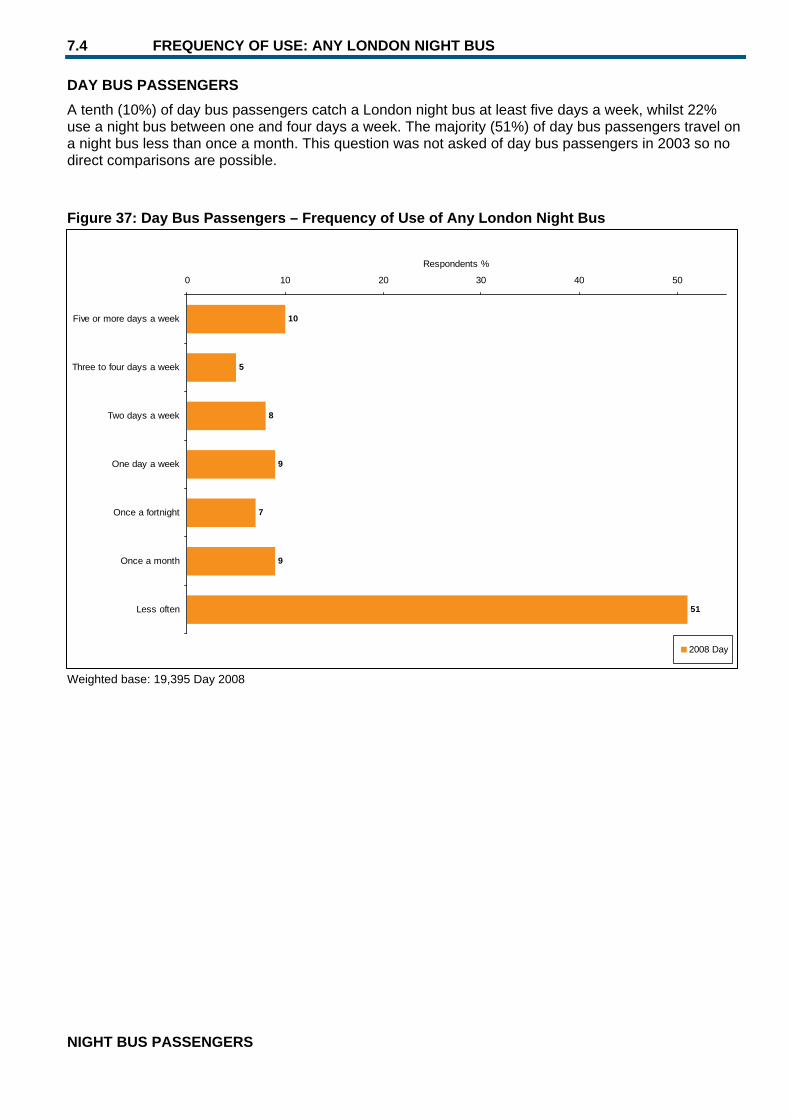
7.4 FREQUENCY OF USE: ANY LONDON NIGHT BUS
DAY BUS PASSENGERS A tenth (10%) of day bus passengers catch a London night bus at least five days a week, whilst 22% use a night bus between one and four days a week. The majority (51%) of day bus passengers travel on a night bus less than once a month. This question was not asked of day bus passengers in 2003 so no direct comparisons are possible.
Figure 37: Day Bus Passengers – Frequency of Use of Any London Night Bus
Weighted base: 19,395 Day 2008
NIGHT BUS PASSENGERS
10
5
8
9
7
9
51
0 10 20 30 40 50
Five or more days a week
Three to four days a week
Two days a week
One day a week
Once a fortnight
Once a month
Less often
Respondents %
2008 Day
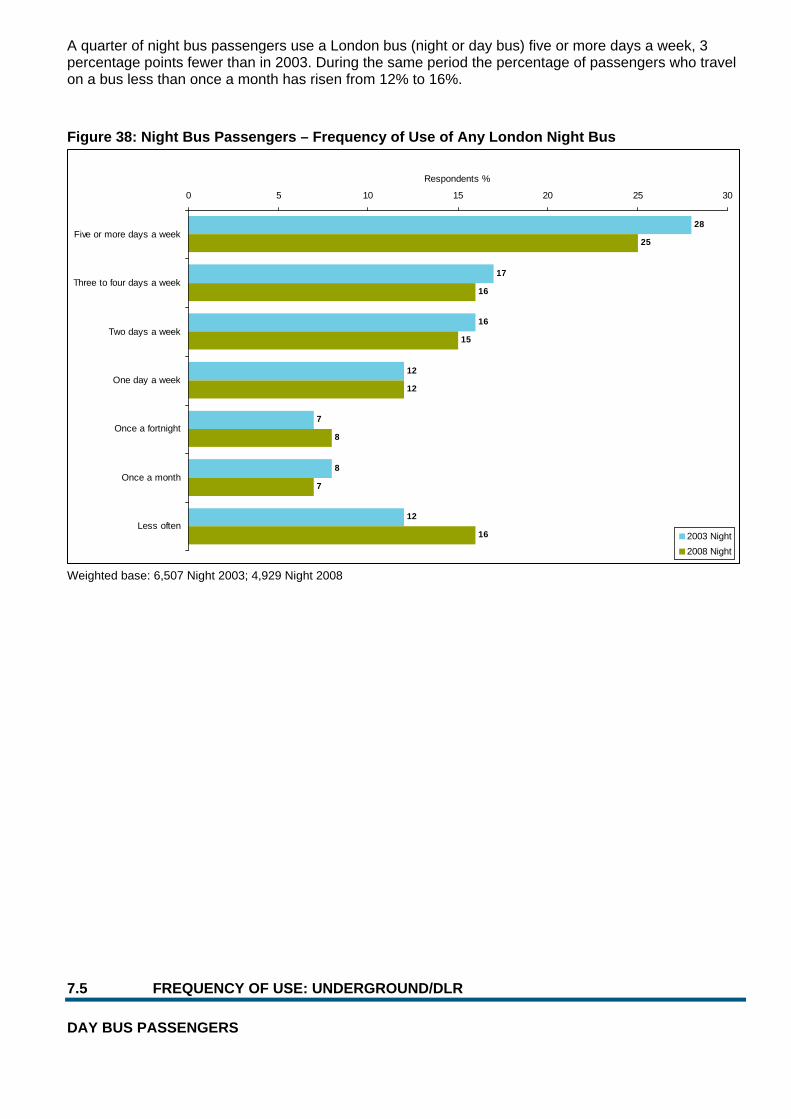
28
17
16
12
7
8
12
25
16
15
12
8
7
16
0 5 10 15 20 25 30
Five or more days a week
Three to four days a week
Two days a week
One day a week
Once a fortnight
Once a month
Less often
Respondents %
2003 Night2008 Night
A quarter of night bus passengers use a London bus (night or day bus) five or more days a week, 3 percentage points fewer than in 2003. During the same period the percentage of passengers who travel on a bus less than once a month has risen from 12% to 16%.
Figure 38: Night Bus Passengers – Frequency of Use of Any London Night Bus
Weighted base: 6,507 Night 2003; 4,929 Night 2008
7.5 FREQUENCY OF USE: UNDERGROUND/DLR
DAY BUS PASSENGERS
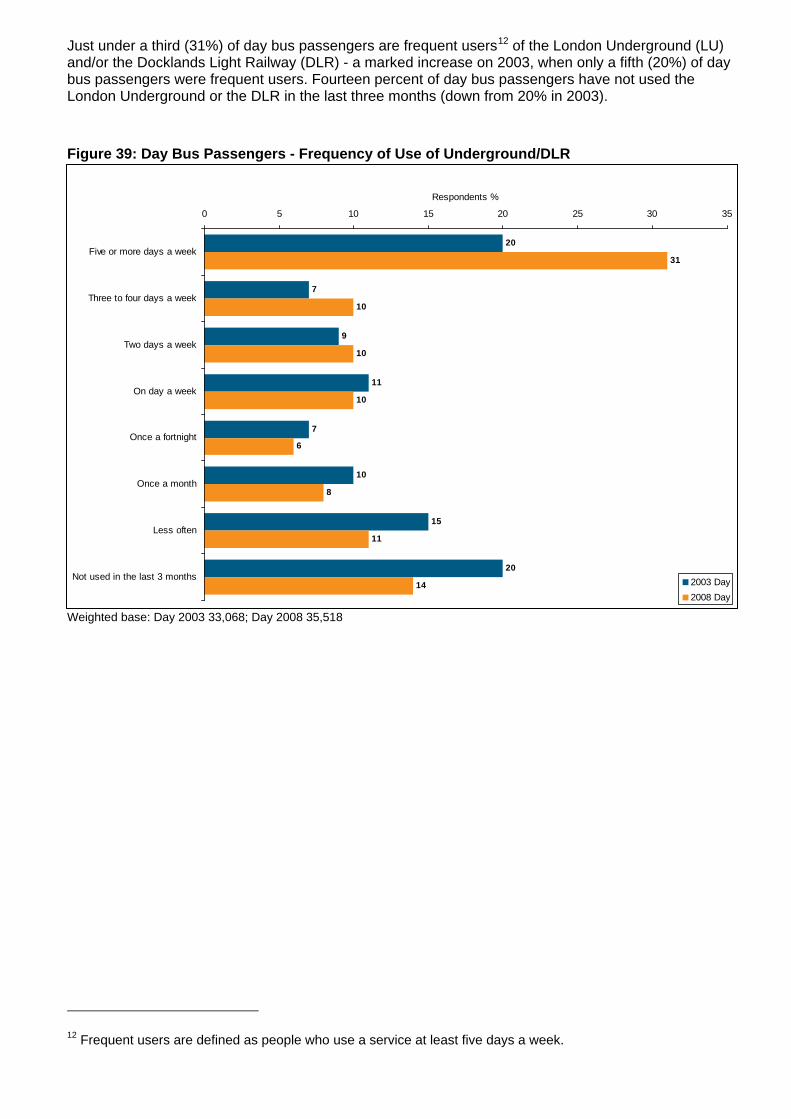
Just under a third (31%) of day bus passengers are frequent users12 of the London Underground (LU) and/or the Docklands Light Railway (DLR) - a marked increase on 2003, when only a fifth (20%) of day bus passengers were frequent users. Fourteen percent of day bus passengers have not used the London Underground or the DLR in the last three months (down from 20% in 2003).
Figure 39: Day Bus Passengers - Frequency of Use of Underground/DLR
Weighted base: Day 2003 33,068; Day 2008 35,518
12 Frequent users are defined as people who use a service at least five days a week.
20
7
9
11
7
10
15
20
31
10
10
10
6
8
11
14
0 5 10 15 20 25 30 35
Five or more days a week
Three to four days a week
Two days a week
On day a week
Once a fortnight
Once a month
Less often
Not used in the last 3 months
Respondents %
2003 Day2008 Day
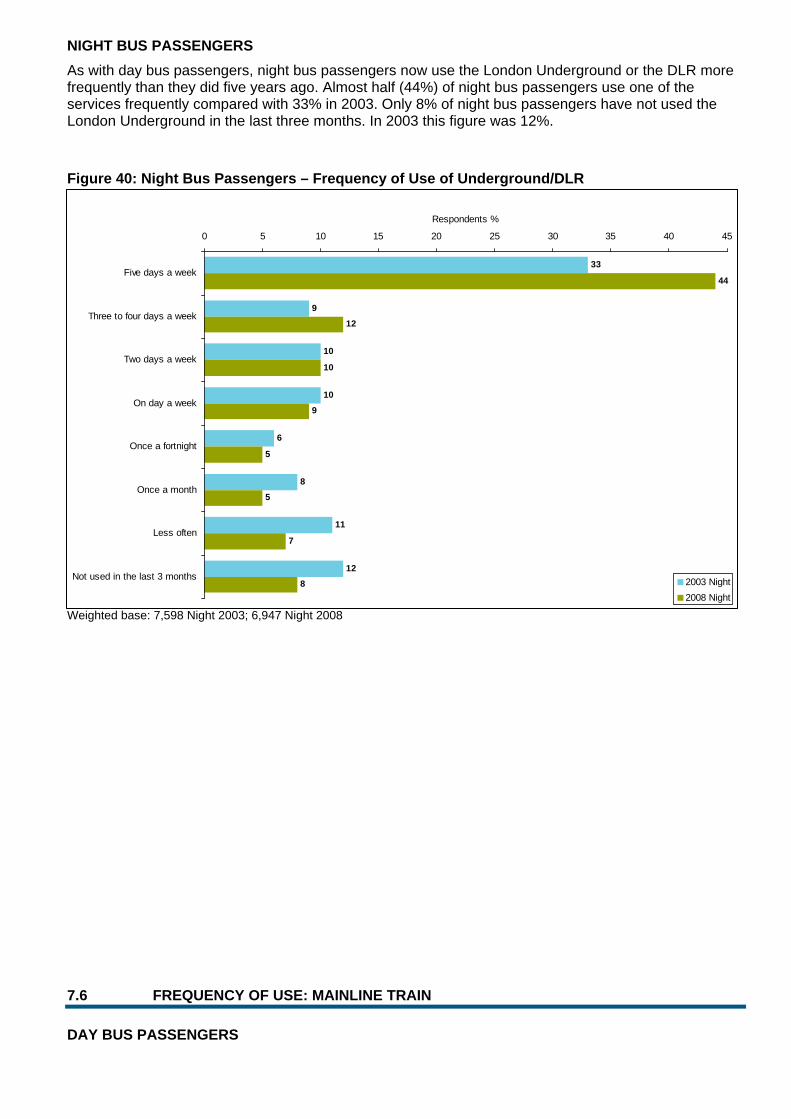
NIGHT BUS PASSENGERS As with day bus passengers, night bus passengers now use the London Underground or the DLR more frequently than they did five years ago. Almost half (44%) of night bus passengers use one of the services frequently compared with 33% in 2003. Only 8% of night bus passengers have not used the London Underground in the last three months. In 2003 this figure was 12%.
Figure 40: Night Bus Passengers – Frequency of Use of Underground/DLR
Weighted base: 7,598 Night 2003; 6,947 Night 2008
7.6 FREQUENCY OF USE: MAINLINE TRAIN
DAY BUS PASSENGERS
33
9
10
10
6
8
11
12
44
12
10
9
5
5
7
8
0 5 10 15 20 25 30 35 40 45
Five days a week
Three to four days a week
Two days a week
On day a week
Once a fortnight
Once a month
Less often
Not used in the last 3 months
Respondents %
2003 Night2008 Night
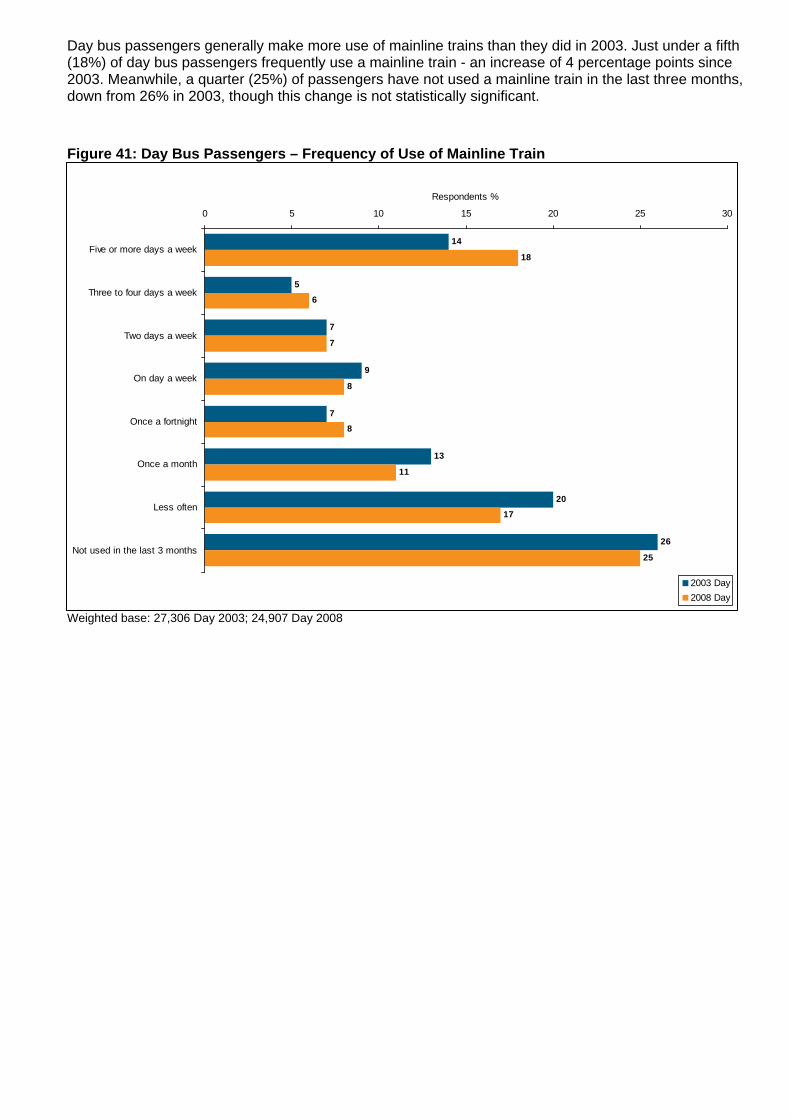
Day bus passengers generally make more use of mainline trains than they did in 2003. Just under a fifth (18%) of day bus passengers frequently use a mainline train - an increase of 4 percentage points since 2003. Meanwhile, a quarter (25%) of passengers have not used a mainline train in the last three months, down from 26% in 2003, though this change is not statistically significant.
Figure 41: Day Bus Passengers – Frequency of Use of Mainline Train
Weighted base: 27,306 Day 2003; 24,907 Day 2008
14
5
7
9
7
13
20
26
18
6
7
8
8
11
17
25
0 5 10 15 20 25 30
Five or more days a week
Three to four days a week
Two days a week
On day a week
Once a fortnight
Once a month
Less often
Not used in the last 3 months
Respondents %
2003 Day2008 Day
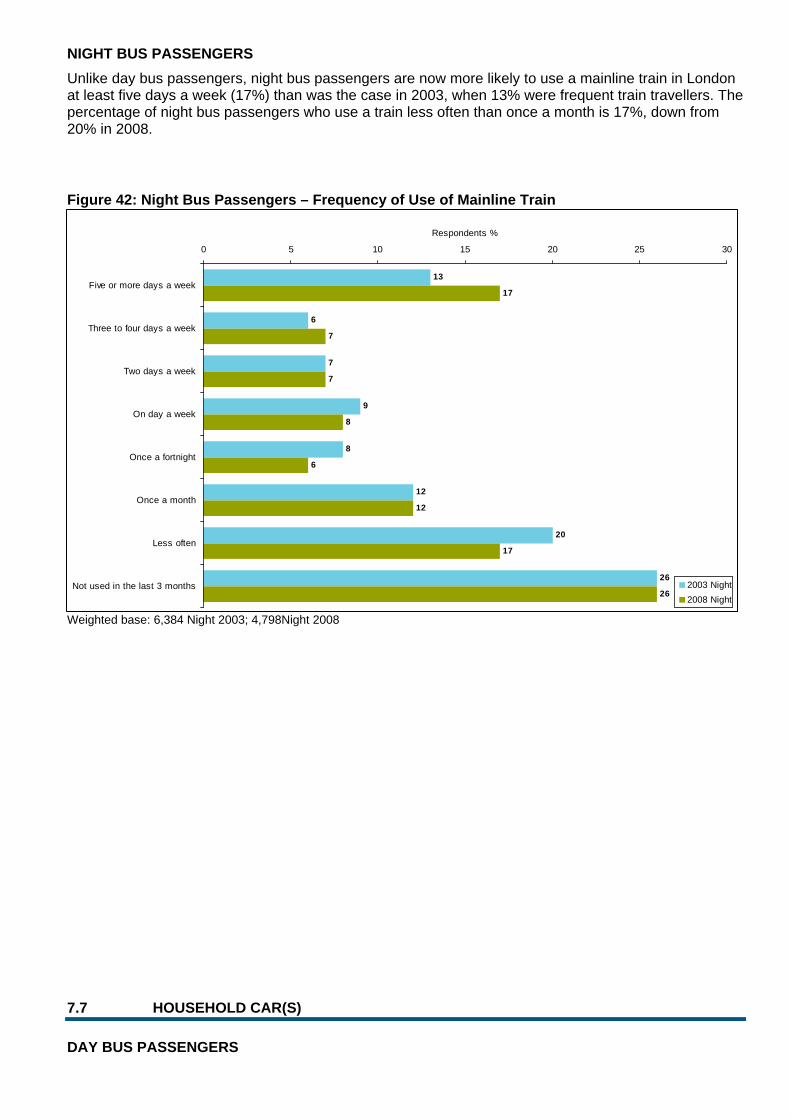
NIGHT BUS PASSENGERS Unlike day bus passengers, night bus passengers are now more likely to use a mainline train in London at least five days a week (17%) than was the case in 2003, when 13% were frequent train travellers. The percentage of night bus passengers who use a train less often than once a month is 17%, down from 20% in 2008.
Figure 42: Night Bus Passengers – Frequency of Use of Mainline Train
Weighted base: 6,384 Night 2003; 4,798Night 2008
7.7 HOUSEHOLD CAR(S)
DAY BUS PASSENGERS
13
6
7
9
8
12
20
26
17
7
7
8
6
12
17
26
0 5 10 15 20 25 30
Five or more days a week
Three to four days a week
Two days a week
On day a week
Once a fortnight
Once a month
Less often
Not used in the last 3 months
Respondents %
2003 Night2008 Night
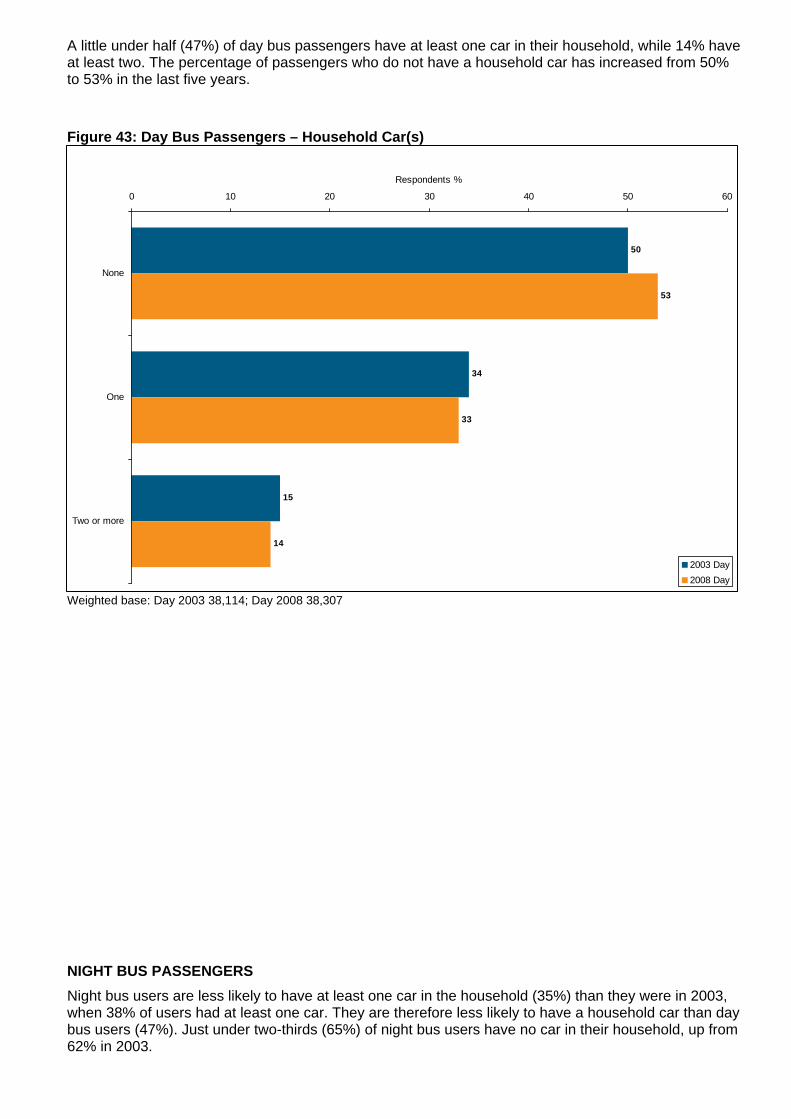
A little under half (47%) of day bus passengers have at least one car in their household, while 14% have at least two. The percentage of passengers who do not have a household car has increased from 50% to 53% in the last five years.
Figure 43: Day Bus Passengers – Household Car(s)
Weighted base: Day 2003 38,114; Day 2008 38,307
NIGHT BUS PASSENGERS Night bus users are less likely to have at least one car in the household (35%) than they were in 2003, when 38% of users had at least one car. They are therefore less likely to have a household car than day bus users (47%). Just under two-thirds (65%) of night bus users have no car in their household, up from 62% in 2003.
50
34
15
53
33
14
0 10 20 30 40 50 60
None
One
Two or more
Respondents %
2003 Day2008 Day
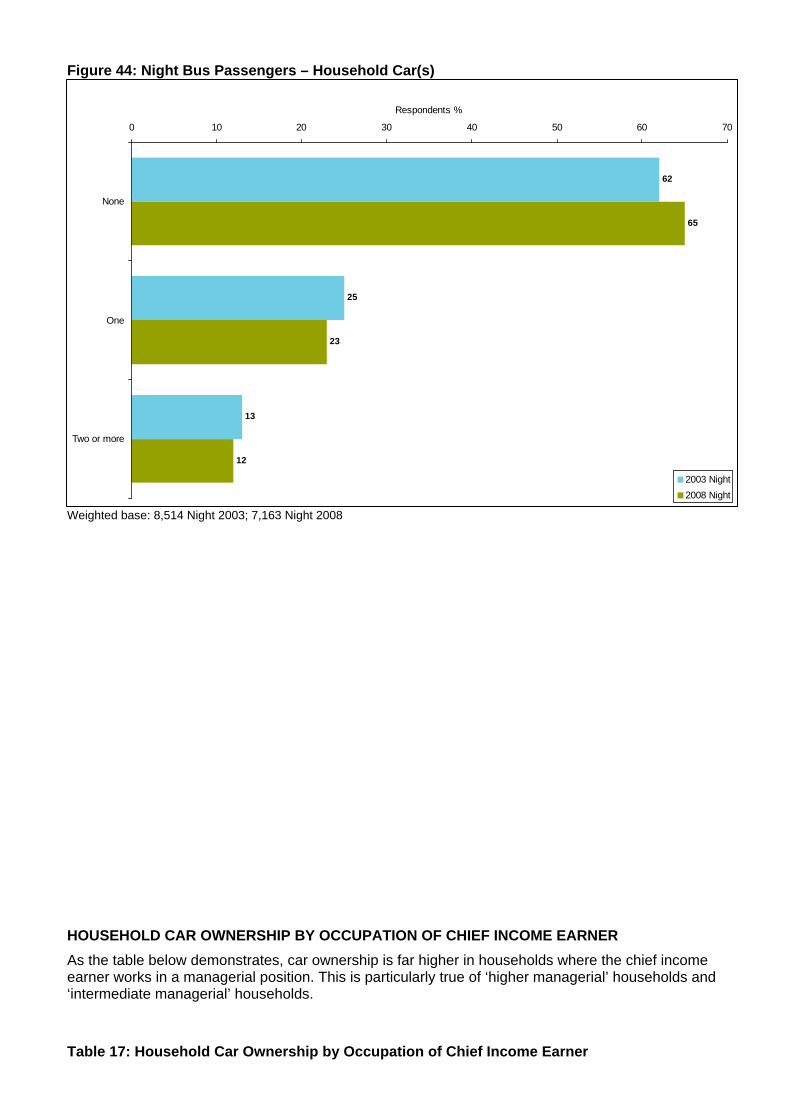
Figure 44: Night Bus Passengers – Household Car(s)
Weighted base: 8,514 Night 2003; 7,163 Night 2008
HOUSEHOLD CAR OWNERSHIP BY OCCUPATION OF CHIEF INCOME EARNER As the table below demonstrates, car ownership is far higher in households where the chief income earner works in a managerial position. This is particularly true of ‘higher managerial’ households and ‘intermediate managerial’ households.
Table 17: Household Car Ownership by Occupation of Chief Income Earner
62
25
13
65
23
12
0 10 20 30 40 50 60 70
None
One
Two or more
Respondents %
2003 Night2008 Night
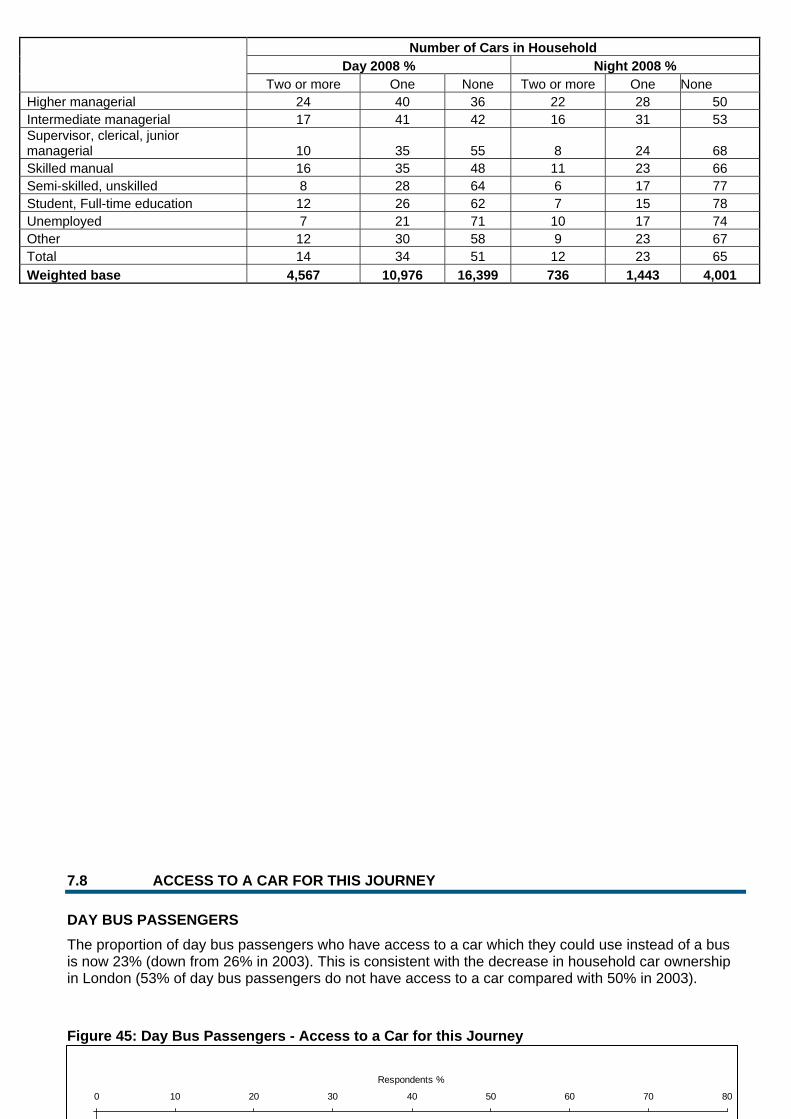
Number of Cars in Household Day 2008 % Night 2008 %
Two or more One None Two or more One None Higher managerial 24 40 36 22 28 50 Intermediate managerial 17 41 42 16 31 53 Supervisor, clerical, junior managerial 10 35 55 8 24 68 Skilled manual 16 35 48 11 23 66 Semi-skilled, unskilled 8 28 64 6 17 77 Student, Full-time education 12 26 62 7 15 78 Unemployed 7 21 71 10 17 74 Other 12 30 58 9 23 67 Total 14 34 51 12 23 65 Weighted base 4,567 10,976 16,399 736 1,443 4,001
7.8 ACCESS TO A CAR FOR THIS JOURNEY
DAY BUS PASSENGERS The proportion of day bus passengers who have access to a car which they could use instead of a bus is now 23% (down from 26% in 2003). This is consistent with the decrease in household car ownership in London (53% of day bus passengers do not have access to a car compared with 50% in 2003).
Figure 45: Day Bus Passengers - Access to a Car for this Journey
0 10 20 30 40 50 60 70 80
Respondents %
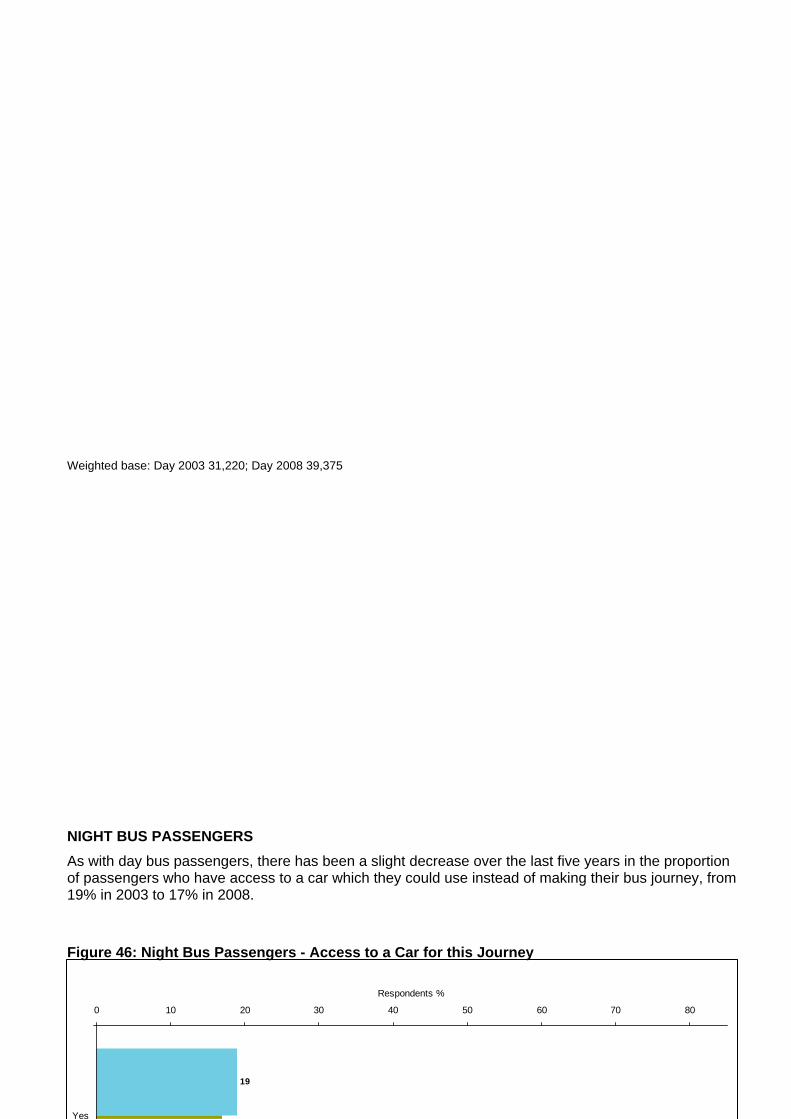
Weighted base: Day 2003 31,220; Day 2008 39,375
NIGHT BUS PASSENGERS As with day bus passengers, there has been a slight decrease over the last five years in the proportion of passengers who have access to a car which they could use instead of making their bus journey, from 19% in 2003 to 17% in 2008.
Figure 46: Night Bus Passengers - Access to a Car for this Journey
19
0 10 20 30 40 50 60 70 80
Yes
Respondents %
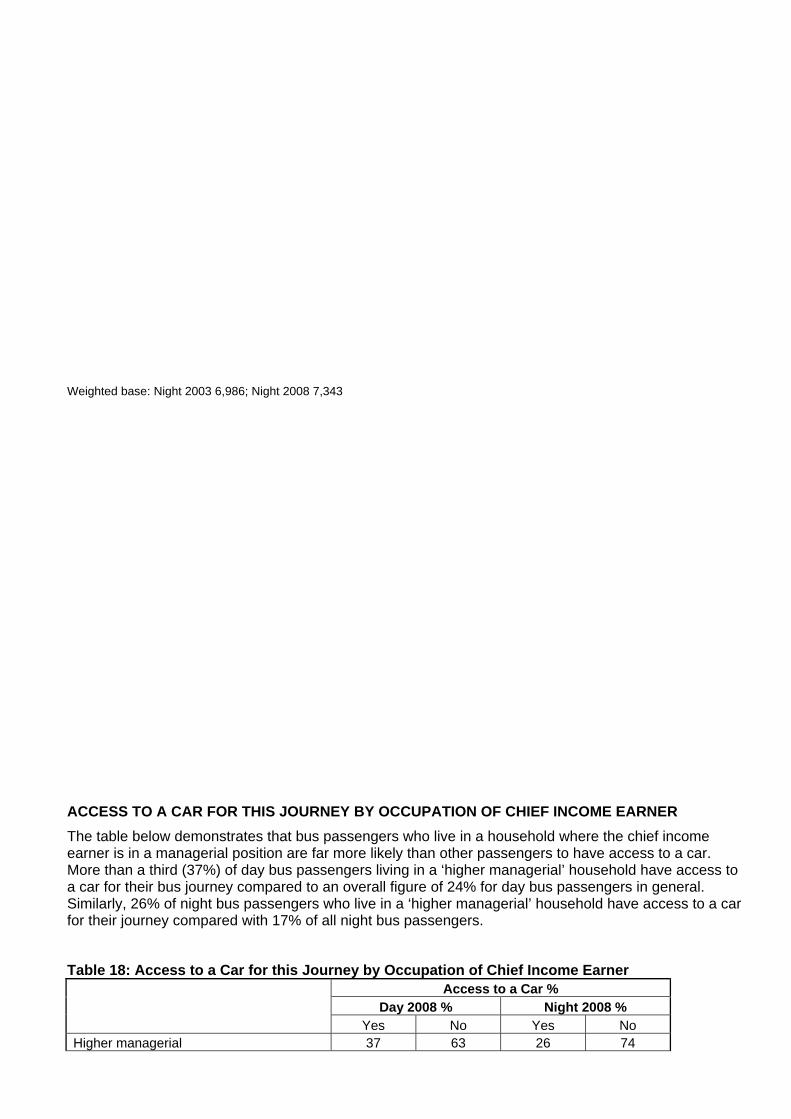
Weighted base: Night 2003 6,986; Night 2008 7,343
ACCESS TO A CAR FOR THIS JOURNEY BY OCCUPATION OF CHIEF INCOME EARNER The table below demonstrates that bus passengers who live in a household where the chief income earner is in a managerial position are far more likely than other passengers to have access to a car. More than a third (37%) of day bus passengers living in a ‘higher managerial’ household have access to a car for their bus journey compared to an overall figure of 24% for day bus passengers in general. Similarly, 26% of night bus passengers who live in a ‘higher managerial’ household have access to a car for their journey compared with 17% of all night bus passengers.
Table 18: Access to a Car for this Journey by Occupation of Chief Income Earner
Access to a Car % Day 2008 % Night 2008 %
Yes No Yes No Higher managerial 37 63 26 74
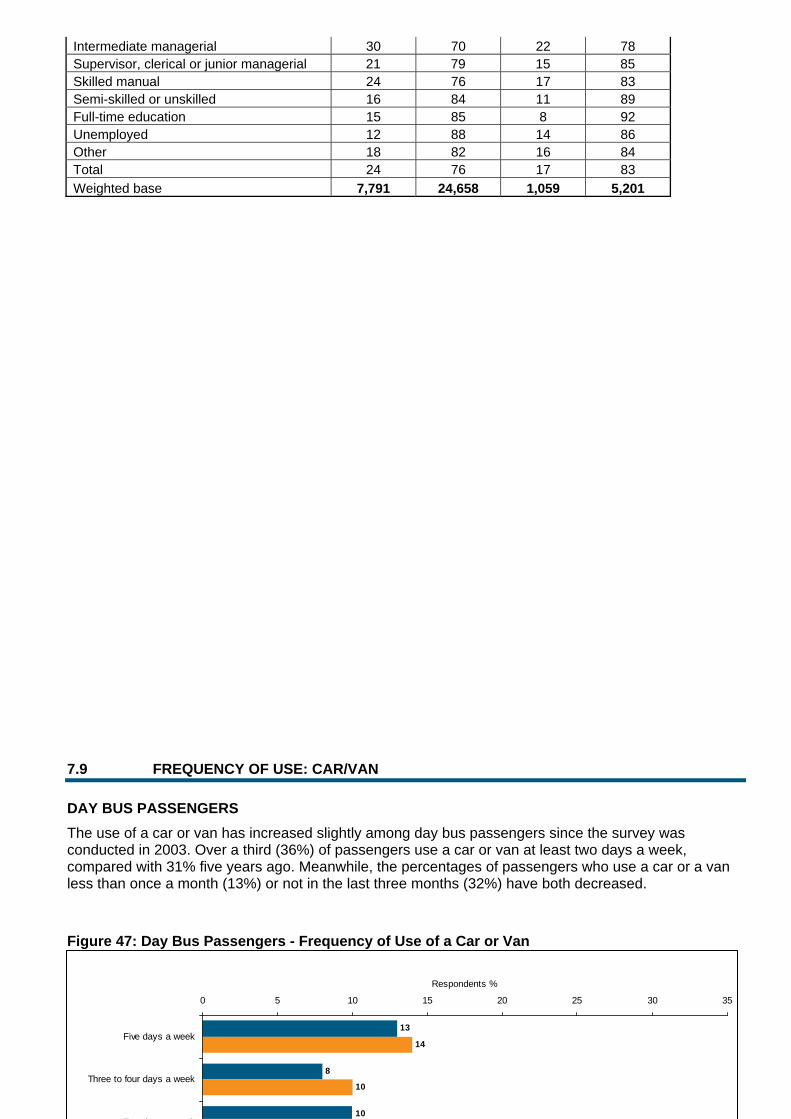
Intermediate managerial 30 70 22 78 Supervisor, clerical or junior managerial 21 79 15 85 Skilled manual 24 76 17 83 Semi-skilled or unskilled 16 84 11 89 Full-time education 15 85 8 92 Unemployed 12 88 14 86 Other 18 82 16 84 Total 24 76 17 83 Weighted base 7,791 24,658 1,059 5,201
7.9 FREQUENCY OF USE: CAR/VAN
DAY BUS PASSENGERS The use of a car or van has increased slightly among day bus passengers since the survey was conducted in 2003. Over a third (36%) of passengers use a car or van at least two days a week, compared with 31% five years ago. Meanwhile, the percentages of passengers who use a car or a van less than once a month (13%) or not in the last three months (32%) have both decreased.
Figure 47: Day Bus Passengers - Frequency of Use of a Car or Van
13
8
10
14
10
0 5 10 15 20 25 30 35
Five days a week
Three to four days a week
T d k
Respondents %
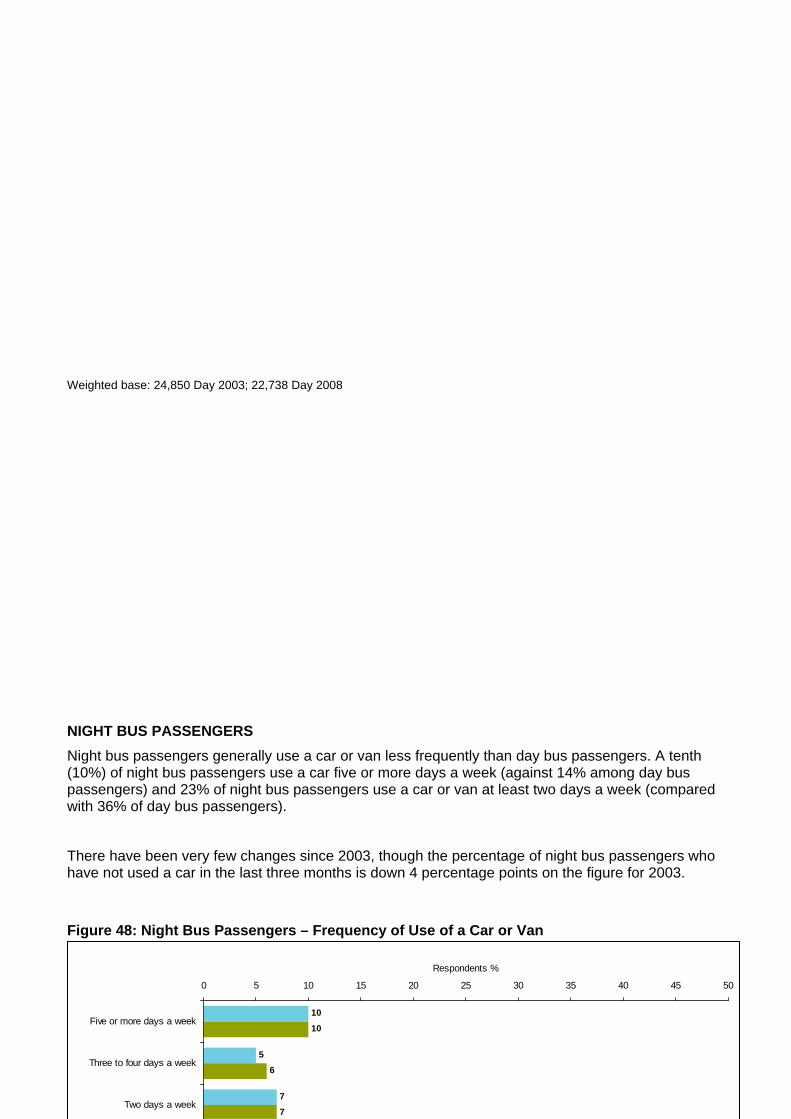
10
5
7
10
6
7
0 5 10 15 20 25 30 35 40 45 50
Five or more days a week
Three to four days a week
Two days a week
Respondents %
Weighted base: 24,850 Day 2003; 22,738 Day 2008
NIGHT BUS PASSENGERS Night bus passengers generally use a car or van less frequently than day bus passengers. A tenth (10%) of night bus passengers use a car five or more days a week (against 14% among day bus passengers) and 23% of night bus passengers use a car or van at least two days a week (compared with 36% of day bus passengers).
There have been very few changes since 2003, though the percentage of night bus passengers who have not used a car in the last three months is down 4 percentage points on the figure for 2003.
Figure 48: Night Bus Passengers – Frequency of Use of a Car or Van

Weighted base: 6,078 Night 2003; 6,947 Night 2008
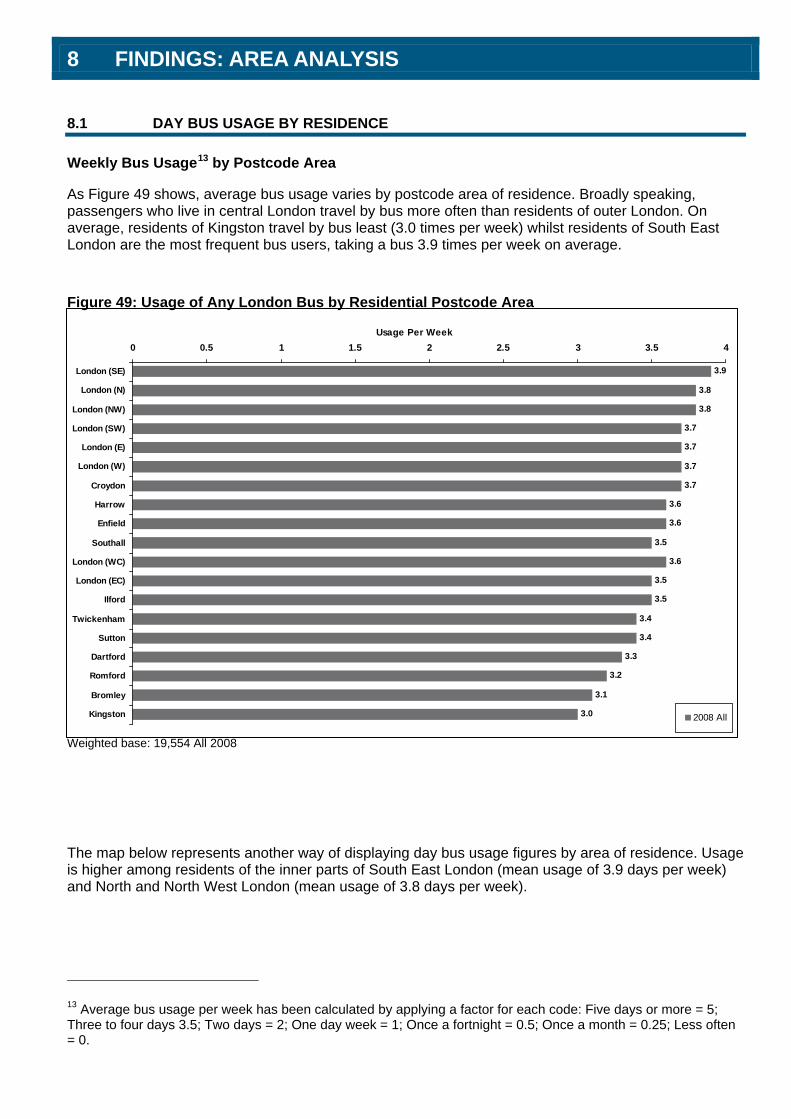
8 FINDINGS: AREA ANALYSIS
8.1 DAY BUS USAGE BY RESIDENCE
Weekly Bus Usage13 by Postcode Area
As Figure 49 shows, average bus usage varies by postcode area of residence. Broadly speaking, passengers who live in central London travel by bus more often than residents of outer London. On average, residents of Kingston travel by bus least (3.0 times per week) whilst residents of South East London are the most frequent bus users, taking a bus 3.9 times per week on average.
Figure 49: Usage of Any London Bus by Residential Postcode Area
Weighted base: 19,554 All 2008
The map below represents another way of displaying day bus usage figures by area of residence. Usage is higher among residents of the inner parts of South East London (mean usage of 3.9 days per week) and North and North West London (mean usage of 3.8 days per week).
13 Average bus usage per week has been calculated by applying a factor for each code: Five days or more = 5; Three to four days 3.5; Two days = 2; One day week = 1; Once a fortnight = 0.5; Once a month = 0.25; Less often = 0.
3.9
3.8
3.8
3.7
3.7
3.7
3.7
3.6
3.6
3.5
3.6
3.5
3.5
3.4
3.4
3.3
3.2
3.1
3.0
0 0.5 1 1.5 2 2.5 3 3.5 4
London (SE)
London (N)
London (NW)
London (SW)
London (E)
London (W)
Croydon
Harrow
Enfield
Southall
London (WC)
London (EC)
Ilford
Twickenham
Sutton
Dartford
Romford
Bromley
Kingston
Usage Per Week
2008 All
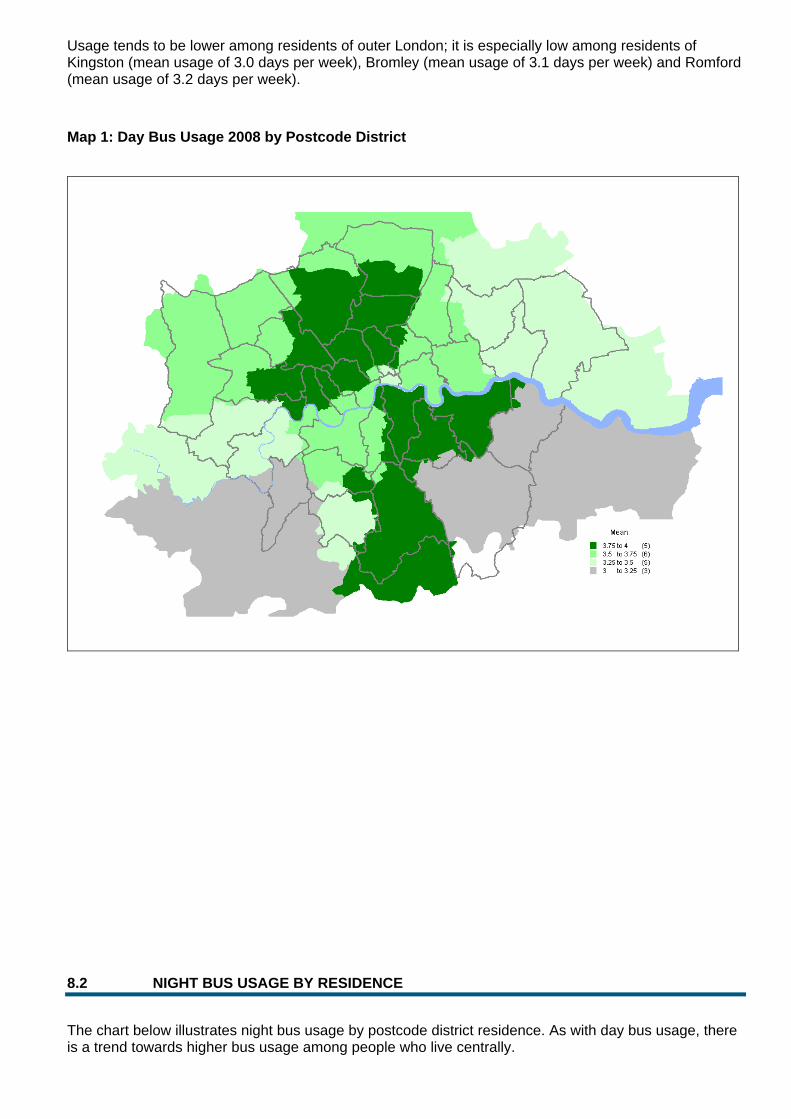
Usage tends to be lower among residents of outer London; it is especially low among residents of Kingston (mean usage of 3.0 days per week), Bromley (mean usage of 3.1 days per week) and Romford (mean usage of 3.2 days per week).
Map 1: Day Bus Usage 2008 by Postcode District
8.2 NIGHT BUS USAGE BY RESIDENCE
The chart below illustrates night bus usage by postcode district residence. As with day bus usage, there is a trend towards higher bus usage among people who live centrally.
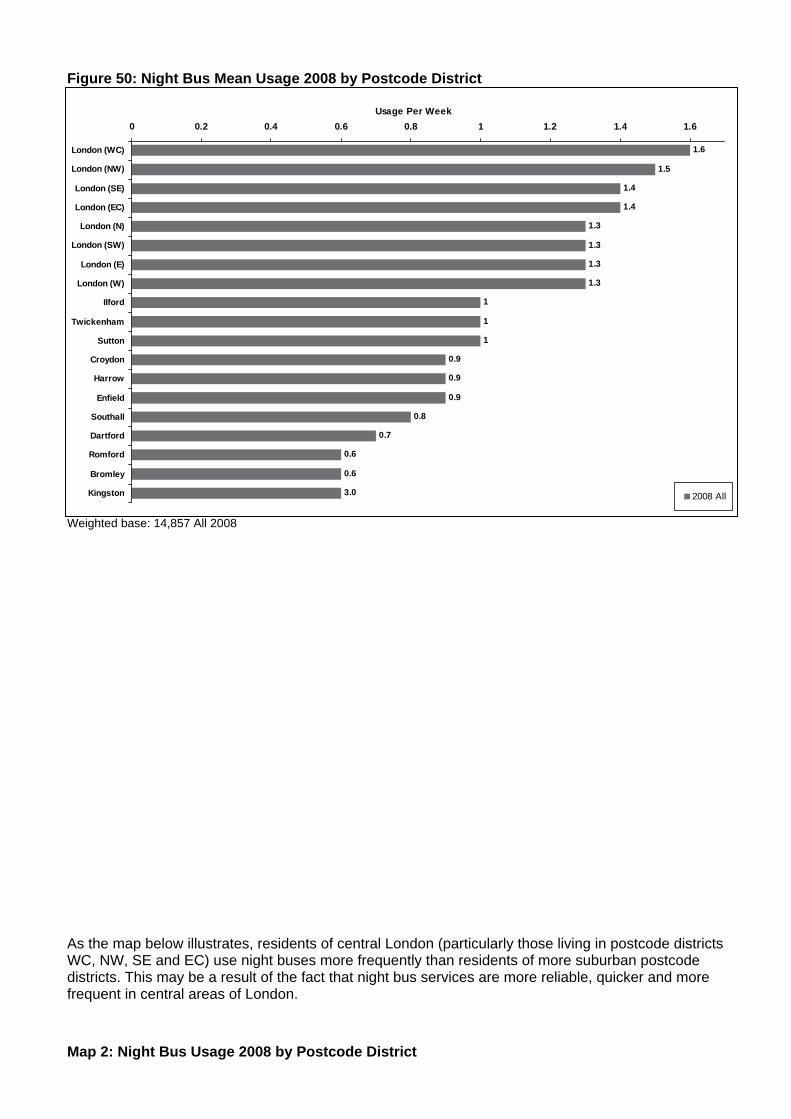
Figure 50: Night Bus Mean Usage 2008 by Postcode District
Weighted base: 14,857 All 2008
As the map below illustrates, residents of central London (particularly those living in postcode districts WC, NW, SE and EC) use night buses more frequently than residents of more suburban postcode districts. This may be a result of the fact that night bus services are more reliable, quicker and more frequent in central areas of London.
Map 2: Night Bus Usage 2008 by Postcode District
1.6
1.5
1.4
1.4
1.3
1.3
1.3
1.3
1
1
1
0.9
0.9
0.9
0.8
0.7
0.6
0.6
3.0
0 0.2 0.4 0.6 0.8 1 1.2 1.4 1.6
London (WC)
London (NW)
London (SE)
London (EC)
London (N)
London (SW)
London (E)
London (W)
Ilford
Twickenham
Sutton
Croydon
Harrow
Enfield
Southall
Dartford
Romford
Bromley
Kingston
Usage Per Week
2008 All
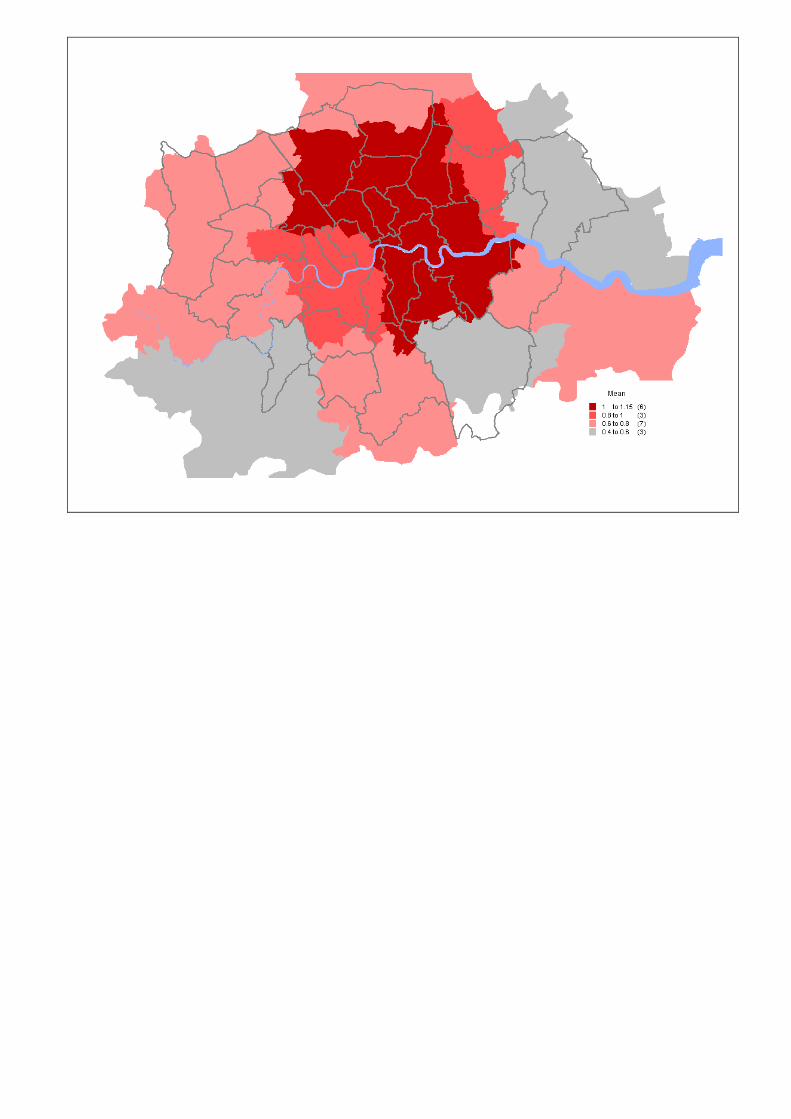
9 FINDINGS: COMPARISONS WITH 1999
9.1 KEY FINDINGS
The following section compares key passenger profiles and journey characteristics across the three waves of the Bus User Survey; 1999, 2003 and 2008. Please note that all figures quoted relate to day bus passengers only.
Day bus passengers are less likely to be female (54%) than they were in 1999, when 58% of day bus passengers were women. This figure has remained the same since 2003.
Perhaps the most noticeable trend over the last nine years has been the change in the age profile of bus passengers. The last three waves of BUS have seen an increase in the percentage of passengers who are aged between 25 and 44 years old from 37% to 45%. At the same time, the number of passengers aged over 60 has halved from 20% to 10%.
The employment profile of bus passengers has also seen some changes over the last nine years – the number of retired passengers is now 7%, down from 9% in 2003 and 15% in 1999. This is consistent with the shift towards a younger profile mentioned above.
There has been a dramatic fall in the percentage of cash and saver tickets being used by bus passengers to a current figure of 3%. Bus passes (17%) and Freedom Passes (8%) are also used less than they were during previous waves of the survey. These decreases can be explained by the introduction of Oyster Pay As You Go, which is now used by 24% of day bus passengers.
There has been a slight decrease in the percentage of passengers who are frequent travellers (from 60% in 1999 to 58% in 2003, and subsequently to 55% in 2008). During the same period there has been a slight increase in the number of passengers taking a bus between once a week and once a month.
There have also been changes to journey purpose figures in the last nine years. Passengers are now far more likely to use a bus to travel to or from work (49%) than they have been in the past, and are less likely to take a bus to go shopping (12%) or for leisure purposes (7%).
9.2 GENDER: 1999 TO 2008
A comparison of the gender profile of day bus passengers across the three waves of the Bus User Survey shows that there was an increase in the percentage of males travelling by bus in London between 1999 and 2003. However, there has been no subsequent change between 2003 and 2008.
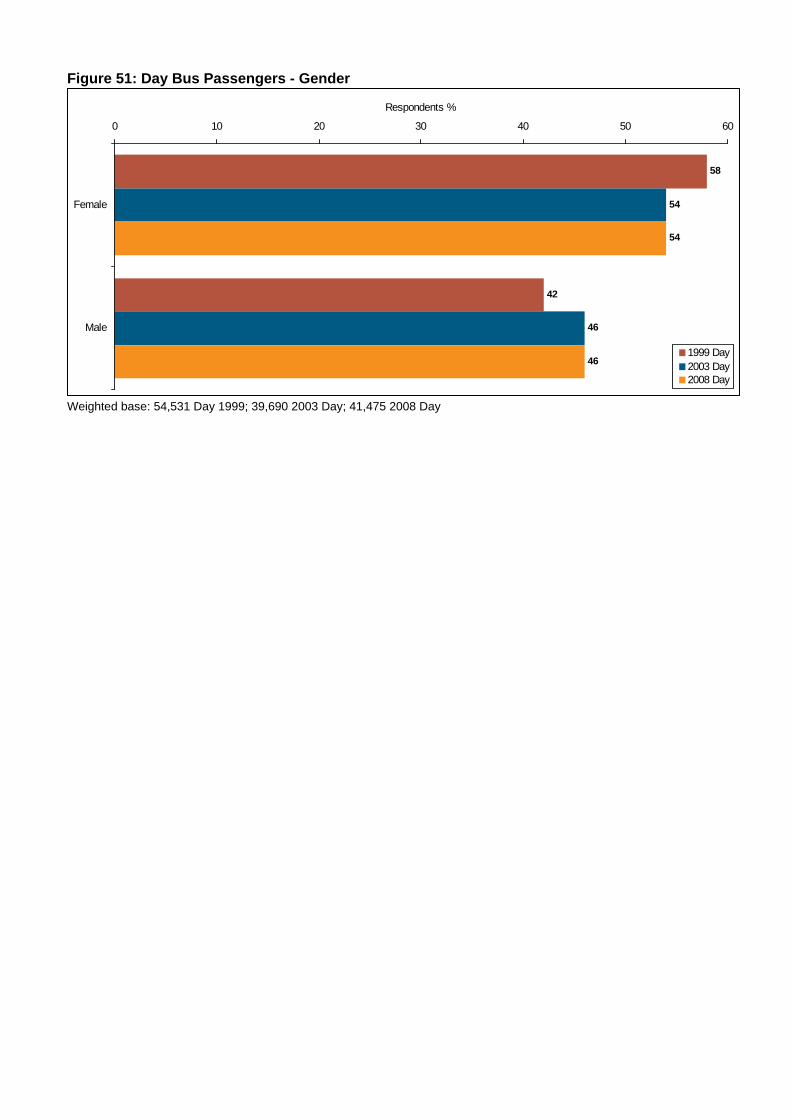
Figure 51: Day Bus Passengers - Gender
Weighted base: 54,531 Day 1999; 39,690 2003 Day; 41,475 2008 Day
58
42
54
46
54
46
0 10 20 30 40 50 60
Female
Male
Respondents %
1999 Day2003 Day2008 Day
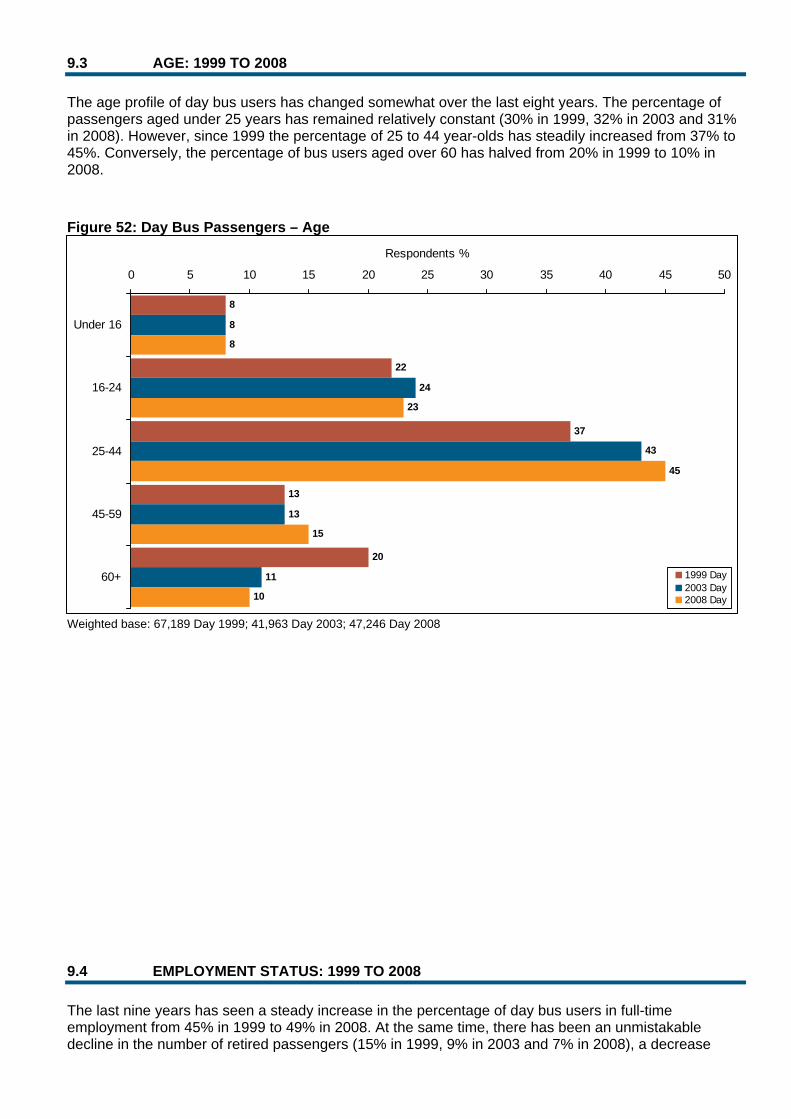
9.3 AGE: 1999 TO 2008
The age profile of day bus users has changed somewhat over the last eight years. The percentage of passengers aged under 25 years has remained relatively constant (30% in 1999, 32% in 2003 and 31% in 2008). However, since 1999 the percentage of 25 to 44 year-olds has steadily increased from 37% to 45%. Conversely, the percentage of bus users aged over 60 has halved from 20% in 1999 to 10% in 2008.
Figure 52: Day Bus Passengers – Age
Weighted base: 67,189 Day 1999; 41,963 Day 2003; 47,246 Day 2008
9.4 EMPLOYMENT STATUS: 1999 TO 2008
The last nine years has seen a steady increase in the percentage of day bus users in full-time employment from 45% in 1999 to 49% in 2008. At the same time, there has been an unmistakable decline in the number of retired passengers (15% in 1999, 9% in 2003 and 7% in 2008), a decrease
8
22
37
13
20
8
24
43
13
11
8
23
45
15
10
0 5 10 15 20 25 30 35 40 45 50
Under 16
16-24
25-44
45-59
60+
Respondents %
1999 Day2003 Day2008 Day
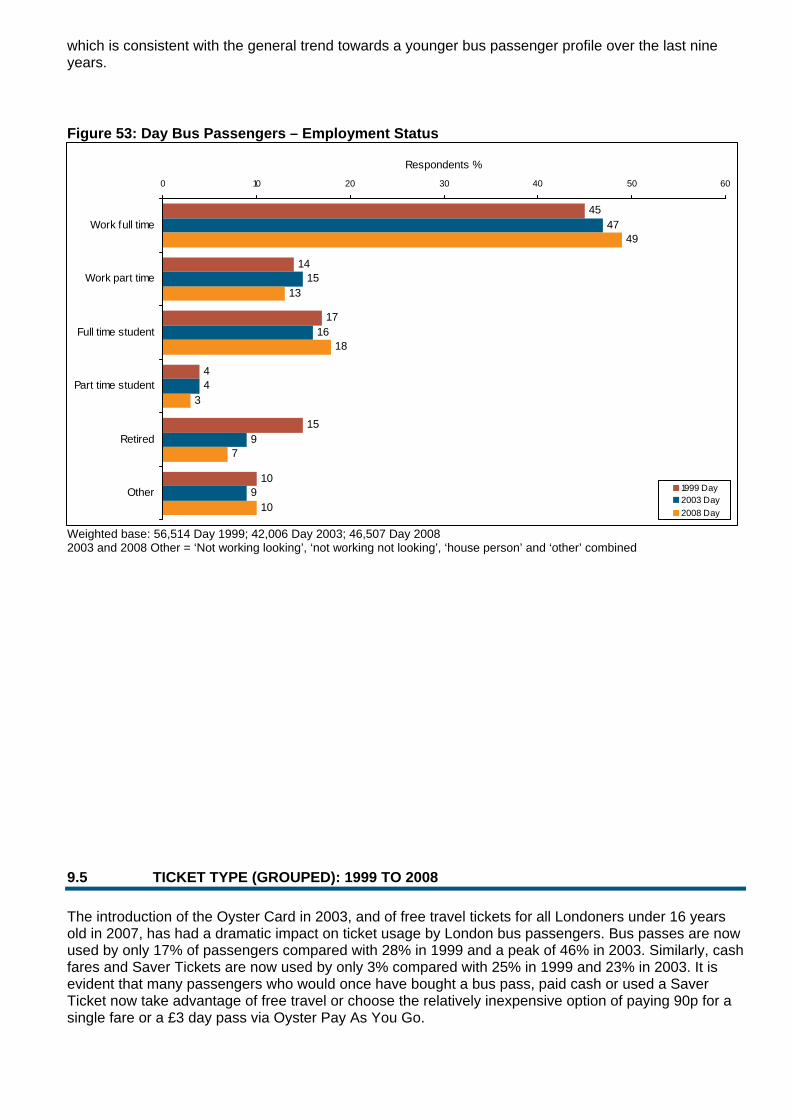
which is consistent with the general trend towards a younger bus passenger profile over the last nine years.
Figure 53: Day Bus Passengers – Employment Status
Weighted base: 56,514 Day 1999; 42,006 Day 2003; 46,507 Day 2008 2003 and 2008 Other = ‘Not working looking’, ‘not working not looking’, ‘house person’ and ‘other’ combined
9.5 TICKET TYPE (GROUPED): 1999 TO 2008
The introduction of the Oyster Card in 2003, and of free travel tickets for all Londoners under 16 years old in 2007, has had a dramatic impact on ticket usage by London bus passengers. Bus passes are now used by only 17% of passengers compared with 28% in 1999 and a peak of 46% in 2003. Similarly, cash fares and Saver Tickets are now used by only 3% compared with 25% in 1999 and 23% in 2003. It is evident that many passengers who would once have bought a bus pass, paid cash or used a Saver Ticket now take advantage of free travel or choose the relatively inexpensive option of paying 90p for a single fare or a £3 day pass via Oyster Pay As You Go.
45
14
17
4
15
10
47
15
16
4
9
9
49
13
18
3
7
10
0 10 20 30 40 50 60
Work full time
Work part time
Full time student
Part time student
Retired
Other
Respondents %
1999 Day2003 Day2008 Day
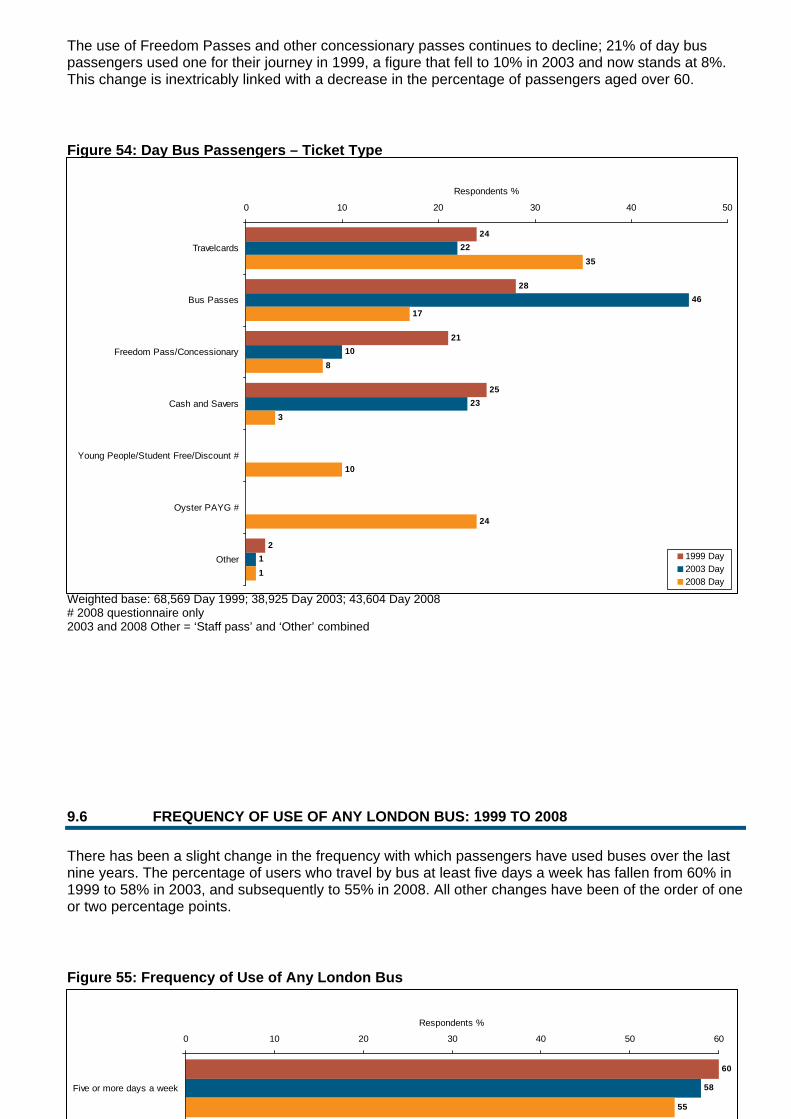
The use of Freedom Passes and other concessionary passes continues to decline; 21% of day bus passengers used one for their journey in 1999, a figure that fell to 10% in 2003 and now stands at 8%. This change is inextricably linked with a decrease in the percentage of passengers aged over 60.
Figure 54: Day Bus Passengers – Ticket Type
Weighted base: 68,569 Day 1999; 38,925 Day 2003; 43,604 Day 2008 # 2008 questionnaire only 2003 and 2008 Other = ‘Staff pass’ and ‘Other’ combined
9.6 FREQUENCY OF USE OF ANY LONDON BUS: 1999 TO 2008
There has been a slight change in the frequency with which passengers have used buses over the last nine years. The percentage of users who travel by bus at least five days a week has fallen from 60% in 1999 to 58% in 2003, and subsequently to 55% in 2008. All other changes have been of the order of one or two percentage points.
Figure 55: Frequency of Use of Any London Bus
24
28
21
25
2
22
46
10
23
1
35
17
8
3
10
24
1
0 10 20 30 40 50
Travelcards
Bus Passes
Freedom Pass/Concessionary
Cash and Savers
Young People/Student Free/Discount #
Oyster PAYG #
Other
Respondents %
1999 Day2003 Day2008 Day
60
58
55
0 10 20 30 40 50 60
Five or more days a week
Respondents %
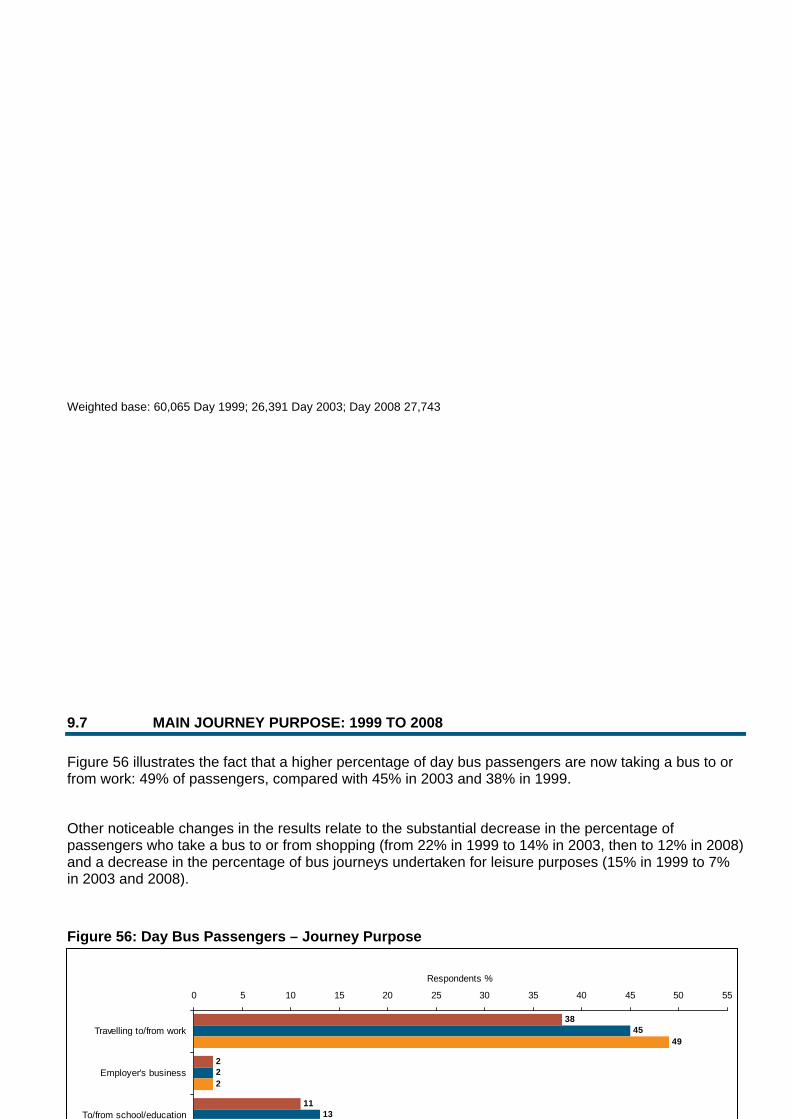
Weighted base: 60,065 Day 1999; 26,391 Day 2003; Day 2008 27,743
9.7 MAIN JOURNEY PURPOSE: 1999 TO 2008
Figure 56 illustrates the fact that a higher percentage of day bus passengers are now taking a bus to or from work: 49% of passengers, compared with 45% in 2003 and 38% in 1999.
Other noticeable changes in the results relate to the substantial decrease in the percentage of passengers who take a bus to or from shopping (from 22% in 1999 to 14% in 2003, then to 12% in 2008) and a decrease in the percentage of bus journeys undertaken for leisure purposes (15% in 1999 to 7% in 2003 and 2008).
Figure 56: Day Bus Passengers – Journey Purpose
38
2
11
45
2
13
49
2
0 5 10 15 20 25 30 35 40 45 50 55
Travelling to/from work
Employer's business
To/from school/education
Respondents %

Weighted base: 65,584 Day 1999; 43,895 Day 2003; 48,142 Day 2008 2003 and 2008 Other = ‘Healthcare Appointment’, ‘Holiday’, ‘Sightseeing’ and ‘Other’ combined 2008 only ‘picking up’ and ‘dropping off’
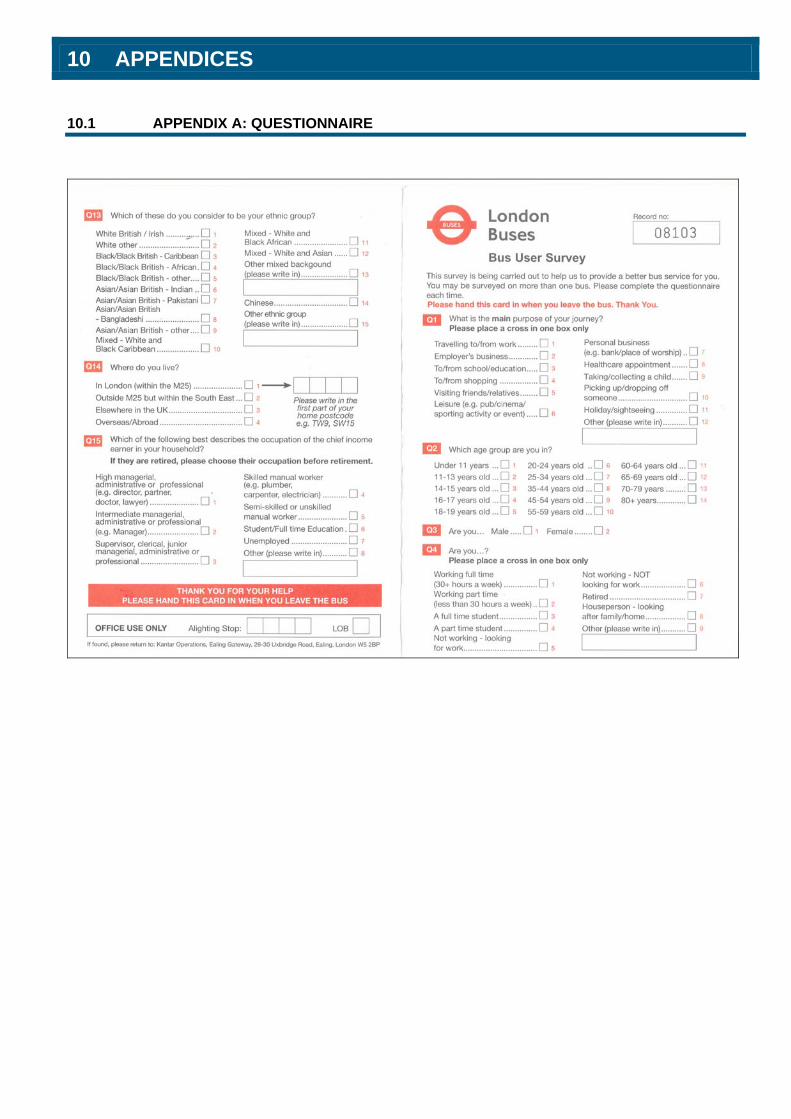
10 APPENDICES
10.1 APPENDIX A: QUESTIONNAIRE
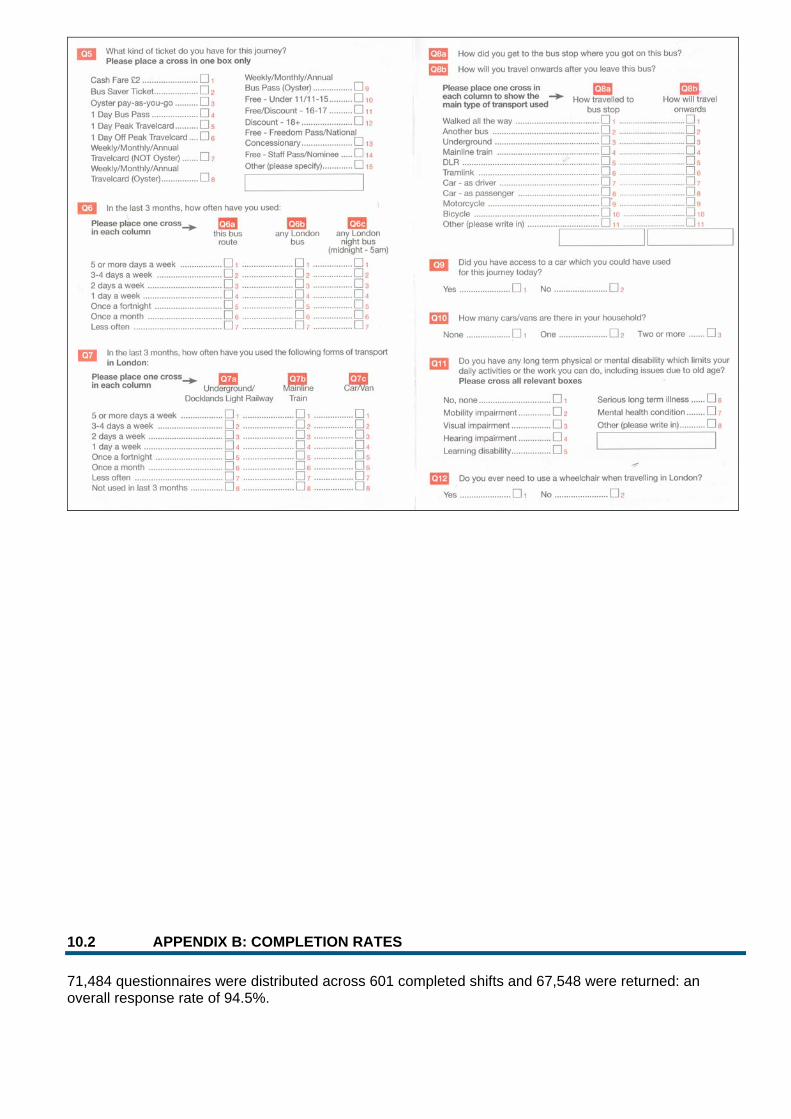
10.2 APPENDIX B: COMPLETION RATES
71,484 questionnaires were distributed across 601 completed shifts and 67,548 were returned: an overall response rate of 94.5%.
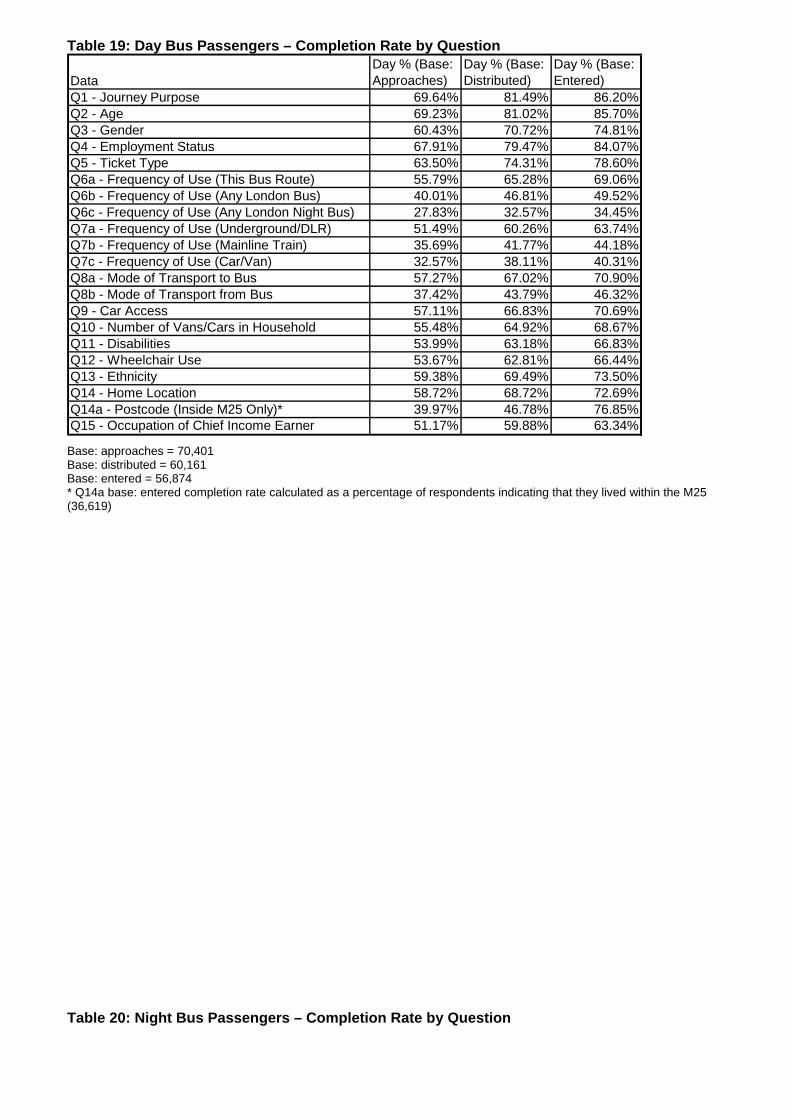
Table 19: Day Bus Passengers – Completion Rate by Question
DataDay % (Base: Approaches)
Day % (Base: Distributed)
Day % (Base: Entered)
Q1 - Journey Purpose 69.64% 81.49% 86.20%Q2 - Age 69.23% 81.02% 85.70%Q3 - Gender 60.43% 70.72% 74.81%Q4 - Employment Status 67.91% 79.47% 84.07%Q5 - Ticket Type 63.50% 74.31% 78.60%Q6a - Frequency of Use (This Bus Route) 55.79% 65.28% 69.06%Q6b - Frequency of Use (Any London Bus) 40.01% 46.81% 49.52%Q6c - Frequency of Use (Any London Night Bus) 27.83% 32.57% 34.45%Q7a - Frequency of Use (Underground/DLR) 51.49% 60.26% 63.74%Q7b - Frequency of Use (Mainline Train) 35.69% 41.77% 44.18%Q7c - Frequency of Use (Car/Van) 32.57% 38.11% 40.31%Q8a - Mode of Transport to Bus 57.27% 67.02% 70.90%Q8b - Mode of Transport from Bus 37.42% 43.79% 46.32%Q9 - Car Access 57.11% 66.83% 70.69%Q10 - Number of Vans/Cars in Household 55.48% 64.92% 68.67%Q11 - Disabilities 53.99% 63.18% 66.83%Q12 - Wheelchair Use 53.67% 62.81% 66.44%Q13 - Ethnicity 59.38% 69.49% 73.50%Q14 - Home Location 58.72% 68.72% 72.69%Q14a - Postcode (Inside M25 Only)* 39.97% 46.78% 76.85%Q15 - Occupation of Chief Income Earner 51.17% 59.88% 63.34% Base: approaches = 70,401 Base: distributed = 60,161 Base: entered = 56,874 * Q14a base: entered completion rate calculated as a percentage of respondents indicating that they lived within the M25 (36,619)
Table 20: Night Bus Passengers – Completion Rate by Question
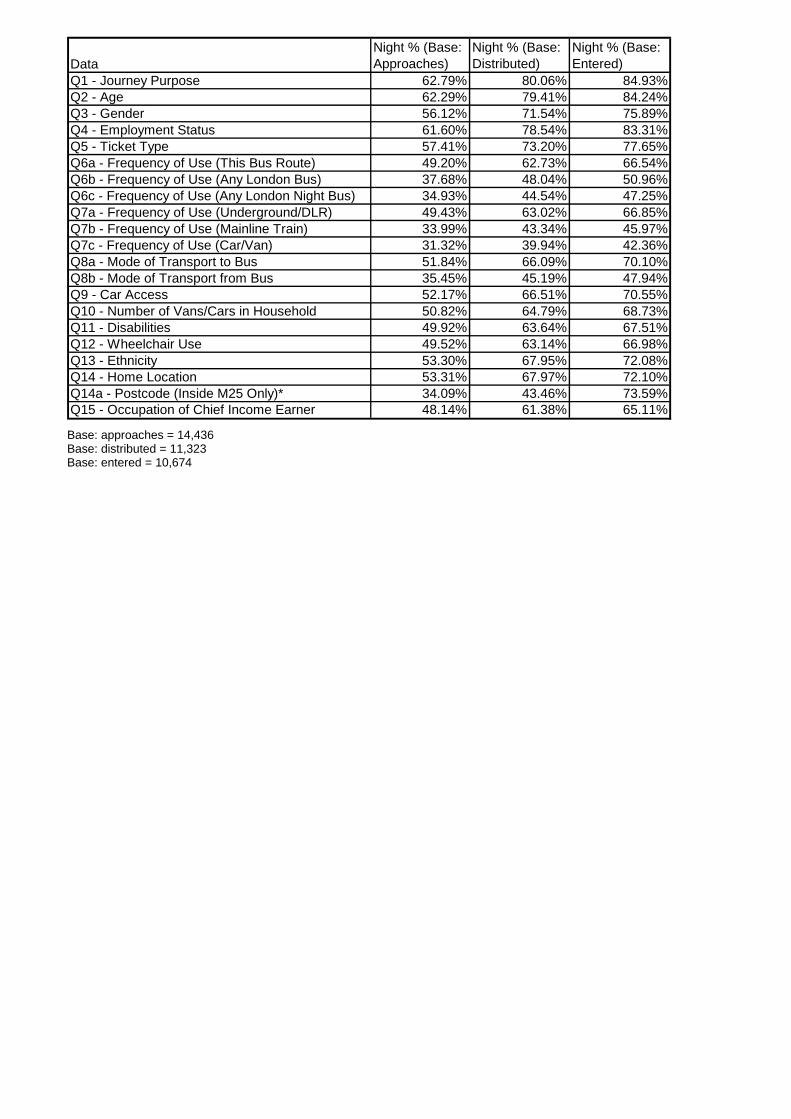
DataNight % (Base: Approaches)
Night % (Base: Distributed)
Night % (Base: Entered)
Q1 - Journey Purpose 62.79% 80.06% 84.93%Q2 - Age 62.29% 79.41% 84.24%Q3 - Gender 56.12% 71.54% 75.89%Q4 - Employment Status 61.60% 78.54% 83.31%Q5 - Ticket Type 57.41% 73.20% 77.65%Q6a - Frequency of Use (This Bus Route) 49.20% 62.73% 66.54%Q6b - Frequency of Use (Any London Bus) 37.68% 48.04% 50.96%Q6c - Frequency of Use (Any London Night Bus) 34.93% 44.54% 47.25%Q7a - Frequency of Use (Underground/DLR) 49.43% 63.02% 66.85%Q7b - Frequency of Use (Mainline Train) 33.99% 43.34% 45.97%Q7c - Frequency of Use (Car/Van) 31.32% 39.94% 42.36%Q8a - Mode of Transport to Bus 51.84% 66.09% 70.10%Q8b - Mode of Transport from Bus 35.45% 45.19% 47.94%Q9 - Car Access 52.17% 66.51% 70.55%Q10 - Number of Vans/Cars in Household 50.82% 64.79% 68.73%Q11 - Disabilities 49.92% 63.64% 67.51%Q12 - Wheelchair Use 49.52% 63.14% 66.98%Q13 - Ethnicity 53.30% 67.95% 72.08%Q14 - Home Location 53.31% 67.97% 72.10%Q14a - Postcode (Inside M25 Only)* 34.09% 43.46% 73.59%Q15 - Occupation of Chief Income Earner 48.14% 61.38% 65.11% Base: approaches = 14,436 Base: distributed = 11,323 Base: entered = 10,674