Embed Size (px)
Citation preview

ISSN 2642-2689transformer-technology.comOCTOBER 2020
ISSUE 8
The Dry Type RIF® Bushing: The New Technology in HV BushingsManaging Bushings: From Statistics to Singularities – Where to Focus?
MV Transformer Bushings: Global Technology and Market Trends
Part 2Bushings
Design, Maintenance andMonitoring
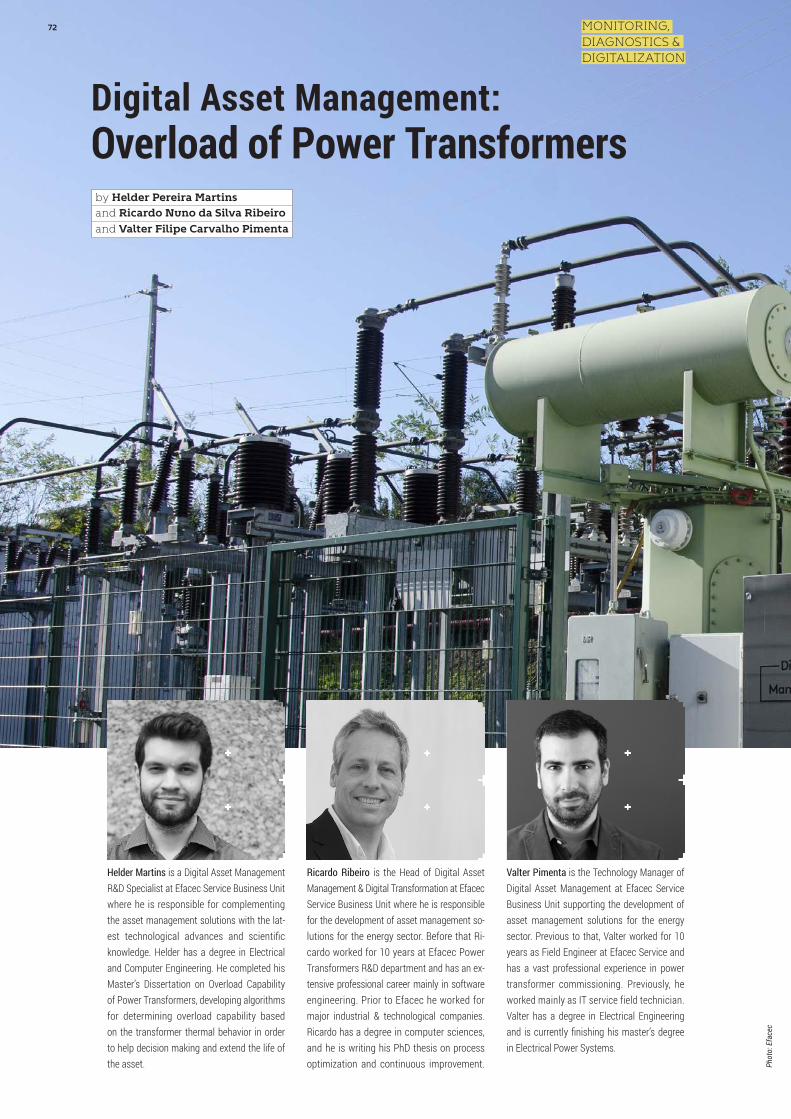
Digital Asset Management:Overload of Power Transformersby Helder Pereira Martinsand Ricardo Nuno da Silva Ribeiro
and Valter Filipe Carvalho Pimenta
Helder Martins is a Digital Asset Management R&D Specialist at Efacec Service Business Unitwhere he is responsible for complementingthe asset management solutions with the lat-est technological advances and scientificknowledge. Helder has a degree in Electricaland Computer Engineering. He completed hisMaster’s Dissertation on Overload Capability of Power Transformers, developing algorithms for determining overload capability basedon the transformer thermal behavior in order to help decision making and extend the life of the asset.
Ricardo Ribeiro is the Head of Digital AssetManagement & Digital Transformation at EfacecService Business Unit where he is responsiblefor the development of asset management so-lutions for the energy sector. Before that Ri-cardo worked for 10 years at Efacec Power Transformers R&D department and has an ex-tensive professional career mainly in software engineering. Prior to Efacec he worked for major industrial & technological companies.Ricardo has a degree in computer sciences, and he is writing his PhD thesis on process optimization and continuous improvement.
Valter Pimenta is the Technology Manager ofDigital Asset Management at Efacec Service Business Unit supporting the development ofasset management solutions for the energysector. Previous to that, Valter worked for 10years as Field Engineer at Efacec Service andhas a vast professional experience in powertransformer commissioning. Previously, he worked mainly as IT service field technician.Valter has a degree in Electrical Engineeringand is currently finishing his master’s degreein Electrical Power Systems.
72
Phot
o: E
face
c
MONITORING, DIAGNOSTICS & DIGITALIZATION

Introduction
The energy transition that we areexperiencing, which is highly motivated by environmental reasons, is pushing the limits of energy grids. Paris Climate Agreement includes the European 20/20/20 target, which, for the year 2020, in comparison to 1990, aims at a 20% reduction of carbon dioxide emissions, a 20% renewable energy market share increase, and a 20% increase in energy efficiency. The decarbonization of the energy system represents a disruption in the use of fossil fuels as a power source and a more committed adoption of renewable energy sources.
Redefinition of energy policies will constitute a big challenge for asset operators to manage their energy grids since the power generation paradigm will change quite drastically. The common structure of power grids (generation-transmission-distribution) will be completely redefined: the generation will no longer be centralized, becoming distributed across the whole grid as microgeneration and self-consumption become more adopted technologies. The conventional grid management will need to evolve to a more intelligent and flexible grid in order to fulfill the energy demand and the dynamic behavior of the energy flow. The need for smart grids is propelled by the incoming high rate of alternative energy sources to fossil fuels adoption as this is the next energy revolution.
With a continuous change in electricity demand, asset operators face a difficult challenge of predicting sudden changes in load cycle patterns. The increasing presence of electric vehicles introduces highly capacitive points in the grid, representing a major disturbance in the load cycles of each grid branch. The change in load cycle patterns occasionally requires loading transformers above their nameplate ratings. Exceeding these values can damage transformer windings and insulation. However, overloads are also necessary in emergency or contingency situations and are important to ensure a continuous supply of electric energy.
With a continuous change in electricity demand, asset operators face a difficult challenge of predicting sudden changes
in load cycle patterns, which occasionally require loading transformers above their
nameplate ratings.While overloading transformers can
damage transformer windings and insulation, overloads are sometimes
necessary and are important to ensure a continuous supply of electric energy.
73Transformer Technology October 2020
Issue 8
Phot
o: E
face
c

State of the Art
Motivation for Overloading Transformers
To ensure continuous power supply, overloading power transformers may be used as an emergency measure in different scenarios like natural and unnatural disasters that leave part of the grid inoperative, especially in critical areas.
Financial considerations can also be part of the decision to operate power transformers to their full potential. In this scenario, knowing the risks and impact on the transformer, especially after the unit is out of warranty, is key to successful operation [1].
Economic motivations can lead asset operators to overload transformers in an attempt to defer investments in new and more powerful transformers. This delay in investment is very significant considering the huge undertaking that is needed to restructure the entire power grid.
With the rate of migration to smart grid set-ups on an increase, overloading transformers will be more and more common since replacing each one of the power grid’s transformers is too expensive.
The dynamic behavior of the energy flow as well as the rapid changes in smart grid configurations make overloading power transformers a much-needed scenario to support the evolution of this energy transition. However, when operating in overload conditions, it can be a challenging task to understand the risks and impact on the asset.
Overload Side Effects
Power transformer overloading usually results in conductor temperatures reaching levels above the nameplate rating, which can exponentially accelerate aging of the insulating material. Therefore, overloading should only be allowed
with a good understanding of the risks and impact of the situation in order to prevent a potential collapse of the system [2-5]. Overloading in favorable environmental conditions, where the conductor current is higher than the nameplate thermal ratings, but due to lower ambient temperatures this limit is not reached, is an example of when overloading a transformer can be beneficial, preventing aggravated aging.
The exposure of insulating material to high temperatures is considered as one of the main factors for accelerated aging of power transformers [6]. However, there are other factors that impede a safe overload of transformers.
Figure 1. An example of oxidative degradation of cellulose [7]
74
Phot
o: E
face
c
MONITORING, DIAGNOSTICS & DIGITALIZATION

as shown in Figure 1, resulting in the release of carbon monoxide (CO), carbon dioxide (CO2), water and two acid or aldehyde groups.
Hydrolysis of cellulose is a catalytical process related to water content, which can occur as a result of oxidation reactions as well as hydrolysis reactions themselves. These molecules react directly with the hydrogen bonds in the cellulose chain, leading to the breakdown of the glucose ring and the formation of two smaller acid groups, as shown in Figure 2. Due to the lower molecular weight, the absorption is easier, decreasing the dielectric strength of the insulating material. At temperatures close to 100°C, the
rate of hydrolysis rises quickly due to a series of dehydration reactions, leading to the formation of a smaller compound and water.
Pyrolysis is a reaction that only depends on the system’s temperature and results in gas components such as carbon monoxide (CO), carbon dioxide (CO2), hydrogen (H2), water (H2O), furan compounds and mud. During these reactions, the breakdown of cellulose chains leads to a decrease of the degree of polymerization, reducing several paper mechanical properties such as tensile strength, elongation and folding endurance. All these reactions have different catalysts, but they are all accelerated by heat as the temperature rises.
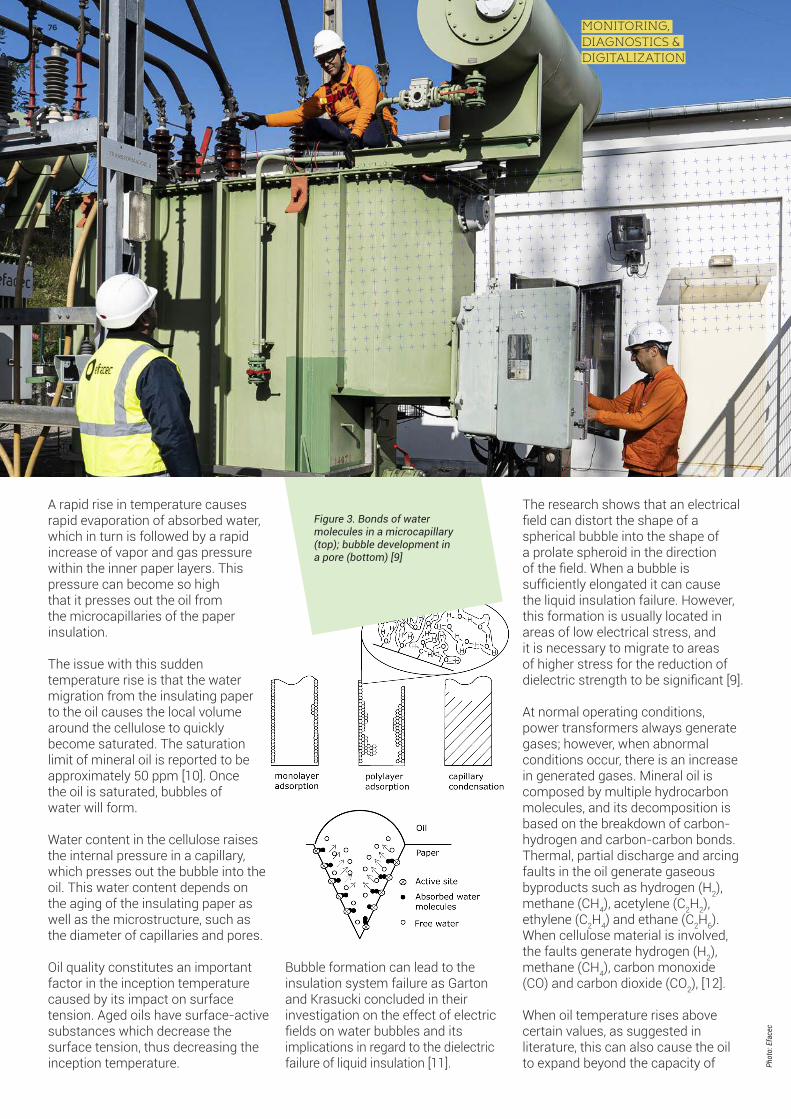
Water can be absorbed in cellulose amorphous structures, wall cell pores and polyose-lignin-gel. Cellulose fibers form microcapillaries, which contain insulating oil, gas residues and water. With low water content, the molecules are bonded with strong bonds; but when water content is higher, these molecules are bonded to the cellulose compound only with weak Van-Der-Waals bonds and capillary forces, as shown in Figure 3. This kind of water molecule is susceptible to evaporation like bubbles.
Moisture and gas accumulation in the insulating materials, such as paper and oil, correlate with temperature change, reducing the dielectric strength of the materials.
Insulating paper is mostly composed of cellulose fibers bonded by hydrogen and Van-Der-Waals bonds. Paper naturally degrades over the transformer’s operating life due to a variety of conditions the paper is subjected to. The main reactions responsible for paper degradation are oxidation, hydrolysis and pyrolysis of cellulose.
Oxidation is a reaction predominant at lower temperatures, when oxygen reacts with the glucose carbon rings,
Figure 2. Cellulose hydrolytic degradation reaction [8]
75Transformer Technology October 2020
Issue 8
Phot
o: E
face
c
Bubble formation can lead to the insulation system failure as Garton and Krasucki concluded in their investigation on the effect of electric fields on water bubbles and its implications in regard to the dielectric failure of liquid insulation [11].
A rapid rise in temperature causes rapid evaporation of absorbed water, which in turn is followed by a rapid increase of vapor and gas pressure within the inner paper layers. Thispressure can become so high that it presses out the oil from the microcapillaries of the paper insulation.
The issue with this sudden temperature rise is that the water migration from the insulating paper to the oil causes the local volume around the cellulose to quickly become saturated. The saturation limit of mineral oil is reported to be approximately 50 ppm [10]. Oncethe oil is saturated, bubbles ofwater will form.
Water content in the cellulose raises the internal pressure in a capillary, which presses out the bubble into the oil. This water content depends on the aging of the insulating paper as well as the microstructure, such as the diameter of capillaries and pores.
Oil quality constitutes an important factor in the inception temperature caused by its impact on surface tension. Aged oils have surface-active substances which decrease the surface tension, thus decreasing the inception temperature.
The research shows that an electrical field can distort the shape of a spherical bubble into the shape of a prolate spheroid in the direction of the field. When a bubble is sufficiently elongated it can cause the liquid insulation failure. However, this formation is usually located in areas of low electrical stress, and it is necessary to migrate to areas of higher stress for the reduction of dielectric strength to be significant [9].
At normal operating conditions, power transformers always generate gases; however, when abnormal conditions occur, there is an increase in generated gases. Mineral oil is composed by multiple hydrocarbon molecules, and its decomposition is based on the breakdown of carbon-hydrogen and carbon-carbon bonds. Thermal, partial discharge and arcing faults in the oil generate gaseous byproducts such as hydrogen (H2), methane (CH4), acetylene (C2H2), ethylene (C2H4) and ethane (C2H6). When cellulose material is involved, the faults generate hydrogen (H2), methane (CH4), carbon monoxide (CO) and carbon dioxide (CO2), [12].
When oil temperature rises above certain values, as suggested in literature, this can also cause the oil to expand beyond the capacity of
Figure 3. Bonds of water molecules in a microcapillary (top); bubble development ina pore (bottom) [9]
76
Phot
o: E
face
c
MONITORING, DIAGNOSTICS & DIGITALIZATION
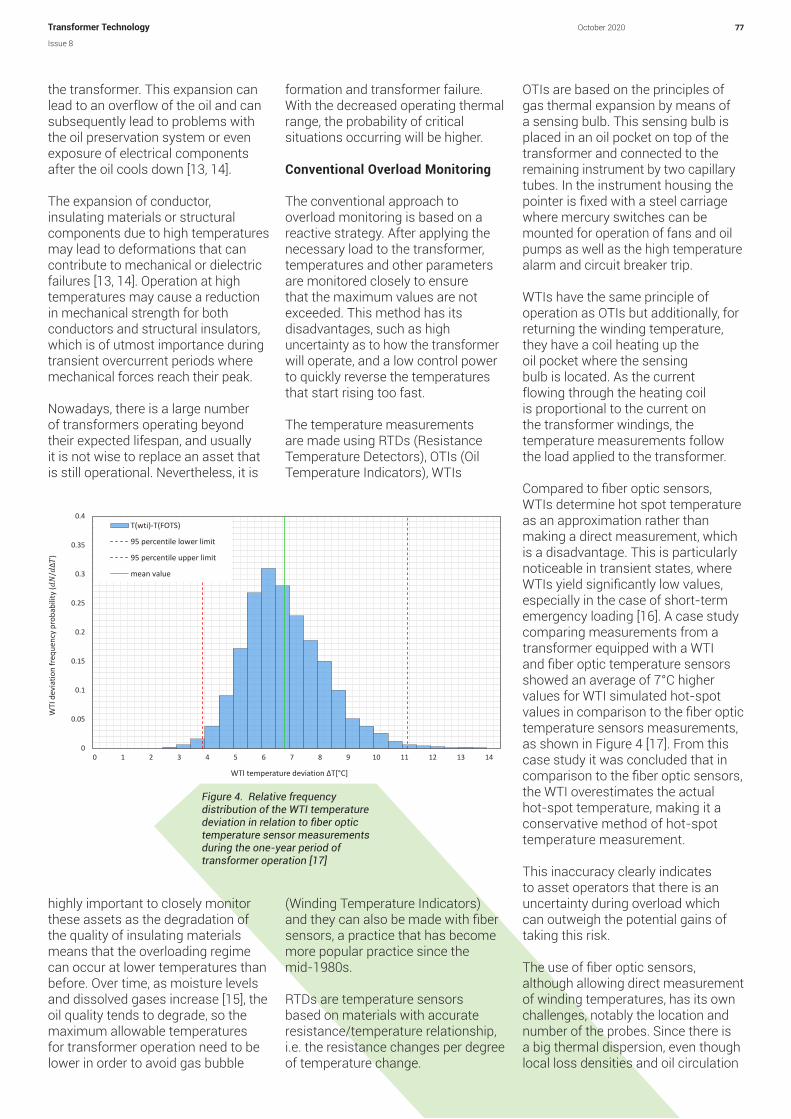
Figure 4. Relative frequency distribution of the WTI temperature deviation in relation to fiber optic temperature sensor measurements during the one-year period of transformer operation [17]
formation and transformer failure. With the decreased operating thermal range, the probability of critical situations occurring will be higher.
Conventional Overload Monitoring
The conventional approach to overload monitoring is based on a reactive strategy. After applying the necessary load to the transformer, temperatures and other parameters are monitored closely to ensure that the maximum values are not exceeded. This method has itsdisadvantages, such as high uncertainty as to how the transformer will operate, and a low control power to quickly reverse the temperatures that start rising too fast.
The temperature measurements are made using RTDs (Resistance Temperature Detectors), OTIs (Oil Temperature Indicators), WTIs
(Winding Temperature Indicators) and they can also be made with fiber sensors, a practice that has become more popular practice since themid-1980s.
RTDs are temperature sensors based on materials with accurate resistance/temperature relationship, i.e. the resistance changes per degree of temperature change.
OTIs are based on the principles of gas thermal expansion by means of a sensing bulb. This sensing bulb is placed in an oil pocket on top of the transformer and connected to the remaining instrument by two capillary tubes. In the instrument housing the pointer is fixed with a steel carriage where mercury switches can be mounted for operation of fans and oil pumps as well as the high temperature alarm and circuit breaker trip. WTIs have the same principle of operation as OTIs but additionally, for returning the winding temperature, they have a coil heating up the oil pocket where the sensing bulb is located. As the current flowing through the heating coil is proportional to the current on the transformer windings, the temperature measurements follow the load applied to the transformer.
Compared to fiber optic sensors, WTIs determine hot spot temperature as an approximation rather than making a direct measurement, which is a disadvantage. This is particularly noticeable in transient states, where WTIs yield significantly low values, especially in the case of short-term emergency loading [16]. A case study comparing measurements from a transformer equipped with a WTI and fiber optic temperature sensors showed an average of 7°C higher values for WTI simulated hot-spot values in comparison to the fiber optic temperature sensors measurements, as shown in Figure 4 [17]. From this case study it was concluded that in comparison to the fiber optic sensors, the WTI overestimates the actual hot-spot temperature, making it a conservative method of hot-spot temperature measurement.
This inaccuracy clearly indicates to asset operators that there is an uncertainty during overload which can outweigh the potential gains of taking this risk.
The use of fiber optic sensors, although allowing direct measurement of winding temperatures, has its own challenges, notably the location and number of the probes. Since there is a big thermal dispersion, even though local loss densities and oil circulation
the transformer. This expansion can lead to an overflow of the oil and can subsequently lead to problems with the oil preservation system or even exposure of electrical components after the oil cools down [13, 14].
The expansion of conductor, insulating materials or structural components due to high temperatures may lead to deformations that can contribute to mechanical or dielectric failures [13, 14]. Operation at high temperatures may cause a reduction in mechanical strength for both conductors and structural insulators, which is of utmost importance during transient overcurrent periods where mechanical forces reach their peak.
Nowadays, there is a large number of transformers operating beyond their expected lifespan, and usually it is not wise to replace an asset that is still operational. Nevertheless, it is
highly important to closely monitor these assets as the degradation of the quality of insulating materials means that the overloading regime can occur at lower temperatures than before. Over time, as moisture levels and dissolved gases increase [15], the oil quality tends to degrade, so the maximum allowable temperatures for transformer operation need to be lower in order to avoid gas bubble
0 1 2 3 4 5 6 7 8 9 10 11 12 13 140
0.05
0.1
0.15
0.2
0.25
0.3
0.35
0.4
WTI
dev
iatio
n fre
quen
cy p
roba
bilit
y (𝑑𝑑𝑁𝑁
/𝑑𝑑Δ𝑇𝑇
)
WTI temperature deviation ΔT[°C]
T(wti)-T(FOTS)
95 percentile lower limit
95 percentile upper limit
mean value
77Transformer Technology October 2020
Issue 8
Phot
o: E
face
c

speeds are calculated, it requires a lot of knowledge (usually reserved for the manufacturer) to exactly determine the location of the hot-spot of the transformer.
Given this, on top of further developing of transformer thermal models, it is necessary for a minimum number of fiber optic sensors to best assess hot-spot determination and thermal model validation, being the highest temperature measured close enough to the actual hot-spot [18].
As a result of different types of faults occurring in the transformer – thermal, electrical or partial discharge, different gases are generated. Dissolved Gas Analysis (DGA) allows the identification of single faults or combinations of various ones, using detailed dissolved gas in oil composition information from chromatography. In a similar way, analyzing specific proportions between certain key gases can identify fault types. Detection of a large increase in hydrogen, ethylene and small amounts of acetylene indicate a thermal fault, since these gases are formed as a result of rising oil temperature. If this temperature rise affects cellulose, this will result in generation of carbon monoxide (CO), carbon dioxide (CO2) and water vapor. A large increase in the quantities of acetylene (C2H2) can indicate current arcing. Low-intensity discharges, such as partial discharges, generate manly hydrogen (H2), with decreasing levels of methane and trace quantities of acetylene. Increased intensity of the discharge will also see an increase in acetylene and ethylene values.
Oil analysis is currently not an exclusive offline operation, where an oil sample is taken from the transformer and analyzed in a laboratory. Online DGA monitors allow for an automated oil analysis with usually greater periodicity than laboratory analysis, detecting almost instantaneously any incipient failure that could be missed by regular oil samplings performed over longer periods of time [19]. Some devices can deliver laboratory grade results, which increases the level of confidence in relying on the monitor to manage the asset. A drawback to this confidence
is an analysis that will identify trends, but will lack the precision of measurements, differing by a significant margin from laboratory results. Accurate measurements are reflected in the incipient fault detection capability: the greater the inaccuracy of the measurements, the larger the uncertainty on fault diagnosis.
The Duval Triangle diagnosis method illustrates this problem, as shown in Figure 5, plotting the values from Table 1. For low-range gas concentrations, and fault types PD, T2 and D2, the uncertainty region overlaps multiple fault zones. For a more severe variation this can make the diagnostics unfeasible [19].
Recommended Approach
In order to mitigate the inherent risk of power transformer overload, it is wise to invest in the development of algorithms that simulate the thermal operation of transformers [20, 21]. In parallel with continuous monitoring and data collection, a dynamic simulation of the transformer thermal behavior should be made, based on internationally accepted thermal models, such as the one proposed in IEC 60076-7 [13] [20], where iteratively the applicable overload factors are determined in order to comply with the nameplate thermal limits.
Thermal Parameters
In order to simulate a real-life scenario as much as possible, it is extremely important to experimentally determine the thermal model parameters that define the behavior of the temperature evolution curves, such as oil and winding time constants and exponents. The use of engineering calculations and heat-run test measurements by means of oil temperature sensors and optical fiber sensors in windings enables a mathematical approximation of the thermal parameters to achieve temperature simulations that are as close to the real-life scenario
Fault CH4 C2H4 C2H2
PD 99 1 0
9.9 0.1 0
D1 38 12 50
3.8 1.2 5
D2 15 50 35
1.5 5 3.5
T2 69 30 1
6.9 3 0.1
T3 20 75 5
2 7.5 0.5
Table 1. DGA example cases (concentrations in ppm) [19]
Figure 5. Duval Triangle with diagnostic uncertainty for cases from Table 1 [19]
78
Phot
o: E
face
c
MONITORING, DIAGNOSTICS & DIGITALIZATION

as possible, improving the results using standard parameters [13]. The thermal behavior of a transformer is directly related to its cooling, so the type of cooling plays an important role in the correct modeling of thermal evolution. A transformer with ONAN cooling tends to heat up faster than one with OFAF cooling. In other words, different cooling types have different thermal parameters, as the respective thermal evolution curves have unique characteristics.
Ambient Temperature
Ambient temperature, as the surrounding environment of the asset, represents the baseline which temperature variations refer to. The same temperature variations with different ambient temperatures constitute different operating scenarios, one of which may exceed the maximum limits while the other may remain in the safe operating range. Ambient temperature can be a very unstable parameter, depending on factors such as geographical location, time of day as well as physical environment where the transformer is installed. In order to simulate more realistic scenarios, the ambient temperature parameter should be supported by modeling algorithms that can make use of
statistical models, historical dataand, if possible, data from local weather stations. This way, scenarios where there is a big variation in ambient temperature, as, for example, an enclosed installation with poor ventilation, can include this increase in temperature when simulating the temperature evolution.
Load Factor
The load factors used in the simulation may, depending on the transformer's impact area, be in direct relation with the region's load diagram for planned overloads or scenarios that involve disabling part of the grid as well as other assets.By using a load factor that resembles the actual load, it is possible to more effectively assess the impact on the transformer as well as the real overload periods, as there is a possibility that overloading is only required during the peak time of the network.
Limit Temperatures
As the quality of the insulating materials degrades, the permissible limits that guarantee the protectionof the asset change in relation to several factors such as moisture, dissolved gas in oil, etc.
Thus, it is important to develop algorithms that take data from oil monitoring systems, such as DGA monitors, in order to calculate approximations of bubbling inception temperatures and failure. Data provided by laboratories, such as paper analysis which cannot be done by online monitoring, is important for condition assessment and estimation of the remaining life. With these approximations, the maximum operating temperatures are adjusted continuously during the transformer’s lifetime, providing an operating range proportional to the asset’s condition.
Considerations
Although the use of thermal models is of most interest for modeling the dynamic thermal behavior of the asset, it relies on a set of simplifications of the full complex model. These simplifications are made to facilitate computation and make this monitoring method usable. For certain transformers with special characteristics, these thermal models don’t apply due to limitations of the simplifications and mathematical equations. Although this only occurs sporadically, it is a significant topic to consider, as it is important to study and validate the thermal models for each asset.
79October 2020
Issue 8
Transformer Technology
Phot
o: E
face
c
Advancements of computational power have made possible the real time use of more complex thermal models as well as the use of physical models that simulate the real behavior of material, such as oil flow. The possibility to increase the simulation complexity represents a major improvement in the reliabilityof transformer modeling.
Despite power transformers being the most efficient electrical devices, ranging from 95% to 98.5% in efficiency, power losses are a serious matter to consider when overloading a transformer, or even operate aged transformers. The benefits of overloading a transformer can quickly disappear with the increase of power losses. A lower transformer efficiency makes the overload gains only advantageous in contingency situations. From a financial point of view, overloading does not translate into optimal clear gains – namely, in order to meet electricity demand, due to losses, it is necessary to increase the applied load according to the efficiency gap. The transformer efficiency is at its maximum value when copper losses are equal to iron losses. Since the applied load is variable, following power demand, the optimal efficiency is not always achieved. When overloading, the same principle applies, but, at this operating range, the loss of life is greater than below nominal load. It is therefore of high importance to consider power losses when deciding whether to overload.
Digital Asset Management
Digital Asset Management makes it possible to supply electrical energy safely, with low maintenance costs and optimal exploitation of the active part of the transformer. By digitizing assets, various elements that make up the network are interconnected, creating an asset map that enables intelligent management based on a transparent view of its assets. Continuous monitoring and evaluation of transformer overload capability is a key element in smart grid asset management, ensuring greater control. The more information available for asset conditionevaluation, the greater the entropy
in data processing. Focusing on vital key points is of utmost importance for efficient asset health assessment. Transposing this into a fleet of assets, it is possible both to macro-manage as well as micro-manage in an organized and clear way. This flexibility enables us to adjust the grid operation to the dynamic load patterns regarding the rapid change in grid configurations, caused by the emergence of microgeneration as well as the rising electric mobility trend. Overloading power transformers is a very dangerous operation that can damage the asset and bring numerous problems to the network, and perhaps to the impact area. As the overload regime may become more desirable, it is of utmost importance to create an intelligent management network to fully understand the benefits and drawbacks of each decision over the asset fleet. Manufacturers have a vital role in pushing technology forward as they can develop management systems taking into consideration years of technical knowledge as well as develop better transformer designs based on the continuous monitoring data. Digital asset management is becoming one of the main pillars in the energy transition, as information is evolving into a more valuable resource than ever before.
80 MONITORING, DIAGNOSTICS & DIGITALIZATION
Phot
o: E
face
c

[10] Cooper Power Systems, “Enviro-temp FR3 fluid testing guide,” Reference document, April 2008
[11] “Bubbles in insulating liquids: stability in an electric field,” Proceedings of the Royal Society of London, Series A. Mathematical and Physical Sciences, vol. 280,
no. 1381, pp. 211–226, 1964[12] IEEE Std C57.104, 2008 – IEEE
Guide Interpretation of Gases Generated in Oil-Immersed Transformers
[13] IEC 60076-7, 2018 – Power transformers – Part 7: Loading guide for mineral-oil-immersed power transformers
[14] IEEE Std C57.91, 2011 – IEEE Guide for Loading Mineral-Oil-Immersed Transformers and Step-Voltage Regulators
[15] A. Emsley, R. Heywood, X. Xiao and M. Ali, "Degradation of cellulosic insulation in power transformers, Part 3: Effects of oxygen and water on ageing in oil," IEE Proceedings - Science, Measurement and Technology, vol. 147, no. 3,
pp. 115-119, 2000[16] D. Susa and H. Nordman, "IEC
60076-7 loading guide thermal model constants estimation," International Transactions on Electrical Energy Systems, vol. 23, no. 7, pp. 946-960, 2012
[17] T. Gradnik and A. Polajner, The role of direct hot-spot temperature measurements and dynamic ther-mal models in the determination of power transformers dynamic thermal rating
[18] W. Lamp, L. Petterson and L. Ovren, "Hot-spot measurements in power transformers," CIGRE Report (1984): 12-02
[19] M. Duval and J. Dukarm, "Improving the reliability of transformer gas-in-oil diagnosis," IEEE Electrical Insulation Magazine, vol. 21, no. 4, pp. 21-27, July-Aug. 2005
[20] H. Martins, "Digital Asset Management - Overload Capacity of Power Transformers," Faculdade de Engenharia da Universidade do Porto, 2019
[21] M. Guedes, "Numerical Analysis of the influence of Temperature and Moisture in the Remaining Life estimation of Power Transformers," Faculdade de Engenharia da Universidade do Porto, 2019
References[1] R. Chenier and J. Aubin, "Economic
benefit and risk evaluation of power transformer overloading," 2001 IEEE Power Engineering Society Winter Meeting, Conference Proceedings (Cat. No.01CH37194), pp. 459-462 vol.2, Columbus, OH, USA, 2001
[2] P. Sen and Sarunpong Pansuwan, "Overloading and loss-of-life assessment guidelines of oil-cooled transformers," 2001 Rural Electric Power Conference, Papers Presented at the 45th Annual Conference (Cat. No.01CH37214), 2001
[3] S. Tenbohlen, T. Stirl and M. Stach, "Assessment of overload capacity of power transformers by on-line monitoring systems," 2001 IEEE Power Engineering Society Winter Meeting, Conference Proceedings (Cat. No.01CH37194), pp. 329-334 vol.1, Columbus, OH, USA, 2001
[4] W. Fu, J. D. McCalley and V. Vittal, "Risk Assessment for Transformer Loading," IEEE Power Engineering Review, vol. 21, no. 8, pp. 58-58, August 2001
[5] N. Rashid, "Short-Time Overloading of Power Transformers," Royal Institute of Technology KTH (Kungliga Tekniska högskolan), Stockholm, Sweden, 2011
[6] R. R. Turcotte, “Causes of damage to power transformers,” in TechCon 98, pp. 169-183, 1998
[7] N. Lelekakis, D. Martin and J. Wijaya, "Ageing rate of paper insulation used in power transformers, Part 2: Oil/paper system with medium and high oxygen concentration," IEEE Transactions on Dielectrics and Electrical Insulation, vol. 19, no. 6, pp. 2009-2018, December 2012
[8] N. Lelekakis, D. Martin and J. Wijaya, "Ageing rate of paper insulation used in power transformers, Part 1: Oil/paper system with low oxygen concentration," IEEE Transactions on Dielectrics and Electrical Insulation, vol. 19, no. 6, pp. 1999-2008, December 2012
[9] M. Koch and S. Tenbohlen, "Evolution of bubbles in oil–paper insulation influenced by material quality and ageing", IET Electric Power Applications, vol. 5, no. 1,
p. 168, 2011
For overload monitoring to be as effective as possible,
centralizing all the information in one central
database is vital. A unit that can gather information
about the transformer operation and condition,
with the capability of processing this data and applying it to algorithms,
constitutes a major opportunity to evolve to a
smarter energy grid as well as protect and fully exploit the capacity of the assets
on an individual level.
81Transformer Technology October 2020
Issue 8
Phot
o: E
face
c


![EFACEC ArmenioVale [Modo de Compatibilidade]ave.dee.isep.ipp.pt/~see/jornadas2010/Jornadas/images/Pdf/EFACEC... · Aparelhagem de corte e protecção, barramento geral e compartimentos](https://img.pdfslide.net/doc/110x75/5c44727893f3c34c46572db4/efacec-armeniovale-modo-de-compatibilidadeavedeeisepippptseejornadas2010jornadasimagespdfefacec.jpg)