Embed Size (px)
Citation preview
© 2015 IBM Corporation
Business Analytics – An Industrial Perspective
Dr. Markus EttlSenior Manager – Commerce Advanced AnalyticsIBM T.J. Watson Research Center

© 2015 IBM Corporation
IBM Research
IBM at a glanceWe create business value for enterprise clients through integrated solutions that leverage innovative IT and deep business insights
$92.8B2014 Revenue $20BOperating Income
Operations in over 170 countries
ServicesKey Business Segments
Software HardwareResearch Financing
A highly inclusive workforce
380,000 employees
50% with less than 5 years of service
40% working remotely

© 2015 IBM Corporation
IBM Research
© 2014 International Business Machines Corporation
Almaden
Brazil
T.J. Watson
Austin
Ireland
ZurichHaifa
AfricaIndia
ChinaTokyo
Australia
IBM Research: 3,000 global researchers … $6.3B R&D budget

© 2015 IBM Corporation
IBM Research
Research Organization
Science & Technology
Cognitive Computing Industries and Solutions
Computingas a Service
Transformation of IT through cloud
Transformation of business through data
Next-gen IBM Watson capabilities, information management & human-computer interaction
Fundamental science to advance the core technologies that will create the future of computing and enable the areas above
© 2015 IBM Corporation
IBM Research
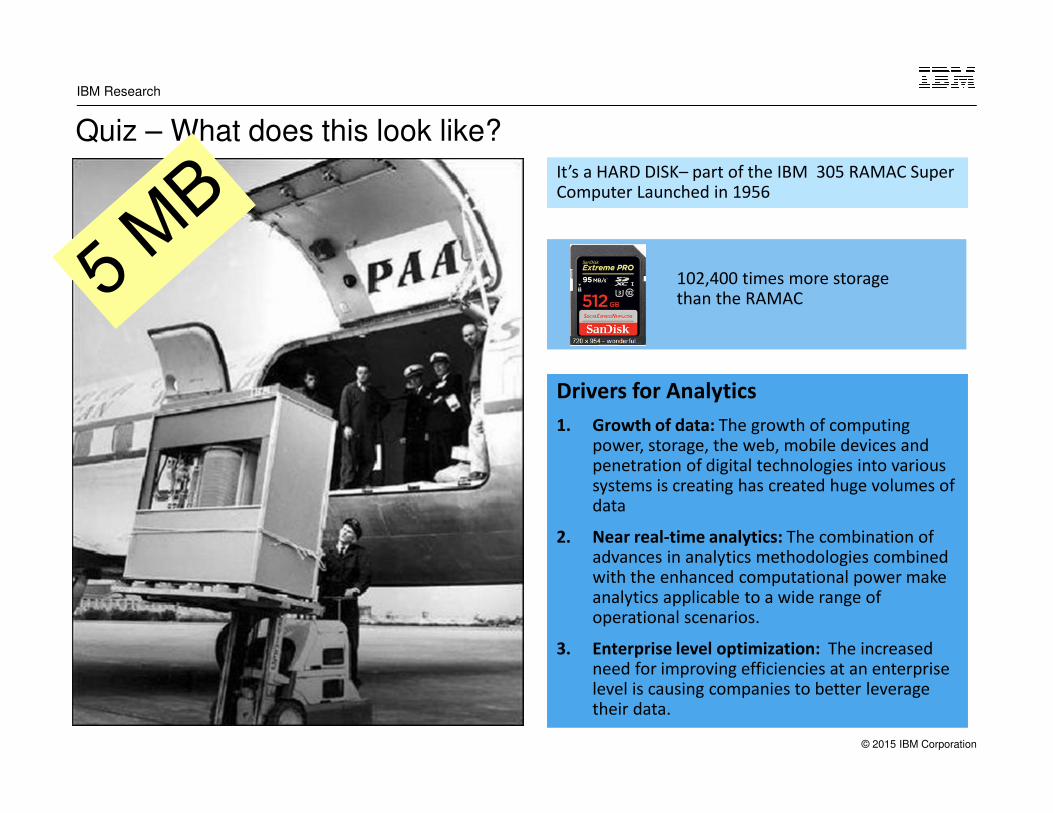
Quiz – What does this look like?It’s a HARD DISK– part of the IBM 305 RAMAC Super Computer Launched in 1956It’s a HARD DISK– part of the IBM 305 RAMAC Super Computer Launched in 1956
Drivers for Analytics
1. Growth of data: The growth of computing power, storage, the web, mobile devices and penetration of digital technologies into various systems is creating has created huge volumes of data
2. Near real-time analytics: The combination of advances in analytics methodologies combined with the enhanced computational power make analytics applicable to a wide range of operational scenarios.
3. Enterprise level optimization: The increased need for improving efficiencies at an enterprise level is causing companies to better leverage their data.
102,400 times more storage than the RAMAC

© 2015 IBM Corporation
IBM Research
An explosion of data
1.3 Billion RFID tags in 200530 Billion RFID tags in 2010
Google processes
�24 Petabytes of data in a single day
Facebook processes over
500 Terabytes of data every day
Hadron Collider at CERN generates 40 Terabytesof data / sec
For every session, NY Stock Exchange captures 1 Terabyteof trade information
Twitter processes 7 Terabytes of data every day
7.3 Billion mobile phones worldwide
2 Billion Internet users in 2011In 2015, annual Internet traffic will reach 1 Zettabyte
6

© 2015 IBM Corporation
IBM Research
say they don’t trust the information they use to make decisions
International Travelers each month
10 millionCommercial Aircraft
Engine Data
10 TB/30 mins
say they use the wrong information at least once a week
Analyze customer data for increased sales and service
opportunities
Dig deep to discover customer sentiment intent
to purchase primary/secondary customer linkages
Discover equipment component usage and failure
patterns to predict optimal maintenance needs
Big Data presents a huge opportunity – if companies can harness it
Reservations, Bookings, Sentiment, Maintenance
1 in 3 business leaders don’t trust the information they use to make decisions
Establishing the Veracity of Big Data sources
Volume Velocity Variety
+

© 2015 IBM Corporation
IBM Research
Data: the next natural resources
2010 2020
Percentage of uncertain data
Sensors & Devices
VoIP
Enterprise Data
Social Media
40 Zettabytes
Systems ofengagement
Systems of record
You are here

© 2015 IBM Corporation
IBM Research
Continuous Dialog
Personalized Interactions
Precision Marketing
Predictive Insight
Integrated Information
Next Best ActionCapture and consolidate
customer data
Understand customer purchases, preferences,
motivations and interactions
Optimize messages and offers
Provide personalized recommendations
Deliver continuous communications
Customer Segmentation
Customer Lifetime Value
Cognitive Computing
Understanding natural language
Generating & evaluatinghypotheses
Adapting & learning
Enterprise
Data Warehouse Big Data
Consumers engage more directly with businesses through multiple channels including mobile and social media

© 2015 IBM Corporation
IBM Research
Challenges
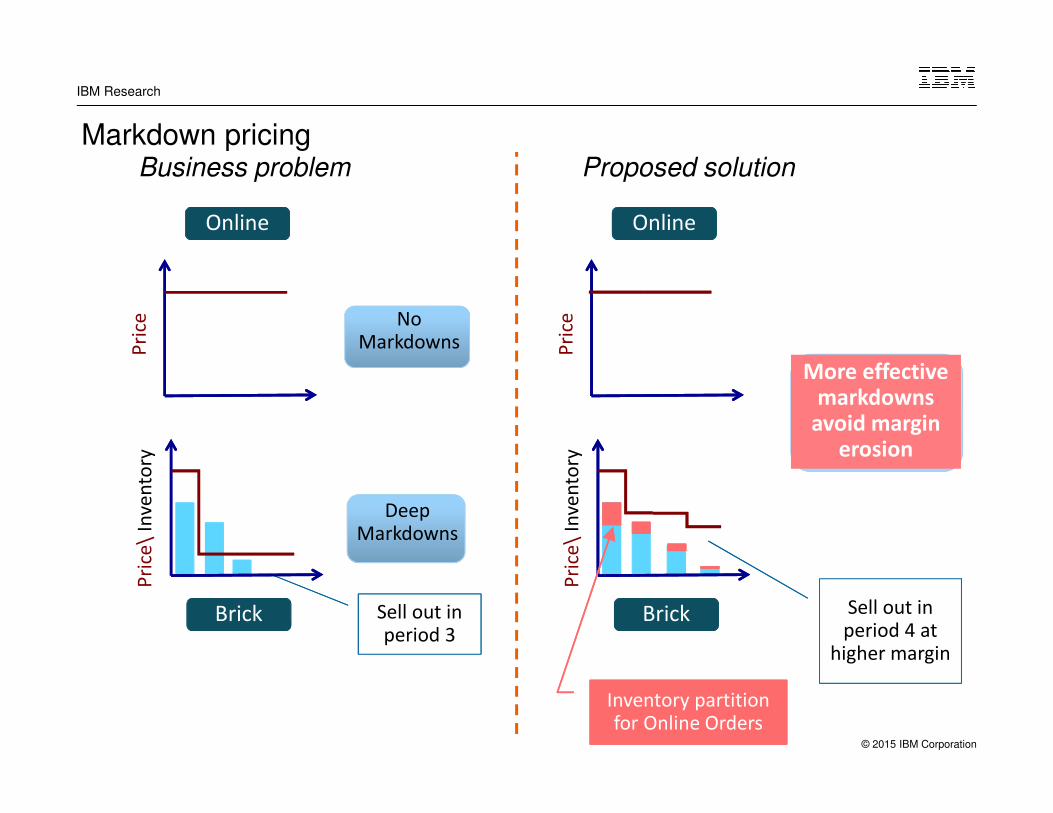
� Retailers need to ensure that pricing and inventory decisions seamlessly follow a customer across channels, maximizing the purchase decision at every touch point.
� Transparent competitor prices affect consumer purchasing behavior
� Consumer’s willingness to buy depends on the type of item, strength of competition, perception of value and brand loyalty.
Omni-channel retailing is concentrated on a seamless customer experience across all possible touch points, including stores, online, mobile, and social media

© 2015 IBM Corporation
IBM Research
© 2015 IBM Corporation
IBM Research
Sell out in period 3
No Markdowns
Deep Markdowns
BrickBrick
OnlineOnline
Pri
ce\
Inve
nto
ryP
rice
BrickBrick
OnlineOnline
Pri
ce\
Inve
nto
ryP
rice
More effective markdowns
avoid margin erosion
Sell out in period 4 at
higher margin
Inventory partition for Online Orders
Markdown pricing Business problem Proposed solution

© 2015 IBM Corporation
IBM Research
Geo-spatial market size and channel shares Example: Tablets – 45 UPCs over life of the items

© 2015 IBM Corporation
IBM Research
Demand model
Demand model can be adapted to incorporate competitor prices as attributes
Remarks:
� O(J*M) parameters for estimations
� Desirable properties for optimization
� Lost sales is unknown; estimation methods like EM or 2-step
(attraction demand model)
Market size at location j and
time t
Market share at channel m, location j
and time t
*
where = attraction to channel at location and time
Example:
(Multinomial logit or MNL)

© 2015 IBM Corporation
IBM Research
Percentage decrease in channel sales for each 1% decrease in price
Channel Price Competitor Price
Store
price
.com
price
Amazon
price
Store sales -0.6% 0.8% 0.8%
.com sales 2.9% -4.9% 1.7%
Impact of channel prices on retailer’s store and online sales Example: Tablets
If Amazon lowers prices by 1%, retailer’s store sales drop by 0.8% and .com sales drop by 1.7%.
If Amazon lowers prices by 1%, retailer’s store sales drop by 0.8% and .com sales drop by 1.7%.
*Average elasticity to final prices across entire selling season

© 2015 IBM Corporation
IBM Research
Model ValidationCompare model predicted demand/revenue against realized
16
Accounting for location-specific cross-channel impact yielded a 30-point improvement in predicting online sales and 3-point improvement in
predicting brick sales
Accounting for location-specific cross-channel impact yielded a 30-point improvement in predicting online sales and 3-point improvement in
predicting brick sales

© 2015 IBM Corporation
IBM Research
Omni-channel pricing and inventory optimization problem
17
Revenue (includes salvage)
Cost: Shipping, transportation
Online sales less than demand
Online sales less than inventory + SFS
Ship-from-store variables
Pick-up in store sales
Brick sales less than demand and inventory - SFS
Markdown prices and business rules

© 2015 IBM Corporation
IBM Research
Solution characteristics and tractability
Prices are fixed
� Easy network flow problem
� Optimal inventory ratio between brick and online at a zone depends on– Relative profitability of the two channel at the optimized prices
– Net-inventory flow in/out of a zone
Prices are decision variables
� Multi-location problems are hard problem (reduction to assortment optimization)
� Tractable MIP-based reformulation that exploits structure of attraction
demand models – Extends to any number of channels and can incorporate all business rules
– Grows linearly in the number of prices

© 2015 IBM Corporation
IBM Research
Experiments with data from a large retailer
� Product category: Tablets
– Focused on top 45 UPCs sold in both channels
that saw markdowns
– Contributed 14% of revenue of UPCs sold in
both channels
– Online channel generates 9.5% of category
sales and 85% of this is satisfied using SFS
� Weekly sales data with other attributes
– 12 months
– Attributes: prices, promotions, ads,
seasonality, holiday
– Retail store locations: 50 price zones
� Competitive prices (online only)
– Different competitors for different UPCs
– Up to 5 competitors per UPC

© 2015 IBM Corporation
IBM Research
Optimal channel pricesExample: LG G PAD 7 BLACK
Raise brick prices:
Optimized partition and lower elasticity
Reduce online prices:
Increase sales because of higher elasticity
Markdown Revenue
Actual: $202,818
Optimized: $214,626

© 2015 IBM Corporation
IBM Research
Channel level predicted sales and inventory positionsExample: LG G PAD 7 BLACK
Markdown Revenue
Optimized: $214,626
Actual: $202,818
Unsold Inventory
(OPT)
Unsold Inventory
(OPT)
Unsold Inventory (ACTUAL)
Unsold Inventory (ACTUAL)
Optimized inventory partition
© 2015 IBM Corporation
IBM Research
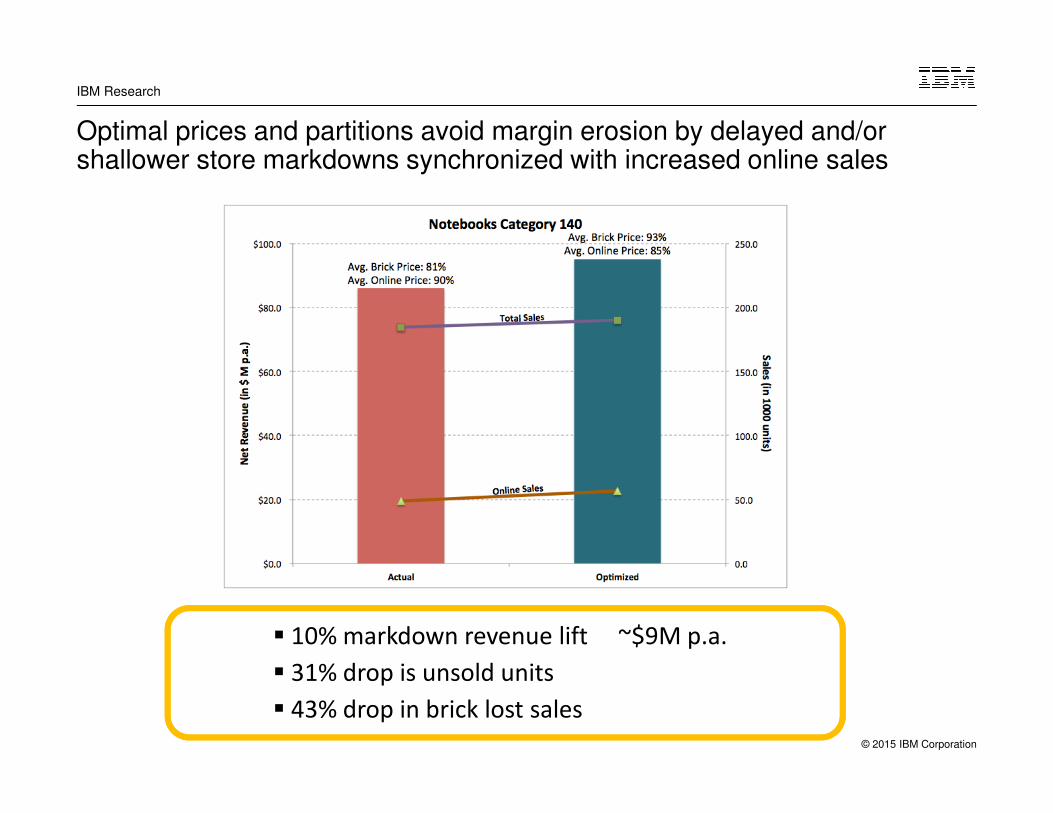
Optimal prices and partitions avoid margin erosion by delayed and/or shallower store markdowns synchronized with increased online sales
� 10% markdown revenue lift ~$9M p.a.
� 31% drop is unsold units
� 43% drop in brick lost sales

© 2015 IBM Corporation
IBM Research
Offer recommendations based on live customer profiles
•Low miles balance•Low qualifying miles balance
Blue
•Medium miles balance
•Medium qualifying miles balance
Blue •Medium miles balance
•Low qualifying miles balance
Silver
•High miles balance
•High qualifying miles balance
Gold
Looking for 2 Economy Saver tickets, which depart in 3 months. Likely a leisure trip
: Offer price discount
Looking for 2 Economy Saver tickets, which depart in 3 months. Likely a leisure trip
: Offer price discount
Looking for a connecting long-haul Economy ticket. May need lounge access during connecting time
: Upsell with Free Lounge access
Looking for a connecting long-haul Economy ticket. May need lounge access during connecting time
: Upsell with Free Lounge access
Looking for Economy Saver fare. Mileage bonus may give enough miles for Award redemption
: Upsell with Bonus Miles
Looking for Economy Saver fare. Mileage bonus may give enough miles for Award redemption
: Upsell with Bonus Miles
Looking for Economy Discount fare. Additional miles may qualify for Silver level
: Offer Bonus Tier miles
Looking for Economy Discount fare. Additional miles may qualify for Silver level
: Offer Bonus Tier miles
Looking for 1 Economy ticket, which departs in 10 days. Likely a business trip
: Upsell to Economy Premium
Looking for 1 Economy ticket, which departs in 10 days. Likely a business trip
: Upsell to Economy Premium
For the same customer, provide different offers
depending on the journey
Provide different offers for the same journey based on live
profile of the customer

© 2015 IBM Corporation
IBM Research
Machine learning techniques discover the right personalized offers that increase conversions and drive incremental revenue
Multi-Armed Bandit (MAB)
� Name is derived from a gambler trying to figure out which slot machine (aka bandit) will pay out
the most money.
� The gambler has no initial knowledge about the machines.
� The tradeoff the gambler faces at each trial is between "exploitation" of the machine that has
the highest expected payoff and "exploration" to get more information about the expected
payoffs of the other machines (the trade-off between exploration and exploitation is also faced
in reinforcement learning).
MAB for customer-centric pricing and promotions
� Compute personalized estimate of the probability that a customer will accept an offer
� Online learning models discover which customer features are most important for success
Our approach discovers these connections quickly while simultaneously limiting wasted effort on poor performing offers
Our approach discovers these connections quickly while simultaneously limiting wasted effort on poor performing offers

© 2015 IBM Corporation
IBM Research
Multi-Armed Bandit Model: Personalized Version
Each customer k is represented by a vector of features xk
� Information xk includes basic, historical, and flight features of customer k
� rk is the revenue of the ticket customer k is considering
If customer k accepts promotion i, we receive a reward of Rik, and 0 if rejected
� Reward formula: RRRRikikikik = = = = rrrrkkkk –––– cccci i i i rrrrkkkk –––– ddddi
� ci and di are the variable and fixed costs of the promotion i
The probability customer k accepts promotion i is Pik.
� Probability model (logit): �� =
���� (�����)
� The ��s are unknown and are estimated using logistic regression with data observed so far
� Let ���� and ���� denote the estimated probabilities and the std. dev. of our estimate
Personalized Upper Confidence Bound (P-UCB) technique
� Estimate ���� and ���� using logistic regression techniques
� Compute RRRRikikikik and ��� using the formulas above.
� Score for each promotion i: ��� + � �� !��

© 2015 IBM Corporation
IBM Research
Simulation results – Does personalization affect revenue ?
Experimental setup
� We simulated 500,000 website searches and customer responses (purchase/no purchase) based on actual .combooking data
� Recorded revenue lift over as-is scenario (no offers)
Observations
� Optimized promotions without personalization yield modest revenue improvements (1-2%)
� Personalization leads to a much higher gross revenue lift (5-6%) driven by higher conversions
No personalization
Personalization
No personalization
Personalization
Our simulations showed 2-3% net revenue lift (revenue increase - cost of offers)
© 2015 IBM Corporation
IBM Research