Embed Size (px)
Citation preview

Business and Biodiversity
The current state of affairs of biodiversity reporting by Dutch
businesses.
Roos van de Kraats
Reg. no: 870722-473-010
Thesis MSc Forest and Nature Conservation
Supervised by Marjanke Hoogstra - Klein
Forest and Nature Conservation Policy Group
November 2016

2
Table of contents
Glossary ....................................................................................................................................... 4
Summary...................................................................................................................................... 5
Preface......................................................................................................................................... 7
1. Introduction............................................................................................................................. 8
1.1 Background & problem statement ........................................................................................ 8
1.2 Research objectives and research questions .........................................................................16
1.3 Structure of the report ........................................................................................................16
2. Theoretical framework.............................................................................................................17
2.1 Businesses and society ........................................................................................................17
2.2 Biodiversity and business ....................................................................................................20
2.3 Monitoring and reporting ....................................................................................................23
2.4 Motivations for reporting ....................................................................................................26
2.5 Conclusion..........................................................................................................................27
3. Methodology ...........................................................................................................................28
3.1 Research approach .............................................................................................................28
3.2 Case study ..........................................................................................................................29
3.3 Data collection and analysis.................................................................................................29
4. Results – analysis of the business reports .................................................................................36
4.1 Reporting practices: outcomes content analysis ...................................................................36
4.2 Conclusions content analysis ...............................................................................................47
5. Results – interviews .................................................................................................................49
5.1 Expert interview IUCN .........................................................................................................49
5.2 Business facts .....................................................................................................................50
5.3 Business interviews .............................................................................................................51
5.4 Reporting about biodiversity ...............................................................................................58
5.5 Motivation for biodiversity reporting ...................................................................................62
5.6 Conclusions business interviews ..........................................................................................68
6 Discussion ................................................................................................................................73
6.1. Reflection on results ..........................................................................................................73
6.2 Reflection on theoretical framework ....................................................................................79
6.3 Reflection on methodology .................................................................................................81
7 Conclusions..............................................................................................................................82

3
References ..................................................................................................................................85
Appendix A Semi Structured Questionnaire ...............................................................................92
Appendix B Content analysis tables ...........................................................................................94
Appendix C Top 50 largest Dutch businesses ............................................................................ 104
Appendix D Business Descriptions ........................................................................................... 105

4
Glossary
CBD
Convention on Biological Diversity; signed by 150 government leaders at the 1992 Rio Earth Summit,
dedicated to promoting sustainable development. It aims for the conservation of biological diversity,
the sustainable use of its components, and the fair and equitable sharing of benefits arising from the
use of genetic resources.
KPI
A Key Performance Indicator (KPI) is a measurable value that demonstrates how effectively a
business is achieving key business objectives. Organizations use KPIs to evaluate their success at
reaching targets.
GAP / GlobalGAP
Good Agricultural Practices; codes, standards and regulations aimed at practices that address
economic viability, environmental sustainability, social acceptability and food safety and quality .
GlobalGAP is an international non-governmental organization that sets voluntary standards for the
certification of agricultural products.
GDP
Gross domestic product; the total market value of all final goods and services produced in a country
in a given year, equal to total consumer, investment and government spending, plus the value of
exports, minus the value of imports.
Greenwashing
Describes the process of a business, government or other group that promotes green-based
environmental initiatives or images, but in fact is using these proceedings to legitimise non-
environmentally friendly activities.
No Net Loss
A “No net loss” policy can be defined as a principle by which businesses strive to take away negative
impact on biodiversity by means of the avoidance, minimization and compensation of negative
impact, and ultimately preferably to create a positive impact.
REDD+
Reducing Emissions from Deforestation and Forest Degradation (REDD) is an effort to create a
financial value for the carbon stored in forests, offering incentives for developing countries to reduce
emissions from forested lands and invest in low-carbon paths to sustainable development.
Skal
Supervisor for proven reliability of organic products in the Netherlands.

5
Summary
The loss of biodiversity is an expanding global problem which is increasingly recognised by
(inter)national authorities, NGO's and the public. Every business has an impact on biodiversity
through its actions, however, biodiversity has been receiving little attention within businesses so far.
Attention for biodiversity fits within the frame of Corporate Social Responsibility (CSR), which
reflects: the responsibility of businesses towards society and environment. Currently only a few,
mainly big leading businesses have incorporated biodiversity as a part of their CSR or sustainability
policies. By monitoring and reporting about biodiversity, businesses can gain insight in the risks and
opportunities of their impact. Reporting is important for businesses to communicate their measures
and performance on biodiversity and to show responsibility. However, reporting on specifically
biodiversity is not often done until now, and existing biodiversity disclosures appear to be dissimilar
in quantity and quality. It is unclear what exactly is causing the low and ambiguous way of
biodiversity reporting. This gives rise to the question what the state of biodiversity reporting by
businesses in the Netherlands currently is.
The theoretical basis of this study was formed by the concept of CSR, followed by the way
biodiversity is related to the CSR policies of businesses, and the characteristics of biodiversity
reporting as a part of environmental reporting. This explorative study was focused on the first 50
large Dutch businesses listed on the Elsevier Top 500 in the year 2014, these businesses are from
several sectors. A content analysis of five years of annual or sustainability reports (2010 to 2014) of
all 50 businesses has been carried out, to determine the quantity and quality of their biodiversity
disclosure. This was done by using the coding for biodiversity themes in accounting reports, derived
from existing literature and GRI indicators developed by Grabsch et al. (2011). In addition, interviews
were conducted with 9 of the 50 businesses in order to understand their way of, and motivation for
(not) reporting about biodiversity. For every business, the person who was responsible for CSR-
reporting within the business (or very knowledgeable on the subject) was interviewed in a semi -
structured manner. The transcripts of these interviews were analysed by elaborating the
interpretations in a number of subjects, in order to get an overview of the motivations behind the
way of reporting by the businesses.
The study showed that the majority of the 50 businesses reported on biodiversity to a greater or
lesser extent, but that the overall disclosed information on biodiversity is of superficial nature. This is
evident, even though both the amount of businesses that reports, as the amount of biodiversity
related content within reports have increased over the five investigated years. Most biodiversity
related information in reports is rather vague than detailed or specific, anyhow seldom quantified. At
first sight, it seems that more businesses within the higher, ‘red’ biodiversity risk zone report on
biodiversity than in the lower amber and green risk zones, yet these differences turned out not to be
statistically significant. Some biodiversity category elements are clearly applied more frequently than
others in the business reports. Furthermore, the majority of the reports contain a low amount of
applied category elements, opposite of a small part of reports that contain many different category
elements.

6
The motivations behind the sometimes reasonable extensive , but nonetheless usually very limited
biodiversity disclosure of the businesses, are quite different. This is often due to the relationship
each business has with biodiversity, which varies per business type or sector. The most common
reasons to report on biodiversity are stakeholder engagement, continuity of the business and
transparency in relation to responsibility and reputation. Motivations to not report on biodiversity
are mainly related to the (indirect) relationship with biodiversity, low materiality of the issue and the
impossibility or complexity of quantifying biodiversity. The latter is considered to be a limitation by
many of the interviewed businesses, and also literature mentions that proper instruments for
measuring biodiversity are crucial to make reporting possible. This matter implies that for a large part
of the businesses there is mainly a practical reason for not reporting on biodiversity. The will to
report is not necessarily lacking, as for instance some businesses indicated they want to implement
the No Net Loss principle. NGO’s as well as new technologies can play an important role in initiating
this within businesses. It is concluded that this research shows that biodiversity reporting by Dutch
businesses is currently generally poor, but can be improved by the development of methods that will
help make biodiversity reporting more accessible for businesses.
7
Preface
The course of writing this thesis did not went as I had expected or had in mind in advance. But for
that very reason, I am extra proud of the end result that there is now. All the adversity I've
encountered along the way, was largely caused by force majeure. This involved a great sense of
powerlessness and dissatisfaction. Eventually I learned a lot from this difficult period, and I managed
to find the patience in order to complete this thesis in a way that I can be satisfied with.
What has helped is my great motivation to do research at, and work with the main theme of this
thesis, namely biodiversity. Biodiversity is extremely important for maintaining ecosystems that are
essential to all life on earth. Personally, I see biodiversity loss as the major upcoming world problem.
This was therefore the reason for me to delve myself into the existing problems and possible
opportunities for the halting of biodiversity loss. This motivation was why I started this Master's in
the first place, in order to contribute something here. This ambition, in spite of all obstacles,
continues and I aim to keep and exercise it after my graduation as well.
Fortunately, there a number of people who I can and should thank for their contribution to this
thesis, in whatever shape or form. For this thesis could not have been brought to a successful ending
just by myself.
During this process, I was guided by my supervisor Marjanke Hoogstra-Klein (Wageningen
University). She helped me at my starting point in finding an interesting research direction, to form a
more logic and structural work, and her critical views on the research and design encourage d me to
reach a higher level. Although little personal contact took place due to various restrictive
circumstances, there was always a lot of understanding for my situation and my progress was always
the basis.
Then, I would like to thank the people who made it possible for me to interview them, for their time
and provided information, which was essential in order to be able to write this thesis.
Last but not least, I want to thank my family and friends. In particular my partner Aschwin, who
encouraged me to follow this education in the first place, and supported me up to and including the
writing of the very last sentence of this thesis. Thank you for believing in me. You were always the
first to be there for me in the hard times, and also helped me to relax and have some fun for a
change. I am also grateful to my parents, who have always encouraged me to pursue my dreams and
were always there for me. Also, thanks to my friends who supported and encouraged me to go on.
Thanks for showing interest in what I was doing, for making me laugh at times and for identifying the
misspellings and the other advice concerning this thesis.
8
1. Introduction
1.1 Background & problem statement
1.1.1 Biodiversity decline
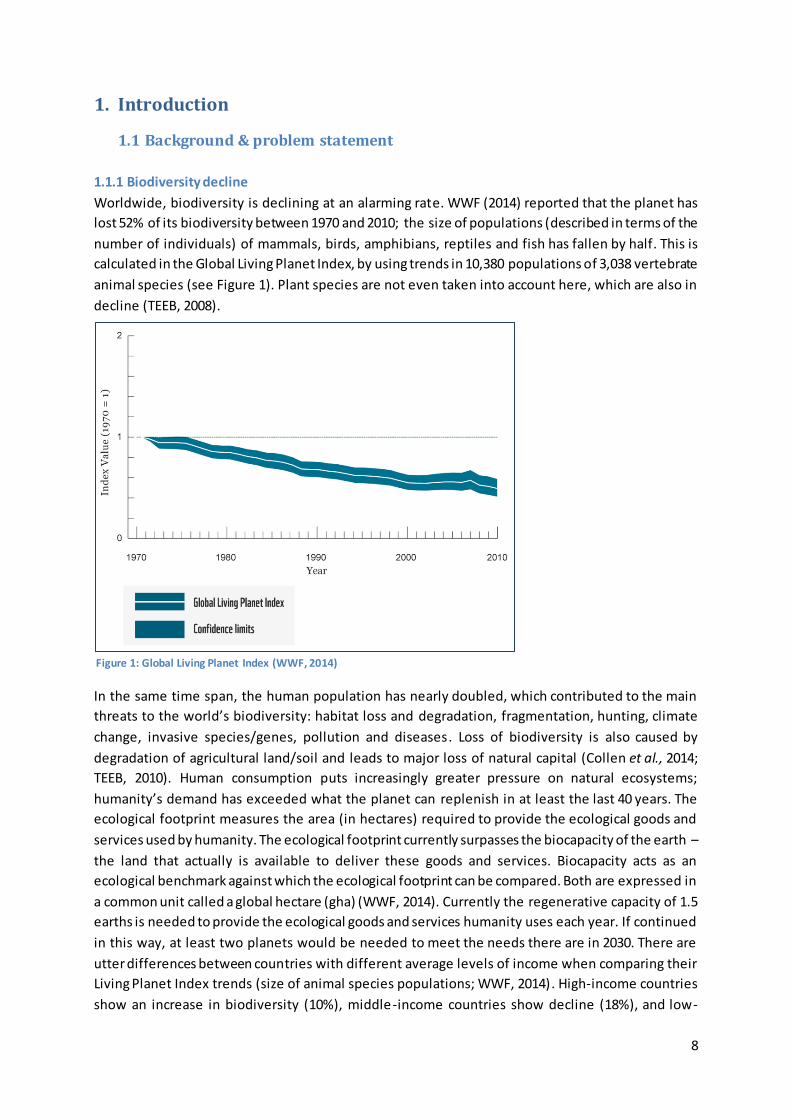
Worldwide, biodiversity is declining at an alarming rate. WWF (2014) reported that the planet has
lost 52% of its biodiversity between 1970 and 2010; the size of populations (described in terms of the
number of individuals) of mammals, birds, amphibians, reptiles and fish has fallen by half. This is
calculated in the Global Living Planet Index, by using trends in 10,380 populations of 3,038 vertebrate
animal species (see Figure 1). Plant species are not even taken into account here, which are also in
decline (TEEB, 2008).
In the same time span, the human population has nearly doubled, which contributed to the main
threats to the world’s biodiversity: habitat loss and degradation, fragmentation, hunting, climate
change, invasive species/genes, pollution and diseases. Loss of biodiversity is also caused by
degradation of agricultural land/soil and leads to major loss of natural capital (Collen et al., 2014;
TEEB, 2010). Human consumption puts increasingly greater pressure on natural ecosystems;
humanity’s demand has exceeded what the planet can replenish in at least the last 40 years. The
ecological footprint measures the area (in hectares) required to provide the ecological goods and
services used by humanity. The ecological footprint currently surpasses the biocapacity of the earth –
the land that actually is available to deliver these goods and services. Biocapacity acts as an
ecological benchmark against which the ecological footprint can be compared. Both are expressed in
a common unit called a global hectare (gha) (WWF, 2014). Currently the regenerative capacity of 1.5
earths is needed to provide the ecological goods and services humanity uses each year. If continued
in this way, at least two planets would be needed to meet the needs there are in 2030. There are
utter differences between countries with different average levels of income when comparing their
Living Planet Index trends (size of animal species populations; WWF, 2014). High-income countries
show an increase in biodiversity (10%), middle-income countries show decline (18%), and low-
Figure 1: Global Living Planet Index (WWF, 2014)

9
income countries show dramatic and marked decline (58%). These differences may reflect the way
higher income countries import resources; effectively outsourcing biodiversity loss and its impacts to
lower-income countries (Lenzen et al., 2012).
While the origination of new, and the extinction of existing species is a natural process in evolution,
at the moment the speed of extinction runs at least a hundred times as fast as it did in prehistory
(MEA, 2005). The decline is the result of (too) intensive use of ecosystems, which have many
functions to offer to human beings. This is a worrying development, as biodiversity is considered to
be essential for human kind, now and in the future. Examples of ‘ecosystem services’ are food
supply, climate regulation, water treatment and protection against natural disasters. At the same
time, there are animal and plant species disappearing that are not yet discovered or researched,
while they could be of high value, for example in medical science. Biodiversity also forms a genetic
reservoir, as scientists and business use it for the creation of new plant varieties, natural pesticides,
materials and resources (Taskforce, 2011; WWF, 2014; TEEB, 2010). Figure 2 shows the
interdependencies of human actions, economical activities and biodiversity and ecosystems. Except
for the utility of species for humans, biodiversity has its own value, the so called intrinsic value. Back
in 1982, the United Nations therefore adopted the World Charter for Nature, in which the existence
of all species is recognised, and human kind has the moral duty to respect and protect all plants and
animals (IUCN, 2014).
Figure 2: Interdependencies of humans, biodiversity, state of ecosystems and the possibility to keep delivering
ecosystem services (WWF, 2012)
Considering the threats to something as important as biodiversity, it is not surprising that biodiversity
has an important place on the international policy agenda. The European Union, for example, has set

10
the goal to stop biodiversity loss (‘No Net Loss’) and restore ecosystems by 2020, by signing the
global Convention on Biological Diversity (PBL, 2014a). The Lisbon Strategy biodiversity is part of the
goals that are set in the fields of environment, social and economic aff airs by the European
Commission and the United Nations proclaimed the year 2010 the International Year of Biodiversity
(Bosman et al, 2013). Also the amount of smaller and more national/local policy initiatives focused
on biodiversity is increasing gradually. These initiatives are government, civil or NGO-based projects,
like for example the realisation of green roofs, a bees ‘ribbon’ through the city, butterfly gardens at
health institutions and temporary nature at wastelands. This trend can be explained out of the
increasing insight there is about the direct economic importance of ecosystems and biodiversity, and
their influence on the quality of life (Taskforce, 2011; Bosman et al, 2013).
1.1.2 Business and biodiversity
Responsibility for biodiversity, however, not only lies on the policy level: every action has an impact
on ecosystems and, hence, can influence biodiversity. This can be actions on the level of the
individual, on household level, business level, governments level, etc., and on local, regional, national
and international scale. The focus of this research is on the relation of businesses and biodiversity.
The reason for this focus is that not much attention is paid to biodiversity within businesses, which
makes it interesting to find out why. Whilst impact of businesses on biodiversity can be very large, for
example through (over-)exploitation in the fisheries, forestry and agriculture sectors. The impacts of
changing biodiversity levels can also be high for businesses as important raw materials are becoming
scarce, producing waste is becoming more expensive and the re -use or recycling of resources can
decrease costs (Taskforce, 2011). The level of impact depends much on the kind of sector the
business is in (see also Table 1). Obviously, the extensive agricultural, horticultural and fisheries
(food) sector have the strongest relationship with biodiversity. These and some other sectors like the
mining sector, have consequently the highest risk of dependency and/or being a threat to
biodiversity. Some sectors do acknowledge this risk consciously, like for example the cacao industry,
in which The Netherlands plays a major role, has set the goal to be entirely sustainable by 2025.
However, the intentions with regard to specifically biodiversity are unclear here (Taskforce, 2011).
High-Risk Sector Most businesses exposed to risks. Risks likely to be significant
Medium-Risk Sector Some businesses exposed to. Risks may be significant
Lower-Risk Sector Risk variable and significance unknown.
Construction & Building
materials
Electricity
Food & Drug Retailers
Food Producers &
Processors
Forestry & Paper
Leisure & Hotels
Mining
Oil & Gas
Utilities
Beverages
Chemicals
Financial Services
General Retailers
Household Goods & Textiles
Personal Care & Household
products
Pharmaceuticals & Biotech
Support Services
Transport
Aerospace & Defence
Automobiles & Parts
Diversified Industrials
Electronic & Electrical
Equipment
Engineering & Machinery health
Information Technology
hardware
Media & Entertainment
Software & Computer Services
Steel & Other Metals
Telecom Services
Table 1. Level of biodiversity risk by sector. Within each zone, sectors are presented in alphabetical order; the ordering does not reflect different levels of risk (Parr & Simmons, 2007)
11
Attention for specifically biodiversity has been lacking for a long time within businesses, and still is.
Business developments have been mainly focused on the short term, which usually turns out not to
be the most sustainable and green way (Taskforce, 2011). In the meantime, public awareness of
biodiversity loss has been increasing, leading to changes in consumer preferences and purchasing
decisions. The last few years, some initiatives have been raised to stimulate the attention to
biodiversity. The Sustainable Trade Initiative (IDH) and Biobased Economy are examples of
programmes initiated by the Dutch government to enable cooperation between research institutes,
NGO’s, governments and businesses about this issue . Furthermore, different certification systems
have been designed for sustainable trade, like for example Rainforest Alliance, FSC (Forest
Stewardship Council) and MSC (Marine Stewardship Council) (Taskforce, 2011). The International
Round Tables for soy and palm oil are examples of partnerships between business and NGO’s, and
are multi-stakeholder mechanisms which are set up to move producers and traders toward
responsible production that does not harm nature or people (Kamphuis et al, 2014; RTRS, 2010).
The McKinsey Global Survey 2010 showed the extent to which biodiversity and ecosystems are seen
as relevant for the strategies of businesses. 27% of the respondents (businesses) finds this very
important for the business activities, more than half of the respondents thinks biodiversity can be
seen as a chance for the business (Taskforce, 2011). Attention for biodiversity fits within the frame of
Corporate Social Responsibility (CSR), a term that became popular some decades ago, which reflects
the responsibility of businesses towards society and environment. However, currently only a few,
mainly big leading businesses have incorporated biodiversity as a part of their CSR or sustainability
policies (Bergsma et al, 2014). That is not to say that businesses without an explicit biodiversity
policy, cannot have a positive effect (or damage reducing activities) on biodiversity indirectly.
Activities that businesses can undertake to reduce their impact on biodiversity indirectly, are for
instance: participation in Round Tables or the Sustainable Trade Initiative (IDH), or they agree on
cooperation or partnership with NGO’s like WWF, IUCN and Stichting Natuur en Milieu (CLM/LNV,
2010). More direct activities such as setting demands towards suppliers, supporting local nature
areas, and setting sustainability goals as well as reporting on these, are still rare (Overbeek et al,
2012a; Taskforce, 2011).
Currently, it is often simply unknown to what extent biodiversity plays a role in business activities.
For example, the international retail group Ahold names the criterion biodiversity in their internal
risk analysis of the AH-brand products, but in what way this is measured is not clear (Overbeek et al,
2012a). This lack of clarity raises more and more questions, consequently the group of consumers
that wants to see more information about sustainable products, is growing (Ernst&Young, 2010).
When a business has no results in making the production process more sustainable and green, it
can’t relate any trustworthy images and stories to its customers. A few brands and stores managed
to position themselves as sustainable in the eyes of the consumer, like for example suppliers of
sustainable ‘green’ energy such as Eneco, and car brands that introduced sustainable cars such as
electric models. Sustainability is a broad subject in this sense, and can include attention for social,
environment as well as nature, and both inside and outside the production process of businesses.
Consumers associate particular brands with sustainability, while the actual approach of these brands
towards sustainability doesn’t have to be on the same level (Overbeek et al., 2010b). Not just
consumers, but also investors, society and governments are increasingly demanding that
organisations are accountable to stakeholders, and be transparent about their activities (Abeysekera,

12
2013). Nevertheless, little is known about to what extend businesses are truly dedicated to
biodiversity and the use of resources, nor about the way in which they do communicate their
contributions to biodiversity (Overbeek et al, 2010b).
1.1.3 Business reporting on biodiversity
When businesses are dealing with biodiversity in an open and responsible way, this means they have
to monitor and report about this topic. Therefore, measuring and reporting a business’ use of natural
capital and impacts on ecosystems and biodiversity is becoming increasingly important. Anchoring
natural capital in business’ non-financial reporting provides information and can influence the
decisions made by financers and investors, and shift sectorial investment flows in a more
biodiversity-friendly direction (PBL, 2014b). Businesses that do this will understand the risks and
opportunities better and are more likely to build resilience into their business models. Assessing the
benefits businesses receive from biodiversity systematically, including their economic dependence
on such benefits is important for businesses. Under-assessment could lead to weak reporting in this
issue, leading in turn to bad practices (PBL,2014b).
Monitoring and reporting is an important ‘key step’ for action on biodiversity for business, according
to the report ‘Business & Biodiversity’ of IUCN in 2007. This report describes eight phases guiding in
operating in decreasing business’ impact on biodiversity, whereby step 7/8 is about ‘Indicators,
assurance and reporting’: measure and evaluate regularly all steps of the action plan, to assure good
progress (Parr & Simons, 2007). Reporting on biodiversity is a challenging task though, and not often
done up until now. More general issues such as greenhouse gas emissions and mitigation efforts are
reported by many businesses. Yet, biodiversity and ecosystems services are usually treated
superficially in business reports, detailed information on biodiversity is only seldom found until now.
PricewaterhouseCoopers (PwC) shows in a review (2008) of the annual reports of the 100 largest
businesses in the world that only 18 businesses mentioned biodiversity or ecosystems. Six of these
businesses denoted actions to reduce impacts on biodiversity and ecosystems, two businesses
identified biodiversity as a key strategic issue. Of the same 100 businesses, 89 published a
sustainability report, where 24 described actions to reduce impacts and 9 businesses identified
biodiversity as a key sustainability issue. These outcomes are shown in the graphs of figure 3. A
global survey of McKinsey shows similar results about business and biodiversity (McKinsey, 2010).
Figure 3: Reporting by business on biodiversity and ecosystems (TEEB, 2010)
13
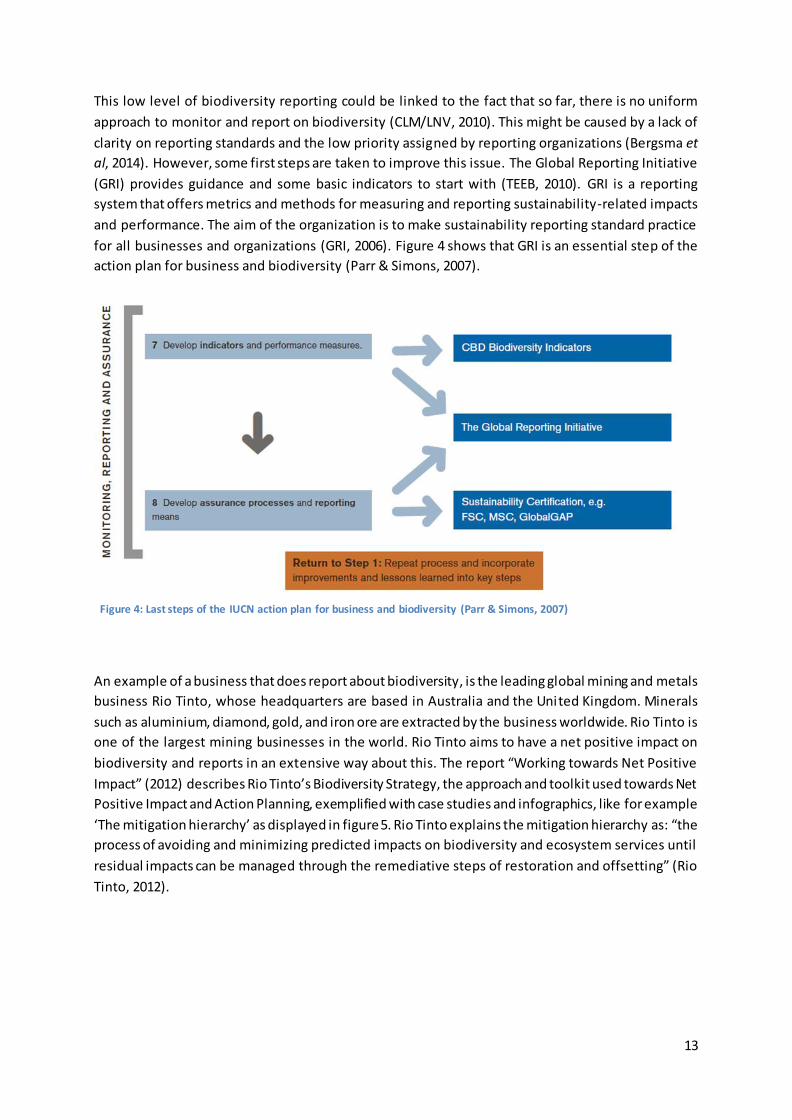
This low level of biodiversity reporting could be linked to the fact that so far, there is no uniform
approach to monitor and report on biodiversity (CLM/LNV, 2010). This might be caused by a lack of
clarity on reporting standards and the low priority assigned by reporting organizations (Bergsma et
al, 2014). However, some first steps are taken to improve this issue. The Global Reporting Initiative
(GRI) provides guidance and some basic indicators to start with (TEEB, 2010). GRI is a reporting
system that offers metrics and methods for measuring and reporting sustainability-related impacts
and performance. The aim of the organization is to make sustainability reporting standard practice
for all businesses and organizations (GRI, 2006). Figure 4 shows that GRI is an essential step of the
action plan for business and biodiversity (Parr & Simons, 2007).
An example of a business that does report about biodiversity, is the leading global mining and metals
business Rio Tinto, whose headquarters are based in Australia and the United Kingdom. Minerals
such as aluminium, diamond, gold, and iron ore are extracted by the business worldwide. Rio Tinto is
one of the largest mining businesses in the world. Rio Tinto aims to have a net positive impact on
biodiversity and reports in an extensive way about this. The report “Working towards Net Positive
Impact” (2012) describes Rio Tinto’s Biodiversity Strategy, the approach and toolkit used towards Net
Positive Impact and Action Planning, exemplified with case studies and infographics, like for example
‘The mitigation hierarchy’ as displayed in figure 5. Rio Tinto explains the mitigation hierarchy as: “the
process of avoiding and minimizing predicted impacts on biodiversity and ecosystem services until
residual impacts can be managed through the remediative steps of restoration and offsetting” (Rio
Tinto, 2012).
Figure 4: Last steps of the IUCN action plan for business and biodiversity (Parr & Simons, 2007)

14
Rio Tinto reports its sustainable development performance in line with the GRI guidelines. The Global
Reporting Initiative (GRI) recently presented some indicators for biodiversity performance, relating to
e.g. land use, habitat protection and restoration. Bergsma et al. (2014) state in their report that none
of the 20 businesses active in the Netherlands, that were part of the research, used the biodiversity
indicators of the GRI guidelines; nor other forms of indicators or guidelines. The reason why
indicators for biodiversity aren’t used, could be that there should be higher demands on reporting by
the government, or a reporting obligation. Representatives of businesses see these kinds of
regulations as a way to put biodiversity on the agenda (Bergsma et al., 2014).
The GRI guidelines are seen as a good start for a set of reporting standards in ‘integrated reporting’
(Eccles & Saltzman, 2011). This new form of reporting is becoming more and more important, as
proponents argue that traditional annual reports are no longer adequate ( NBA, 2013). Integrated
reporting is characterized by including key corporate responsibility (non-financial) information in the
financial report of the organization. In 2010, the International Integrated Reporting Committee (IIRC)
was established to achieve a globally accepted integrated reporting framework. Integrated reporting
combines financial, environmental, social and governance information in a clear, concise, consistent
and comparable format; all non-financial information should eventually be translated into relevant
financial digits. KPMG states that if businesses truly want corporate responsibility to be integrated
into the business strategy, it must be an integral component of annual reporting as well . Integrated
reporting should make clear for every stakeholder how much value a business adds or removes.
KPMG also finds that integrated reporting is still largely in an experimental stage. Businesses are
currently more likely to limit their reporting on sustainability to a special section in the annual report,
and less likely to integrate corporate responsibility information across the entire directors’ report.
One out of 15 businesses (globally) currently weaves social and environmental information into the
directors report, to the extent that this information is effectively indistinguishable from other key
business information (KPMG, 2011).
Figure 5: The Mitigation Hierarchy of business Rio Tinto (source: Rio Tinto, 2012)
15
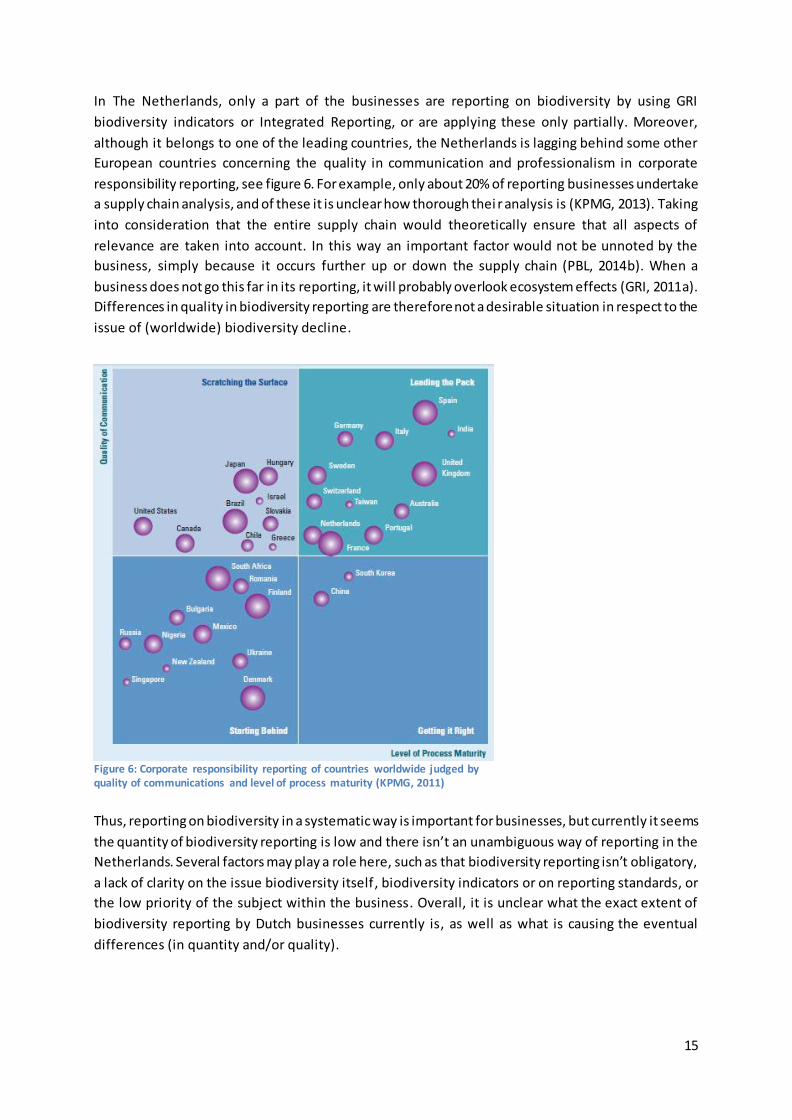
In The Netherlands, only a part of the businesses are reporting on biodiversity by using GRI
biodiversity indicators or Integrated Reporting, or are applying these only partially. Moreover,
although it belongs to one of the leading countries, the Netherlands is lagging behind some other
European countries concerning the quality in communication and professionalism in corporate
responsibility reporting, see figure 6. For example, only about 20% of reporting businesses undertake
a supply chain analysis, and of these it is unclear how thorough thei r analysis is (KPMG, 2013). Taking
into consideration that the entire supply chain would theoretically ensure that all aspects of
relevance are taken into account. In this way an important factor would not be unnoted by the
business, simply because it occurs further up or down the supply chain (PBL, 2014b). When a
business does not go this far in its reporting, it will probably overlook ecosystem effects (GRI, 2011a).
Differences in quality in biodiversity reporting are therefore not a desirable situation in respect to the
issue of (worldwide) biodiversity decline.
Thus, reporting on biodiversity in a systematic way is important for businesses, but currently it seems
the quantity of biodiversity reporting is low and there isn’t an unambiguous way of reporting in the
Netherlands. Several factors may play a role here, such as that biodiversity reporting isn’t obligatory,
a lack of clarity on the issue biodiversity itself, biodiversity indicators or on reporting standards, or
the low priority of the subject within the business. Overall, it is unclear what the exact extent of
biodiversity reporting by Dutch businesses currently is, as well as what is causing the eventual
differences (in quantity and/or quality).
Figure 6: Corporate responsibility reporting of countries worldwide judged by quality of communications and level of process maturity (KPMG, 2011)

16
1.2 Research objectives and research questions
The aim of this research is to gain insight into the motivation behind the way businesses now report
on biodiversity. Why do or why don’t businesses report on biodiversity and if they do, in what levels
of quantity and quality and why. This will help to understand why there are so many differences in
the application of biodiversity reporting and its eventual quality, and what should happen to change
biodiversity reporting by Dutch businesses towards a more clear, concise, consistent and comparable
proceeding. High quality standards for biodiversity reporting are required in order that businesses
integrate the topic of biodiversity in their business strategy, which is in favour of stopping
biodiversity decline.
The research will therefore focus on the main question:
What is the current situation of the reporting on biodiversity by Dutch businesses concerning the
degree of application and differences in quality, and what is the motivation of businesses for their
way of proceeding?
To support an answer to the main question, the following sub-questions are relevant:
Are businesses reporting on biodiversity?
1. If so:
a) How large is the population of businesses that reports? Are there changes over time, and
differences between groups / sectors?
b) How much is being reported (quantity of categories)?
c) What is being reported (which categories)?
d) What are the reasons for (the way or method of) reporting?
2. If not:
d) Why do these businesses not report on biodiversity?
e) In what circumstances would businesses report on biodiversity? What should be changed or
improved to start reporting?
1.3 Structure of the report
This thesis report consists of seven chapters. After this introductory chapter, which presents the
motivation for this research and its objectives and research questions, the report continues with a
description of the theoretical framework relevant for this study in chapter 2. Thereafter, chapter 3
introduces the research methodology used in this research by elaborating on the method of data
collection and analysis. Chapter 4 then provides the results of the content analysis, followed by the
results of the interviews in chapter 5. The report continues with a general discussion of these results
in chapter 6. The last chapter (7) presents a number of conclusions and attempts to answer the
central question of this research based on what was learned in the preceding chapters.

17
2. Theoretical framework This chapter comprises the defining of the theoretical basis of this study. To understand the link
between business and biodiversity, first the relation between business and society is explained and
defined, where the concept of CSR is of importance (2.1); followed by an explanation of the concept
of biodiversity and it’s context with business (2.2); which leads to the concept of monitoring and
reporting, where among others environmental reporting/accounting and indicators are discussed in
part 2.3. Paragraph 2.4 elaborates on the motivations for businesses to report (or not) about
biodiversity, and 2.5 then finalizes with a conclusion concerning all the themes discussed in this
chapter.
2.1 Businesses and society Customers of today are, in conjunction with improved education and sharply increased spending
opportunities, increasingly more organized, more informed and more demanding than earlier
generations of business managers encountered. More and more people believe that businesses have
a responsibility towards the environment and society. This fact requires that the businesses’ overall
strategy should embrace and implement Corporate Social Responsibility (CSR) as a core busines s
function (Isaksson et al., 2014).
2.1.1 What is CSR?
Since the onset of CSR, it has known various manifestations, and further relates to a plurality of
policy fields; however the main thread is the fact that businesses voluntarily contribute to the policy
goals to achieve. Some are sceptical about giving a definition for CSR, as it is a varied and complex
phenomenon and constantly on the move (NCW, 2000). There are several definitions for CSR used
though, this research will hold on to the following description: “Consciously focusing the business
activities to create value on the long term in three dimensions: not just financial and economic
variables, such as profitability and market capitalization, but also in ecological and social sense. A
business is therefore guided by the results on each of these dimensions, the Triple P bottom line:
Profit, People, Planet” (SER, 2000, p. 13-14). CSR is thus characterized by the interaction of a business
with its social environment. This environment is mainly formed by the so called stakeholders of the
business. A stakeholder can be defined as: “any group or individual who can affect or is affected by
the achievement of the firms’ objective” (Freeman, 1984, p. 25).
2.1.2 Origins of CSR
The origins of CSR as we know it today, date from more than a century ago. In the United States,
around the end of the 19th century, large scale charity arose out of the idea that the rich should take
care of the poor of the society. First mainly rich, individual entrepreneurs took part in this charity,
quickly they were joined by businesses. In Europe, charity has distributed less strong. With the
emergence of large-scale industrialization, European businesses started to invest money to mitigate
the fate of its employees and their families. In the Netherlands, some private initiatives from
entrepreneurs at the end of the nineteenth century, are generally considered as the first form of
corporate social responsibility (SER, 2000). These initiatives consisted out of social services like health
insurance, a savings bank, widows and orphans fund, a pension and/or support fund for their own
employees. In that time period, there were no regulations in the field of working conditions. The

18
entrepreneurs decided by themselves in what way they employed workers in their factories. Another
existing problem was that networks like family, church and the community weren’t capable enough
to meet the demand for shelter, which arose because of the labour migration from the countryside
to the city. Pressure on facilities like housing, drinking water and health care increased, which
necessitated collective insurances. Businesses, trade unions and later also the state began to play an
important role in the establishment of this. Social entrepreneurship at the end of the nineteenth
century consisted of the establishment of various funds for workers, healthcare facilities and social
housing. These efforts were more a result of pragmatic self-interest than charity or the broader
‘social responsibility’. Noteworthy is that social entrepreneurs in that time were resisting against
social legislation, because they were against a top-imposed obligation to do so. From this protest, the
first general employers' organization in the Netherlands arose, and eventually social legislation has
strongly risen at the beginning of the 20th century. It is this interaction between government pressure
and 'voluntary' business activity which forms a common thread in the development of CSR. Around
the beginning of the 20th century the foundation was laid for two principles of social responsibility:
charity and stewardship of entrepreneurs, as advocates of broader interests than just those of
shareholders (Kolk, 2003; 2004; Schrijvers, 2004; SER, 2000).
In the 1930’s and 40’s there was more attention for the social function of enterprises and the social
role of managers, but economic crises and war predominated. After WWII, collective arrangements
were made and the social security system was developed by the central governments. Mainly in the
US, the discussion about social responsibility became broader from the 1950’s. This resulted for
example in the publication of the book ‘The social responsibilities of the businessman’. What started
out of charity and securing labour, is in the more modern era of CSR widened and deepened.
However, it was a combination of own and social interest, with opposition to laws and regulations
from above. Gradually attention shifted to individual well-being and development of workers, the
production of safe and qualitative good products, and care for the wider social and natural
environment of the organization. During the 1950’s and 60’s showing responsibil ity was seen as a
very practical business interest: it could help prevent government intervention, improve the
organizations’ reputation with customers and employees, and optionally convert social problems into
market opportunities. Later also ethical and moral aspects began to play a bigger role (Kolk, 2003;
2004; SER, 2000; Schrijvers, 2004).
In the course of the 1960’s and 70’s, attention within CSR altered from social facilities for workers
towards human rights and fundamental labour standards. This was about working conditions of the
own personnel as well as respecting human rights and labour standards in other countries, for
example the economic boycott of the apartheid in South-Africa. The next important subject was, in
the course of the 1970’s, the care for the natural living environment. This came out of the
consciousness that production, distribution and consumption affected the environment more and
more. There emerged a call for codes of conduct in the seventies following controversies on
investments of multinational businesses in low-wage countries, the establishment of polluting
factories in developing countries and their role in dictatorial countries. In the 1980’s, economic crises
demanded all attention, large-scale withdrawal of the government began, markets were opened and
trade barriers reduced. But while businesses were given more freedom, gradually concerns emerged
again about possible side effects of their behaviour. Thus international organizations and NGOs
began to renovate the previous codes of conduct in the 1990’s, prepared new sample codes and

19
started putting pressure on governments to adopt legislation. Some businesses, in turn, felt
responsible to come up with their own codes of conduct, or to do so within the ir sector collectively.
This interaction has not led to legislation, but to a whole series of voluntary codes of businesses,
trade associations, international organizations and NGOs. Like the codes of conduct, also the first
attempts at social reporting have been made in the 1970’s. And here too the interest in CSR
reporting sharply decreased from the beginning of the 80’s, within businesses themselves, where it
was not institutionalized, but also with government and stakeholders. Only at the end of the 80’s the
first businesses started to publish an environmental report in response to public concern about
specific environmental problems. This has greatly expanded in the 1990’s. At the beginning of the
21st century, employers' organizations still resist against legislation on social reporting and CSR. The
government supports this, because it believes that there is a strong possibility that, once CSR is
required by law, the stimulus for initiatives from businesses will disappear and the dialogue with
society will end (Kolk, 2003; 2004; SER, 2000; Schrijvers, 2004).
The current debate about CSR brings forward, next to the focus on the natural living environment
which is still important, the globalization and liberation of economic relations. There is a global
market, global production in different countries and investments of banks and investors in
businesses in foreign countries where other regulations are used. Another important development is
the internationalisation and globalization of stakeholder organisations (global civil soci ety). Because
of globalization of the economy, multinational businesses have become more important as actors in
the world order, which has led to the discussion about their social and environmental role. Social
corporate responsibility therefore aims at the role and position of businesses in a changing economic
order. Although environmental aspects indeed are a part of the aforementioned responsibilities,
from this thought the well-known 'People, Planet and Profit (Triple' P ') emerged in recent years,
whereby organizations have responsibility for profit, people and the natural environment (SER, 2000;
Kolk, 2004; Schrijvers, 2004).
2.1.3 Implementing CSR
The assumption within CSR is that it is carried out on a voluntary basis; it takes extra-legal
arrangements to shape its social responsibility and involvement (CLM/LNV, 2010). A positive reason
to implement CSR is economic benefit, a more negative approach is the prevention of reputational
damage (Kolk, 2004). The implementation of CSR is dependent on environmental factors and
institutional features. A distinction can be made between a process approach and a performance
approach. The process approach is about putting things like publishing sustainability reports,
memberships of MVO-organisations, certifications and positions on CSR-indexes into practice. The
performance approach mainly aims to measure the results with CSR-tools. International businesses in
the Netherlands mainly apply a process approach, which makes it unclear what the results of
businesses are in their contribution to sustainability, as these are less present in their communication
(Overbeek et al., 2012b).
2.1.4 Critiques on CSR
Also some criticism may be appointed on CSR. Firstly, the wide variety of businesses, stakeholders
and civil society environments and social objectives makes CSR a varied and complex phenomenon;
hard to define and usually on one way or another linked to certain situations (SER, 2000). Another
criticism is towards the notion that businesses have a social obligation to reduce global suffering, or
20
obliged to publish their efforts on environmental and social fields in a sustainability report. Criticized
is that this imposes not only additional administrative efforts, it is also a waste of money and time ,
because such a report will only be read by a small group. The only social responsibility of businesses
is making profits; then they assure the continuity of their businesses, and employment and income
for their employees. By pursuing social and environmental objectives, firms may ultimately hurt
shareholders by generating lower profits. Entrepreneurship is inherently social; when businesses
want to go beyond that on a voluntary basis this should be supported, but an obligation to this end is
objectionable (Blowfield & Frynas, 2005; Hoevenagel, 2004). Furthermore, CSR is criticized for the
concern that many CSR initiatives amount to “greenwash”, or attempts to camouflage what is
essentially business-as-usual. Another argue is that current CSR practice is simply inadequate for the
purpose of taking responsibility for the broader impacts of business activities. The planning and
implementation of social programmes by firms would be deficient here, and state involvement and
proper monitoring are absent. Evidence for this argument however is not entirely based on fair
examples (Blowfield & Frynas, 2005).
Despite the critics against CSR, it remains to be an important topic. The citizen of today is more and
more vocal and worried about social and environmental issues. In addition, there are several
professional NGO’s that are scanning more or less continuously the social and ecological impact of
businesses in the Netherlands and abroad, to make information about businesses’ actions on these
topics available. However, businesses are making their own choices in how they are giving shape to
their CSR policy, and so major differences exist between them. For example, where one business
chooses to support the local soccer team, another might have set the goal to produce their goods
100% CO2 neutral within 5 years. Biodiversity is one of the topics that can also play a role in making
these choices. Currently this is only done by a few businesses, but the importance of biodiversity is
increasingly recognized, since biodiversity is worldwide in rapid decline, and both consumers and
NGO’s are increasingly worried about this issue, as explained in Chapter 1.
2.2 Biodiversity and business
2.2.1 Biodiversity
The term biodiversity, a contraction of the words biological and diversity, can simply be described as
“the variety of life on Earth” (Parr&Simons, 2007, p. 12). There are many different definitions for
biodiversity formulated. For example, the European Commission describes biodiversity in the
Biodiversity Strategy as “the extraordinary variety of ecosystems, species and genes that surround
us” (EC, 2011, p. 1). The Convention on Biological Diversity (CBD) defines biodiversity in a more
complex way: “the variability among living organisms (plants, animals, micro-organisms) from all
sources including terrestrial, marine and other aquatic ecosystems and the ecological complexes of
which they part. This includes diversity within species (genetic diversity), between species (species
diversity) and of ecosystems (ecosystem or habitat diversity)” (CBD, 2010, p. 15). This study will hold
on to the definition formulated by the CBD, as this is the most comprehensive and therefore most
useful definition. Biodiversity includes all ecosystems: both human-managed as well as natural
ecosystems. This means not only unmanaged ecosystems such as wildlands, nature preserves or
national parks are relevant features of biodiversity, but also managed systems like croplands,
plantations, farms, rangelands, or even urban parks have their own biodiversity. Biodiversity
21
therefore forms the foundation of ecosystem services, to which human well -being is closely linked
(MEA, 2005). Biodiversity can be measured in several ways, yet no single metric is able to capture all
its dimensions. Species richness (the number of species in a given area), relative abundance (how
much is there of any one type), species composition (ecological characteristics of the abundant
species) and interactions between these three are the most important aspects in measuring
biodiversity. Estimates of the total number of species on Earth range from 5 million to 30 million.
Regardless of actual global species richness, however, it is clear that the 1.7–2 million species that
have been formally identified represent only a small portion of total species richness on Earth
(Taskforce, 2011; MEA, 2005).
2.2.2 Relation between business and biodiversity
The focus of this study is, as described in chapter 1, on the relationship between businesses and
biodiversity. One of the most complete descriptions of this relationship has been set up by the Global
Reporting Initiative in their Biodiversity Reporting Resource document (GRI, 2007), and is displayed in
figure 7. Businesses create negative and positive impacts on biodiversity through direct activities or
indirectly through secondary effects. Changes in biodiversity as a result of the activities and
operations of businesses, cause in their turn changes in associated ecosystem services. The services
that ecosystems offer, provide economic value for businesses. They form the direct and indirect
benefits of ecosystems, and therefore of biodiversity. In cases where the income of organizations is
derived from the use of genetic resources, one of the key CBD objectives is to support the fair and
equitable sharing of benefits deriving from genetic resources. There are four types of ecosystem
services that can be distinguished (KPMG, 2012; MEA, 2005):
Provisioning services provide all sorts of products like fish, crops, wood and fibre, clean water
and medical plants;
Regulating services provide the regulation of processes in ecosystems, for example clearing
of contaminated water through ‘wetlands’, climate regulation by CO2 fixation, flood and
disaster regulation;
Cultural services like possibilities for recreation and tourism, aesthetic enjoyment and
spiritual fulfilment;
Supporting services, such as nutrient cycling, soil formation and conservation of biodiversity,
are the basis for rather all other ecosystem services.
When changes in ecosystem services occur, alterations in potential of direct use of resources take
place. Subsequently, this may impact the business’ own activities and simultaneously affect
stakeholders active in or involved with the intervention area. The CBD objectives are therefore to
ensure the sustainable use and conservation of biodiversity. Both direct and indirect impacts are
significant for biodiversity itself and the ecosystem services upon which humanity depends.
Stakeholders therefore expect organizations to be aware of their impacts on biodiversity and to
manage potential impacts properly (GRI, 2007).

22
To measure the impact and/or dependency on biodiversity, and to manage this, an understanding of
how an organization is related to biodiversity is needed. Direct adjustments to positively influence
biodiversity that can be made by businesses, can be divided into a number of categories:
• Within the business (internal), for example at business buildings and business areas, or grounds
related to business activities (water extraction areas);
• Within the chain, for example the cultivation of crops for a food manufacturer;
• Outside the business and the chain (external), for example compensation and sponsoring.
Once it is clear what risks and impacts a business has on biodiversity and in what
category/categories, a strategy with applicable measures can be developed in order to manage these
risks and impacts towards positive impact (CLM/LNV, 2010; Parr & Simons, 2007).
2.2.3 Business perspective on biodiversity
The perspectives of businesses on biodiversity are highly dependent on the kind of sector of the
business, and therefore what relationship there is with biodiversity. The stronger the dependency of
a business on natural resources and ecosystem services, the bigger the risks and the more it is likely
to want to secure the business’s activities for the future (KPMG, 2012). Consequently, the interest for
biodiversity from businesses can be approached from two different angles. On the one side the risks
of the direct and indirect dependency of (vulnerable) ecosystems for businesses are outlined. On the
other hand the opportunities for businesses in biodiversity can be emphasized (TEEB, 2010).
Research shows that the relationships that businesses see between themselves and biodiversity, are
mainly (Overbeek et al., 2012a):
1. Dependence on natural raw materials like wood, fish and agricultural crops;
2. Dependence on natural resources like clean water and fertile soil;
Figure 7: Interrelations between organizations and biodiversity (source: Biodiversity – A GRI Reporting Resource; Global Reporting Initiative, 2007)

23
3. Establishment in vulnerable (nature)area’s or the creating of a natural area for production;
4. Importance of the public opinion to consumer, government and NGO’s.
5. Production of certified / natural products by third parties.
These relations are linked to the description of the relationship between organizations and
biodiversity displayed in Figure 7 on the previous page. The relations that businesses define
themselves are about land use, extraction, the area of impact, stakeholders and sustainable use of
biodiversity.
2.2.3 Responsibility of businesses
Increasing public awareness of the role that businesses play in environmental change has attracted
the attention of a range of stakeholders. Many businesses have been criticized for causing problems
like waste production, climate change, depletion of natural resources and lagging corporate
environmental responsibility. What is fundamental here, is the view that organisations are stewards
for the assets they control, whether these assets are financial or non-financial. Businesses are
accountable for their stewardship of the environment towards society and stakeholders. Businesses
should account for the environment because of this stewardship, but also because of self -interest.
There is a direct and obvious accountability towards shareholders, yet a broader socially -legitimised
responsibility exists to stakeholders and society. For example, it is seen as morally irresponsible to
make profits by unnecessarily depleting natural resources or by polluting the environment (Arena et
al, 2015). Businesses should therefore manage their resources in a socially responsible way,
maintaining a constant stock of natural assets and they have an obligation to pass on the assets to
future generations. The imperative is to leave the next generation at least as well off as the present
generation. Businesses must not only act as good environmental citizens, but also report this good
citizenship to their stakeholders. A good environmental record will be used to judge a business’
overall performance (Hammond et al, 1995; Jones, 2003).
2.3 Monitoring and reporting
2.3.1 Concept of environmental reporting/accounting
Growing concern over environmental issues in recent decades drives the need for more
comprehensive and reliable environmental information. Businesses are increasingly expected to
publish information on environmental performance in corporate or sustainability reports, especially
since the Earth Summit at Rio de Janeiro in 1992 and the Kyoto Protocol on global warming in 1997
(Jones and Solomon, 2013). Environmental accounting adjusts national economic accounts to reflect
pollution costs and the depletion of natural resources. The basic concept of environmental
accounting is that the depletion of natural resources has real costs to society and should be treated
in national accounts in the same way as the depletion of economic capital assets (Hammond et al,
1995). A variety of voluntary disclosures of information on environmental topics are made in
environmental reports, such as energy and water consumption, greenhouse gas emissions and waste
production. In broad terms, environmental reporting is the production of narrative and numerical
information on an organisation’s environmental impact or ‘footprint’ for the accounting period under
review. In most cases, narrative information can be used to convey objectives, explanations,
reviewing previous years’ targets, addressing specific stakeholder concerns, etc. Numerical disclosure
can be used to report on those measures that can usefully and meaningfully be conveyed in that
way, such as emission or pollution amounts (tonnes or cubic metres), resources consumed (kWh,
24
tonnes, litres), land use (hectares, square metres) and similar. Environmental reporting may be used
as a communication strategy to change the perception of the public, rather than disclosing actual
corporate environmental performance. This raises concerns about a potential lack of accountability
and responsibility towards care for the environment. In reaction to public concerns relating to a
potential lack of transparency, there is an increasing tendency for businesses to independently
assure their environmental reports (Braam et al, 2016).
2.3.2 Environmental Profit & Loss Account
An emerging theme of interest within environmental reporting is the Environmental Profit and Loss
account (EP&LA). The EP&LA has been introduced for the first time in the late 1990’s as an
instrument to report the environmental and economic performance of a business in combination,
relying on emerging methodologies to calculate the economic impact of the business’ operations on
the environment. In practical terms, a business should report the cost associated with the impacts
that its activities have on the environment alongside with traditional items of current expenditures
(Bebbington et al, 2007). The EP&LA provides a view of economic and environmental performance,
translating the environmental results into monetary terms (Sabeti, 2011). This representation of the
economic and environmental performance has a potential of increasing decision-makers' awareness
about the environmental consequences of their choices, whereas the environmental impacts are
here translated in the same form and language that is used by managers in daily activities ( Arena et
al, 2015).
2.3.3 Business reporting on biodiversity
Reporting by businesses about the relationship (dependency and impacts) with biodiversity can be an
important tool for communicating with stakeholders, particularly NGOs and potential investors.
Awareness of the self-interest of businesses to evolve biodiversity conservation and recovery
activities is still limited, but businesses do pay attention to the assessment of external evaluating
organisations about their sustainability performance. Bringing out a sustainability report forms a step
to monitoring, where interconnection with the financial annual report is expected (NBA, 2011). By
measuring its performance against targets, relevant standards and stakeholder expectations, a
business can evaluate if corrective action is needed and where future targets should be set or
revised. Business actions must be transparent, through environmental reports or in any other way. It
is of interest for other parties that measures that a business takes to minimize impact on biodiversity
is insightful (SER, 2000). Data should therefore be collected from across the business using
compatible methods. Many businesses follow the guidelines of the Global Reporting Initiative (GRI)
for this purpose; what is important here with regard to biodiversity is illustrated in 2.3.5. The other
used form of reporting guidelines format is the International Integrated Reporting Framework (IIRC),
which further on will be explained in 2.3.4.
2.3.4 Integrated Reporting
Another, new and increasingly important form of reporting on biodiversity, is ‘integrated reporting’.
This method combines financial, environmental, social and governance information into one report.
The International Integrated Reporting Framework has been developed by The International
Integrated Reporting Council (IIRC); a global coalition that strives for communication about value
creation as the next step in the evolution of corporate reporting. The long term vision of the IIRC is
that integrated thinking is embedded within mainstream business practice in the public and private

25
sectors, facilitated by Integrated reporting (IR) as the corporate reporting norm. This cycle of
integrated thinking and reporting should then result in efficient and productive capital allocation, and
act as a force for financial stability and sustainability (IIRC, 2013). Also the earlier mentioned GRI
guidelines can be used as reporting standards within integrated reporting (NBA, 2013). There are
several levels of reporting perceptible: incorporating sustainability into the directors’ report, a
separate section in the annual report, or both (KPMG, 2011).
2.3.5 Indicators
Although information can provide an improved basis for decision-making and gauging progress,
accountability is possible only if goals and measures of progress are explicit. Appropriately
formulated indicators can provide such measures. Indicators that can capture complex
environmental data in an easy-to-communicate form can heighten public awareness and inspire
policy action (Jones and Solomon, 2013). Indicators provide information in a more simple and readily
understood way than complex statistics or other forms of economic or scientific data; they imply a
model or set of assumptions that relates the indicator to more complex phenomena. The goal of
environmental indicators is to simplify, and thus to improve, communication on information about
environmental problems and the effectiveness of related current policies. Therefore, changes over a
period of time concerning the problem must be reflected by an indicator, in a reliable and
reproducible way, calibrated in the same terms as the policy goals or targets linked to it (Hammond
et al, 1995).
A growing number of businesses are reporting publicly on their social and environmental
performance, mainly by following the protocols and indicators of the GRI (Parr & Simons, 2007). The
Guidelines of GRI contain two categories of Performance Indicators: Core (relevant to most reporting
organizations) and Additional (of interest to most stakeholders). The relevance and interest of these
categories of indicators for organizations and stakeholders may overlap. Performance Indicators are
structured according to a hierarchy of Category, Aspect and Indicator. One of the Aspects in the
Environmental category is Biodiversity. The GRI Core and Additional Biodiversity Performance
Indicators for the aspect Biodiversity are formulated as follows (ENxx refers to ‘Environmental
Indicator number xx’):
EN11: Location and size of land owned, leased, managed in, or adjacent to, protected areas
and areas of high biodiversity value outside protected areas (Core).
EN12 Description of significant impacts of activities, products, and services on biodiversity in
protected areas and areas of high biodiversity value outside protected areas (Core).
EN13 Habitats protected or restored (Add).
EN14 Strategies, current actions, and future plans for managing impacts on biodiversity
(Add).
EN15 Number of IUCN Red List species and national conservation list species with habitats in
areas affected by operations, by level (Add) (GRI, 2011b).
The largest part of these indicators can only be measured and monitored qualitatively, because
simple tools that ‘just’ collect biodiversity data do not exist. There are only a few aspects of
biodiversity that can be measured quantitatively, which include : trends in species variety and
abundance; level of genetic variety of biodiversity resources used in the supply chain; and the
number of hectares in areas with a high biodiversity value located within or adjacent to production
sites (GRI, 2007).
26
Fundamental to these indicators are the objectives of the CBD (Convention on Biological Diversity),
signed by 150 government leaders at the 1992 Rio Earth Summit. These objectives are: the
conservation of biological diversity, the sustainable use of its components, and the fair and equitable
sharing of the benefits arising out of the utilization of genetic resources. Other GRI Environmental
Performance Indicators, like the Aspects Water; Emissions, effluents, and waste; Energy; Transport;
and Products and services, may be as relevant for organization’s biodiversity performance as the GRI
indicators that are actually labelled “biodiversity” (GRI, 2007).
2.3.6 Benchmark
Sustainability reports can be evaluated externally by international consultancy bureaus in order to
attain a higher GRI status and better reputation. In the Dow Jones Sustainability Index, the evaluation
serves as a benchmark where a business has to score better than its section- and sector colleagues.
Nature and biodiversity can be an important part of the evaluation criteria, but this opportunity isn’t
fully used yet by businesses in general (Overbeek et al., 2012b).
2.3.7 Standardization in reporting
In order to make it possible to compare performances within biodiversity reporting of different
businesses (in benchmarks), standardization through a reporting framework is important (Eccles &
Saltzman, 2011). Standardization implicates the codification of information, all relevant parties
within the industry or organization adhere to a framework of agre ements, to ensure that all
processes are performed within set guidelines. This is to ensure that the end product has consistent
quality, and that any conclusions made are comparable with all other equivalent items in the same
class. Standardization offers businesses the opportunity to communicate with their customers,
suppliers, governments and other stakeholders (Parr & Simons, 2007). The GRI Reporting Framework
and the integrated reporting framework by the IIRC are developed to ensure the highest degree o f
technical quality, credibility and relevance (GRI, 2007; KPMG, 2011). However, current sustainability
(and thus biodiversity) reporting methods are neither universal nor standardized, since existing
frameworks are not or only partially applied in business reports (Christofi et al., 2012). This is for
example the case in Denmark, as is apparent from the research by Van Liempd and Busch (2013):
‘very little is reported about actual data or targets, costs or other quantitative data, even though
various guidelines and tools have been developed to help address biodiversity. Also, businesses in
Denmark do not seem to utilize models that are available, or the indicator protocols de veloped by
the GRI’.
2.4 Motivations for reporting Biodiversity is still a rather new theme within CSR/sustainability, policy for working with it is often
lacking, let alone reporting about it. Except for a few big leading businesses which currently are
reporting about biodiversity (Overbeek et al., 2012b). The requirements for biodiversity reporting are
not mandatory for businesses in the Netherlands. Consequently, biodiversity reporting is mainly
voluntary. Other reasons for businesses not to report on biodiversity mainly include (Jones and
Solomon, 2013; Wentzel et al., 2010):
The difficulties involved in counting highly mobile fauna
The time and costs of counting wildlife
The scope of species to be included / excluded
The inability of accounting value for wildlife to add value

27
The time and costs of reporting itself
It is too complicated
There is no demand from stakeholders
It is not a priority / material issue
There is a lack of clear guidelines / methods for biodiversity reporting.
However, a variety of possibilities for added value of biodiversity, and therefore reasons for
businesses to have a policy for biodiversity and to report about it, are (CLM/LNV, 2010; KPMG, 2012;
Overbeek et al., 2012a; TEEB, 2010):
Decreasing business risks
Cost savings through improved efficiency
Product innovation, penetrating new markets
Creation of First mover advantage
Securing ‘license to operate’
Publicity reasons
Attracting new costumers
Anticipating to social expectations; a just, responsible image/reputation
(Expected) laws and regulations
Interests of stakeholders
Being prepared for future social developments like scarcity of resources
Benchmarking; the wish to score better than branch- and sector colleagues, for example in
the Dow Jones Sustainability Index (frontrunner)
Positive influence on value of the business location
Improvement of human capital (health and attraction for employees)
The preference to be an intrinsically sustainable business.
Some critics argue that businesses may use environmental information like biodiversity to promote a
perception of environmental friendliness; a form of spin called greenwashing (Newton & Harte,
1997). Other criticisms comprise the assumption that disclosed information about biodiversity in
business reports is biased, and focuses on PR-friendly positive examples, partnerships, eco-
programmes and suchlike. And thereby the actual measuring and reporting of any negative impacts
of the business on ecosystems and biodiversity are ignored (Van Liempd and Busch, 2013).
2.5 Conclusion
In conclusion, biodiversity is becoming an increasingly important part of CSR, which is expected by
stakeholders to be implemented by businesses. Businesses have an impact on biodiversity and
ecosystems either directly or indirectly. It is usually in the business’ own interest, if not that of its
stakeholders, to manage these impacts and to report about the business’ performances concerning
biodiversity. To make biodiversity reporting a clear, concise, consistent and comparable proceeding,
the use of standardized reporting frameworks is important. However, differences in degree of
application and quality within current biodiversity reporting by Dutch businesses are large, and it is
unclear what causes these differences; why do businesses report about biodiversity in the way they
do? The explanation of the concepts within this theoretical framework are relevant as this will help
to understand more of the creation, operation and motivation behind biodiversity reporting by
businesses. Ultimately, this will contribute to find an answer to the main research question of this
study.

28
3. Methodology This chapter will give a description of the methodological approach that is applied in this research.
The research approach is explained first (3.1), then the case study and sample are described (3.2),
and finally the collection and analysis of the data will be described (3.3).
3.1 Research approach
This study is an explorative research, which is characterized by the objective to develop hypotheses,
rather than testing them (Kothari, 2004). In explorative research, data is collected and analysed in a
systematic way to find possible new relations or new facts. An exploratory study is usually applied to
explore those situations in which the intervention being evaluated has no clear, single set of
outcomes (Yin, 2003), as is the case with the topic of biodiversity reporting by Dutch businesses. So
far, no overview exists of biodiversity reporting by businesses across the Netherlands, let alone of
why they do or don’t report. To explore the current state of biodiversity reporting, this study makes
use of a case study approach. Case studies help to understand complex social phenomena, in this
matter to gather knowledge of the organizational processes in Dutch businesses. A case study allows
the investigator to focus on a “case” and obtain a holistic and real -world perspective. Using case
studies as a method makes it therefore possible in this study to explain “how” or “why” some social
phenomenon works, and to provide an extensive and “in-depth” description of the social
phenomenon (Yin, 2014).
Study designs distinguish between quantitative and qualitative study designs. Quantitative studies
are well-structured, use surveys and experiments as inquiry strategies, use standards for validity and
reliability and statistical procedures. Quantitative methods are characterized by numeric data,
predetermined approaches and closed-ended questions. Qualitative studies on the other hand, use
inquiry strategies as phenomenology, grounded theory, ethnography, and narrative. Characteristic
for qualitative approaches are a specific in-depth focus and open-ended questions through
interviews, validation of the accuracy of findings, emerging approaches, and text or image data
(Creswell, 2003). This research tends to explore and analyse the current state of biodiversity
reporting by Dutch businesses, which requires the use of a quantitative approach. Besides that, also
the motivation behind this way of biodiversity reporting is explored, where a qualitative approach is
applicable. Therefore, the use of a mixed methods study design is the most appropriate for this
study: a combination of both quantitative and qualitative methods. By integrating qualitative and
quantitative data, data is connected through the use of one type of data analysis to inform the
collection of a second type of data at a subsequent time point (Creswell et al., 2011). In this way, the
collected data are analysed using methods appropriate to the type of data collected. This
methodological plurality of two types of results can provide a more complete understanding of the
phenomenon under investigation, than either approach could on their own (Landrum & Garza, 2015).
In this research, the quantitative approach will be useful for the part of analysing the physical reports
for their content; quantities are collected and analysed with statistical tests. The qualitative approach
subsequently has the benefit of gaining in-depth knowledge and aims for detecting underlying
motives, and is applied for the interview part. Qualitative approaches are considered to be
particularly applicable when exploratory research is carried out (Kothari, 2004).

29
3.2 Case study
In this research, The Netherlands is chosen as case to focus on; specifically on Dutch businesses (or
businesses with a headquarter based in The Netherlands). As shown in figure 6 earlier in this report,
there is still a lot of room for improvement in corporate responsibility reporting in the Netherlands
compared to some other European countries with similar economies. Businesses based in The
Netherlands are therefore considered to be an interesting case in this study, for exploring their way
of biodiversity reporting and their motivation behind it. Accordingly, biodiversity reporting is
examined for the largest (top 50) Dutch businesses. These are chosen, since one can expect these
businesses to have the largest impact on biodiversity both inside as outside the country, and thus the
greatest need for accountability to various stakeholders. Business operations are factors that affect
ecosystems and biodiversity on both national and international level. These factors are associated
with major drivers of biodiversity loss as set out in the Millennium Ecosystem Assessme nt; climate
change, land use and emissions that have a toxic, acidifying or eutrophying effect (MEA, 2005). The
impact on biodiversity by Dutch businesses is mainly caused by import, agriculture and energy
supply, and varies by business, by product and by industry. Land use, coupled with operations in the
Netherlands and import, is approximately equal to seven times the surface area of the Netherlands.
The land area of the Netherlands (excluding water) is 33,883 km2. Whenever emissions are included,
the impact of land usage for built environment (in Europe) is equivalent to some 400,000 km2
(Bergsma et al., 2014). Because of this extensive impact Dutch businesses have on biodiversity
(worldwide), this case is considered significant and it is of great importance to investigate and
analyse how these businesses deal with reporting about this issue.
3.3 Data collection and analysis
This paragraph illustrates how the data for this research is collected and analysed; the first part
explains globally the methods that are used for data collection and analysis (3.3.1), the next part
discusses the procedure of the content analysis (3.3.2) and the third part describes everything of
interest about the interviews (3.3.3).
3.3.1 Methods used
Different methods for collecting data have been selected on their ability of answering the research
questions as described in chapter 1.3. The answering of these questions requires data from different
sources. This study makes use of a combination of desk research and field research. This combination
of research methods are a form of triangulation. The concept of triangulation can be defined as “the
use of more than one method for gathering data” (Denzin, 1970). Triangulation is used to enhance
confidence in research’ ensuing findings. Webb et al. (1966) state that when an assertion has been
confirmed by two or more independent measurement processes, the uncertainty of its interpretation
is highly reduced. Triangulation gives a more detailed and balanced picture of the situation (Altrichter
et al., 2008). The first three sub-research questions of this study (questions 1a, b, c; see chapter 1.3)
can mainly be answered by applying desk research, and the last sub-questions (1d and 2a, b, c)
mostly requires field research. However, all used methods will have overlap and are applicable to all
research questions.
3.3.2 Desk research – content analysis
In the desk research, content analysis of documents will take place. Content analysis is used as a
technique for analysing data, and involves codifying qualitative and quantitative information into
30
pre-defined categories in order to divert patterns in the presentation and reporting of information.
Content analysis aims to analyse published information systematically, objectively and reliably
(Guthrie et al., 2004).
Sample
The sample consists of the first 50 large Dutch businesses listed on the Elsevier Top 500 in the year
2014 (see appendix C). The content analysis has been carried out over time, in order to determine
whether the quantity of biodiversity disclosure had changed in this period. Therefore five years of
annual or sustainability reports (2010 to 2014) were analysed for all of the 50 businesses. Campbell
(2000) stated that annual reports can be seen as an adequate barometer of a business's attitude
towards social reporting. One reason for this is that the business has complete editorial control over
the document (except the audited financials section). Besides that, it is usually the most widely
distributed public document produced by the business. In many jurisdictions, annual reports are
required by legislation and are produced on a regular basis by all businesses. This makes access to
these documents relatively easy (Campbell, 2000).
This sample of 50 businesses is a purposive sample, also known as selective sampling, which has the
advantage of obtaining a relatively complete picture of the whole population in the investigation of a
relatively small part of the population (Bryman, 2008). This is in consistency with the use of a case
study methodology in this study, which is characterized by being selective, strategically sampling a
small number of research objects, and exploring depth more than breadth. The purpose of the
research is to develop theory, not to test it, therefore theoretical (not random or stratified) sampling
is appropriate. In theoretical sampling cases are selected because they are particularly suitable for
illuminating and extending relationships and logic among constructs (Eisenhardt and Graebner,
2007). In this purposive sample, consisting of all large businesses based on their overall turnover, the
attempt was to deliberately analyse businesses of the widest variety of sectors possible. Moreover,
the content analysis was applied over time, by analysing reports from each business over a period of
five years. This provides, in addition to the variety of business types, qualitative results about each
business. The diversity of the sample in combination with the quality of analysis prepares for an
understanding of what is at stake within the whole population.
Categories
The categories that are used in a content analysis can be determined inductively, deductively, or a
combination of both. Inductive analysis refers to approaches that primarily use detailed readings of
raw data to derive concepts, themes, or a model through interpretations made from the raw data by
an evaluator or researcher. In a deductive approach, some categorical scheme suggested by a
theoretical perspective is used, and the documents provide a means for assessing the hypothesis
(Krippendorff, 1990; Thomas, 2006). In this study, a qualitative de ductive content analysis was
applied, in view of the fact that categories are used to analyse the data. First, the business reports
are examined for the presence of the key terms associated with genetic and eco-systemic
biodiversity. This is to determine whether a business reports about biodiversity or not, and if the
report contains enough relevant content to be examined. The key-terms that every report was
screened for, are: “biodiversity”, “habitat”, “eco-system”, “conservation”, “species”, “flora”,
“fauna”, “wildlife,” “marine life” and “maritime life”. This was done by typing each of the terms in
the search function within the document. If the report does include one or more of these key terms
and thus reports on biodiversity, it was further analysed in more detail to determine the quality of

31
biodiversity reporting. To accomplish this, the coding for biodiversity themes in accounting reports ,
derived from existing literature and GRI indicators developed by Grabsch et al. (2011) will be used.
The coding is divided into seven categories, which are displayed in Table 2. All documents are
manually coded based on the variables from this model, again by using the search function within the
document. The 18 different ‘elements’ within the categories then form the specific research units.
Table 2: Coding for content analysis of business reports (Source: Grabsch et al., 2011)
Thereafter, information about every business related to their reporting was collected and put in a
table. This information, which can be found in Table I (Appendix B) includes consecutively:
Category Element Defining
Scene-setting Definition Whether business reports a definition of biodiversity
Mission
statement
Reporting of any biodiversity-related mission statement or
general aim relating to biodiversity
Species
related
Site-specific Reporting of biodiversity information relating to specific sites,
including biodiversity case studies
Specific species Mention of specific species
Surveys Reporting of biodiversity surveys conducted
IUCN Redlist Mention of the IUCN Redlist
Social
Engagement
Partnerships Organisations (NGOs, universities, governments)with which the
business has partnerships on biodiversity
Awards Awards/prizes gained by the business in relation to biodiversity
Stakeholder
engagement
Reporting relating to any form of engagement by the business
with stakeholder groups on biodiversity issues, such as
engagement with local communities and schools, employee
training and away days, feedback from stakeholders on
biodiversity issues within the business
Performance
Evaluation
Targets
performance
Discussion of biodiversity-related performance, achievement of
targets
Costs Reporting of costs relating specifically to biodiversity as a result
of rehabilitation, closure, or specific initiatives
Risk Risk Reporting and assessment of biodiversity risk
Risk
management
Any information relating to systems/processes developed to
manage or mitigate biodiversity risk
Incidents Reporting of specific incidents/accidents which impacted (or did
not impact) on biodiversity
Materiality Indication that biodiversity is considered to be a material risk
for the business
Internal
Management
BAP Information relating to biodiversity actions plans (BAP)
BD Officer Whether the business reports that they have a specific officer
with responsibility for biodiversity (BD)
External
Reports
GRI Reference to GRI reporting indicators

32
First, all the 50 businesses were distributed into 5 main ‘super sectors’: Consumer goods,
Financial services, Raw material extraction, Industry, and Trade, transport and commercial
services (containing respectively 9, 12, 8, 9 and 12 businesses). This was done in order to
investigate possible differences in degree of biodiversity reporting between sectors. Noted
should be though, that this study does not assume that the results concerning these five formed
super sectors, can represent the actual full sectors within the whole country.
Subsequently, the concerning businesses were classified into the corresponding biodiversity risk
zone, dependent on their sector. This was carried out by making use of the information from
Table 1, page 6. In this latter table, business sectors are ranked based on the relationship
between businesses and biodiversity which are most likely to lead to material risks. Sectors are
assigned to one of the three biodiversity risk levels: red, amber or green. The classification
system is as follows:
(1) Red-zone sectors: most businesses are likely to be exposed to biodiversity risks and risks are
likely to be significant;
(2) Amber-zone sectors: some businesses are likely to be exposed to biodiversity risks and risks
may be significant; and
(3) Green-zone sectors: fewer businesses are likely to be exposed to biodiversity risks and it is
harder to identify how risks may affect the businesses.
This classification was applied to investigate whether businesses in a given zone report more or
more often than businesses in the other zones. This is because it is likely to expect that those
business in the higher risk zone (red zone) report more about biodiversity.
Then, the rank of the business in the top 50 list of Dutch businesses that has been used for this
study, can be read in the next column of the table.
Next, the table distinguishes the different reporting forms in which businesses can report to their
stakeholders. In succession, the reporting varieties relevant for this study are: Comprehensive
annual report, Separate CSR report, UN Global Compact Progress Reports, or on the business
website. The table shows for which years these reporting disclosures are applicable for each
business (except for website, this was only possible to check at the year of research; 2015). The
classification ‘Comprehensive annual report’ was given when biodiversity is mentioned at least
once in the business’ financial report, or integrated report when applicable. The table also shows
if the business had filled in the GRI Index, and if so in what year(s). The GRI index may be absent
for some businesses in some years, while they conform to reporting one or more of the GRI
indicators in the report. The GRI-index therefore stands often apart from the report.
Lastly, the table shows for all of the five identified ‘super sectors’ (which are listed in the very
first column of the table), how many businesses mention biodiversity either in their report, GRI -
index or on the website, and what percentage this is from the total super sector.
Defining biodiversity reporting quality
The next step was to investigate and map the actual quality of the biodiversity reporting, by
analysing which of the coding categories (as explained in Table 2, page 27) is applied in the business
reports. This was investigated for all the 50 businesses and their reports from the last five years:
2010 to 2014. Therefore, the texts about biodiversity and related information written in the
sustainability, financial or integrated reports, were analysed for containing information that
conforms to the coding categories. This data is displayed in the comprehensive table number II that

33
can be consulted in Appendix B, the chapter Results (4.1) hereafter will present a summary of the
data.
Elaboration
The results of the content analysis are processed into tables and graphs. To test the differences in
the number of biodiversity disclosures in total by all businesses between the years 2010 to 2014, and
the percentage of the businesses in total that were investigated that is reporting about biodiversity,
statistical analysis is applied by using statistics programme SPSS. There has been chosen for One-way
Anova tests with significance interval α = 0,05. Ultimately, the outcomes of the categorization and
coding of the data helped the researcher to report the findings for this study and later helped in
discussing these findings in relation to the research objectives and research questions.
Validity and reliability
Three types of reliability for content analysis are identified by Krippendorff (1990); stability,
reproducibility and accuracy. Methods to increase the reliability in recording and analysing data can
be accomplished by selecting disclosure categories from well-grounded relevant literature, and
clearly defining them. Furthermore, by establishing a reliable coding instrument with well‐specified
decision categories and decision rules (Guthrie et al., 2004). The criteria of selection applied in
content analysis must be adequately profound to account for each variation of message content, and
should be practiced strict and consistently. That is to ensure that other researchers or readers,
looking at the same messages, would acquire the same or comparable results. This may be
considered a manner of reliability, and a validation of eventual findings (Krippendorff, 1990). To
identify any possible difficulties the coding scheme in this study is first piloted. Therefore consistency
between the researcher and another reader is tested to determine the reliability of coding. This
incident is called inter-coder reliability (Bryman, 2012).
3.3.3 Field research - interviews
In order to understand the way of, and motivation for (not) reporting about biodiversity, interviews
were conducted. The field research therefore consisted out of semi-structured personal interviews.
Such interviews can provide insight into the intentions behind reporting. Distinctive for semi-
structured interviews is a qualitative methodology, in-depth interview character and the use of a
topic or theme list with generally open-ended questions (Jennings, 2001). This gives the respondent
the chance to come up with his or her own answer, without being influenced by (the way of)
questioning. Compared to an unstructured approach, the semi-structured approach has the benefit
of being more structured, whereby the interviewer can keep track of the conversation and keep an
overview of what is said. In comparison to structured interviewing, semi -structured interviews are
open-ended and have the advantage that it is possible to explore and expand the given information.
Because of the chance to miss important information in structured interviews, there is chosen for the
semi-structured approach in this study.
The disadvantage of semi-structured approach of interviews, can be the insecurity about the
reliability and validity of the data collection, because this style is closer to unstructured than
structured interviewing. This problem is easily solved by recording and making transcripts afterwards
of all interviews. This enables a systematic analysis of the data (Berg&Lune, 2012; Baxte r&Babbie,
2003).

34
The interviews are structured in such a way that becomes clear why the business reports in the way
it does about biodiversity (concerning sub-research question 1.d: What are the reasons that lie
behind the choices of the businesses for their way of reporting? ). To get to know this, it is important
to obtain information about how the businesses see reporting on biodiversity; what do they think
that should be reported on, and in what way (standards, quantity and choice of categories)? These
questions are related to the first three sub-research questions (chapter 1.3). The list of open-ended
questions that are used for the interviews can be found in Appendix A. This list contains the
questions translated into English, the original interview questions are in Dutch.
Selecting respondents
The interviews were conducted with representatives (responsible or knowledgeable about the
business reporting) of several Dutch (inter)national businesses, from the 50 large businesses as used
in the content analysis (Appendix C). All 50 were contacted by e-mail or phone with the request for
an interview, in total 10 interviews were conducted, see Table 3 for the list of respondents.
Moreover, in total 33 businesses replied to the request, of which 9 were prep ared to give an
interview. Appendix D provides business descriptions of these 9 businesses. 17 businesses didn’t
reply or were not reachable. There were different reasons given by the businesses that didn’t want
or weren’t able to give an interview. Often mentioned was that biodiversity is not a material issue for
the business, and/or the impact of the business on biodiversity is minimal because biodiversity is not
closely related to their business activities, for example because they don’t produce the products their
selves. Others, mainly insurers, explained their CSR policy is aimed at social aspects (people) rather
than environmental aspects (planet), and therefore biodiversity is not part of their core business. A
few businesses argued that their reporting on this theme was still in progress at that moment, which
questioned them of being able to provide answers in an interview about biodiversity reporting. Lastly
there were several businesses that rejected the request for an interview due to lack of capacity (in
time and/or personnel) to handle the large number of requests they receive from students and other
stakeholders.
Before contacting businesses with the request for an interview, an orientating interview was
conducted with an expert of the organisation IUCN. This was in order to retrieve information about
the current issues, findings and questions around biodiversity reporting. This interview was helpful in
order to formulate relevant interview questions.
In first instance, the focus is intended on both businesses that report on a high quality level, as well
as businesses that hardly or do not report on biodiversity at all. This composition provides an
overview of the motivations that lie behind the different levels of quality in biodiversity reporting. It
will be interesting to find out if there can be found any differences and what conclu sions can be
derived from this.
The semi-structured, open-ended interviews are recorded and thereafter transcribed. The transcripts
are analysed and used to draw conclusions on the motivations behind the way of reporting by
businesses. This is done by eliminating information that is not relevant for answering the research
questions, and subsequently by elaborating the interpretations in a number of subjects.

35
Organization Name interviewee Function
Achmea Menno van Lieshout Senior advisor MVO
Ahold Andrea Bolhuis Harm-Jan Pietersen
Specialist Product Sustainability - Product Integrity Department Project Manager Responsible Retailing
AkzoNobel
Alistair Reid Manager Innovation, Partnerships & Biobased Materials
BAM
William van Niekerk CSR Director
DSM
Patrick Van Bael Sustainability Manager at Corporate Operations & Responsible Care
Eneco
Silvan de Boer Senior Sustainability Officer
IUCN
Bette Harms (independent expert)
Advisor Business & Biodiversity, Coordinator of the Leaders for Nature Academy
SABIC
Bert Bosman Technical Manager Energy Energy & Climate Services
Technische Unie
Robert Brouwer Project manager MVO
VION Bert Urlings Corporate Director Quality Assurance
Table 3: List of interviewed persons, their functions and corresponding organizations
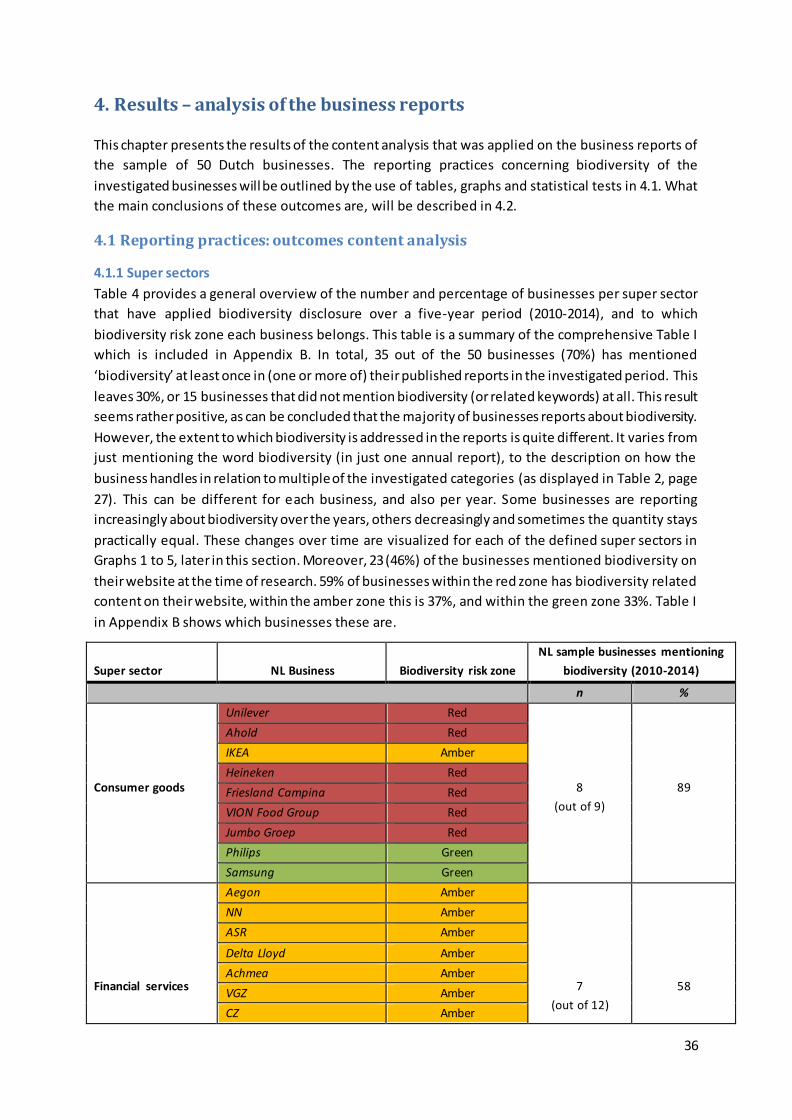
36
4. Results – analysis of the business reports This chapter presents the results of the content analysis that was applied on the business reports of
the sample of 50 Dutch businesses. The reporting practices concerning biodiversity of the
investigated businesses will be outlined by the use of tables, graphs and statistical tests in 4.1. What
the main conclusions of these outcomes are, will be described in 4.2.
4.1 Reporting practices: outcomes content analysis
4.1.1 Super sectors
Table 4 provides a general overview of the number and percentage of businesses per super sector
that have applied biodiversity disclosure over a five-year period (2010-2014), and to which
biodiversity risk zone each business belongs. This table is a summary of the comprehensive Table I
which is included in Appendix B. In total, 35 out of the 50 businesses (70%) has mentioned
‘biodiversity’ at least once in (one or more of) their published reports in the investigated period. This
leaves 30%, or 15 businesses that did not mention biodiversity (or related keywords) at all. This result
seems rather positive, as can be concluded that the majority of businesses reports about biodiversity.
However, the extent to which biodiversity is addressed in the reports is quite different. It varies from
just mentioning the word biodiversity (in just one annual report), to the description on how the
business handles in relation to multiple of the investigated categories (as displayed in Table 2, page
27). This can be different for each business, and also per year. Some businesses are reporting
increasingly about biodiversity over the years, others decreasingly and sometimes the quantity stays
practically equal. These changes over time are visualized for each of the defined super sectors in
Graphs 1 to 5, later in this section. Moreover, 23 (46%) of the businesses mentioned biodiversity on
their website at the time of research. 59% of businesses within the red zone has biodiversity related
content on their website, within the amber zone this is 37%, and within the green zone 33%. Table I
in Appendix B shows which businesses these are.
Super sector
NL Business
Biodiversity risk zone
NL sample businesses mentioning
biodiversity (2010-2014)
n %
Consumer goods
Unilever Red
8
(out of 9)
89
Ahold Red
IKEA Amber
Heineken Red
Friesland Campina Red
VION Food Group Red
Jumbo Groep Red
Philips Green
Samsung Green
Financial services
Aegon Amber
7
(out of 12)
58
NN Amber
ASR Amber
Delta Lloyd Amber
Achmea Amber
VGZ Amber
CZ Amber

37
Menzis Amber
ING Amber
Rabobank Amber
ABN AMRO Amber
SNS REAAL Amber
Raw material
extraction
Shell Red
6
(out of 8)
75
Vitol Red
Gasterra Red
Argos Energies Red
Esso NLc
Red
BP NL Red
Cargill NL Red
Tata Steel (Global) Green
Industry
SABIC Amber
8
(out of 9)
89
AkzoNobel Amber
DSM Amber
ASML Green
Technische Unie Amber
Cisco Systems Green
BAM Red
Essent Red
Eneco Red
Trade, transport and
commercial services
Nidera Red
6
(out of 12)
50
Glencore Grain Red
Cefetra Red
SHV Green
Randstad Green
BCD Travel Red
KLM Royal Dutch Airlines Red
TNT Express Amber
Pon Holdings Amber
KPN Green
CRH Red
LeasePlan Corporation Green
Table 4: Overview of biodiversity disclosure by super sector
Table 4 shows that both the super sectors Consumer goods as well as Industry have the highest
percentage of business that report about biodiversity; both 89%. For the Consumer goods sector this
is to be expected, as the majority of the businesses within this sector are classified in the red
biodiversity risk zone. For businesses in the red zone the importance to take biodiversity and related
risks into account is highest. In the Industry super sector, less businesses are within the red
biodiversity risk zone, but still the majority belongs to either the amber or red zone. Therefore, for
the Industry sector it is also expected that a high percentage of businesses report on biodiversity.
Within the Raw material extraction sector, 75% of the business did mention biodiversity in (one of )
their reports. Except for one business, all members of this sector are in the red biodiversity risk zone.
The percentage of business reporting on biodiversity is therefore lower than would be e xpected. For
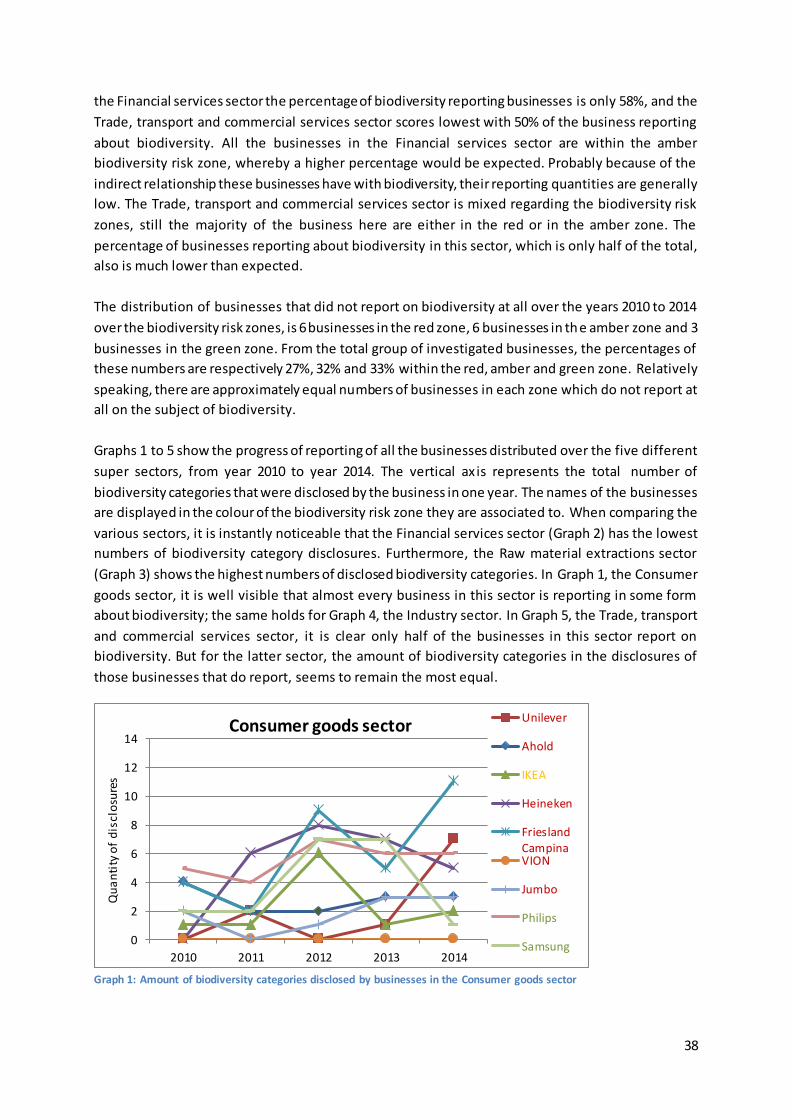
38
the Financial services sector the percentage of biodiversity reporting businesses is only 58%, and the
Trade, transport and commercial services sector scores lowest with 50% of the business reporting
about biodiversity. All the businesses in the Financial services sector are within the amber
biodiversity risk zone, whereby a higher percentage would be expected. Probably because of the
indirect relationship these businesses have with biodiversity, their reporting quantities are generally
low. The Trade, transport and commercial services sector is mixed regarding the biodiversity risk
zones, still the majority of the business here are either in the red or in the amber zone. The
percentage of businesses reporting about biodiversity in this sector, which is only half of the total,
also is much lower than expected.
The distribution of businesses that did not report on biodiversity at all over the years 2010 to 2014
over the biodiversity risk zones, is 6 businesses in the red zone, 6 businesses in the amber zone and 3
businesses in the green zone. From the total group of investigated businesses, the percentages of
these numbers are respectively 27%, 32% and 33% within the red, amber and green zone. Relatively
speaking, there are approximately equal numbers of businesses in each zone which do not report at
all on the subject of biodiversity.
Graphs 1 to 5 show the progress of reporting of all the businesses distributed over the five different
super sectors, from year 2010 to year 2014. The vertical ax is represents the total number of
biodiversity categories that were disclosed by the business in one year. The names of the businesses
are displayed in the colour of the biodiversity risk zone they are associated to. When comparing the
various sectors, it is instantly noticeable that the Financial services sector (Graph 2) has the lowest
numbers of biodiversity category disclosures. Furthermore, the Raw material extractions sector
(Graph 3) shows the highest numbers of disclosed biodiversity categories. In Graph 1, the Consumer
goods sector, it is well visible that almost every business in this sector is reporting in some form
about biodiversity; the same holds for Graph 4, the Industry sector. In Graph 5, the Trade, transport
and commercial services sector, it is clear only half of the businesses in this sector report on
biodiversity. But for the latter sector, the amount of biodiversity categories in the disclosures of
those businesses that do report, seems to remain the most equal.
0
2
4
6
8
10
12
14
2010 2011 2012 2013 2014
Qu
an
tity
of
dis
clo
sure
s
Consumer goods sector Unilever
Ahold
IKEA
Heineken
FrieslandCampinaVION
Jumbo
Philips
Samsung
Graph 1: Amount of biodiversity categories disclosed by businesses in the Consumer goods sector
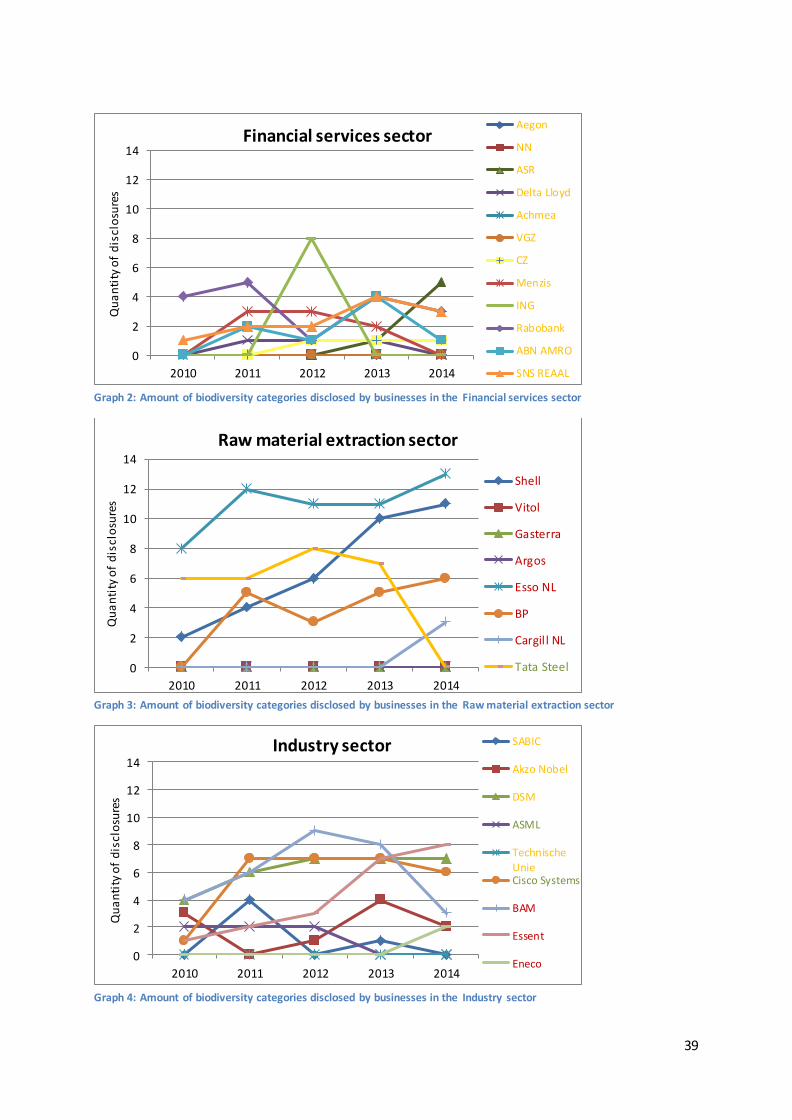
39
Graph 2: Amount of biodiversity categories disclosed by businesses in the Financial services sector
Graph 3: Amount of biodiversity categories disclosed by businesses in the Raw material extraction sector
Graph 4: Amount of biodiversity categories disclosed by businesses in the Industry sector
0
2
4
6
8
10
12
14
2010 2011 2012 2013 2014
Qu
an
tity
of
dis
clo
sure
s
Financial services sector Aegon
NN
ASR
Delta Lloyd
Achmea
VGZ
CZ
Menzis
ING
Rabobank
ABN AMRO
SNS REAAL
0
2
4
6
8
10
12
14
2010 2011 2012 2013 2014
Qu
an
tity
of
dis
clo
sure
s
Raw material extraction sector
Shell
Vitol
Gasterra
Argos
Esso NL
BP
Cargill NL
Tata Steel
0
2
4
6
8
10
12
14
2010 2011 2012 2013 2014
Qu
an
tity
of
dis
clo
sure
s
Industry sector SABIC
Akzo Nobel
DSM
ASML
TechnischeUnieCisco Systems
BAM
Essent
Eneco

40
Graph 5: Amount of biodiversity categories disclosed by businesses in the Trade, transport and commercial services sector
Conclusion
In total, 35 of the 50 businesses (70%) has mentioned ‘biodiversity’ at least once in one of their
published reports in the investigated period. For 46% of the businesses there was biodiversity related
content found on their websites. There are noticeable differences between the five super sectors
regarding their reporting about biodiversity: in some sectors only about 50% of the business reported
at least once about biodiversity in the years 2010 to 2014. While other sectors score up to having
89% of the businesses applying biodiversity disclosures. The Financial services sector has the lowest
number of biodiversity category disclosures; the Raw material extractions sector shows the highest
numbers of these disclosures. In sectors like the Consumer goods sector and the Raw materials
extraction sector, the amount of reporting about biodiversity (total number of biodiversity categories
disclosed) seems higher when the concentration of businesses within the red biodiversity risk zone is
high.
4.1.2 Coding categories for biodiversity
Table 5 is about the scores that were given for the coding categories for biodiversity reporting. The
first line (Total number of biodiversity disclosures), shows how many times in total the investigated
reports contain information concerning one or more of the categories (total number of category
elements present, as illustrated in Table 2, page 27). These numbers show that the application of
category elements has increased up to almost the double in business reports over the years 2010 to
2013, and then slightly decreased in 2014.
The second line (Total number of businesses reporting biodiversity) then displays the exact amount
of businesses reporting about biodiversity in that year. So, in 2010, category elements have been
reported for 69 times in total, by 21 businesses, which is 42% of the total of 50 businesses
investigated. The amount of reporting businesses increased from 2010 to 2013, and then slightly
decreased in 2013 and again in 2014. On average, a little more than 50% of the investigated
businesses reports about biodiversity (at least once) in the years 2010 to 2014.
Subsequently, lines 3 to 5 show the distribution of the number of reporting businesses over the
biodiversity risk zones red, amber and green, and what percentage of these groups is reporting about
0
2
4
6
8
10
12
14
2010 2011 2012 2013 2014
Qu
an
tity
of
dis
clo
sure
s
Trade, transport and commercial services sector
Nidera
Glencore
Cefetra
SHV
Randstad
BCD
KLM
TNT
PON
KPN
CRH
Leaseplan

41
biodiversity in each year. Remarkable is that only in the red zone the number of businesses that is
reporting about biodiversity, has been constantly increasing over time. In the amber zone there has
also been an increase, but the number drops from 2013 to 2014. The number of reporting businesses
in the green zone stayed equal from 2010 to 2012, and then drops in 2013 and again in 2014.
Line 6 of table 5 indicates the category element that is applied the most per year, with the number of
times it was applied in total. The highest scoring element was ‘GRI’ in 2012, applied in 20 reports.
The last line shows which business(es) applies/apply the most categories in their report, how many
categories that are, and therefore has the highest score in that year of all investigated businesses. In
the 2014 report from Esso 13 category elements were found, the highest score found in this study.
The same business scored the most elements for every investigated year, with a shared place in 2010
with Glencore Grain.
Disclosures 2010 2011 2012 2013 2014
Total number of biodiversity disclosures
69
118
132
138
130
Total number of businesses reporting biodiversity (from the 50 investigated)
21 (42%)
26 (52%)
29 (58%)
28 (56%)
27 (54%)
Red zone (22 businesses)
9 (40%) 13 (59%) 12 (55%) 12 (55%) 15 (68%)
Amber zone (19 businesses)
6 (32%) 7 (37%) 11 (58%) 11 (58%) 8 (42%)
Green zone (9 businesses)
6 (67%) 6 (67%) 6 (67%) 5 (56%) 4 (44%)
Highest scoring category
Mission statement (12)
GRI (19) GRI (20) Partnerships (17)
Partnerships (16)
Highest score by business
Glencore Grain + Essoa (8)
Essoa (12) Essoa (11) Essoa (11) Essoa (13)
Table 5: Summary of results biodiversity disclosure analysis a= ExxonMobi l Corporation; overarching business
In table 6 it becomes clear that the total of 69 disclosures in 2010 (as shown in Table 5), is the sum of
the scores for each category element in 2010. In 2010, 3 reports met the category element
‘Definition’, 12 did for ‘Mission statement’, and so on. Table 6 also shows the total for each category
element over five years, and what percentage this is of the total. These numbers show that the
category element ‘Awards’ is not covered in a single report at all, in none of the investigated years,
and therefore is the lowest scoring element and covers 0% of the total. In addition, the category
element ‘GRI’ is applied most of all , with 79 times in total over the five years, which is 13,5% of the
total number of 587 applications of all categories.
Year Definition
Mission State-ment
Site spec
Specific species
Surveys
IUCN redlist
Partner ships
Awards Stakehold-er Enga-gement
2010 2011 2012 2013 2014 Total
%
3 2 3 3 4
15 (2,6%)
12 11 10 15 15 63
(10,7%)
6 13 13 13 10 55
(9,4%)
2 9 8 8 9 36
(6,1%)
0 0 1 0 1 2
(0,3%)
1 3 4 3 6
17 (2,9%)
9 12 17 17 16 71
(12,1%)
0 0 0 0 0 0
(0%)
10 17 19 16 15 77
(13,1%)
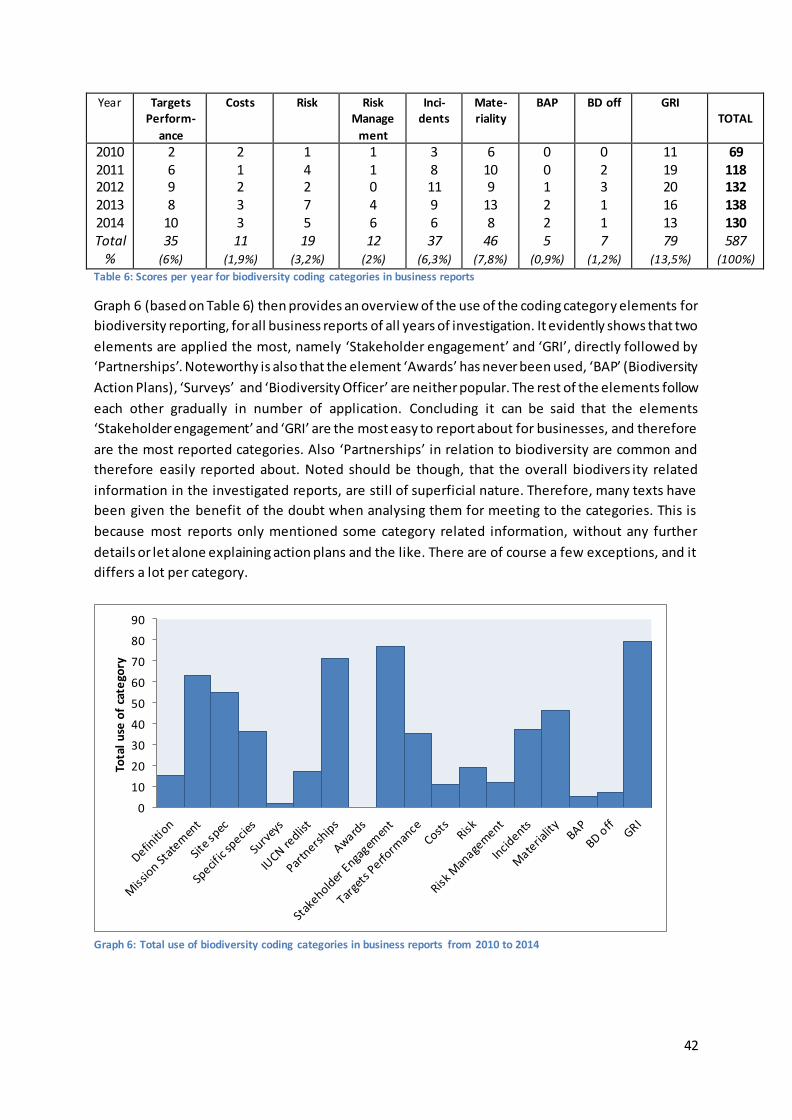
42
Year Targets Perform-
ance
Costs Risk
Risk Manage
ment
Inci-dents
Mate-riality
BAP BD off GRI TOTAL
2010 2011 2012 2013 2014 Total
%
2 6 9 8
10 35
(6%)
2 1 2 3 3 11
(1,9%)
1 4 2 7 5 19
(3,2%)
1 1 0 4 6 12
(2%)
3 8 11 9 6 37
(6,3%)
6 10 9
13 8
46 (7,8%)
0 0 1 2 2 5
(0,9%)
0 2 3 1 1 7
(1,2%)
11 19 20 16 13 79
(13,5%)
69 118 132 138 130 587
(100%) Table 6: Scores per year for biodiversity coding categories in business reports
Graph 6 (based on Table 6) then provides an overview of the use of the coding category elements for
biodiversity reporting, for all business reports of all years of investigation. It evidently shows that two
elements are applied the most, namely ‘Stakeholder engagement’ and ‘GRI’, directly followed by
‘Partnerships’. Noteworthy is also that the element ‘Awards’ has never been used, ‘BAP’ (Biodiversity
Action Plans), ‘Surveys’ and ‘Biodiversity Officer’ are neither popular. The rest of the elements follow
each other gradually in number of application. Concluding it can be said that the elements
‘Stakeholder engagement’ and ‘GRI’ are the most easy to report about for businesses, and therefore
are the most reported categories. Also ‘Partnerships’ in relation to biodiversity are common and
therefore easily reported about. Noted should be though, that the overall biodivers ity related
information in the investigated reports, are still of superficial nature. Therefore, many texts have
been given the benefit of the doubt when analysing them for meeting to the categories. This is
because most reports only mentioned some category related information, without any further
details or let alone explaining action plans and the like. There are of course a few exceptions, and it
differs a lot per category.
Graph 6: Total use of biodiversity coding categories in business reports from 2010 to 2014
0
10
20
30
40
50
60
70
80
90
Tota
l u
se o
f ca
tego
ry
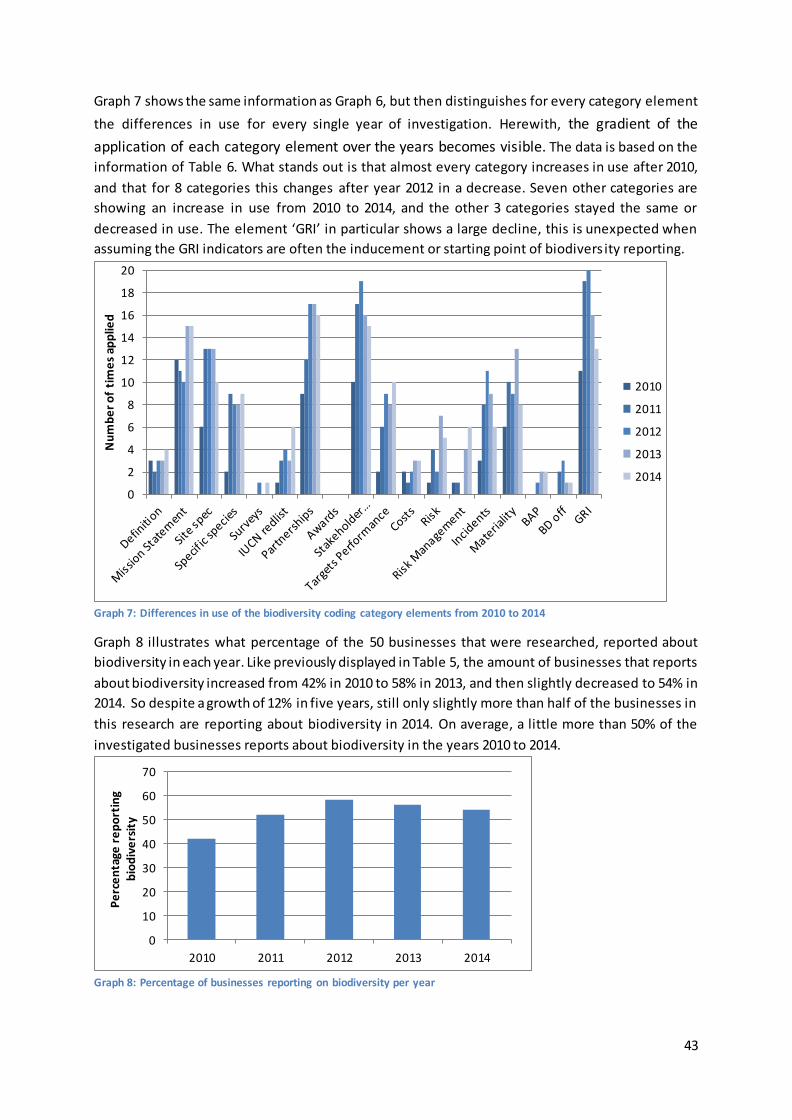
43
Graph 7 shows the same information as Graph 6, but then distinguishes for every category element
the differences in use for every single year of investigation. Herewith, the gradient of the
application of each category element over the years becomes visible. The data is based on the
information of Table 6. What stands out is that almost every category increases in use after 2010,
and that for 8 categories this changes after year 2012 in a decrease. Seven other categories are
showing an increase in use from 2010 to 2014, and the other 3 categories stayed the same or
decreased in use. The element ‘GRI’ in particular shows a large decline, this is unexpected when
assuming the GRI indicators are often the inducement or starting point of biodivers ity reporting.
Graph 7: Differences in use of the biodiversity coding category elements from 2010 to 2014
Graph 8 illustrates what percentage of the 50 businesses that were researched, reported about
biodiversity in each year. Like previously displayed in Table 5, the amount of businesses that reports
about biodiversity increased from 42% in 2010 to 58% in 2013, and then slightly decreased to 54% in
2014. So despite a growth of 12% in five years, still only slightly more than half of the businesses in
this research are reporting about biodiversity in 2014. On average, a little more than 50% of the
investigated businesses reports about biodiversity in the years 2010 to 2014.
Graph 8: Percentage of businesses reporting on biodiversity per year
0
2
4
6
8
10
12
14
16
18
20
Nu
mb
er
of
tim
es
app
lied
2010
2011
2012
2013
2014
0
10
20
30
40
50
60
70
2010 2011 2012 2013 2014
Pe
rce
nta
ge r
ep
ort
ing
bio
div
ers
ity

44
Conclusion
Reporting about biodiversity by the investigated businesses has increased from 2010 to 2014; both in
number of category elements applied, as in number of business. Though, a small decrease is found in
both from 2013 to 2014. The decrease in number of businesses reporting about biodiversity can be
found in the part of businesses that is in the green biodiversity risk zone, also the amber zone
decreases in the last year. Only in the red zone there is an increase in the number of businesses
reporting about biodiversity from 2010 to 2014. On average, a little more than 50% of the
investigated businesses report about biodiversity (a least once) in the years 2010 to 2014. The
category element ‘Awards’ has not been applied by any of the businesses, in any year. The
biodiversity category elements that are applied most in business reports are ‘GRI’, ‘Partnerships’ and
‘Mission statement’. In total, the element ‘GRI’ is with 79 applications the most often applied
element. This is 13,5% out of the total of 587 applied elements in all reports over the five-year
period. One specific business has the highest scoring report (most category elements applied) in
every of the investigated years; Esso.
4.1.3 Reporting numbers
Table 7 shows how many businesses have applied a certain amount of biodiversity category elements
in their reports, for each of the years 2010 to 2014 separately. And in the last line this is showed for
the total of all years together (for example, 15 businesses did not report a single element in any of
these years, and one business reported about 14 different elements in total during the five years) .
# used categories
0
1
2
3
4
5
6
7
8
9
10
11
12
13
14
# businesses in 2010
29 6 4 1 5 1 2 0 2 0 0 0 0 0 0
#businesses in 2011
22 3 9 2 3 2 4 2 0 1 1 0 1 0 0
# businesses in 2012
21 7 5 3 0 0 3 5 3 2 0 1 0 0 0
# businesses in 2013
21 7 1 2 4 3 1 6 3 0 1 1 0 0 0
# businesses in 2014
23 4 4 6 0 2 4 2 1 1 0 2 0 1 0
# businesses overall
(all years)
15 3 3 2 4 3 1 3 4 3 1 4 2 1 1
Table 7: Number of businesses that apply a certain amount of biodiversity coding category elements in their reports in
the years 2010 to 2014, and in total for all years (see also Appendix B, Table II)
These numbers prove that there have been changes over the years in which businesses are reporting
and which are not. Focused on the number of businesses in total that doesn’t report biodiversity at
all, this is only 15 in general for all years together. When looking at this number at each year
separately, then 21 to 29 businesses are not reporting at all. This means that every year, there are
different businesses that are not reporting about biodiversity, resulting in a lower total of businesses
not reporting at all over the five years together. One year that a business starts reporting, another
business doesn’t report, while the next year it can be the other way around. It can therefore be
considered that some businesses are not consequent in their reporting about biodiversity. The
number of businesses not reporting about biodiversity decreased from 2010 to 2013, but increased a

45
little in 2014. This corresponds with the findings of Table 5 where it became clear that the number of
businesses that do report biodiversity, slightly decreased in 2014.
The use of a certain number of category elements, is very widespread, varying from 1 to 14 category
elements per report. There is for example only one business that in total reports about 14 different
elements. This was not in one report of one specific year, but spread over multiple reports, of several
years. 84% of the total use of elements in the years 2010 to 2014 is within the appliance of 1 to 7
elements, 16% is within the appliance of 8 to 14 elements. What is further to notice about the
numbers of used elements, is that businesses that did not report in 2010, probably started to report
by the use of one or two elements in 2011. These numbers are quite high as can be seen in Graph 9,
some of the red bars are clearly higher than the dark blue bars. Furthermore, the number of
businesses that applied more than one or two elements seems to increase from 2012 onwards, as
these numbers are getting higher over these years. For example, a lot more businesses then applied
7 or 8 elements, which is clearly visible in Graph 9.
Graph 9: The number of times a certain amount of category elements is applied by reporting businesses, per year
Graph 10 shows the differences in the number of biodiversity disclosures (Total number of category
elements) in total by all businesses between the years 2010 to 2014. As previously visible in Table 5,
this graph shows that the application of category elements in total has almost doubled in business
reports over the years 2010 to 2013, and then slightly decreased in 2014.
0
1
2
3
4
5
6
7
8
9
10
1 2 3 4 5 6 7 8 9 10 11 12 13 14
Nu
mb
er
of
bu
sin
ess
es
Number of used category elements
# businesses in 2010
# businesses in 2011
# businesses in 2012
# businesses in 2013
# businesses in 2014

46
Graph 10: Total number of biodiversity disclosures (category elements) per year
With the use of a one-way Anova statistical test, the differences of the total number of biodiversity
disclosures between the years 2010 to 2014 (as seen in Graph 10) were tested. There was no
significant difference found in the number of biodiversity disclosures between the years 2010 to
2014, F(4, 85)=1,366, p > .05 .
The differences between the total number of biodiversity disclosures per year appear not to be
significant, which indicates that despite the doubling of the amount of disclosures from year 2010 to
2013, this difference tends to be coincidental.
In Graph 11 the percentage of businesses in all three different biodiversity risk zones, that are
reporting about biodiversity in the different years 2010 to 2014, is represented. This data comes
from Table 5, and it is clear that only in the red zone the percentage of businesses that is reporting
about biodiversity, has increased during the five year period. This percentage for the red zone is
growing from 40% in 2010 to 68% in 2014. In the amber zone there has also been an increase, but
the percentage of reporting businesses drops from 58% in 2013 to 42% in 2014. The number of
reporting businesses in the green zone stayed equal with 67% from 2010 to 2013, and then drops to
56% in 2013 and again to 44% in 2014.
Graph 11: Percentage of businesses reporting on biodiversity per biodiversity risk zone, per year
0
20
40
60
80
100
120
140
160
2010 2011 2012 2013 2014
Nu
mb
er
of
dis
clo
sure
s
0
20
40
60
80
100
2010 2011 2012 2013 2014
Perc
enta
ge r
ep
ort
ing
bio
div
ersi
ty
Red
Amber
Green
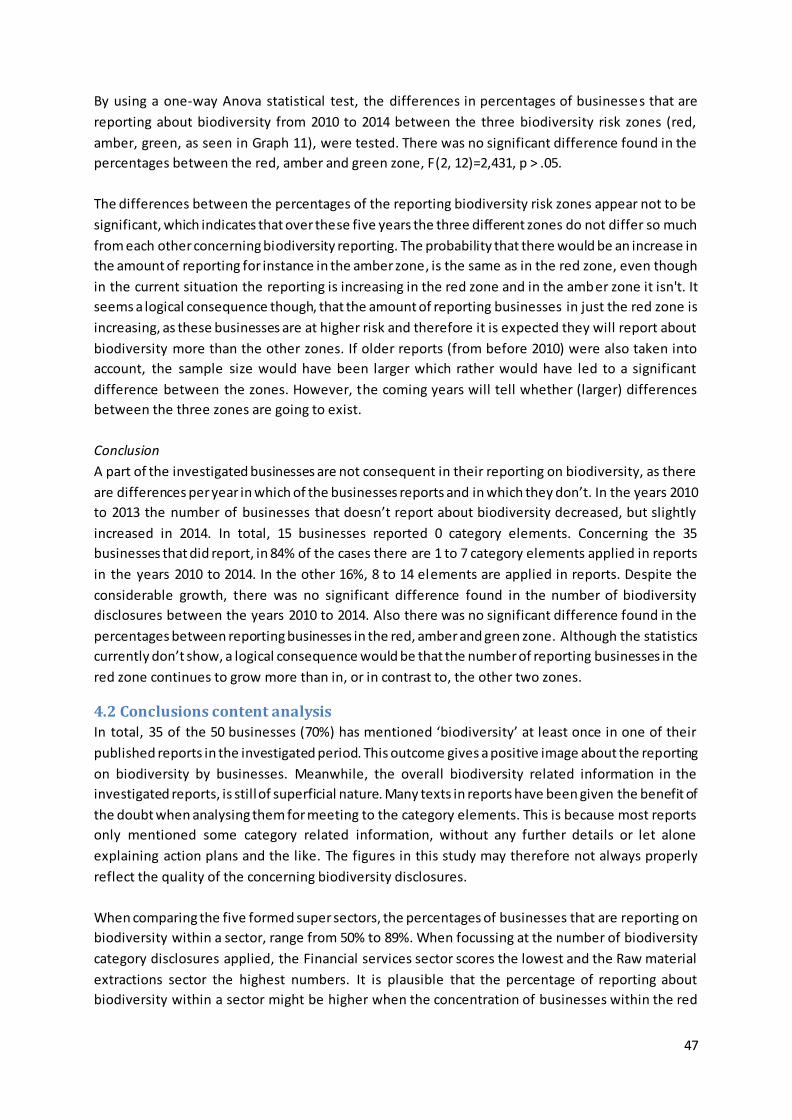
47
By using a one-way Anova statistical test, the differences in percentages of businesses that are
reporting about biodiversity from 2010 to 2014 between the three biodiversity risk zones (red,
amber, green, as seen in Graph 11), were tested. There was no significant difference found in the
percentages between the red, amber and green zone, F(2, 12)=2,431, p > .05.
The differences between the percentages of the reporting biodiversity risk zones appear not to be
significant, which indicates that over these five years the three different zones do not differ so much
from each other concerning biodiversity reporting. The probability that there would be an increase in
the amount of reporting for instance in the amber zone, is the same as in the red zone, even though
in the current situation the reporting is increasing in the red zone and in the amber zone it isn't. It
seems a logical consequence though, that the amount of reporting businesses in just the red zone is
increasing, as these businesses are at higher risk and therefore it is expected they will report about
biodiversity more than the other zones. If older reports (from before 2010) were also taken into
account, the sample size would have been larger which rather would have led to a significant
difference between the zones. However, the coming years will tell whether (larger) differences
between the three zones are going to exist.
Conclusion
A part of the investigated businesses are not consequent in their reporting on biodiversity, as there
are differences per year in which of the businesses reports and in which they don’t. In the years 2010
to 2013 the number of businesses that doesn’t report about biodiversity decreased, but slightly
increased in 2014. In total, 15 businesses reported 0 category elements. Concerning the 35
businesses that did report, in 84% of the cases there are 1 to 7 category elements applied in reports
in the years 2010 to 2014. In the other 16%, 8 to 14 elements are applied in reports. Despite the
considerable growth, there was no significant difference found in the number of biodiversity
disclosures between the years 2010 to 2014. Also there was no significant difference found in the
percentages between reporting businesses in the red, amber and green zone. Although the statistics
currently don’t show, a logical consequence would be that the number of reporting businesses in the
red zone continues to grow more than in, or in contrast to, the other two zones.
4.2 Conclusions content analysis
In total, 35 of the 50 businesses (70%) has mentioned ‘biodiversity’ at least once in one of their
published reports in the investigated period. This outcome gives a positive image about the reporting
on biodiversity by businesses. Meanwhile, the overall biodiversity related information in the
investigated reports, is still of superficial nature. Many texts in reports have been given the benefit of
the doubt when analysing them for meeting to the category elements. This is because most reports
only mentioned some category related information, without any further details or let alone
explaining action plans and the like. The figures in this study may therefore not always properly
reflect the quality of the concerning biodiversity disclosures.
When comparing the five formed super sectors, the percentages of businesses that are reporting on
biodiversity within a sector, range from 50% to 89%. When focussing at the number of biodiversity
category disclosures applied, the Financial services sector scores the lowest and the Raw material
extractions sector the highest numbers. It is plausible that the percentage of reporting about
biodiversity within a sector might be higher when the concentration of businesses within the red

48
biodiversity risk zone is high. This is because for businesses in the red zone it is the most important to
take biodiversity and related risks into account.
In the period 2010 to 2012, both the number of businesses reporting on biodiversity as well as the
number of category elements applied, has increased. From 2013 to 2014 there is a small decrease in
both. In more detail, the part of reporting businesses within the red biodiversity risk zone increased
during the five year period, the part of the amber and green zone show a decline at last. The
decrease of the latter is greater than the growth of the red zone, therefore the total number of
reporting businesses decreased in 2014. On average, a little more than 50% of the investigated
businesses reports about biodiversity (at least once) in the years 2010 to 2014. The total number of
biodiversity disclosures per year, increases from 69 in 2010, to 138 in 2013, where after it decreases
a little to 130 in 2014. This number thus almost doubled within three to four years. In total, all
investigated reports count 587 applied biodiversity category elements. For the 35 businesses that
reported at least once, this is on average 3 applied category elements per business per year or
report. The elements that are applied most in business reports are ‘GRI’, ‘Partnerships’ and ‘Mission
statement’. The element ‘Awards’ has not been applied by any of the businesses, in any year.
Those businesses in the sample that are reporting on biodiversity, are not all consequent in doing so.
It differs per year which of the businesses report and which don’t. In the years 2010 to 2013 the
number of businesses that doesn’t report about biodiversity decreased, but slightly increased in
2014. In 84% of the cases, reports contain 1 to 7 category elements. 16% of the reports contain 8 to
14 different elements within the period 2010 to 2014. Despite the considerable growth, there was no
significant difference found in the number of biodiversity disclosures between the years 2010 to
2014. Also, no significant difference was found in the percentages between reporting businesses in
the red, amber and green zone. A logical consequence would be though, that the number of
reporting businesses in the red zone continues to grow more than in, or in contrast to, the other two
zones.
49
5. Results – interviews
This chapter presents the results of the interviews that were conducted for the purpose of this study.
First, the preparatory interview with an independent expert is elaborated on in 5.1. The second part
(5.2) describes the businesses that were interviewed. Then parts 5.3 to 5.5 investigate the
motivations of these businesses for their way of reporting, by making use of the interpretations of
the transcripts. Moreover, 5.3 deals with information on the relationships of businesses with
biodiversity, 5.4 is about reporting by businesses and 5.5 is about the motivations of the businesses
regarding biodiversity reporting. An overall final conclusion will be drawn in the last part, 5.6.
5.1 Expert interview IUCN
IUCN is an organisation that is committed to nature conservation and the sustainable use of natural
resources. In 2005, IUCN NL took the initiative to involve businesses with biodiversity, which leaded
to collaborations with several businesses and start of the Platform Business and Biodiversity. Because
of this fact, the findings of this organisation on the theme of biodiversity reporting were discussed
with an expert of IUCN. The information retrieved from this interview has contributed to the
formulation of relevant questions for the purpose of the business interviews. In what way, will be
described next in paragraphs 5.1.1 to 5.1.3.
5.1.1 Reporting about biodiversity
There are some reporting indicators where businesses have to give insight to, that can only be filled
in when they are referred to certain knowledge products of IUCN. These are for example the IUCN
Red List for Endangered Species, or the database of protected areas.
It is therefore interesting to ask the businesses if they are familiar with biodiversity reporting
indicators (GRI) and if these are clear for the business to use.
Subsequently, if the business is familiar with the organization IUCN and/or the knowledge
products, and if so if the business has had contact with IUCN.
Initial Public Offering businesses want to comply to the legislation of the country it is operating in,
but the Dutch government only has a facilitating role in subjects like biodiversity. There is no
obligation for businesses to report on biodiversity, the government actually wants to reduce the
regulatory pressure on businesses.
A useful question towards the businesses is if they are aware of any policy goals or
regulations around biodiversity.
5.1.2 Issues around reporting
A research IUCN had carried out two years ago about biodiversity reporting, showed that there is
indistinctness and a lot of difference in the way businesses reported about biodiversity. This is
reflected in the reports themselves, but also in the questions IUCN received from businesses through
the years. For some businesses the theme of biodiversity is still too unclear. Some businesses are
reporting only superficially on biodiversity, explaining in word whi ch social or environmental projects
have been conducted for example in their CSR report. Some additionally use (partly) the GRI
indicators, others go further and apply integrated reporting. Currently there are several methods and
initiatives for integrated reporting which makes it hard for businesses to choose the appropriate
method. IUCN is working towards a framework for this together with some international
organisations.

50
It is interesting to ask the businesses if they report about biodiversity, and if so, how was this
established?
In what level do they report, are they familiar with Integrated reporting?
And, what do they think should be reported in relation to biodiversity? Does the business
have a biodiversity strategy?
The question what the reason for the business’ way of reporting is, and if they are satisfied
with this method, can provide useful information.
5.1.3 Differences in reporting
This difference in reporting varies greatly from business to business, and does not just depend on the
type of sector it is in for instance. A business with a very complicated chain, a retail business with
several products for example, which means it is very complex to obtain and understand information,
can have the ambition to have a positive impact. While a business in mining with a few sites, can
obtain information about their impact and how to reduce this much more easy, might not b e
interested in doing this. But knowing the impact on a site is different from analysing the impact
within the whole supply-chain. This asks for a lot of knowledge and information from their suppliers,
which is difficult because often the origin of resources is unknown and it is unclear what to ask their
suppliers. Some businesses just want to meet the requirements of the reporting, others really want
to understand what they report and what this means about their impact. Their motivation is
therefore an important factor.
A relevant question here is if the business sees biodiversity as a risk or as an opportunity.
Also, does the business know what impact it’s activities have on biodiversity, and to what
extent (local / global, the phase of the chain).
And does the business have goals related to biodiversity, and if so where are these based on
and why are they chosen?
Is reporting used for benchmarking? Does the business read the reports of competitors?
Does the business regard reporting as a tool to increase transparency and accountability?
And more questions related to the motivation of businesses to report about biodiversity, like
the role of stakeholders, social acceptance/license to operate and limitations the business is
facing.
5.2 Business facts
The information in Table 8 presents the names of the 9 businesses that were interviewed. Next, the
distribution of these businesses over the biodiversity risk zones can be read. About half of the
businesses is within the red zone and the other half in the amber zone. There are no businesses of
the green zone interviewed. The opportunity to be able to interview a business in this group was
reduced since this group was the smallest (9 out of 50). In addition, the table shows what kind of
report each business uses to communicate its information. This is very different within this group of 9
businesses. 3 businesses have published integrated reports in all of the investigated years, 2 other
businesses did this after publishing separate sustainability reports for a few years first. One business
published so called separate CSR-reports, another business only a financial report, and the last
business only a social report. Lastly, if and with how many categories each business reports about
biodiversity is mentioned in the rightmost column. This shows that 3 businesses did not report about
biodiversity in any year from 2010 to 2014. Three other businesses reported in all years, with 4, 5 and
10 different category elements. The remaining three businesses reported respectively in just 1, 2 or 4

51
different years with respectively 2, 5 and 5 category elements. There are no differences in the degree
of reporting between the groups of businesses in the red and amber risk zones, it varies by business.
Business Risk zone Report Biodiversity reporting Ahold Red CSR report In 2010 to 2014, with 4 category elements
VION Red Only financial report None
BAM Red Sustainability report 2010-2013, integrated report 2014
In 2010 to 2014, with 10 category elements
Eneco Red Integrated report Only in 2014, with 2 category elements.
Technische Unie (TU)
Amber Only social report 2013 None
AkzoNobel Amber Integrated report In 2010, ‘12, ‘13 and ‘14, with 5 category elements
Achmea Amber Sustainability report 2010-2012, integrated report 2013 and 2014
None
SABIC Amber Sustainability report In 2011 and 2013, with 5 category elements DSM Amber Integrated report From 2010 to 2014, amount fluctuates over
the years. Total of 9 category elements. Table 8: Facts on risk zones and reports of the interviewed businesses
The next paragraphs will explore the motivations of these 9 businesses for their way of reporting, on
the basis of the answers the businesses gave to the questions during the interviews.
5.3 Business interviews
The results of the interviews with the businesses are presented in this part. The transcripts of the
interviews are interpreted and the interpretation is elaborated in a number of subjects. The first part
(5.3) explores the relation of the interviewed businesses with, handling of and attitude towards
biodiversity. Thereafter, 5.4 elaborates on how the businesses are facing reporting (about
biodiversity). Part 5.5 ends with the results from the interviews concerning the motivations of
businesses for their way of reporting.
5.3.1 Relationship of businesses with biodiversity
The businesses were asked to describe the relationship of their business with biodiversity. There
were many different answers to this question, which was to be expected since it are all different
types of businesses. Five businesses state that their relation with biodiversity is mainly through the
products that they buy and/or sell, as reflected in the following statements:
Ahold: “It is a difficult issue, because we have such a broad spectrum of products. But relevant
because of the many agricultural products we work with. Here are mainly pesticides important in
relation to food safety, this also relates to biodiversity.”
TU: “Since recently we adopted green roofs in our assortment, our first living product.”
VION: “For biodiversity we look at our primary producer, so the farmers that deliver to us. We set
some criteria to them, but also towards the animal feed producers, of which we expect that they take
some responsibility themselves.”
DSM: “Our focus on sustainability is expressed in several ways, on the one side at product

52
development, and on the other side at the production of products. In this we try to find ways that
have the least possible impact.”
AkzoNobel: “We are paying attention to the sourcing of our resources to reduce our reliance on
fossil materials, and because we are aware that things like soy and palm oil are growing in
biodiversity sensitive areas.”
Three of the same businesses also see a relationship with biodiversity through the certifications they
work with, one adds to this that biodiversity is only one aspect within the whole sustainability theme:
Ahold: “We also work with several sustainability certifications which have criteria for
biodiversity.”
TU: “It’s an important issue, but not a very relevant one in our business . We work with
sustainability certifications though, where there’s attention for energy use, the source of the
products, and does the building fit in the natural surroundings.”
VION: “Above all, we see biodiversity not as a single-issue, but as one of the issues within GAP like
animal welfare and environment. By looking at all important aspects, we try to make the whole
system sustainable, we work towards continuity this way.”
Two businesses see biodiversity as an opportunity for product innovation / development and to be a
leading business, as they state:
SABIC: “We are looking at our whole supply chain, at resources that might not be available in the
future, and at our products how they can help to make things more sustainable or better for the
environment.”
DSM: “In the production of products we try to find ways that have the least possible impact. Or, a
little better than what is currently obvious within the industry, in such a way that we can enjoy the
frontrunner effect.”
Another business also treats biodiversity as a chance, as they state that it is important for the
business’ future:
BAM: “Biodiversity is one of our main goals in our sustainability programme. It is focussed on
conserving biodiversity, because we believe that environmental values then can be remained and
enlarged, and will give us the possibility to sustain our work in the future.”
For one of the interviewees the relationship with biodiversity is less obvious because of the type of
business:
Achmea: “There is only an indirect relationship between our core business and biodiversity since
we are a financial institution. We can have some influence on biodiversity via the investments we
choose.”
The remaining business is currently investigating what relationship it exactly has with biodiversity by
analysing the impact of the business activities:
Eneco: “With several projects we try to put biodiversity on the agenda of our business. By using
quick scans we explored what the impact is of the construction and operation of a wind park and a
biomass centre. With that information, together with WWF we will work out a strategy on how
biodiversity can be integrated within Eneco.”

53
5.3.2 Impact on biodiversity through business activities
Subsequently, it was interesting to analyse to what extent the businesses know where, and to what
size their impact on biodiversity is situated. Only when this information is clear, reporting about
biodiversity is possible. Most businesses (6) indicate that they are aware that their activities have a
global impact, and that this starts at the beginning of the chain. Yet, it appears to be not so easy to
take action to reduce this impact, as the businesses comment as follows:
Ahold: “Our (resources for) mainly agricultural products come from all over the world. Our soy
for instance, comes from Brazil and North America, which are huge monocultures. But it is impossible
and unwanted to impose all kind of interventions constantly to all these suppliers. We have all kind of
suppliers, a lot of farmers, and we think they know very well themselves what is good for their land,
how to deal with the climate and the soil. Besides that, we apply a yearly risk analysis for our product
groups, where biodiversity is one of the indicators. So besides social issues, land and water use, and
animal welfare we look at biodiversity, to see what is a point of attention in that issue. Like the case
of honey, the bee mortality, where the discussion prevails whether it is caused by pesticides or
monoculture. In our risk analysis we examine what the situation is.”
AkzoNobel: “To improve our sustainability policy and to reduce our reliance on fossil materials,
we are looking to the use of biobased materials and bio chemicals. We are aware that the soy and
palm oil derivatives are known to be growing in areas of sensitivity for biodiversity. Although we are
not direct buyers, we do set some steps down the value chain.”
SABIC: “We try to change our impact by examining our whole supply chain, starting with the
resources we use for the end product we make. We look for opportunities that for example might
make society less dependent on oil, or decrease greenhouse gas emissions. In addition, an important
part in the chain is recycling, we want to reduce waste and look for opportunities to retrieve our
materials to re-use them in our products. These factors are part of our sustainability policy and might
have relations to our impact on biodiversity.”
DSM: “It seems that biodiversity is some kind of umbrella term for all issues. Because a ll impact
that a business has, will have an impact on biodiversity. In any way or another there will be an eff ect
on flora and fauna decreasing or increasing, or an ecosystem losing its equilibrium. So all
measurements related to environmental parameters can be associated with biodiversity.”
Eneco: “We are currently mapping our impact and developing a strategy. We have impact on
international level as we purchase gas and biomass from around the world. “
For this business biodiversity is on the one side one of their main goals, but on the other side it turns
out to be less important than other issues (in terms of costs / finance):
BAM: “We made a calculation for our future profit and loss account for the use of natural capital,
the cost of the use of raw materials in particular. Thereby, natural capital turned out not to be
strongly important. For example, the cost of energy production versus the cost of the energy used is
much more dominant. The costs of biodiversity loss to society, turn out to be much lower than the
costs of threats such as from climate change. Apparently there is not really a high price on nature”
Some businesses, however, lay the responsibility for the impact on biodiversity (partly) on the side of
their suppliers:
VION: “Our impact is mainly through our fodder suppliers. We expect the fodder businesses that
deliver us, to take some of the responsibility, as most of them are large businesses. Biodiversity is one
of several aspects where minimal standards should be developed for within the whole supply chain.

54
We want to deal with all the aspects together, the whole package, to make steps towards a
sustainable system in total. All issues should have continuity, and be communicated as a sustainable
message towards the consumer. Supermarkets play a big role in this.”
Technische Unie: “We actually do not produce anything. Of course we have certain processes
that we use energy for, but mainly the products of the suppliers do have impact. So I can imagine that
the environmental impact of such businesses is larger and that these kind of questions should be
asked towards the suppliers.”
One business says to have only local impact through the building where it hold its’ office:
Achmea: “Our only direct impact would be through the construction of a new business building, at a new location. A few years ago, the building in Apeldoorn was renewed, which was done in a
sustainable and responsible way. For instance, a bee hive was given to the municipality of Apeldoorn
as a gift. That is basically all you can do in respect to the impact on biodiversity, being a large
business like ours.”
5.3.3 Collection of ecological information
To find out what the businesses actually do in order to retrieve information about their impact on
biodiversity, they were asked how ecological information for the reporting is collected. Here it turned
out that this is difficult for some businesses, because of, as these three comment, biodiversity is hard
to measure, and the large number and / or the distance of their suppliers:
Ahold: “Species abundance and land use are difficult to collect data on for all our products,
which are many. These data are difficult to measure and map, and checking requirements would
also be very costly and difficult. Besides that they are not always necessary or relevant, they don’t
always result in higher biodiversity. It is for example easier to control for child labour than for
biodiversity. But when it is possible we prefer to collect data on subjects like biodiversity. We do
measure quality or productivity of products by standards like kilogram yield per hectare, our
measurements are about total input and output.”
VION: “Our business has impact on resources trough the fodder companies that supply us. These
are outside the limits of our control, as these are ten thousands of famers that are supplying. We
have to work together to develop measures for all the different issues within the GAP, it’s not possible
to push this through all at once.”
DSM: “It is very hard to quantify biodiversity, and the question is what exactly should be
quantified then. There is currently no clear method available to measure our impact on biodiversity.”
The following two businesses are managing to gain information about their impact on biodiversity,
either by collecting data themselves or through the use of other parties with the necessary
knowledge:
BAM: “We do measure biodiversity, in some cases we count ourselves, by counting tracks or
species, sometimes we even work with camera’s. In other cases other parties are measuring for us.
We do this to monitor our projects. For the use of FSC wood we check the whole chain, chain of
custody, to check our suppliers for following the rules. If they don’t meet the requirements we stop
working together with these suppliers.”
Eneco: “Using quick scans we looked at the impact of the construction and operation of a wind
55
park and a biomass centre. With that information, together with the WWF we will work out a
strategy on how biodiversity can be integrated within Eneco.”
Two other businesses say they request information about biodiversity from its suppliers, or are
thinking about setting demands towards suppliers regarding transparency including about
biodiversity:
AkzoNobel: “We ask our suppliers of some resources where they are derived, to see if it concerns
biodiversity sensitive sites and if the sourcing is sustainably managed. We only buy from certified
palm producers, even if there is a certification process in place, we are walking up the value chain and
asking those kinds of questions. To see if the sourcing is sustainable, how is it managed and trying to
stay ahead of the schemes.”
TU: “We are currently in the process of setting targets and defining and naming KPI’s, that's not
very concrete yet. About responsibility with suppliers, it is still often the case that we don’t exactly
know. We don’t get enough information about subjects like biodiversity, until now this is just
accepted the way it is. That is beginning to change slowly now, and that is why we want to be
transparent towards our customers. We are thinking about setting requirements towards our
suppliers right now. We have stated in our CSR policy though that suppliers who present themselves
well in terms of sustainability, will be positively promoted to our customers. That is leading to a stage
where we are going to establish a code of conduct.”
These two businesses indicate that they make use of certain parameters, certifications or so called
engagements related to biodiversity. They don’t really make clear where the ecological information is
collected, but state that the resources or the business must meet the requirements or conditions, in
order to protect biodiversity:
SABIC: “The raw materials we buy, have to meet to 8 parameters we use. Biodiversity is one of
them, next to child labour and fair wages for example. In this way, the resources can be positively or
negatively judged according to the parameters. So if the resource comes from a site where there is
solely monoculture, we don’t buy it.”
Achmea: “We conduct so called engagements with the businesses in which we invest. This means
we engage in a dialogue with the business. One of the key issues here is nature, which connects to
biodiversity. In enhanced engagements we go a step further, in a 3-year dialogue we agree in
engagement goals which can be about biodiversity for example. After three years, for example 3 out
of 7 goals have to be realized.”
5.3.4 The opportunities and threats of biodiversity
It is interesting to know if businesses see biodiversity as a risk for their business, or more as a n
opportunity to improve things. When considered an opportunity, business are more likely to report
about biodiversity when opportunities are actually exploited. But even if it is seen as a threat, this
just may be a reason to report about biodiversity, by indicating how the threats can be avoided.
Almost all businesses do see something positive, an opportunity. Simultaneously, they often also see
the potential threats. These 8 businesses appoint the opportunities because of the improvement,
development and emergence of products and / or projects. The potential risks mentioned by the first
three businesses, are about the origin, sustainability and quality of resources, reputational risk, and
extra costs:
Ahold: “Both a risk and a chance. We see possibilities for improving products by solving problems

56
around issues like biodiversity, through certification for example. There is a risk for the quality and
sustainability of our products and a reputational risk.”
Eneco: “It provides us the opportunity to deal in REDD+ credits, projects for forest conservation.
At the same time the compensating of our impact in projects will cost extra money.”
DSM: “Biodiversity provides opportunities to develop new products. For instance products that
have a positive impact in a location, or that prove to have a minimal impact on the environment. The
risk is in not knowing where resources come from, where in the chain the impact lies.”
TU: “We see opportunities in offering our clients products with sustainable solutions and/or
materials.”
AkzoNobel: “We see it as a new opportunity, as for instance we are looking at new materials to
use for our products.”
VION: “We don’t see it as a problem or threat but as a chance. There is an opportunity whenever
something can deposit added value to our products and we can put this on the market as the first.
Adaptation is very important for the survival of our business.”
BAM: “We see it as a chance, as we see that the area in and around housing projects has more
potential buyers when it is shaped with lots of green and water. Subsequently the challenge is to
shape it in such a way that it is in favour of biodiversity as well. We’ve noticed that when it is well
shaped, biodiversity is maintained, and that mono-arrangements will lose their value.”
SABIC: “We try to see opportunities in products that are now regarded as waste, by doing
something useful with those goods which are at the end of the chain.”
The last business is always looking at risks, since this is in the nature of the business. Therefore it also
sees biodiversity as a risk:
Achmea: “We expect that in the coming years it will be more and more important to take into
account issues like biodiversity. Because when we are assuring a business that is performing very
poorly in terms of durability and / or biodiversity, then we as insuring business are also at risk when
that business will soon have no license to operate anymore. So in that way, risks related to
biodiversity could indirectly also affect an insurer like us.”
5.3.5 Incorporation of biodiversity in strategic management
The next question to the businesses concerned to learn about to what extent CSR, including
biodiversity, is integrated into the operations of the various businesses. the more biodiversity is
taken into account in the business management, the more likely that the business will report about
it. Four businesses indicate that biodiversity is mentioned in their business strategy or policy:
Achmea: “Our CSR policy is divided into five core issues, that are related to our health care
organisation, and are key for our responsible investment policy. Nature, including biodiversity is one
of these five core issues. This is because we think health is very important. As we are the largest
health care organisation in The Netherlands, and we carry out engagement on this with businesses
like the pharmaceutics we invest in. Nature and biodiversity are important for health care because of
the production of medicines, which makes use of a lot of resources from for example tropical
rainforests. Biodiversity is also represented in our participation in the community of practice of
natural capital and biodiversity, and the engagements we conduct on this theme with businesses.”
BAM: “In our entrepreneurial principles, the preservation of biodiversity is one of the
cornerstones of our sustainability policy. The true price calculation we have had, showed that natural
capital doesn’t emerge very strongly though. Despite that we want to be distinctive by profiling

57
ourselves and being recognised as a sustainable construction business. The recognition of
sustainability is dependent on those who are judging though. An assessment on sustainability is
mainly focussed on measures concerning climate, safety, and resources than on specifically
biodiversity, so in that sense biodiversity gets less weight.”
Eneco: “Biodiversity is an important issue and a part of the One Planet strategy, which means
that with our value chains and our customers we want to stay within the carrying capacity of the
earth. But since we cannot measure biodiversity properly yet, no KPI’s or objectives are set. We also
see that it provides an opportunity to present ourselves as sustainable energy business.”
VION: “Biodiversity is one of the issues we deal with through the Good Agricultural Practices
(GAP) we apply, to manage it within the supply chain.”
These other four businesses indicate that biodiversity is mainly important for the products which
they work with, and that the customers are demanding sustainable products. Therefore biodiversity
has more an indirect influence on the strategies of these businesses:
DSM: “Our business aims to find solutions for the big issues and themes that society is dealing
with, this includes providing sustainable products for the end users. This can include biodiversity, but
is not necessarily always the case.”
SABIC: “Biodiversity can mean for us to develop a product or material, something a customer
asks for or something we can bring in our product portfolio. Such developments and inno vations are
important to our business continuity, to meet customer demand and to run the competition with
other businesses.”
TU: “Our business tries to be an example for how our products can contribute to more
sustainable solutions for our clients, by informing them in the best ways we can. Currently we are
being as transparent about our products as possible, in the future we might expand this towards
setting demands on suppliers about their responsibility. In this way we hope to enforce suppliers to
produce more sustainable products.”
AkzoNobel: “Biodiversity is becoming increasingly important for our business in the way we are
using biobased materials, of which we are trying to grow in amount in a sustainable way.”
This business has intertwined biodiversity to some extent in its business, but points out that also
responsibility of other parties in the chain is expected:
Ahold: “Because we don’t produce our products ourselves biodiversity is not part of our strategy.
For the most important commodities we are mapping the effects in the supply chain though. But not
yet for all products, this is going to happen more and more in the future. Our CSR policy is also just
aimed at products of our own brands, not those of A-brands. We have responsibility for our own
brands and much more influence than over A-brands. We assume that the A-brands take their own
responsibility, which often is the case.”
5.3.6 Specific business targets focused on biodiversity
When a business integrated biodiversity in its management, it would be expected to have specific
goals that are being purchased, related to the subject of biodiversity. The businesses were therefore
asked whether they do have targets for biodiversity in particular. Four businesses indicate they don’t
have specific goals on biodiversity, other than those covered in the certifications or larger projects:
Ahold: “We don’t have goals specifically on biodiversity, other than of the 6 critical commodities,

58
at least none we communicate externally. For the 6 critical commodities of which we know what
issues are involved, we do have strict policies.”
VION: “Biodiversity is covered within a number of global private standards our suppliers have to
meet. The subject is also related to the Round Table for Responsible Soy we participate in.”
BAM: “We don’t have specific goals on biodiversity other than those on FSC certified wood. Goals
are mainly project based. We try to widen projects, widen the spatial boundaries, to enlarge
biodiversity ultimately. Even within the costs of the project, that is a desirable approach to achieve
positive impact.”
AkzoNobel: “Biodiversity is covered within the Round Tables for sustainable soy and palm oil, where
we are observers”
These two businesses are thinking about setting targets focused on bi odiversity in the future:
Eneco: “We want to start with biodiversity action plans on a project basis, our ultimate goal is to
have a No Net Loss situation.”
Achmea: “Our impact on biodiversity is only indirect, currently we don’t have explicit goals but
the next step could be to make demands to businesses about biodiversity in engagements .”
The other three businesses don’t have specific goals on biodiversity, but more on sustainability in
general:
TU: “We are currently in the middle of setting goals and defining KPI’s. But these will probably
elaborate more on sustainability in general, and not specifically on biodiversity.”
SABIC: “SABIC has set very clear objectives on energy use in the long term, but not specifically for
biodiversity.”
DSM: “We do not have targets for biodiversity. We do have a policy that says we want to avoid
additional impact, so that we have less impact. This is not as explicitly communicated like a water
reduction or CO2 reduction. We don’t have explicit goals like these for biodiversity.”
5.4 Reporting about biodiversity This part is focused on the outcomes of questions that were asked to the businesses concerning
reporting about biodiversity. The intention here was mainly to find out how familiar the businesses
are with the various reporting forms, what can be reported in relation to biodiversity and what
influences their choices.
5.4.1 Most important issues in CSR report
To find out if the businesses themselves regard biodiversity as one of the main issues within CSR to
report about, they were asked to appoint the most important issues that are discussed in their
report. The answers show that reporting is still primarily about sustainability in general. First, two of
the businesses turn out to not publish CSR reports or reports about sustainability at all. One of them
is considering to start doing this in the future, while the other business is not planning to do so:
TU: “We are not obligated to bring out reports because we are a private business, but because we
are quite active on CSR, we are considering to set up a sustainability report.”
VION: “We bring out an annual financial report which is under supervision of the Dutch
government, and available on our website. On sustainability issues there also is a lot of supervision,
but reporting about sustainability is not in our prospect for the time being.”

59
These five businesses are reporting about sustainability, but mainly on other issues than biodiversity.
The main reason for this is that according to them, this is not yet possible or still too difficult:
BAM: “The No Net Loss approach used in some projects is very interesting, this could be of value
for better decision making in projects. But for reporting there are not yet well enough standardised
methods for biodiversity, so reporting remains difficult.”
SABIC: “We write an annual report about our global sustainability programme, which is mainly
about energy use and carbon emissions. Concerning sustainability reporting, we have still a long way
to go compared to our competitive businesses.”
Eneco: “Currently we don’t have enough to report about, but we want to report about
biodiversity in the future.”
Achmea: “For us it is only reasonable to report about the responsible investments and enhanced
engagements we carry out.”
DSM: “Our policy has always primarily been focused on reducing emissions, later it shifted to
sustainability in general. Which is now more and more integrated in our business strategy. We try to
follow the GRI guidelines for reporting, including for biodiversity. But this is difficult and complicated
to follow. Moreover, it is more easy to set explicit goals for issues like water or CO 2 reducing than for
biodiversity.”
The last two businesses are amongst other issues reporting about biodiversity, although more in an
indirect way:
AkzoNobel: “Our reporting about the issue biodiversity is mainly related to partnerships and
projects about bio-based materials.”
Ahold: “We are reporting about biodiversity more in an indirect way. We have a strict policy for
the 6 critical commodities, palm oil and soy are related to deforestation and so have an obvious link
to biodiversity. And cacao, tea and coffee are link to pesticide use. For the rest, our reporting is more
about sustainability in general.”
5.4.2 GRI guidelines for reporting
To figure out whether the following of the GRI guidelines can be a motive to report on biodiversity,
the businesses were asked if they are familiar with this reporting system. Seven businesses are
following the GRI guidelines currently, some already for several years. One of them noted that GRI is
too extensive in some ways:
Ahold: “The GRI guidelines are useful because it provides guidance in reporting, but is very
extensive and is still expanding. This makes them often too generalised, while we want to focus on
relevant sustainability hotspots.”
Two other businesses are not reporting according to the GRI guidelines. Technische Unie isn’t
because it is currently considering to start reporting about sustainability, and the GRI guidelines
therefore were not applicable up to now. VION does not follow GRI because the business is not
planning to start reporting about CSR anyway, the system is therefore not applicable for this
business.

60
5.4.3 Integrated reporting
Integrated reporting is becoming increasingly important, and its application is significant to the
extent to which a business integrates CSR (including biodiversity) into its strategy. Therefore the
businesses were asked if they are familiar with integrated reporting and are applying it to their
report. Here it became clear that three businesses (DSM, Eneco, AkzoNobel) are applying integrated
reporting for at least 5 years already, and two others (Achmea, BAM) started with this in 2013 or
2014. The other four businesses are not applying integrated reporting, because they are not ready
for this yet, or because they simply are not interested in reporting about CSR/sustainability:
Ahold: “Integrated reporting is not applied, as it is difficult to combine the financial report with
the more storytelling sustainability report. In the future the two parts will probably be combined.
Sustainability reporting will become so important that investors are going to want to have one
document. At this moment there are separate documents because it’s grown that way, currently our
business is content with this as it is a way to distinct ourselves in this way.”
TU: “We are currently considering to set up a sustainability report, so integrated reporting is a
step too far now.”
SABIC: “We are not that far with reporting yet, that we are going to apply integrated reporting.”
VION: “Reporting about sustainability is not in our prospect for the time being, integrated
reporting is therefore certainly not a question.”
5.4.4 Contact with organisations like IUCN / NGO’s
It is interesting to know whether the businesses are familiar with organisations like IUCN, which can
help to understand reporting indicators, and risks and opportunities of biodiversity. When a business
is in contact with such an organization, this means the business wants to go further than just meet
the reporting units, and wants to understand the business’ impact on biodiversity and how to change
/reduce this. After asking this question to the businesses, it appears that three businesses are
cooperating with IUCN in the Leaders for Nature project or within a Green Deal (sustainability
initiative supported by the government):
DSM: “We started working together with IUCN in the Leaders for Nature project to exchange
knowledge and ideas, and find solutions for the problems there exist together.”
AkzoNobel: “Our membership of the (IUCN), and the Leaders for Nature project in which we
participate, is in place since 2006. This business engagement network increases awareness and
inspiration for AkzoNobel employees.”
BAM: “We are working together with IUCN and other businesses within a Green Deal, which is
about natural capital.”
Four other businesses are having a partnership with the organisation WWF, or are regularly in
conversation with such NGO’s or commissions:
Ahold: “We have a formal partnership with WWF, and are always interested in working together
with other organisations to explore how we can strengthen each other.”
Eneco: “We have a partnership with WWF since 3 years. At their insistence, biodiversity is now
becoming a theme in our contract with them, and that a strategy will be developed for a project in
the next 3 years.”
VION: “We are regularly in conversation with NGO’s like WWF within the organisation of
GlobalGap. All NGO’s that want to join us have an open invitation for that.”
SABIC: “We often ask the input and opinion of NGO’s, mainly through commissions. They can
61
evaluate the sustainability of raw materials we use on the basis of their conditions. In that way we
want to conform to sustainability parameters which include biodiversity, like land use change, to
obtain certifications. We only want to use the exactly right sustainability claim on our products, as we
want to retain our good name.”
For the last two businesses, having contact with an organisation like IUCN is less relevant. For
Technische Unie because this business is not yet that active with CSR and reporting about this. It
could become relevant for this business in the future though, due to its (indirect) impact on
biodiversity. Achmea also doesn’t have contact with IUCN because the business has an indirect
impact on biodiversity. The business more collaborates with other organisations like ASN Bank, on
fields related to their financial services.
5.4.5 Choice for way/method of reporting on biodiversity
To understand the choice for a certain way or method of reporting on biodiversity by the businesses,
the businesses were asked if they can explain what underlies their way of reporting. For four
businesses it applies that their stakeholders play an important role in their way of reporting. These
stakeholders are either asking for more information on biodiversity, or hardly ask anything at all
about this subject:
Ahold: “According to some stakeholders you can’t go far enough in reporting, out of the
standpoint of transparency. They think we should be more specific because we report about the 6
commodity’s, but why not about others.”
BAM: “Our stakeholders determine the content of the report, and declare biodiversity isn’t a
material issue. Therefore it is not reported extensively.”
DSM: “The methods that are currently available for reporting on biodiversity explicitly are not
useable. They are too complex to be of interest for our stakeholders. It is not possible to make a
simplified decision, or make a simplified visual representation out of the methods that are available
at this moment.”
AkzoNobel: “The amount of biobased fuels we use is growing, and our stakeholders want us to
use certified sustainable biomass so biodiversity isn’t damaged. Reporting about that is an important
part of it.”
This business considers that next to meet stakeholder demands, it is important to improve itself in
the area of reporting about sustainability subjects:
SABIC: “Out of our own long-term vision, and to meet customer demands, but also from the
viewpoint of social acceptance we want to work on sustainability. But as for reporting, there are
businesses that have much better reporting than we do. You have to set yourself ambitious goals,
which is still very far away for SABIC. But we want to improve every year.”
One of the businesses is not reporting extensively about biodiversity because it is a less relevant
theme for them, with a too indirect impact:
Achmea: “It is not so relevant. In our Integrated report, we report about our responsible
investment, and the enhanced engagements, which is what we can report in respect to biodiversity.
We take biodiversity into account indirectly in our investments, but biodiversity is of course of indirect
impact on the core business of a financial institution, an insurer like us.”

62
For three other businesses reporting about biodiversity is inapplicable, because they are either
currently developing policy on biodiversity and related reporting ( TU, Eneco), or not interested in
reporting about biodiversity (VION).
5.4.6 Reporting and benchmarking
Businesses could be interested in reporting about sustainability issues to participate in benchmarks.
These benchmarks show how well the business is doing with regard to these issues, compared with
its competitors. It is interesting to know if the businesses are using their reporting for benchmarks, as
this could be a reason to report about biodiversity. The replies show that all businesses, except for
the two (TU, VION) that are not reporting about sustainability (yet), are participating in a benchmark
in some way. Three businesses remark that biodiversity is not represented well in the benchmarks
that exist currently:
DSM: “We are compared more and more by Dow Jones and such, mainly because of fossil
resources and fuels. But specifically biodiversity is not well represented in these benchmarks.
Environmentalists should lobby more at these kind of rating agencies to scale in biodiversity better. ”
BAM: “There is a benchmark for the quality of sustainability reporting, the transparency
benchmark. In our sector, we have been on the top of that benchmark for years now. But I don’t think
there is anything specific about biodiversity in that benchmark.”
AkzoNobel: “We are for example in the Transparency benchmark, but this is not quite specifically
aimed at biodiversity.”
These two businesses indicate that the benchmark showed that they lag behind their competitors,
and that this leads to the wish to improve, in order to finish higher in the benchmark:
Eneco: “We participated in a benchmark for sustainability in the energy sector. It showed that we
are falling behind in the field of sustainability currently, compared to other businesses. We
acknowledge we should take action, because we don’t want to fall behind.”
SABIC: “There are benchmarks for sustainability, like the Dow Jones Index. But other chemical
businesses score much higher on these benchmarks, we can still learn a lot from them.”
One business explains it sees its internal competitor analysis as a kind of benchmark:
Ahold: “We carry out an annual competitor analysis, in which we compare our targets on
sustainability with those of our competitors. We do this to see what we can learn from them.”
Finally, this business refers to the costs of benchmarks as a disadvantage:
Achmea: “But overall all parts of CSR cost more than they bring, also joining benchmarks from
NGO’s, it all costs money. But we participate because the society expects us to do that, our licence to
operate for investing in a responsible way.”
5.5 Motivation for biodiversity reporting
This section discusses different matters that can be of importance for businesses in their motivation
whether to report or not about biodiversity. The objective is to find out what is of affect to their
reporting behaviour, according to the businesses themselves.
63
5.5.1 Reason for biodiversity reporting
It is useful to understand if a certain occasion or opinion caused that a business currently is or isn’t
reporting about biodiversity. Therefore the businesses were asked why they (don’t) report about
biodiversity, and if there is something that has led to make the decision for this. For four businesses
it is currently not yet clear if they are going to report (more extensively) about biodiversity in the
future. Several motives to report on biodiversity are mentioned by these four businesses; continuity,
anticipating to risks, social responsibility, reputation, licence to operate, meeting customer demands
and staying ahead of competitors:
TU: “Continuity is important for our business and because we are a demand and trade driven
organisation, we see a lot of opportunities in sustainable products. So currently we are developing a
sustainability policy with KPI’s and goals that we can report about. Whether this will be with regard
to biodiversity, we do not know yet.”
Achmea: “Biodiversity risks for businesses can indirectly affect financial institutions, therefore it
becomes increasingly important to deal with these risks. Besides that, society expects us to handle in
a responsible way and we don’t want to have a negative reputation, to maintain our licence to
operate.”
BAM: “We don’t report extensively about biodiversity, but the attention for the issue itself is
because some clients are asking for biodiversity positive solutions, out our own personal interest and
the conformation that taking into account nature can work successfully.”
SABIC: “We still want to be able to produce products in 30 years from now, so we are searching
for alternatives for our resources to prevent exhaustion of fossil fuels. This will reduce environmental
impact, clients are asking for these kind of products as well. This could lead to interesting new
innovative products for our portfolio, allowing us to take the lead on our competitors.”
Then two businesses indicate that they currently are not reporting about (specifically) biodiversity,
but this will possibly be extended or implemented in the future. For one business this is a matter of
materiality, for the other business it is more seen as part of the strategy the business chooses. The
latter also mentions that a method for the measurability of biodiversity is still lacking, which makes
that the business is not yet reporting:
Ahold: “We have too many products to report on specifically biodiversity externally, so this is only
done internally. For the future the level of reporting depends on the outcome of our materiality index.
If turns out biodiversity gets a high result, we know we really have to take action. Then it will not be
an option to have no policy on this issue. So on the base of this matrix the priority of biodiversity could
become higher, but at the moment there are no plans for it.”
Eneco: “Biodiversity is an important theme within our business, but because it is still difficult to
measure biodiversity, we don’t have KPI’s or goals for it yet. Biodiversity is part of the One Planet
strategy (WWF), in which we aim to stay within the carrying capacity of the earth with our value
chains and clients. Seen the coming bio-economy and European regulations, reporting about
biodiversity seems a logical consequence as part of dealing with sustainability.”
One of the business is pretty sure that it will apply reporting about biodiversity even more in the
future. The business is aware of the impact it has on biodiversity through the use of raw materials
and wants to pursue transparency:
64
AkzoNobel: “Reporting on biodiversity is becoming increasingly important for us as a business.
Because the raw materials we use, the amount of bio-based materials, is growing. And that affects
biodiversity, and we want to be as transparent as possible about this.”
Two businesses are deliberately not reporting (in an extensive way) about biodiversity. This is
because the business thinks that there are other ways of communicating information, and it is also
too labour-intensive to report about these kind of issues. The other business isn’t reporting
(extensively) because stakeholders are not asking for it, biodiversity is hard to quantify and has no
priority:
VION: “We are not reporting on sustainability issues in special, separate reports because all the information is already public on our website and via Skal. There are other ways to provide insight in
things. Besides that we are not capable to make a separate report for all the different issues there
are, like food security, environment, biodiversity, animal welfare, it’s too much work.”
DSM: “We try to follow the GRI guidelines for the part of biodiversity, although it is hard to follow
exactly, mainly the land use part. None of our stakeholders is asking for this kind of information,
therefore it is not elaborated in our report. At the same time clients are increasingly preferring
sustainable products, but within their budget. Biodiversity is hard to quantify and won’t make money.
Therefore it has no priority to put targets on and report about it.”
5.5.2 Governmental policies, laws and/or regulations
In order to identify if certain laws or regulations can be a motive for the businesses to report on
biodiversity, the businesses were asked if they are aware of any policies, laws and/or regulations that
might be of influence. The first two businesses noted that they especially notice the differences in
legislation between different countries and in particular continents, although more in general than
specifically concerning biodiversity. One business says that the Dutch and EU laws are more
advanced than the laws outside the EU, the other business’ opinion is that the Dutch government is
not capable of keeping regulations under control:
Ahold: “What makes it difficult for us, is that NL and EU laws and regulations has much higher
standards than for example in the US. Certain things that are very common in the US, may already be
prohibited by law in NL. For our policy this means we ask a separate requirement in our business in
the US, while this is no longer necessary in NL because everyone already meets the requirements, as
the government already has committed it by law. NL and EU are much more advanced in
regulations.”
VION: “Foreign products that are imported are under supervision of both the Dutch legislation as
well as that of the other country. It is complex because the consumer wants that there is dealt well
with the regulations, but the government doesn’t have the capacity to actually control everything.
Thereby political programmes and priorities change quickly, policies disappear sometimes and this
could happen to biodiversity too. That is why our business chooses to work towards organising things
in private standards, to ensure the quality of standards.”
Two other businesses are convinced legislation relating to biodiversity is coming, and want to be
prepared for this:
AkzoNobel: “There is no specific legislation on biodiversity yet, but we are trying to stay ahead of
it, preparing for that it will come.”
Eneco: “We want to anticipate to coming legislation in respect to biodiversity, for instance a
65
reporting obligation. Our goal is to be leading in this rather than have to follow.”
For this business, regulations around sustainable materials, like wood, are important. The business
indicates that despite the EU law for sustainable certified wood, it is still allowed to import non-
sustainable wood in The Netherlands. This legislation therefore is contradictory:
BAM: “The general demand of society is to buy and use sustainable wood, but it is still legal to
import non-sustainable wood. Dutch commissioners are buying sustainable products more because of
compliance of the EU law, than choosing for it voluntary. The government shows it is not an
important issue for them by purchasing only 50% of the wood sustainably. Our business is working
with 100% sustainable certified wood.”
Legislation is important for this businesses because of the risk it carries for the businesses it invests
in, these businesses can lose their licence to operate when they do not me et the requirements of the
law. Therefore it affects this business indirectly:
Achmea: “In the coming years it may turn out that we insure a business which is performing bad
in terms of sustainability or biodiversity. Then as an insurance business we have the risk that we
invest in a business that later has no longer a license to operate, because of legislation it cannot fully
implement its business operations. So indirectly legislation can affect us as an insurer.”
This business indicates that it has little to do with legislation in areas like biodiversity, the business is
more a link between supplier and customer. Legislation is therefore less relevant for this business:
TU: “We are a link between the producing supplier to the end customer, and we try to be an
optimal link in that. But we are also very much dependent on what our suppliers have to offer us and
what our customers ask us.”
Another business indicates that the legislation on which they have to comply with is directed to
climate measures:
SABIC: “The overarching legislation comes from the EU, the climate goals it has set itself . We
have to meet these regulations, that's basically what gives our activities direction. If we would not do
anything, that would just cost more money. We need to invest in technologies to emit less CO2, or buy
rights on the market. The rights are expensive and therefore are in fact an incent ive to emit less.”
According to this business legislation is not conclusive, because businesses then only apply the
minimum demands and don’t take initiatives themselves:
DSM: “Legislation is a short term solution. It drives a number of businesses in the right direction.
But it can also mean that businesses end up in trouble, because the competition is still there. Then
they only meet legislation because they have to, rather than wanting to make a difference
themselves.”
5.5.3 Extra value of biodiversity and the role of stakeholders
Reporting on issues like biodiversity can provide additional value to a business, but also stakeholders
can play a role in the choice to report on this issue. The businesses were asked whether this is
applicable to them. For these three businesses, NGO’s are the most important stakeholders, with
whom they decide together in what way biodiversity can provide extra value:
Ahold: “Mainly the stakeholder group of NGO’s committed us to have targets on biodiversity

66
issues. We are reporting on these targets, and investors start asking questions on why targets are not
reached. “
VION: “Within GlobalGAP we regularly consult with various NGOs in the field of environment and
animal welfare. We discuss the standards, with all those NGOs that are relevant there. We are very
transparent about it and make it visible, and anyone can join.”
SABIC: “We seek the opinion of NGOs and committees on certain developments. We also have
green deals with the government. Certifications are also important to show that we take with respect
to environmental matters.”
For these two businesses stakeholders are important to involve in all kinds of cases, and reporting
forms a means to do this:
AkzoNobel: “Our business follows best practice and is constantly working to improve its
reporting. We engage stakeholders in our sustainability activities and reporting and truly value their
feedback and input.”
Achmea: “Reporting is an important way of strengthening ties with our stakeholders: our
customers, employees, (business) partners and shareholders. The aim of our report is to provide a
comprehensive overview of our organization, to demonstrate the links between our strategy,
governance and the social and economic context in which we operate.”
Most customers of this business are not interested in the theme of biodiversity, attention for this
comes more from the business itself:
BAM: “Only few of our commissioners do care about issues like biodiversity, our yearly
stakeholder dialogue shows that the interest of our stakeholders (clients, suppliers, NGO’s, social
representations, employees) in biodiversity is very low. Biodiversity is included in our business
principles, we are putting more weight to the issue than our stakeholders do. Thereby it is harder to
‘sell’ biodiversity than generally known aspects like green and water.”
This business knows that its activities on CSR are appreciated by stakeholders, but that there is also
room for improvement:
TU: “The activities we do for CSR are appreciated by our stakeholders, that is our image. We can
definitely score better, but considering our level of impact and type of branch we are doing quite well.
The main impact is within the products and their chain of our suppliers , so we have only limited
influence.”
This business believes that the theme of biodiversity can help to create added value by positioning
itself with it:
Eneco: “The theme biodiversity provides us a chance to profile ourselves in that area, as
sustainable energy company.”
This business is focused on keeping all factors of CSR balanced, in order to create an optimum way of
adding extra value:
DSM: “We are constantly in search of themes that are of relevance for our business, that keep the
aspects People, Planet and Profit in balance. When you care for planet, there should be attention for
profit also. So we keep asking ourselves what prov ides our business extra value.”
67
5.5.4 Limitations and opportunities for improvement with regard to biodiversity reporting
As a final question, the businesses were asked what they think would help to improve the quality of
biodiversity reporting, and what limitations they now see in that light. Each business has a different
answer to this question, they will be discussed one by one here. Moreover, most businesses are
talking more about the integration of biodiversity into the business in general than about the
reporting of it.
According to Ahold, are the costs that the issue of biodiversity brings with it, seen as the biggest
constraint now. It is not yet clear enough what it may bring when biodiversity is taken into account in
the business strategy. Also for the customer the concept is too vague; biodiversity is difficult to
translate into products. The government could eventually play a role by setting regulations, because
within the sector there is too much competition to really tackle this kind of problem:
Ahold: “If it would be possible to show people and let them feel what kind of positive impact it
has to take biodiversity into account, that would really help to arouse interest. The question is should
the government take a role, or should businesses take the responsibility themselves. When things do
get economically viable, it gets a lot more interesting for another part of the business to incorporate
biodiversity. Right now biodiversity is in the theme of sustainability, and is seen as additional cost
item, as certain certificates or suppliers are needed. Who should pay these extra costs, the business or
the client. If the financial, commercial part of the business can be convinced that having a good
management on biodiversity is profitable or gaining a new group of customers, it could work. It may
be better to decide as supermarkets together, to not sell a product any longer because it damages the
environment in the country of origin. Or even better, to increase the price of those products that have
a negative impact over those that have a neutral or positive impact. But unfortunately that is not how
it currently works, there is too much competition amongst supermarkets. The government might have
a bigger role in this eventually, but this isn’t always wanted by businesses either.“
In addition, Ahold indicates that they might benefit from new technologies such as apps targeting the
product level, allowing the business to reach a different and wider audience:
“What is interesting are all apps there are available on product level, like Questionmark for instance,
this provides a lot of information on product level. These apps are very useful because they are on call
basis, easy to use, clear by not showing too much information, but much more information than we
can put into a report. It also reaches a whole other kind of public, apps are used more by the
customers, while our sustainability report is mainly used by investors and other stakeholders.”
The business VION is mainly looking for ways to deal with all sustainability issues in a right way at the
same time, and therefore aims to implement complete systems that are most appropriate:
VION: “What works right for us is well functioning systems, which make the difference, are
transparent for everybody, understandable for everybody and explainable everywhere. Things that
cannot be explained, shouldn’t be conducted any longer.”
Because there is still very little known about the whole concept of biodiversity, according to BAM,
the pricing of biodiversity is not a good solution. The business believes that there is more interest for
the use of the No Net Loss principle on a project base. Protocols to be able to report about
biodiversity have to be developed:
BAM: “The difficulty with biodiversity is within the diversity. There still is no complete knowledge

68
about the functioning of food chains, and it is very complicated to determine the cause and result of
the threat to a chain by the loss of a species. Pricing, or expressing the value of biodiversity in money,
is therefore probably not the best way to protect biodiversity. There is more to expect from handling
the No Net Loss principle on a project base, to have a positive impact on biodiversity. Businesses have
to deal with other important issues as well, so are considering which to give priority . Also aspects like
waste and CO2 emissions are more easy to communicate than biodiversity is. For biodiversity there
are no convenient protocols available yet, which makes it difficult to report about it.”
SABIC clearly indicates that it can use the help of NGO’s in making workable objectives relating to
biodiversity:
SABIC: “We are open to discuss themes like biodiversity with NGO’s, to consider together with
them which steps could be taken in our business on the way to a sustainable future. It would be useful
to formulate achievable targets, and we need clear definitions to make it understandable for
everyone.”
According to DSM, there should be even greater priority for biodiversity within NGOs. Also good,
workable methods are needed to be able to measure and report biodiversity, as existing indicators
are too complicated:
DSM: “Environmental NGO’s should lobby more at rating bureau’s to prioritize biodiversity more.
Because the importance of biodiversity should be demonstrated more. Besides that, we need a proper
method for reporting on biodiversity, a method to measure these kind of data is needed. The key-
elements have to be translated to a concept with tools that are useful for the industry to start
working with. Because existing indicators, like Mean Species Abundance for instance, are much too
complicated, they are incomprehensible and unexplainable.”
Akzo Nobel is a business in the top level regarding to reporting, and say in that respect there is not
much to improve:
AkzoNobel: “We are leading in integrated reporting, and are continuously in development with
the aim of achieving the highest level.”
The three businesses Eneco, TU and Achmea are currently considering if and possibly how they want
to report on biodiversity in the future. Therefore they could not answer this question yet. However,
Eneco has indicated that the measurability of biodiversity constitutes a restriction.
5.6 Conclusions business interviews
The general conclusions that can be drawn from the results of the interviews will be elaborated in
this part. This is done for the head parts Biodiversity, Reporting and Motivation. At the end of this
section, the most important information per business is summarized in Table 9. Noted should be
though that this group of businesses cannot represent the total of all businesses in The Netherlands,
therefore this sample is too small.
5.6.1 Biodiversity
Relationship
The businesses state that their relation with biodiversity is mainly based on their products and
certifications, innovation and development / frontrunner and continuity. For a few businesses the
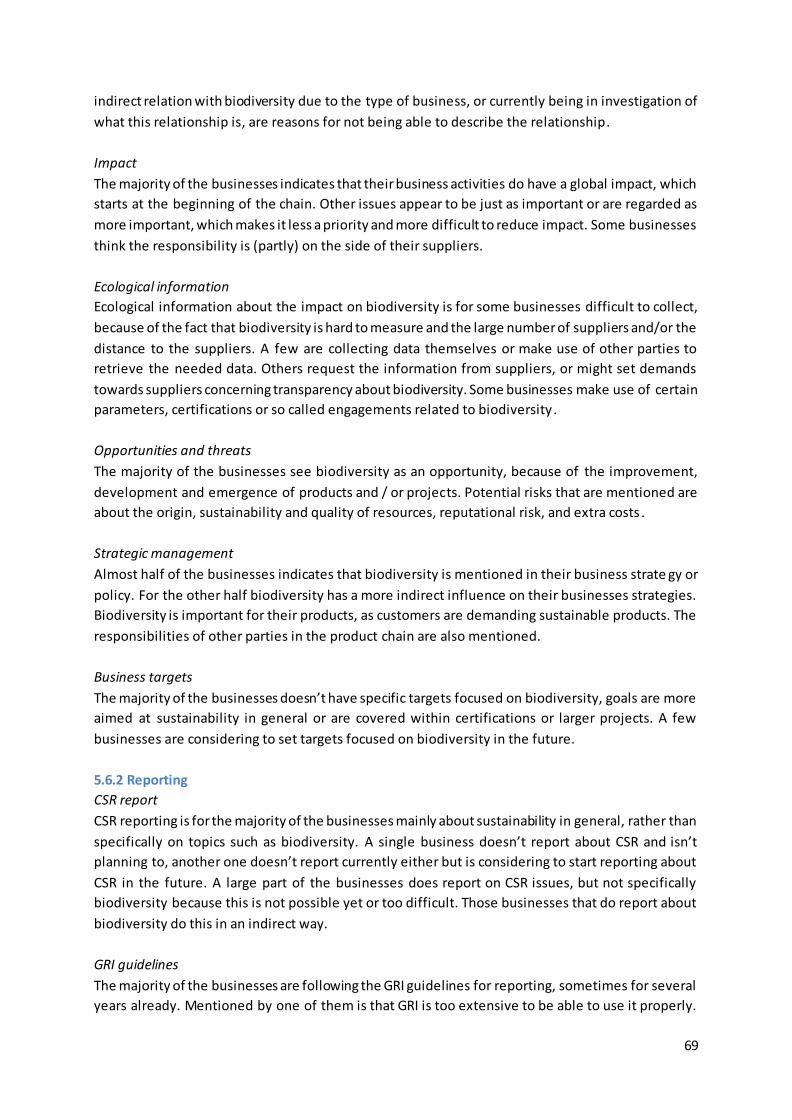
69
indirect relation with biodiversity due to the type of business, or currently being in investigation of
what this relationship is, are reasons for not being able to describe the relationship.
Impact
The majority of the businesses indicates that their business activities do have a global impact, which
starts at the beginning of the chain. Other issues appear to be just as important or are regarded as
more important, which makes it less a priority and more difficult to reduce impact. Some businesses
think the responsibility is (partly) on the side of their suppliers.
Ecological information
Ecological information about the impact on biodiversity is for some businesses difficult to collect,
because of the fact that biodiversity is hard to measure and the large number of suppliers and/or the
distance to the suppliers. A few are collecting data themselves or make use of other parties to
retrieve the needed data. Others request the information from suppliers, or might set demands
towards suppliers concerning transparency about biodiversity. Some businesses make use of certain
parameters, certifications or so called engagements related to biodiversity.
Opportunities and threats
The majority of the businesses see biodiversity as an opportunity, because of the improvement,
development and emergence of products and / or projects. Potential risks that are mentioned are
about the origin, sustainability and quality of resources, reputational risk, and extra costs .
Strategic management
Almost half of the businesses indicates that biodiversity is mentioned in their business strate gy or
policy. For the other half biodiversity has a more indirect influence on their businesses strategies.
Biodiversity is important for their products, as customers are demanding sustainable products. The
responsibilities of other parties in the product chain are also mentioned.
Business targets
The majority of the businesses doesn’t have specific targets focused on biodiversity, goals are more
aimed at sustainability in general or are covered within certifications or larger projects. A few
businesses are considering to set targets focused on biodiversity in the future.
5.6.2 Reporting
CSR report
CSR reporting is for the majority of the businesses mainly about sustainability in general, rather than
specifically on topics such as biodiversity. A single business doesn’t report about CSR and isn’t
planning to, another one doesn’t report currently either but is considering to start reporting about
CSR in the future. A large part of the businesses does report on CSR issues, but not specifically
biodiversity because this is not possible yet or too difficult. Those businesses that do report about
biodiversity do this in an indirect way.
GRI guidelines
The majority of the businesses are following the GRI guidelines for reporting, sometimes for several
years already. Mentioned by one of them is that GRI is too extensive to be able to use it properly.
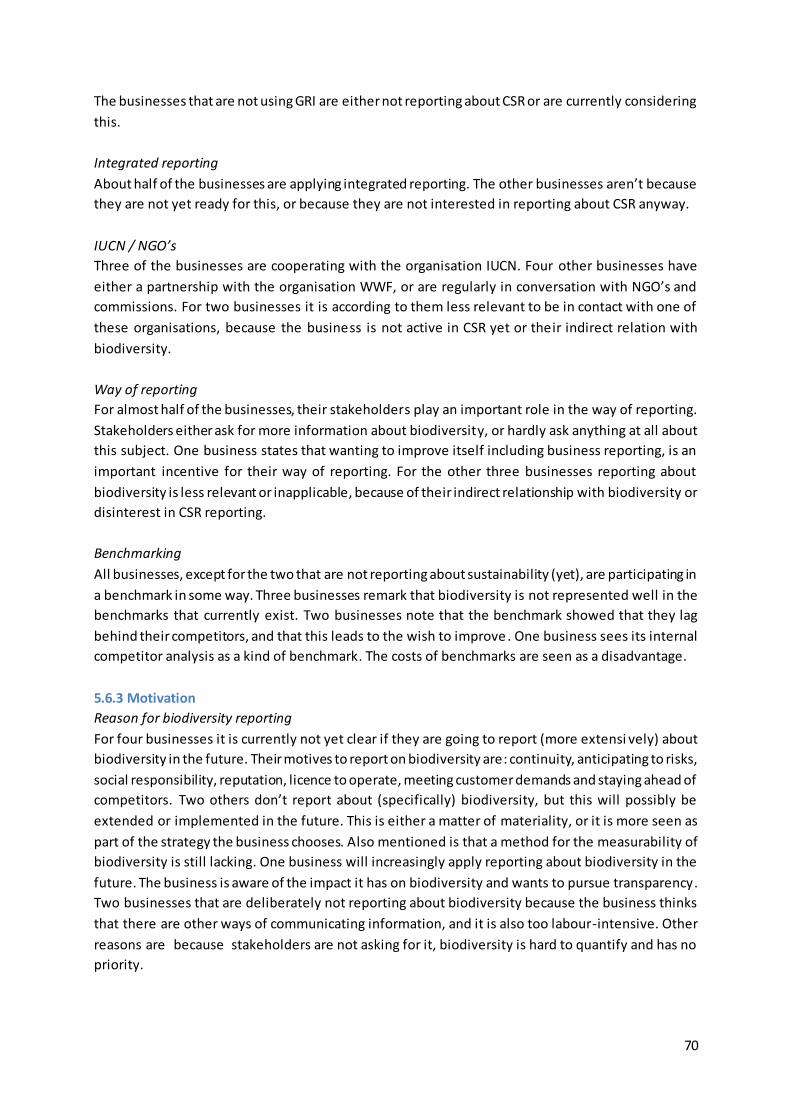
70
The businesses that are not using GRI are either not reporting about CSR or are currently considering
this.
Integrated reporting
About half of the businesses are applying integrated reporting. The other businesses aren’t because
they are not yet ready for this, or because they are not interested in reporting about CSR anyway.
IUCN / NGO’s
Three of the businesses are cooperating with the organisation IUCN. Four other businesses have
either a partnership with the organisation WWF, or are regularly in conversation with NGO’s and
commissions. For two businesses it is according to them less relevant to be in contact with one of
these organisations, because the business is not active in CSR yet or their indirect relation with
biodiversity.
Way of reporting
For almost half of the businesses, their stakeholders play an important role in the way of reporting.
Stakeholders either ask for more information about biodiversity, or hardly ask anything at all about
this subject. One business states that wanting to improve itself including business reporting, is an
important incentive for their way of reporting. For the other three businesses reporting about
biodiversity is less relevant or inapplicable, because of their indirect relationship with biodiversity or
disinterest in CSR reporting.
Benchmarking
All businesses, except for the two that are not reporting about sustainability (yet), are participating in
a benchmark in some way. Three businesses remark that biodiversity is not represented well in the
benchmarks that currently exist. Two businesses note that the benchmark showed that they lag
behind their competitors, and that this leads to the wish to improve. One business sees its internal
competitor analysis as a kind of benchmark. The costs of benchmarks are seen as a disadvantage.
5.6.3 Motivation
Reason for biodiversity reporting
For four businesses it is currently not yet clear if they are going to report (more extensi vely) about
biodiversity in the future. Their motives to report on biodiversity are: continuity, anticipating to risks,
social responsibility, reputation, licence to operate, meeting customer demands and staying ahead of
competitors. Two others don’t report about (specifically) biodiversity, but this will possibly be
extended or implemented in the future. This is either a matter of materiality, or it is more seen as
part of the strategy the business chooses. Also mentioned is that a method for the measurability of
biodiversity is still lacking. One business will increasingly apply reporting about biodiversity in the
future. The business is aware of the impact it has on biodiversity and wants to pursue transparency.
Two businesses that are deliberately not reporting about biodiversity because the business thinks
that there are other ways of communicating information, and it is also too labour-intensive. Other
reasons are because stakeholders are not asking for it, biodiversity is hard to quantify and has no
priority.

71
Legislation
Two businesses notice the differences in legislation between different countries and in particular
continents, although more in general than specifically concerning biodiversity. They say the Dutch
and EU laws are more advanced than outside these areas, but also that the Dutch government is not
capable of keeping regulations under control . This business chooses to work towards organising
things in private standards. Two other businesses are convinced legislation relating to biodiversity is
coming, and want to be prepared for this. One business argues that Dutch legislation around
sustainable or biodiversity related products can be contradictory. For the other businesses legislation
is less relevant or affects it indirectly, or is di rected to climate measures. One business states
legislation is not conclusive, because businesses then only apply the minimum demands and don’t
take initiatives themselves.
Extra value and stakeholders
For three businesses, NGO’s are the most important stakeholders, with whom they decide together
in what way biodiversity can provide extra value. For two businesses stakeholders are important to
involve in all kinds of cases, and reporting forms a means to do this. One business states customers
are not interested in the theme of biodiversity, attention for this comes more from the business
itself. Another business states its activities on CSR are appreciated by stakeholders, but that there is
also room for improvement. One business believes that the theme of biodiversity can help to create
added value by positioning itself with the theme. Another business is focused on keeping all factors
of CSR balanced, in order to create an optimal way of adding extra value.
Limitations and improvements
One business argues that the costs that the issue of biodiversity brings with it, are seen as the biggest
constraint. It is not clear enough yet what advantages biodiversity can bring for the business. Also for
the customer the concept is too vague; biodiversity is difficul t to translate into products. The
government could eventually play a role by setting regulations, because within the sector there is too
much competition to really tackle this kind of problem. The business indicates that they might
benefit from new technologies such as apps targeting the product level, allowing the business to
reach a different and wider audience. Another business is mainly looking for ways to deal with all
sustainability issues in a right way at the same time, and therefore aims to impleme nt complete
systems that are most appropriate. According to one business, there is still very little known about
the whole concept of biodiversity, therefore the pricing of biodiversity is not a good solution. The
business believes that there is more interest for the use of the No Net Loss principle on a project
base. Also, protocols to be able to report about biodiversity have to be developed. Another business
indicates that it can use the help of NGO’s in making workable objectives relating to biodiversity. One
of the business states there should be even greater priority for biodiversity within NGOs. Also good,
workable methods are needed to be able to measure and report biodiversity, as existing indicators
are too complicated. Another business also argues that the measurability of biodiversity constitutes a
restriction. Moreover, most businesses are talking more about the integration of biodiversity into the
business in general than about the reporting of it. This indicates that the concept of biodiversity isn’t
very much alive yet in most businesses, and without concrete goals on biodiversity to start with, it's
not possible to report properly about it either.

72
Table 9: Summary of most important interview results per business
Business Risk zone
Re-ports
?
Why (not) reporting
biodiversity:
Relation Impact Stake-holders of influence
IR GRI Limitations Improvements
Ahold Red Yes, but decre
ased dra-ma-
tically
Low in materiality index. Too
many different products
Products Indirect NGO’s No Yes but are
seen as com-
plex
Costs. Collecting ecological data
Make biodiversity profitable or gaining new
costumers
TU Amber No Not obliged to bring out reports
Products Indirect Costumers No No CSR policy not yet suitable to report
Transparency, set demands on suppliers
Akzo Nobel
Amber Yes Stay ahead of future
legislation
Raw materials
Indirect Costumers Yes Yes Reliance on fossil materials
Frontrunner
Achmea Amber No Indirect relationship
choice of invest-ments
Indirect Society Yes Yes Reporting not relevant because of indirect
relationship
Take into account biodiversity risks for l icense to operate
VION Red No Not capable (time+ money) to make a
separate CSR report
fodder suppliers
Indirect NGO’s No No Many different occurring issues, many suppliers. Governmental regulations
Setting minimal standards for all issues within whole supply
chain; private standards
BAM Red Yes Interested clients, own interest of
BAM, taking into account nature can
indeed work successfully
Materials and building
environ-ment
Both indirect and
direct
Costumers Yes Yes Stakeholders declare it’s not an important or
material issue. Calculation methods for
biodiversity.
No Net Loss principle on project base
SABIC Amber Yes (de-crea-
sing)
Reporting driven from international
organization, national projects not visible
Raw materials
Both indirect and
direct
NGO’s, costumers
No Yes Aimed at making products more
sustainable, than at having specific targets on biodiversity
Taking into account whole supply chain. Collaboration with NGO’s to determine impact on biodiversity
Eneco Red No Currently investigating impact on biodiversity
Raw
materials and environ-ment
Both
indirect and direct
NGO’s,
costumers
Yes Yes Biodiversity
cannot be measured well enough yet
Implement
biodiversity action plans, eventually achieve No Net
Loss situation
DSM Red Yes Participation IUCN LfN project, following GRI guidelines
Raw materials
Direct and indirect
NGO’s, costumers, society
Yes Yes Stakeholders not interested due to complex
measuring methods
Benchmarks that represent biodiversity well.
Proper method for measuring + reporting biodiversity

73
6 Discussion
This chapter consists of three parts. The first part (6.1) reflects on the findings of the research while
relating them to current literature. Then, in 6.2 the theoretical framework that is used is discussed.
Lastly, the methodology of this study will be reviewed in 6.3.
6.1. Reflection on results
6.1.1 State of biodiversity reporting
The principal purpose of this research was to provide an analysis of the current state of biodiversity
reporting by Dutch businesses, and their intentions behind their way of reporting. Literature showed
that biodiversity is scarcely mentioned in business reports from over the world. Of the annual reports
of the 100 largest businesses in the world, only 18 businesses mentioned biodiversity or ecosystems
(PwC, 2008). Rimmel and Jonäll (2013) indicate that only 9 out of the 29 business in their study,
provided information regarding biodiversity in their business reports. In Denmark, 9 out of 24
businesses reported about biodiversity in a three year period, according to Van Liempd & Busch
(2013). So far, nothing can be found in literature about specifically biodiversity reporting by Dutch
businesses. The results of this study, focused on biodiversity reporting by Dutch businesses, show
that over a five year period, 70% of the 50 businesses has mentioned biodiversity at least once in one
of their reports. Almost one third of these business thus reports nothing in the period 2010 to 2014,
and the businesses that did report on biodiversity have not always been consistent. In addition, there
appear to be large differences in the quantity and quality of the information on biodiversity in the
investigated reports.
6.1.2 Amount of reporting
The results have shown that there has been a growth in reporting about biodiversity from 2010 to
2014, both in the amount of biodiversity disclosures as the number of businesses that is reporting.
Both are also in a declining rate in the last year or two years. The percentage of businesses that has
been reporting in one or more years, has increased by 16% from 2010 to 2012, and decreases with
4% in 2014. But when considering each of the investigated years separately, 21 to 29 of the total of
50 businesses doesn’t report on biodiversity, which is 42 to 58%. So on average, only a little more
than 50% of the investigated businesses reports about biodiversity (at least once) in the years 2010
to 2014. The total number of biodiversity disclosures per year, almost doubled within three to four
years from 69 in 2010, to 138 in 2013, where after it decreases a little to 130 in 2014. This indicates
that the businesses that report on biodiversity have done this more extensively, but the number of
businesses itself has remained virtually unchanged. The expectation would be that in the meantime,
the part of businesses that is reporting on biodiversity is larger now, in comparison with the results
from the aforementioned studies (in 6.1.1) which have been conducted in the years 2008 to 2011. In
this period, towards 2014, it was to be expected that much more businesses could have developed
themselves and have been able to gather information about their impact on biodiversity. But in
reality, this number of businesses apparently has not increased much, and the trend in which only a
portion of the businesses pays attention to biodiversity continues.
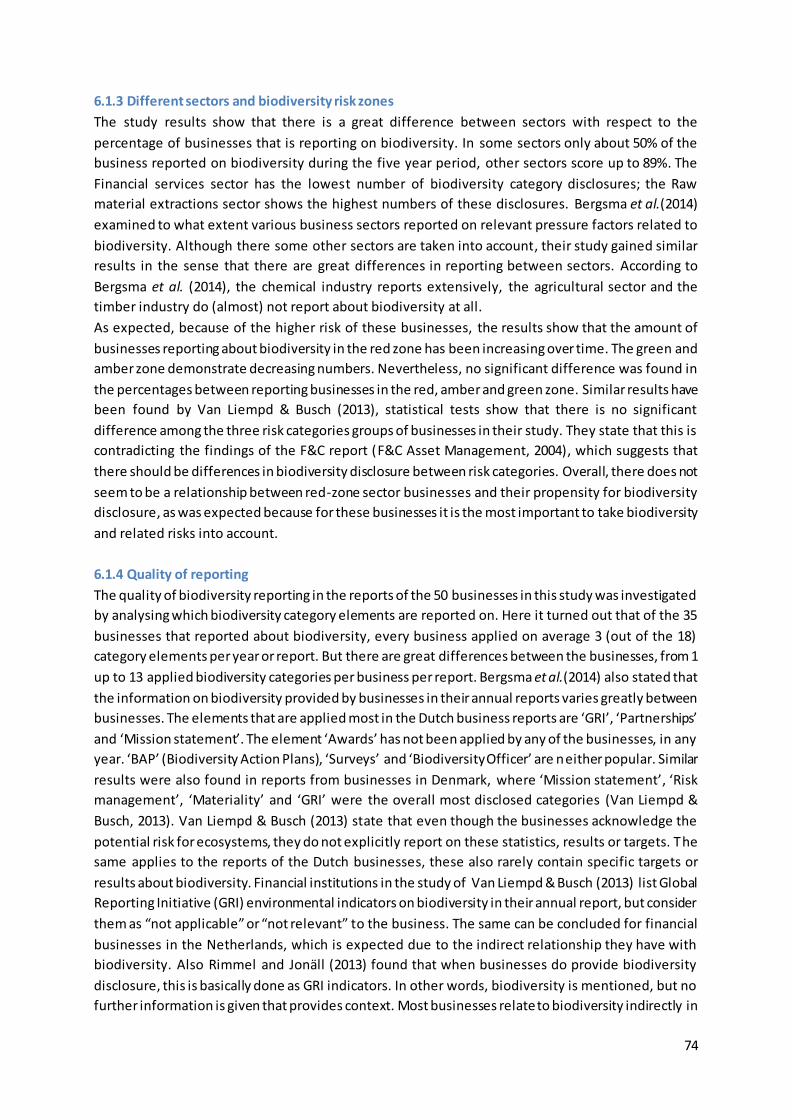
74
6.1.3 Different sectors and biodiversity risk zones
The study results show that there is a great difference between sectors with respect to the
percentage of businesses that is reporting on biodiversity. In some sectors only about 50% of the
business reported on biodiversity during the five year period, other sectors score up to 89%. The
Financial services sector has the lowest number of biodiversity category disclosures; the Raw
material extractions sector shows the highest numbers of these disclosures. Bergsma et al.(2014)
examined to what extent various business sectors reported on relevant pressure factors related to
biodiversity. Although there some other sectors are taken into account, their study gained similar
results in the sense that there are great differences in reporting between sectors. According to
Bergsma et al. (2014), the chemical industry reports extensively, the agricultural sector and the
timber industry do (almost) not report about biodiversity at all.
As expected, because of the higher risk of these businesses, the results show that the amount of
businesses reporting about biodiversity in the red zone has been increasing over time. The green and
amber zone demonstrate decreasing numbers. Nevertheless, no significant difference was found in
the percentages between reporting businesses in the red, amber and green zone. Similar results have
been found by Van Liempd & Busch (2013), statistical tests show that there is no significant
difference among the three risk categories groups of businesses in their study. They state that this is
contradicting the findings of the F&C report (F&C Asset Management, 2004), which suggests that
there should be differences in biodiversity disclosure between risk categories. Overall, there does not
seem to be a relationship between red-zone sector businesses and their propensity for biodiversity
disclosure, as was expected because for these businesses it is the most important to take biodiversity
and related risks into account.
6.1.4 Quality of reporting
The quality of biodiversity reporting in the reports of the 50 businesses in this study was investigated
by analysing which biodiversity category elements are reported on. Here it turned out that of the 35
businesses that reported about biodiversity, every business applied on average 3 (out of the 18)
category elements per year or report. But there are great differences between the businesses, from 1
up to 13 applied biodiversity categories per business per report. Bergsma et al.(2014) also stated that
the information on biodiversity provided by businesses in their annual reports varies greatly between
businesses. The elements that are applied most in the Dutch business reports are ‘GRI’, ‘Partnerships’
and ‘Mission statement’. The element ‘Awards’ has not been applied by any of the businesses, in any
year. ‘BAP’ (Biodiversity Action Plans), ‘Surveys’ and ‘Biodiversity Officer’ are neither popular. Similar
results were also found in reports from businesses in Denmark, where ‘Mission statement’, ‘Risk
management’, ‘Materiality’ and ‘GRI’ were the overall most disclosed categories (Van Liempd &
Busch, 2013). Van Liempd & Busch (2013) state that even though the businesses acknowledge the
potential risk for ecosystems, they do not explicitly report on these statistics, results or targets. The
same applies to the reports of the Dutch businesses, these also rarely contain specific targets or
results about biodiversity. Financial institutions in the study of Van Liempd & Busch (2013) list Global
Reporting Initiative (GRI) environmental indicators on biodiversity in their annual report, but consider
them as “not applicable” or “not relevant” to the business. The same can be concluded for financial
businesses in the Netherlands, which is expected due to the indirect relationship they have with
biodiversity. Also Rimmel and Jonäll (2013) found that when businesses do provide biodiversity
disclosure, this is basically done as GRI indicators. In other words, biodiversity is mentioned, but no
further information is given that provides context. Most businesses relate to biodiversity indirectly in

75
their reports, with respect to the emission of greenhouse gasses and carbon footprint. CLM/LNV
(2010) also stated that sustainability reports are mainly aimed at climate issues, and not so much at
biodiversity. For example, according to Bergsma et al. (2014), land use is not quantitatively reported
by sectors such as agriculture and the timber industry, while this would be expected from these
sectors with respect to their impact. The results have shown that in 84% of the cases, business
reports contain 1 to 7 different biodiversity category elements. And in 16% of the reports 8 to 14
different elements are applied. So the majority of the businesses reports about less than 8
biodiversity category elements. Van Liempd & Busch (2013) found in their study that even more than
one-third (36,8 percent) of the 19 reporting categories were empty of scores, in total only 28 scores
were counted for all 24 businesses over a three-year period. According to PwC (2008), only 24 out of
89 businesses in their research described actions to reduce impacts on biodiversity, and 9 bus inesses
identified biodiversity as a key sustainability issue. The numbers of this study and those of previous
researches, indicate that reporting quality with respect to biodiversity is low overall, biodiversity
disclosure is minimalistic and general. As pointed out by Rimmel and Jonäll (2013), when businesses
make statements related to biodiversity, these statements seldom reveal in-depth information.
Rather, businesses discuss environmental impact only in a broad context. These results are
unexpected because despite that more biodiversity category elements have been reported during
the investigated years, no significant increase in specific information on biodiversity is provided by
the businesses.
6.1.5 Business motivations
Relationship with biodiversity
A large part of the businesses have indicated that their relationship is based on the products they
buy, make and/or sell. Van Liempd & Busch (2013) discovered the same in their study and therefore
suggest that typology by Grabsch et al.(2011) could be extended by adding a category called
Products. Here, businesses then can describe the benefits their products or services have for
biodiversity. Van Liempd & Busch (2013) argue that this Products category could be a be a genuine
reporting category since it does convey important information to stakeholders. Another frequent
relation to biodiversity that was named by the businesses is the certifications they work with, which
contain requirements concerning biodiversity. The conclusions of the study of Bergsma et al. (2014)
reveal however, that certification does not always result in halting the loss of biodiversity. For
example, this study argues that the production of certified wood still causes biodiversity loss as the
rotation time is shorter than the time the forest ecosystem requires to recover from the harvest.
Furthermore, there are businesses that state they only have an indirect relationship with biodiversity
and therefore have no impact. Rimmel and Jonäll (2013) also found that businesses dismiss
biodiversity concerns as irrelevant since they claim their activities have no negative impact on the
environment.
Opportunities and threats
The majority of the businesses indicated to see biodiversity as an opportunity, because of the
improvement, development and emergence of products and / or projects. According to Bergsma et
al. (2014), adopting a policy like No Net Loss or Net Positive Impact, has a much larger impact in
businesses as it makes employees aware that natural resources are not for free and unli mitedly
available. For these businesses biodiversity becomes an opportunity instead of a risk, as this
awareness drives the design of processes and facilities to become resource -efficient, and ultimately
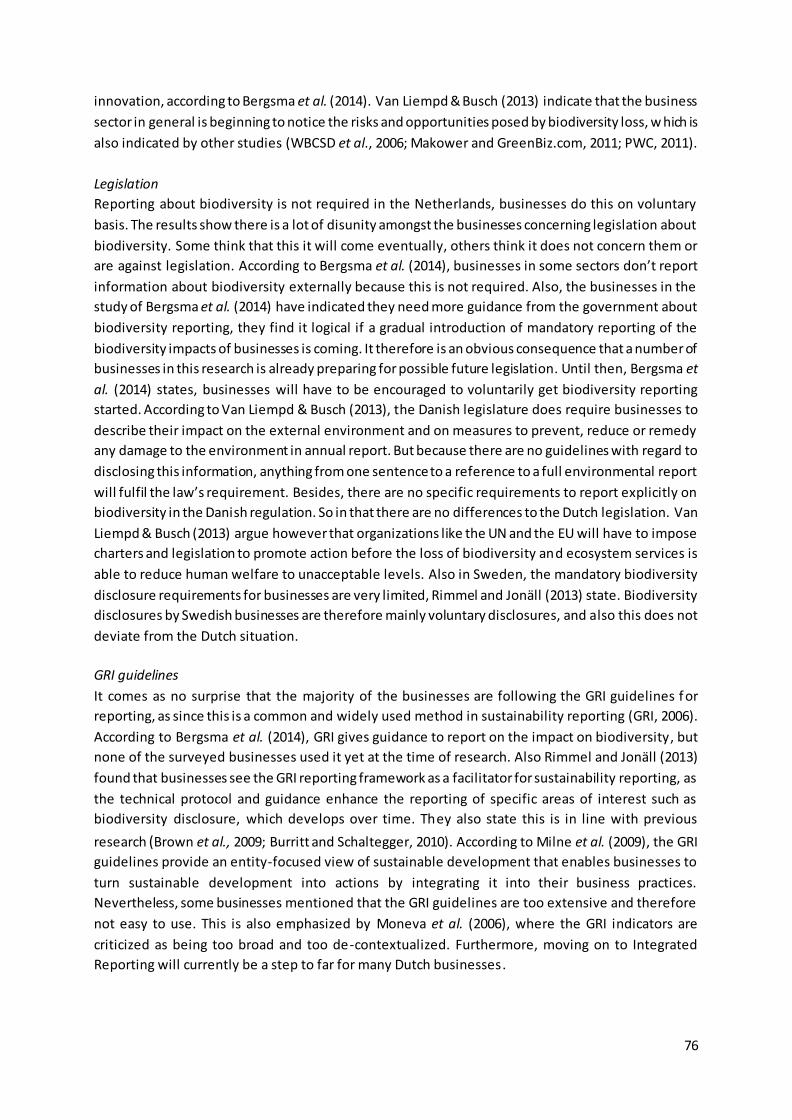
76
innovation, according to Bergsma et al. (2014). Van Liempd & Busch (2013) indicate that the business
sector in general is beginning to notice the risks and opportunities posed by biodiversity loss, w hich is
also indicated by other studies (WBCSD et al., 2006; Makower and GreenBiz.com, 2011; PWC, 2011).
Legislation
Reporting about biodiversity is not required in the Netherlands, businesses do this on voluntary
basis. The results show there is a lot of disunity amongst the businesses concerning legislation about
biodiversity. Some think that this it will come eventually, others think it does not concern them or
are against legislation. According to Bergsma et al. (2014), businesses in some sectors don’t report
information about biodiversity externally because this is not required. Also, the businesses in the
study of Bergsma et al. (2014) have indicated they need more guidance from the government about
biodiversity reporting, they find it logical if a gradual introduction of mandatory reporting of the
biodiversity impacts of businesses is coming. It therefore is an obvious consequence that a number of
businesses in this research is already preparing for possible future legislation. Until then, Bergsma et
al. (2014) states, businesses will have to be encouraged to voluntarily get biodiversity reporting
started. According to Van Liempd & Busch (2013), the Danish legislature does require businesses to
describe their impact on the external environment and on measures to prevent, reduce or remedy
any damage to the environment in annual report. But because there are no guidelines with regard to
disclosing this information, anything from one sentence to a reference to a full environmental report
will fulfil the law’s requirement. Besides, there are no specific requirements to report explicitly on
biodiversity in the Danish regulation. So in that there are no differences to the Dutch legislation. Van
Liempd & Busch (2013) argue however that organizations like the UN and the EU will have to impose
charters and legislation to promote action before the loss of biodiversity and ecosystem services is
able to reduce human welfare to unacceptable levels. Also in Sweden, the mandatory biodiversity
disclosure requirements for businesses are very limited, Rimmel and Jonäll (2013) state. Biodiversity
disclosures by Swedish businesses are therefore mainly voluntary disclosures, and also this does not
deviate from the Dutch situation.
GRI guidelines
It comes as no surprise that the majority of the businesses are following the GRI guidelines f or
reporting, as since this is a common and widely used method in sustainability reporting (GRI, 2006).
According to Bergsma et al. (2014), GRI gives guidance to report on the impact on biodiversity, but
none of the surveyed businesses used it yet at the time of research. Also Rimmel and Jonäll (2013)
found that businesses see the GRI reporting framework as a facilitator for sustainability reporting, as
the technical protocol and guidance enhance the reporting of specific areas of interest such as
biodiversity disclosure, which develops over time. They also state this is in line with previous
research (Brown et al., 2009; Burritt and Schaltegger, 2010). According to Milne et al. (2009), the GRI
guidelines provide an entity-focused view of sustainable development that enables businesses to
turn sustainable development into actions by integrating it into their business practices.
Nevertheless, some businesses mentioned that the GRI guidelines are too extensive and therefore
not easy to use. This is also emphasized by Moneva et al. (2006), where the GRI indicators are
criticized as being too broad and too de-contextualized. Furthermore, moving on to Integrated
Reporting will currently be a step to far for many Dutch businesses.

77
Benchmarking
The majority of the reporting businesses are participating in a benchmark in some way. But these are
not explicitly focused on biodiversity, as a number of businesses indicate that this theme is not well
represented in benchmarks currently. This is the consequence of the fact that in many sectors not
enough data on biodiversity is reported publicly to benchmark businesses well, states Bergsma et al.
(2014). Bergsma et al. (2014) therefore argue that a first step is the increase of transparency by
businesses. At the same time, Rimmel and Jonäll (2013) point out that according the F&C report (F&C
Asset Management, 2004), which examined the biodiversity risks businesses are exposed to,
biodiversity disclosure is directly relevant to the capital markets’ assessment of businesses’ value.
Reasons for biodiversity reporting
There are several reasons mentioned by the businesses to (not) report about biodiversity. A
frequently mentioned motive is that the business wants to keep a good reputation, and therefore
deals with social responsibility and the public opinion. KPMG (2012) also states that there is
increasing pressure on businesses by the public opinion and consumer behaviour to reduce their
impact on biodiversity and ecosystems. Respondents in the research of Rimmel and Jonäll (2013)
have also made statements about the necessity of responding to future changes in order to protect
the businesses’ good reputations. Grabsch et al. (2010) pointed out that biodiversity disclosure is a
way to demonstrate care for stakeholders, as businesses have responsibilities to different
stakeholder groups: the general public, shareholders and employees. Some of the businesses in this
study however, argued that they don’t report on biodiversity (extensively) for the reason that their
stakeholders are not asking for information on biodiversity. Most businesses do mention that licence
to operate is important, Bergsma et al. (2014) indicate that businesses that are frontrunners do so
because of explicit licence to operate issues, but many other businesses apparently consider
transparency on biodiversity as less important with respect to their licence to operate. In the light of
this, many studies refer to legitimacy theory (Deegan, 2002), accountability theory (Gray et al., 1996)
or risk management theory (Bebbington et al., 2008). These theories suggest that if biodiversity is a
concern for businesses and their stakeholders, businesses should also re port to their stakeholders on
biodiversity issues. Also, businesses that use sustainability disclosure, may be responding to threats
to their legitimacy sequential to their environmental behaviour (Bebbington et al., 2008; Milne et al.,
2009). Furthermore, businesses are expected to provide more information because of societal
pressure according to legitimacy theory, as indicated by Patten (2002). Accountability theory (Gray et
al., 1995) suggests businesses are accountable to their stakeholders on economic, social and
environmental performance. Van Liempd & Busch (2013) argue that businesses are not only
accountable to present stakeholders, but also accountable to future generations. They thereby
indicate the definition of sustainable development from the Brundtland report: “development that
meets the needs of the present without compromising the ability of future generations to meet their
own needs” (WCED, 1987). This point relates to the motive some of the businesses in this study
mentioned for reporting on biodiversity, which is continuity. As for example resources are becoming
scarce, businesses have to anticipate to this to secure the continuity of their business activities, again
customer demand plays a role here as more often customers want sustainable products. The same is
argued by Jones (1996), businesses are morally accountable to their stakeholders at the very least,
and arguably to society for the natural assets that they own and for the actions that they take that
have an impact on the environment. Jones (1996) also states that good environmental practice is
good business practice, environmental pressures should be seen as opportunities for businesses, and
78
a business attitude to the environment as benchmark of its commitment to innovation and good
management. According to Jones (1996), those businesses that set the pace on environmental issues
will be seen as the leaders of the corporate sector. That is exactly what some businesses in this study
indicated they want to accomplish, they want to stay ahead of their competitors by anticipating to
risks and make biodiversity an opportunity for innovation. This leads to risk management theory
(Bebbington et al., 2008), which suggests businesses should report to their stakeholders on the
environmental risks the business is exposed to. This theory is endorsed by Van Liempd & Busch
(2013) who argue that businesses should be transparent and report on how they manage and
diminish exposure to these risks. Rimmel and Jonäll (2013) also found that businesses in their study
understand and acknowledge the risk component of biodiversity , and that the financially-related
aspect of biodiversity management can facilitate the business’ interest in biodiversity in order to
reduce potential future costs and liabilities. On the other side, Rimmel and Jonäll (2013) argue that
ecological disasters, corporate reputational damage and financial losses may not necessarily lead to
improved biodiversity stewardship. Van Liempd & Busch (2013) mention for example, a global beer
business addresses the issue of water scarcity, but only with respect to risk management in that “a
continuous supply of affordable water is a key prerequisite for the business ambition to be t he
fastest growing global beer brewer”. This issue is also reflected in the commentary of some of the
businesses in this study, as for some of them biodiversity is not a material issue, it is not a priority of
the business and is therefore not part of the business strategy. Biodiversity is then more seen as a
constraint which brings extra costs. McWilliams and Siegel (2001) state however, that there is some
level of CSR that will maximize profits while satisfying the demands for CSR from multiple
stakeholders. Another reason that a few businesses mention for not reporting on biodiversity, is that
it is currently too early to report on biodiversity because they don’t have enough information to
report on yet. The same argument was found by the study of Bergsma et al. (2014). Another
argument that is often mentioned is that information about biodiversity is difficult to collect,
biodiversity is hard to quantify and therefore not easy to report on. CLM/LNV (2010) agrees upon the
fact that for biodiversity no simple indicators for reporting exist (yet). Rimmel and Jonäll (2013) also
indicate that respondents in their study argue that information on biodiversity disclosure might be
difficult to collect because their environmental systems are quite different from their accounting
information systems. Furthermore, Van Liempd & Busch (2013) point out that measurement and
quantification, including valuation, are very difficult for non-financial information, including
biodiversity and ecosystem metrics and measures.
Stakeholders – NGO’s
As mentioned before, for businesses stakeholders are an important reason to report about
biodiversity. A large part of the businesses in this study mentioned that NGO’s are (one of) their most
important stakeholders in relation to managing biodiversity. A large portion of these businesses has
already formed a partnership with an NGO, or is willing to do this in the future. Bergsma et al. (2014)
indicate that partnerships between NGO’s and businesses highlight the benefits of reducing the
biodiversity footprint. Also Van Liempd & Busch (2013) argue that businesses should build
relationships with NGO’s on biodiversity issues, in order that the business’ vision and mission will
include relevant and material issues. Furthermore, as Van Liempd & Busch (2013) argue, businesses
should report on this social engagement, any partnerships formed and other stakeholder initiatives.
Rimmel and Jonäll (2013) indicate that the infrequency of interaction with pressure groups (including
NGO’s) may be a reason for the low level of biodiversity disclosure.

79
Limitations and improvements
The most often mentioned limitation concerning biodiversity reporting by businesses in this study, is
that biodiversity is difficult to measure and methods for this are lacking. This was already pointed out
by Hammond et al. (1995), who remark that if each country is using different indicators or
methodologies, opportunities for countries to cooperate to solve global or continent -wide
environmental issues may be missed. Hammond et al. (1995) therefore argue that consensus on
which indicators to develop and which methodologies to use must be reached. In the meantime,
initiatives like GRI and TEEB have been developed, but as Van Liempd & Busch (2013) argue, more
theoretical research is needed. Van Liempd & Busch (2013) explain that because accountants are no
experts in biodiversity, standard setters should collaborate with scientists like ecologists, in order to
collectively develop reporting categories for biodiversity. This is in line with the statements of some
of the businesses in this study, which indicated that the existing indicators for biodiversity reporting
are too complicated. However, Jones and Solomon (2013) argue that for the time being, it might be
better to account poorly or inadequately for biodiversity than not to account at all. They explain that
if accounting for biodiversity evolves the understanding of biodiversity, changes behaviour of
businesses, acts as a call to action and raises awareness of the extinction of flora and fauna, then any
form of accounting for biodiversity, however inaccurate is better than no reporting. Some of the
businesses in this study indicated that the concept biodiversity is still quite vague, and therefore
difficult to integrate in their business strategies and then report about it. Rimmel and Jonäll (2013)
also found that biodiversity disclosure is a very new issue for businesses, and therefore it appears
that businesses have not developed a clear strategy for providing biodiversity disclosure in their
external reports. Furthermore, Rimmel and Jonäll (2013) even state that the term sustainability is
vaguely used in corporate disclosures. Also Milne et al. (2009) showed that businesses might take a
narrow economic and instrumental approach to the environment. According to most of the
businesses in this study, this might be improved by the development of an adequate method for
measuring and reporting biodiversity. CLM/LNV (2010) also emphasize the importance of good
instruments to analyse and concretize the relationship between the business and biodiversity, whi ch
makes it able to report about biodiversity.
6.2 Reflection on theoretical framework
The concept of biodiversity is generally seen as a part of Corporate Social Responsibility (CSR), CSR is
therefore taken as the basis of the theoretical framework of this study. The disadvantage of the
concept CSR is the generality which comprises it. CSR contains so many different subjects, it gives
businesses the freedom, and at the same time forces them to choose which topics they pay attention
to. As CLM/LNV (2010) states, biodiversity is one of many sustainability issues, and may be included
as part of the CSR policy of a business. And because biodiversity is often still seen as an unclear
theme, businesses are less inclined to pay attention to this, or are confusing it with other, related
topics. This is in line with what Jones and Solomon (2013) argue, namely that the term biodiversity
might be a problem in itself because it is not immediately understandable, it sounds scientific and
does not carry the concept of accountability for species and wildlife or the urgency of species
extinction. Biodiversity is also often grouped under the concept sustainability. Bergsma et al. (2014)
have also indicated that it is not always clear what exactly is understood by sustainabil ity, and what
targets within this are aimed at conserving biodiversity. Also Jones (1996) indicated that sustainable
development remains a confused topic, with many latent contradictions. During the interviews
80
conducted in this study, it often happened that when talking about biodiversity, the answers of the
businesses were actually about different or more general issues of CSR, or sustainability.
Furthermore, as CLM/LNV (2010) pointed out, three dimensions of sustainability are distinguished:
people (social aspects) planet (environmental issues and natural resources) and benefits (economic
aspects). Often the focus is on only one of the dimensions. If the focus is on 'planet', then it is often
referred to as 'green production’. Thereby it is often implicitly assumed that what is produced
sustainably, is also good for biodiversity. The latter can however, not (yet) be supported by hard
data, as Bergsma et al. (2014) argue. Also, an interesting question is if CSR is actually leading to
significant changes and reduction of social and / or environmental impact. Or, as Laufer (2003)
argues, 'greenwashing' could take place, in which businesses mainly talk about their intentions but
where real improvements remain absent. However, the activities that businesses rank as CSR are of
large diversity, also the concrete actions that businesses undertake vary widely, according to Burg
and Overbeek (2012). CSR is therefore a less suitable concept to use when information about
specifically biodiversity is desirable. Some of the questions for the interviews might have been too
general in that sense, because these also were formulated on the basis of the subject CSR. The
questions that were specifically on biodiversity, provided a lot of useful information though, because
the answers often show how much knowledge a business has of biodiversity or to what level actions
and/or reporting on biodiversity is implemented in the business.
The exploration of the relationship that businesses have with biodiversity, was useful in order to
understand the interest that businesses have in acting on their impact on biodiversity. Also, to get to
know where reporting concerning biodiversity should be about according to these businesses. As
CLM/LNV (2010) pointed out that especially businesses that rely on ecosystem services
(pharmaceutical businesses, food industry and retail) or that have a major impact on their
environment (oil and gas) tend to give more attention to biodiversity in their reporting. The GRI
guidelines form an important and useful element here, because one section of these guidelines are
focussed specifically on the subject biodiversity concerning reporting. Since its inception in 1999, the
GRI has become a normative framework for sustainability reporting, according to Brown et al. (2009).
Also the fact that GRI is seen as a facilitator for biodiversity is in line with previous research ( Brown
et al., 2009; Burritt and Schaltegger, 2010). Subsequently the theory explains that the way or form of
reporting, is very important to make information in the reports clear and comparable. To test these
features within the existing business reports, this study made use of coding categories for
biodiversity, derived from the existing literature and GRI indicators developed by Grabsch et al.
(2011). These coding categories, divided into biodiversity elements, made it possible to investigate
reports into detail for their content on these biodiversity elements, and to compare the data of all
businesses with each other. This coding was a good guide and gave lots of information about
biodiversity reporting levels. Yet, often it turned out to be hard to divide information from reports
into the categories/elements, because of the variation and indistinctness in the way of reporting
about biodiversity. Information on biodiversity was often not explicit, not measurable, only
superficial and therefore hard to decide if it suffices to a certain category. However, this rather says
something about the state of biodiversity reporting than it does about the used coding. Therefore,
the use of this coding provided this study a proper foundation for the investigation of business
reports.

81
6.3 Reflection on methodology The used methodology of this research contained a number of limitations. First, the number of
business reports that was investigated, is a substantial contribution for demonstrating the state of
biodiversity reporting by businesses in the Netherlands. But this number doesn’t cover the total of all
Dutch businesses, as there are so many. Besides that, the composition of the selected businesses is
very diverse, which makes it difficult to compare them. Furthermore, some sectors were
underrepresented in this study. The choice to pick the top 50 largest businesses made it possible to
get an insight in the state of biodiversity reporting, by businesses that have a lot of influence of
themselves because of their size and international operations. It can also be very interesting to
investigate businesses from the same sector and to compare them for their biodiversity reporting
performance, which is recommended for further research.
Furthermore, the number of interviewees may also be questioned. Only about one fifth of all
businesses in this research, were interviewed to obtain background information. Thi s small number is
due to limitation of time, but also because most of the businesses were not willing to give an
interview, or gave no response at all to the request. However, this study had an exploratory
character and was meant to provide an overview of biodiversity reporting by making a cross section
of the different large Dutch businesses. This has provided a lot of information about the various and
corresponding underlying motivations of businesses concerning biodiversity reporting. Nevertheless,
future research could possibly take a closer look at more businesses from the same sector, including
smaller businesses. Comparing the motivations for biodiversity reporting of different sectors with
each other is then possible, which helps to understand the barriers within specific sectors better.
The interviews were conducted on the basis of pre-defined, open questions. In many cases, the
interviewees gave comprehensive and detailed answers, which provided extensive but also a lot of
non-relevant information. The many different answers and perspectives, made it hard and time
consuming to process these results. Also, because of the open structure of the questions, often
relevant information came up during other questions than was meant in advance. This would have
been hard to avoid in this study, because of its explorative character. For further research however,
well formulated, delimited questions focused on biodiversity reporting are recommended to use in
interviews, in order to reduce the time that is needed to process the information.
Despite of the limitations, this exploratory research did derive some valuable information to provide
an analysis of the current state of biodiversity reporting by Dutch businesses, which was unclear until
so far. The results provide interesting insights which invite to examine their state again in a few years
from now, in order to analyse if the situation around biodiversity reporting has improved.
82
7 Conclusions
Research concerning the degree and quality in which Dutch businesses report on biodiversity, and
their motivation behind this way of reporting, have not been carried out so far. This exploratory
study had the objective to provide an overview of the state of biodiversity reporting by Dutch
businesses. The following conclusions were derived from this study:
Of the 50 businesses that were part of this research, 35 (70%) mentioned ‘biodiversity’ at least once
in (one or more of) their published reports in the period 2010 to 2014. This result seems rather
positive, as can be concluded that the majority of businesses reported about biodiversity. However,
the extent to which biodiversity is addressed in the reports varies greatly. Additionally, 23 of the
businesses (46%) mentioned biodiversity on their website at the time of research. Every year, there
are different businesses that (did not) report(ed) about biodiversity, which indicates that some
businesses are not consequent in their reporting about biodiversity . Although there has been an
increase in the amount of businesses reporting about biodiversity, on average it appears that only
slightly more than half of the businesses reported on biodiversity in the years 2010 to 2014.
It varies a lot between different sectors how many businesses report on biodiversity, the Financial
services sector scores the lowest and the Raw material extractions sector the highest. Despite the
fact that the number of businesses within the red biodiversity risk zone that reported on biodiversity
increased from 2010 to 2014, with respect to the amber and green zones which decreased, these
differences are statistically not significant. Moreover, seen over the five years, there are
approximately equal numbers of businesses in each zone which did not report at all on the subject of
biodiversity. Still, mainly businesses in the red zone have biodiversity related content on their
websites, the amber and green zone do to a lesser extent.
Concerning the amount of biodiversity information disclosed in reports, the differences are also quite
large. Some businesses only report on one category element and some stand out with 13 elements,
the highest score was found for the business Esso. The majority of the reports in the investigated
period contain 1 to 7 category elements, only a small part of the reports 8 to 14 different elements.
On average, businesses applied 3 category elements per year, per report. Despite an increase of the
application of category elements in business reports of up to almost the double, no significant
difference was found in the number of biodiversity disclosures between the years 2010 to 2014.
The biodiversity category elements that are disclosed most often in the business reports are
‘Stakeholder engagement’, ‘GRI’, and ‘Partnerships’. These can be considered as most easy to report
on for businesses, as most businesses are able to mention something about these subjects . Least
disclosed elements are ‘Awards’, ‘BAP’, ‘Surveys’ and ‘ Biodiversity Officer’ , these subjects are only
applicable for more advanced businesses with regard to biodiversity reporting. Most elements
showed an increase in application during the five years, though 8 elements show a decrease the last
two years. Although the GRI indicators are often the inducement or starting point of biodiversi ty
reporting, the element ‘GRI’ in particular shows a large decline in application through the years. The
overall biodiversity related information in the investigated reports, is of superficial nature. Most
reports mentioned some category related information, but without any further details on measures
or quantitative information.
83
The businesses all have different motivations to report on biodiversity. This is due to the very
different business types, which makes that the relationship with biodiversity is stronger or weaker,
and therefore also the urgency for reporting about it. Reasons to report about biodiversity that were
often indicated by most businesses are the importance of continuity of the business (and related
reliance on fossil materials, and the origin, sustainability and quality of resources), agreements within
partnerships with NGO’s, the need for transparency towards stakeholders and the notion that
biodiversity can lead to product innovation / development. Some of the businesses also mentioned
staying ahead of competitors, social responsibility, reputational risk, licence to operate and following
of the GRI guidelines are key drivers. Staying ahead of future legislation, meeting customer demands,
or that biodiversity is a part of the business strategy or policy, are for just a few businesses reasons
to report about biodiversity.
Businesses that do not report about biodiversity, also have a variety of reasons not to do so. So me of
them deliberately choose not to report, because the business for example is not obliged to bring out
reports, or biodiversity reporting is not legally required. Other reasons not to report are the costs of
it in time and money, the indirect relationship with biodiversity, responsibility lies with suppliers, the
issue is covered within certifications, or it is not a material issue (according to stakeholders). Some
other businesses want to report on biodiversity but cannot (yet) do this, as they are currently
investigating their impact on biodiversity, or their CSR policy is not yet suitable to be reported. A few
businesses indicate they are limited by the complexity of GRI indicators that are too extensive.
However, the biggest limitation seems to be the fact that biodiversity cannot be quantified, it is hard
to measure. Many of the businesses indicate that collecting ecological data is difficult, indicators and
measuring methods for biodiversity are considered too complex.
The businesses have several suggestions to make biodiversity reporting easier and more accessible
for businesses. The most important of these, and starting point would be the development of usable,
simple methods for measuring and reporting biodiversity. Some businesses indicate this could
possibly be based on the No Net Loss principle, with taking the whole supply chain into account.
Formulating biodiversity action plans and measures are important according to some of the
businesses. The majority of the businesses is interested in collaborating with NGO’s in order to put all
this into operation. A few businesses argue that the government should be setting regulations to
make biodiversity reporting more common, some others think biodiversity should be better
represented in benchmarks. It was mentioned once that new technologies such as apps on product
level, could help making the communication of information on biodiversity more easy.
To answer the central question of this research, it is shown that the number of Dutch businesses that
is reporting on biodiversity, despite some growth in a few years, is still inadequate. Furthermore, the
quantity of biodiversity disclosures increased, but the quality is generally poor, apart from a few
exceptions. The businesses that do report on biodiversity have a lot of different reasons for it, but in
general businesses are mainly led by their stakeholders, continuity of the business and transparency
in relation to responsibility and reputation. Motivations to not report on biodiversity are mainly
related to the (indirect) relationship with biodiversity, low materiality of the issue and the
impossibility or complexity of quantifying biodiversity. The latter implies that for a large part of the
businesses there is mainly a practical reason for not reporting on biodiversity, the will to report is not
necessarily lacking. This research therefore shows that biodiversity reporting by Dutch businesses is

84
generally poor, but can be improved by the development of methods that will help make biodiversity
reporting more accessible for businesses.

85
References
Abeysekera, I. (2013). "A template for integrated reporting", Journal of Intellectual Capital, Vol. 14
Iss 2 pp. 227 – 245.
Altrichter, H., Feldman, A., Posch, P. & Somekh, B. (2008). “Teachers investigate their work; An
introduction to action research across the professions”. Routledge. p. 147. (2nd edition).
Arena, M., Conte, A., Melacini, M. (2015). “Linking environmental accounting to reward systems: the
case of the Environmental Profit and Loss Account”. Journal of Cleaner Production, 1 December
2015, Vol.108, pp.625-636.
Baxter L. A., Babbie E. (2003). “The basics of communication research”. Boston, MA: Wadsworth.
Bebbington, J., Brown, J., Frame, B. (2007). “Accounting technologies and sustainability assessment
models. Ecological Economics”. 2007, Vol.61(2), pp.224-236.
Bebbington, J., Larrinaga, C. and Moneva, J.M. (2008). “Corporate social reporting and reputation
risk management”. Accounting, Auditing & Accountability Journal, Vol. 21 No. 3, pp. 337-361.
Berg, B.L., Lune, H. (2012). “Qualitative research methods for the social sciences”. Boston.
Bergsma, G.C., Odegard, I.Y.R., de Bie, S., Head, M.E., Croezen, H.J. (2014). “Benchmark Biodiversiteit
– De impact op biodiversiteit van Nederlandse sectoren en bedrijven”. Delft, CE Delft, mei 2014.
Blowfield, M., Frynas, J.G. (2005). “Setting New Agendas: Critical Perspectives on Corporate Social
Responsibility in the Developing World”. International Affairs (Royal Institute of International Affairs
1944-), 1 May 2005, Vol.81(3), pp.499-513.
Bosman, R., Loorbach, D., van Raak, R., Wijsman, K. (2013). “Bedrijven en Biodiversiteit – Transitie-
perspectief vanuit de Community of Practice Bedrijven en biodiversiteit”. Dutch Research Institute
For Transitions, commissioned by Agentschap NL.
Braam, G.J.M. , Uit de Weerd, L., Hauck, M., Huijbregts, M.A.J. (2016). “Determinants of corporate
environmental reporting: the importance of environmental performance and assurance ”. Journal of
Cleaner Production, 15 August 2016, Vol.129, pp.724-734.
Brown, H.S., de Jong, M. and Lessidrenska, T. (2009). “The rise of the global reporting initiative:
a case of institutional entrepreneurship”. Environmental Politics, Vol. 18 No. 2, pp. 182-200.
Bryman, A. (2008). “Social Research Methods”. 3rd edition. Oxford: Oxford University Press.
Bryman, A. (2012). “Social Research Methods”. 4th Edition. Oxford University Press.
86
Burg, S.W.K. van den., Overbeek, M.M.M. (2012). “Bedrijven, natuur & biodiversiteit : een
ketenperspectief op de rol van private partijen”. Nota / LEI - Natuurlijke hulpbronnen32453390X Nr.
12-017. Den Haag, NL: LEI Wageningen UR.
Burritt, R.L. and Schaltegger, S. (2010). “Sustainability accounting and reporting: fad or trend?”.
Accounting, Auditing & Accountability Journal, Vol. 23 No. 7, pp. 829-846.
Campbell, D.J. (2000). “Legitimacy theory or managerial reality construction? Corporate social
disclosure in Marks & Spencer plc corporate reports, 1969‐1997”. Accounting Forum, Vol. 24 No. 1.
CBD (2010a). “The Strategic Plan for Biodiversity 2011–2020 and the Aichi Biodiversity Targets”.
Decision adopted by the conference of the parties to the convention on biological diversity at its
tenth meeting.
CBD (2010). “Secretariat of the Convention on Biological Diversity”. Global Biodiversity Outlook 3.
Montréal, 94 pages.
Christofi, A., Christofi, P., Sisaye, S. (2012). "Corporate sustainability: historical development and
reporting practices". Management Research Review, Vol. 35 Iss: 2, pp.157 – 172.
CLM/LNV (2010). “B4B: Business for Biodiversity - Nieuwe impulsen voor biodiversiteit vanuit het
bedrijfsleven. Advies in opdracht van het LNV Platform Kennis en Samenleving”. Centrum voor
Milieuwetenschappen Leiden (CML), Culemborg.
Collen, B., Whitton, F., Dyer, E., Baillie, J.E.M., Cumberlidge, N., Darwall, W.R.T., Pollock, C., Richman,
N.I., Souldby, A-M., Bohm, M. (2014). “Global patterns of freshwater species diversity, threat and
endemism”. Global Ecology and Biogeography 23: 40-51.
Creswell, J.W. (2003). “Research design: Qualitative, quantitative, and mixed method approaches”.
2nd ed. Sage Publications, Inc.
Creswell, J.W., Klassen, A.C., Plano Clark, V.L., & Smith, K.C. (2011). “Best practices for mixed
methods research in the health sciences”. Bethesda, MD: National Institutes of Health, Office of
Behavioral and Social Sciences Research. National Institutes of Health, 2011, pp. 39.
Deegan, C. (2002). “The legitimising effect of social and environmental disclosures – a theoretical
Foundation”. Accounting, Auditing & Accountability Journal, Vol. 15 No. 3, pp. 282-311.
Denzin, N. K. (1970). “The Research Act in Sociology”. Chicago: Aldine.
EC (2011). “Our life insurance, our natural capital: an EU biodiversity strategy to 2020”.
Communication from the commission to the European Parliament, the council, the European
economic and social committee and the committee of the regions. European Commission Brussels,
2011.

87
Eccles, R.G., Saltzman, D. (2011). “Achieving Sustainability Through Integrated Reporting”. Stanford
Social Innovation Review. Leland Stanford Jr. University.
Eisenhardt, K.M., Graebner, M.E. (2007). “Theory Building from Cases: Opportunities and
Challenges”. The Academy of Management Journal, 1 February 2007, Vol.50(1), pp.25-32.
Ernst & Young (2010). “Duurzaamheid in de Aanbieding. Kansen voor maatschappelijk verantwoord
ondernemen voor retailers en leveranciers”.
F&C Asset Management (2004). “Is biodiversity a material risk for companies? An assessment of
the exposure of FTSE sectors to biodiversity risk”. F&C Asset Management, London.
Freeman, R.E. (1984). “Strategic management: a stakeholder approach”. Cambridge/Massachusetts
1984, p. 25.
Grabsch, C., Jones, M.J. and Solomon, J.F. (2011). “Accounting for biodiversity in crisis: a European
perspective”. Paper presented at 34th EAA Annual Congress, Rome, Italy, 20-22 April.
Gray, R., Owen, D. and Adams, C. (1996). “Accounting and Accountability: Changes and Challenges
in Corporate Social and Environmental Reporting”. Prentice Hall, Hemel Hempstead.
GRI (2006). “Richtlijnen voor duurzaamheidsverslaggeving”. Global Reporting Initiative, Amsterdam.
GRI (2007). “Biodiversity – A GRI reporting Resource”. Global Reporting Initiative, 2007.
GRI (2011a). “Approach for reporting on ecosystem services. Incorporating ecosystem services into
an organization’s performance disclosure”. Amsterdam: The Global Reporting Initiative.
GRI (2011b). “Indicator Protocols Set Environment (EN)”. Version 3.1. GRI 2000-2011.
Guthrie, J., Petty, R., Yongvanich, K., Ricceri, F. (2004). “Using content analysis as a research method
to inquire into intellectual capital reporting”. Journal of Intellectual Capital, 2004, Vol.5(2), p.282-
293.
Hammond, A., Adriaanse, A., Rodenburg, E., Bryant, D., Woodward, R. (1995). “Environmental
indicators: A systematic approach to measuring and reporting on environmental policy performance
in the context of sustainable development”. Fuel and Energy Abstracts, 1995, Vol.36(6), pp.460-460.
Hoevenagel, R. (2004). “Maatschappelijk verantwoord ondernemen in het midden- en kleinbedrijf”.
Programmaonderzoek MKB en Ondernemerschap, Zoetermeer.
IIRC (2013). “The international Integrated Reporting (IR) Framework”. The International Integrated
Reporting Council, 2013.

88
Isaksson, L., Kiessling, T., Harvey, M. (2014). “Corporate social responsibility: Why bother?”
Organizational Dynamics, 2014, Vol.43(1), pp.64-72
IUCN (2014). Van Beek, P., Simons, H. “Brochure Rode Lijst”. Consulted on website www. IUCN.nl
November 2014.
Jennings, G. (2001). “Tourism Research”. Milton, Qld: John Wiley & Sons Australia, Ltd.
Jones, M.J. (1996). “Accounting for biodiversity, a pilot study”. The British Accounting Review, 1996,
Vol.28(4), pp.281-303.
Jones, M.J. (2003). "Accounting for biodiversity: operationalising environmental accounting".
Accounting, Auditing & Accountability Journal, Vol. 16 Iss 5 pp. 762 – 789.
Jones, M.J., Solomon, J.F. (2013). "Problematising accounting for biodiversity", Accounting, Auditing
& Accountability Journal, Vol. 26 Iss: 5, pp.668 – 687.
Kamphuis, B.M., Arets, E.J.M.M., Verwer, C.C., van den Berg, J., van Berkum, S., Harms, B. (2011).
“Dutch trade and biodiversity; Biodiversity and socio-economic impacts of Dutch trade in soya, palm
oil and timber.” Rapport 2011-013, LEI, Den Haag.
Kaptein, M., van Tulder, R. (2002). “Noodzaak van en eisen aan stakeholderdialoog”. Civis Mundi 41-
1, januari 2002, p.22-28.
Kolk, A. (2003). “Het eind van maatschappelijk verantwoord ondernemen, of het begin?” Vossiuspers
UvA, Amsterdam, 2003.
Kolk, A. (2004). “MVO vanuit bedrijfskundig en beleidsmatig perspectief: het belang van duurzaam
management”. UvA: Universiteitsbibliotheek.
Kothari, C.R. (2004). “Research Methodology: Methods and Techniques”. New Age International (P)
Ltd., Publishers.
KPMG (2011). “KPMG International Survey of Corporate Responsibility Reporting 2011”. KPMG
International Cooperative, 2011.
KPMG (2012). “TEEB voor het Nederlandse bedrijfsleven : The Economics of Ecosystems &
Biodiversity”. KPMG Advisory, Amsterdam, 2012.
KPMG (2013). “The KPMG Survey of Corporate Social Responsibility Reporting 2013”. KPMG
International Cooperative, 2013.
Krippendorff, K. (1990). “Content Analysis: An Introduction to Its Methodology”. The Sage CommText
Series, Sage, Beverly Hills, CA.

89
Landrum, B., Garza, G. (2015). “Mending Fences: Defining the Domains and Approaches of
Quantitative and Qualitative Research”. Qualitative Psychology, 2015, Vol.2(2), pp.199-209.
Laufer, W.S. (2003). “Social Accountability and Corporate Greenwashing”. Journal of Business Ethics
43, pp. 253-261.
Lenzen, M., Moran, D., Kanemoto, K., Foran, B., Lobefaro, L. and A. Geschke. (2012). “International
trade drives biodiversity threats in developing nations”. Nature 486: 109-112.
MA (2005). “Millennium Ecosystem Assessment - Synthesis Report”. 2005.
Makower, J. and GreenBiz.com (2011). “State of Green Business 2011”. GreenBiz Group, Oakland, CA.
McKinsey (2010). “The next environmental issue for business: McKinsey Global Survey Results”.
McKinsey & Company, www.mckinseyquarterly.com.
McWilliams, A., Siegel, D. (2001). “Corporate Social Responsibility: A Theory of the Firm Perspective”.
The Academy of Management Review 26, 2001. 1: pp. 117-127.
MEA (2005). “Ecosystems and Human Well-being: Biodiversity Synthesis”. Millennium Ecosystem
Assessment World Resources Institute, Washington, DC.
Milne, M.J., Tregidga, H. and Walton, S. (2009). “Words not actions! The ideological role of
sustainable development reporting”. Accounting, Auditing & Accountability Journal,
Vol. 22 No. 8, pp. 1211-1257.
Moneva, J.M., Archel, P. and Correa, C. (2006). “GRI and the camouflaging of corporate
unsustainability”. Accounting Forum, Vol. 30 No. 2, pp. 121-137.
Newton, T., Harte, G. (1997). “Green business: technicist kitsch?”. Journal of Management Studies
Vol. 34 No. 1, pp. 75-98.
NBA (2011). “Transparantiebenchmark 2010. Nederland onderneemt beter”. Ministerie van
Economische Zaken, Landbouw en Innovatie.
NBA (2013). “Integrated reporting; het rapportagemodel van de toekomst! Visiedocument NBA over
de weg ernaar toe en de rol van het accountantsberoep”. Nederlandse Beroepsorganisatie van
Accountants.
NCW (2000). “Duurzaam ondernemen in een wereldeconomie”. Vereniging NCW, 2000.
Overbeek, G., Harms, B., van den Burg, S. (2012a). “Biodiversiteit komt op de agenda van bedrijven”.
Milieu – Dossier, juli 2012 nr 4: 55-58.

90
Overbeek, G., Harms, B., van den Burg, S. (2012b). “Internationale bedrijven duurzaam aan de slag
met natuur en biodiversiteit”. Voorstudie bij de Balans van de Leefomgeving 2012. Wageningen,
Wettelijke Onderzoekstaken Natuur & Milieu, WOt-werkdocument 274. 56 blz.
Parr, M., Simons, H. (2007). “Business & Biodiversity, a guide for Netherlands based enterprises
operating internationally”. IUCN, Amsterdam.
Patten, D.M. (2002), “The relation between environmental performance and environmental
disclosure: a research note”. Accounting, Organizations and Society, Vol. 27 No. 8, pp. 763-773.
PBL (2014a). “Biodiversiteit bekeken: hoe evalueert en verkent het PBL het natuurbeleid?”.
Planbureau voor de Leefomgeving, Den Haag.
PBL (2014b). “How sectors can contribute to sustainable use and conservation of biodiversity”. CBD
Technical Series No 79. PBL Netherlands Environmental Assessment Agency. The Hague, 2014.
PWC (2008). “PricewaterhouseCoopers Analysis for TEEB”. PricewaterhouseCoopers, London.
PWC (2010). “PricewaterhouseCoopers 13th Annual Global CEO Survey 2010”.
PWC (2011). “14th Annual Global CEO Survey”. PricewaterhouseCoopers, London.
Rimmel, G., Jonäll, K. (2013). “Biodiversity reporting in Sweden: corporate disclosure and preparers'
views”. Accounting, Auditing & Accountability Journal, 2013, Vol.26(5), p.746-778.
Rio Tinto (2012). “Rio Tinto and biodiversity – Working towards Net Positive Impact”. 2012.
RTRS (2010). “Principles and Criteria for Responsible Soy, Version 1.0”. Round Table on Responsible
Soy Association.
Sabeti, H. (2011). “The For-Benefit Enterprise”. Harvard Business Review, Nov 2011, Vol.89(11),
pp.98-104.
Schrijvers , E. K. (2004). “Lessen uit corporate governance en maatschappelijk verantwoord
ondernemen”. Webpublicatie NR 3. Wetenschappelijke Raad voor het Regeringsbeleid, Den Haag.
SER (2000). “De winst van waarden. Advies over maatschappelijk ondernemen”. Sociaal Economische
Raad – Den Haag.
Taskforce Biodiversiteit & natuurlijke hulpbronnen (2011).”Groene Groei – investeren in
biodiversiteit en natuurlijke hulpbronnen”. NL: Taskforce Biodiversiteit en Natuurlijke Hulpbronnen.
TEEB (2008). “The Economics of Ecosystems and Biodiversity – An Interim Report”. European
Communities 2008.

91
TEEB (2010). “The Economics of Ecosystems and Biodiversity for Business – Executive Summary
2010”.
Thomas, D.R. (2006). “A general inductive approach for analysing qualitative evaluation data”.
American Journal of Evaluation, 2006, Vol.27.
Van Liempd, D., Busch, J. (2013). "Biodiversity reporting in Denmark", Accounting, Auditing &
Accountability Journal, Vol. 26 Iss 5 pp. 833 – 872.
Van Tulder, R., Bleijenbergh, M., Danse, M., Wiersinga, R., Torppe, M. (2009). “CSR business models
and change trajectories in the retail industry – a Dynamic Benchmark Exercise (1995-2007)”.
Rotterdam: RSM Erasmus University and Den Haag: LEI Wageningen UR, Report 2009-075.
VBDO (2011). “Stappen in Duurzaamheid – Rapportage aandeelhoudersvergaderingen 2011.
Duurzame ontwikkeling(en) bij 62 Nederlandse beursgenoteerde bedrijven”. Vereniging van
Beleggers voor Duurzame Ontwikkeling, Utrecht.
Webb, E.J., Campbell, D.T., Schwartz, R.D., Sechrest, L. (1966). “Unobtrusive Measures: Nonreactive
Measures in the Social Sciences”. Chicago: Rand McNally.
Wentzel, W.J., Reilly, B.K. and Reilly, Y. (2010). “Measurement and recognition of wildlife in the
financial statements of public sector entities: a South African perspective”. Schaltegger, A. (Ed.),
Environmental Management Accounting, Springer Science, Media B.V., pp. 283‐300.
WBCSD, IUCN, WRI, and Earthwatch (2006) “Ecosystem Challenges and Business Implications”.
World Business Council for Sustainable Development, Geneva.
WCED (1987). “Report of the World Commission on Environment and Development: Our Common
Future”. United Nations, Oxford.
WWF (2012). Living Planet Report 2012. WWF- World Wide Fund For Nature, Switzerland.
WWF (2014). Living Planet Report 2014. WWF- World Wide Fund For Nature, Switzerland.
Yin, R. K. (2003). “Case study research: Design and methods” - third edition. Thousand Oaks, CA:
Sage.
Yin, R.K. (2014). “Case study research: Design and Methods” – Fifth edition. SAGE Publications USA.
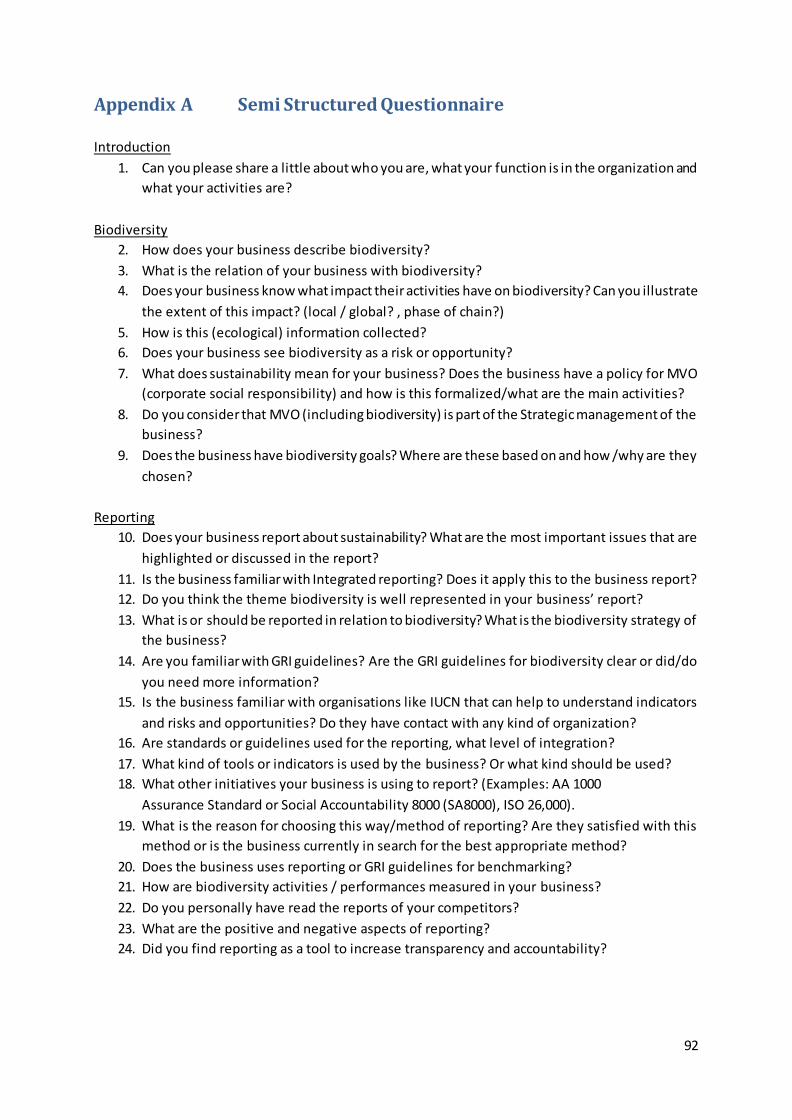
92
Appendix A Semi Structured Questionnaire
Introduction
1. Can you please share a little about who you are, what your function is in the organization and
what your activities are?
Biodiversity
2. How does your business describe biodiversity?
3. What is the relation of your business with biodiversity?
4. Does your business know what impact their activities have on biodiversity? Can you illustrate
the extent of this impact? (local / global? , phase of chain?)
5. How is this (ecological) information collected?
6. Does your business see biodiversity as a risk or opportunity?
7. What does sustainability mean for your business? Does the business have a policy for MVO
(corporate social responsibility) and how is this formalized/what are the main activities?
8. Do you consider that MVO (including biodiversity) is part of the Strategic management of the
business?
9. Does the business have biodiversity goals? Where are these based on and how /why are they
chosen?
Reporting
10. Does your business report about sustainability? What are the most important issues that are
highlighted or discussed in the report?
11. Is the business familiar with Integrated reporting? Does it apply this to the business report?
12. Do you think the theme biodiversity is well represented in your business’ report?
13. What is or should be reported in relation to biodiversity? What is the biodiversity strategy of
the business?
14. Are you familiar with GRI guidelines? Are the GRI guidelines for biodiversity clear or did/do
you need more information?
15. Is the business familiar with organisations like IUCN that can help to understand indicators
and risks and opportunities? Do they have contact with any kind of organization?
16. Are standards or guidelines used for the reporting, what level of integration?
17. What kind of tools or indicators is used by the business? Or what kind should be used?
18. What other initiatives your business is using to report? (Examples: AA 1000
Assurance Standard or Social Accountability 8000 (SA8000), ISO 26,000).
19. What is the reason for choosing this way/method of reporting? Are they satisfied with this
method or is the business currently in search for the best appropriate method?
20. Does the business uses reporting or GRI guidelines for benchmarking?
21. How are biodiversity activities / performances measured in your business?
22. Do you personally have read the reports of your competitors?
23. What are the positive and negative aspects of reporting?
24. Did you find reporting as a tool to increase transparency and accountability?
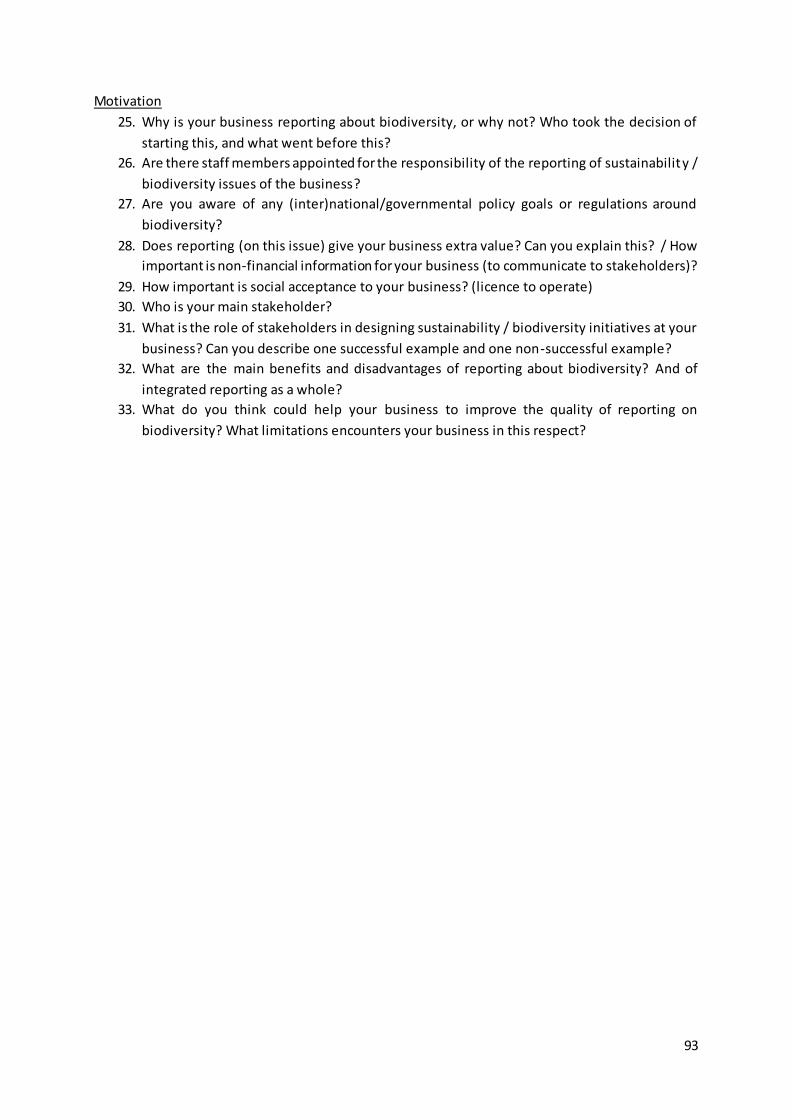
93
Motivation
25. Why is your business reporting about biodiversity, or why not? Who took the decision of
starting this, and what went before this?
26. Are there staff members appointed for the responsibility of the reporting of sustainability /
biodiversity issues of the business?
27. Are you aware of any (inter)national/governmental policy goals or regulations around
biodiversity?
28. Does reporting (on this issue) give your business extra value? Can you explain this? / How
important is non-financial information for your business (to communicate to stakeholders)?
29. How important is social acceptance to your business? (licence to operate)
30. Who is your main stakeholder?
31. What is the role of stakeholders in designing sustainability / biodiversity initiatives at your
business? Can you describe one successful example and one non-successful example?
32. What are the main benefits and disadvantages of reporting about biodiversity? And of
integrated reporting as a whole?
33. What do you think could help your business to improve the quality of reporting on
biodiversity? What limitations encounters your business in this respect?

94
Appendix B Content analysis tables
Table I. Business reporting general information
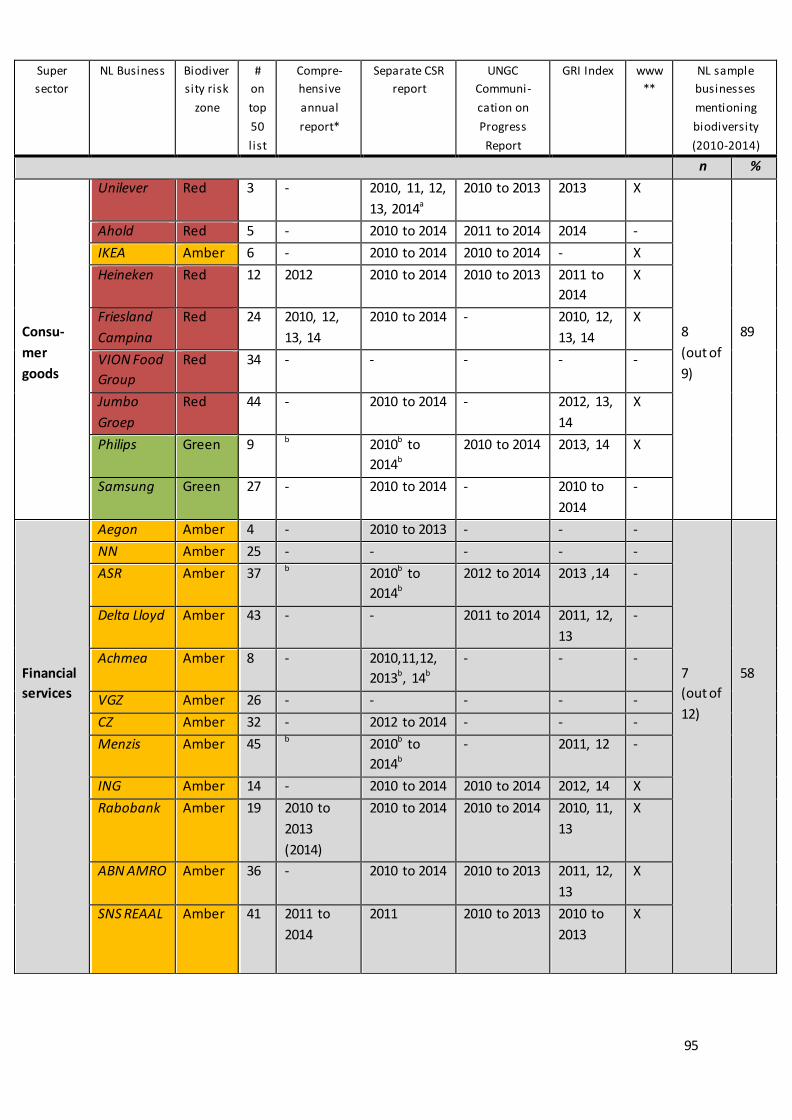
95
Super
sector
NL Business Biodiver
sity risk
zone
#
on
top
50
list
Compre-
hensive
annual
report*
Separate CSR
report
UNGC
Communi-
cation on
Progress
Report
GRI Index
www
**
NL sample
businesses
mentioning
biodiversity
(2010-2014)
n %
Consu-
mer
goods
Unilever Red 3 - 2010, 11, 12,
13, 2014a
2010 to 2013 2013 X
8
(out of
9)
89
Ahold Red 5 - 2010 to 2014 2011 to 2014 2014 -
IKEA Amber 6 - 2010 to 2014 2010 to 2014 - X
Heineken Red 12 2012 2010 to 2014 2010 to 2013 2011 to
2014
X
Friesland
Campina
Red 24 2010, 12,
13, 14
2010 to 2014 - 2010, 12,
13, 14
X
VION Food
Group
Red 34 - - - - -
Jumbo
Groep
Red 44 - 2010 to 2014 - 2012, 13,
14
X
Philips Green 9 b 2010b to
2014b
2010 to 2014 2013, 14 X
Samsung Green 27 - 2010 to 2014 - 2010 to
2014
-
Financial
services
Aegon Amber 4 - 2010 to 2013 - - -
7
(out of
12)
58
NN Amber 25 - - - - -
ASR Amber 37 b 2010b to
2014b
2012 to 2014 2013 ,14 -
Delta Lloyd Amber 43 - - 2011 to 2014 2011, 12,
13
-
Achmea Amber 8 - 2010,11,12,
2013b, 14b
- - -
VGZ Amber 26 - - - - -
CZ Amber 32 - 2012 to 2014 - - -
Menzis Amber 45 b 2010b to
2014b
- 2011, 12 -
ING Amber 14 - 2010 to 2014 2010 to 2014 2012, 14 X
Rabobank Amber 19 2010 to
2013
(2014)
2010 to 2014 2010 to 2014 2010, 11,
13
X
ABN AMRO Amber 36 - 2010 to 2014 2010 to 2013 2011, 12,
13
X
SNS REAAL Amber 41 2011 to
2014
2011 2010 to 2013 2010 to
2013
X

96
Super
sector
NL Business Biodiver-
sity risk
zone
#
on
top
50
list
Compre-
hensive
annual
report*
Separate CSR
report
UNGC
Communicatio
n on Progress
Report
GRI Index
www
**
NL sample
businesses
mentioning
biodiversity
(2010-2014)
n %
Raw
material
extrac-
tion
Shell Red 1
2010 to
2014
2010 to 2014 2010 to 2014 2014 X
6
(out of
8)
75
Vitol Red 2 - 2014 - - -
Gasterra Red 7 2014 - - - -
Argos
Energies
Red 16 - - - - -
Esso NLc Red 17 2013, 2014 2010 to 2014 - 2011 to
2014
X
BP NL Red 21 2011 2011 to 2014 2010 to 2014 2014 X
Cargill NL Red 46 2014 2014 - - X
(worl
dwid
e
site)
Tata Steel
(Global)
Green 48 2010 to
2012
2010 to 2013 2010 to 2014 2010 to
2013
X
Industry
SABIC Amber 10 2013 2011, 12, 13,
14
2012, 2013 - -
8
(out of
9)
89
AkzoNobel Amber 18 2010 to
2014b
- 2010 to 2014 2013 X
DSM Amber 30 b 2010b to
2014b
2010 to 2014 2010 to
2014
X
ASML Green 47 2010 to
2014
2010 to 2014 - 2010 to
2012
-
Technische
Unied
Amber 29 - Social report
2013
- - -
Cisco
Systems
Green 11 - 2010 to 2014 2011 to 2014 2010 to
2014
X
BAM Red 38 2014b 2010 to 2013 - 2010 to
2012
X
Essent Red 40 - 2010 to 2014 2010 to 2014
(RWE)
2014
(RWE)
X
Eneco Red 50 2014b - - - X

97
* Comprehensive annual (financial) report = when biodiversity is at least mentioned once.
** When biodiversity is mentioned on the business’ website (at time of research; 2015). a Special publication on Biodiversity for Unilever suppliers; “A closer look at biodiversity”. b Integrated Report c ExxonMobil Corporation; overarching business +website. d Technische Unie is not obligated to report because of the type of business (BV).
Super sector
NL Business Biodiver-
sity risk
zone
#
on
top
50
list
Compre-
hensive
annual
report*
Separate CSR
report
UNGC
Communicatio
n on Progress
Report
GRI Index
www
**
NL sample
businesses
mentioning
biodiversity
(2010-2014)
n %
Trade,
transport
and
commer-
cial
cervices
Nidera Red 20 - 2011 to 2014 - 2011 -
6
(out of
12)
50
Glencore
Grain
Red 22 2011, 2014 2010 to 2014 2014 2010 to
2014
X
Cefetra Red 49 - - - - -
SHV Green 13 - - - - -
Randstad Green 15 - - 2011 to 2014 - -
BCD Travel Red 23 - 2010 to 2014 2010 to 2014
(UN Global
Compact
Report)
- -
KLM Red 28 2013 2010 to 2014 2010 to 2014 2014 X
TNT
Express
Amber 39 - - 2010 to 2014 2010 to
2012
-
Pon
Holdings
Amber 42 - 2013 - - -
KPN Green 31 2012,
2013b,
2014b
2010 to 2012 2010 to 2014 2010, 11,
12
-
CRH Red 33 - 2011 - 2011 -
LeasePlan Green 35 - - - - -

-Table II. Use of biodiversity coding categories in business reports
Scene setting Species related Social engagement Performance evaluative
Risk
Internal managem.
External reporting
Business
Definition
Mission State ment
Site spec
Specific species
Surveys
IUCN redlist
Partner ships
Awards Stakeholder engagement
Targets Performance
Costs Risk
Risk Manage-
ment
Incidents
Materiality
BAP
BD off
GRI
TOT
Shell - 2013, 14 2010, 11,12, 13, 14
2011,
12,13, 14(a)
- 2013 2010,
11, 12, 13, 14
- 2011a, 12a ,
13a,
14a
2014a 2012a,
13a,
14a
2013a
14a
- 2012,
13, 14
- 2013a
14a
- 2014 12
Vitol - - - - - - - - - - - - - - - - - - 0
Unilever 2014b 2014b 2014b 2011,
2014b
- - 2014b - 2014b,a - - - - 2011,
2014b
- - - 2013 8
Aegon - - - - - - - - - - - - - - - - - - 0
Ahold 2010, 11,
12, 13, 14
2010 - - - - 2010,
11, 12, 13, 14
- - - - - 2010a,
13a, 14
a - - - - - 4
IKEA - 2012a 2011, 12
- - - 2012 - 2010, 12, 14 2012 - 2013, 14
- 2012 - - - - 7
Gasterra - - - - - - - - - - - - - - - - - - 0
Achmea - - - - - - - - - - - - - - - - - - 0
Philips 2010a 2010a,
11a,
12a,13a,
2014
2012,
13
- - - 2010,
11, 12,13,
14
- 2010, 11, 12 2010, 11,
12, 13, 14
2014a - 2014 2012,
13
- - 2012 2013, 14
11
SABIC - - 2011 2011a - - - - - - - 2013 - 2011 - - - 20
11a
5
Cisco Systems
- - 2011, 12, 13, 14*
2011, 12, 13,
14*
- 2011, 12, 13, 14
2012 - 2011, 13
2011, 12, 13, 14
- - - 2011, 12,
13,14*
- - - 2010,11, 12, 13, 14*
8

99
Scene setting Species related Social engagement Performance evaluative
Risk
Internal managem.
External reporting
Business
Definition
Mission State ment
Site spec
Specific species
Surveys
IUCN redlist
Partner ships
Awards Stakeholder engagement
Targets Performance
Costs Risk
Risk Manage-
ment
Incidents
Materiality
BAP
BD off
GRI
TOT
Heineken - - 2011, 12, 13, 14c
2011, 12, 13,
14c
- 2014c 2011, 12, 13,
14
- 2012, 13 2012 - - - 2011, 12, 13
2011, 12, 13, 14
- - 2011, 12, 13
9
SHV - - - - - - - - - - - - - - - - - - 0
ING - - 2012 2012 - 2012 2012 - 2012c 2012 - - - 2012c - - - 2012 8
Randstad - - - - - - - - - - - - - - - - - - 0
Argos Energies
- - - - - - - - - - - - - - - - - - 0
Esso NLd 2010, 11a,
12a, 13
a,
14a
2010,
11, 12, 13, 14
2010,
11, 12,
13,14
2010,
11, 12, 13, 14
2014 2011,
14
2010,
11, 12, 13, 14
- 2011, 12,
13, 14
2010, 11,
12, 13, 14
2010,
11, 12,
13, 14
- - 2010,
11, 12, 13, 14
2011, 12,
13
- 2014 2011, 12, 13, 14
14
Akzo Nobel
- - - - - - 2010,
12, 13, 14
- - - - - 2010,
13
2010,
14
2013 - - 2013 5
Rabo-
bank
- 2010,
11, 13, 14
2011 - - - 2010,
11, 14
- 2010, 11,
12, 13, 14
- 2013a - - - 2013 - - 2010, 11 7
Nidera - 2011, 12, 13a
- - - - 2013, 14
- 2011, 12, 13, 14
2013 - - - 2013 - - - 2011 6
BP - 2011,
13, 14
2011,
13, 14
2011,
13, 14
- 2014 2011,
12, 13, 14
- 2011, 12 2013, 14 - - - - 2012 - - - 8
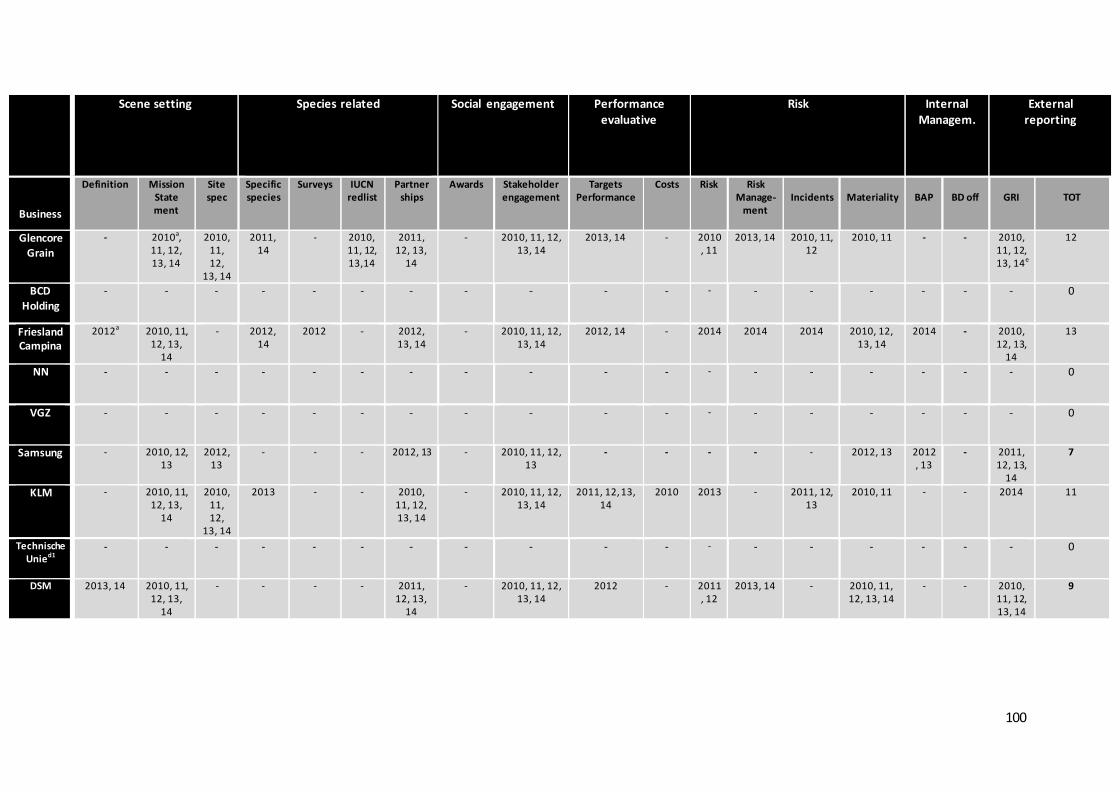
100
Scene setting Species related
Social engagement Performance evaluative
Risk
Internal Managem.
External reporting
Business
Definition
Mission State ment
Site spec
Specific species
Surveys
IUCN redlist
Partner ships
Awards Stakeholder engagement
Targets Performance
Costs Risk
Risk Manage-
ment
Incidents
Materiality
BAP
BD off
GRI
TOT
Glencore
Grain
- 2010a, 11, 12, 13, 14
2010, 11, 12,
13, 14
2011, 14
- 2010, 11, 12, 13,14
2011, 12, 13,
14
- 2010, 11, 12, 13, 14
2013, 14 - 2010, 11
2013, 14 2010, 11, 12
2010, 11 - - 2010, 11, 12, 13, 14e
12
BCD
Holding
- - - - - - - - - - - - - - - - - - 0
Friesland Campina
2012a 2010, 11, 12, 13,
14
- 2012, 14
2012 - 2012, 13, 14
- 2010, 11, 12, 13, 14
2012, 14 - 2014 2014 2014 2010, 12, 13, 14
2014 - 2010, 12, 13,
14
13
NN - - - - - - - - - - - - - - - - - - 0
VGZ - - - - - - - - - - - - - - - - - - 0
Samsung - 2010, 12, 13
2012, 13
- - - 2012, 13 - 2010, 11, 12, 13
- - - - - 2012, 13 2012, 13
- 2011, 12, 13,
14
7
KLM - 2010, 11, 12, 13,
14
2010, 11, 12,
13, 14
2013 - - 2010, 11, 12, 13, 14
- 2010, 11, 12, 13, 14
2011, 12, 13, 14
2010 2013 - 2011, 12, 13
2010, 11 - - 2014 11
Technische Unied1
- - - - - - - - - - - - - - - - - - 0
DSM 2013, 14 2010, 11, 12, 13,
14
- - - - 2011, 12, 13,
14
- 2010, 11, 12, 13, 14
2012 - 2011, 12
2013, 14 - 2010, 11, 12, 13, 14
- - 2010, 11, 12, 13, 14
9
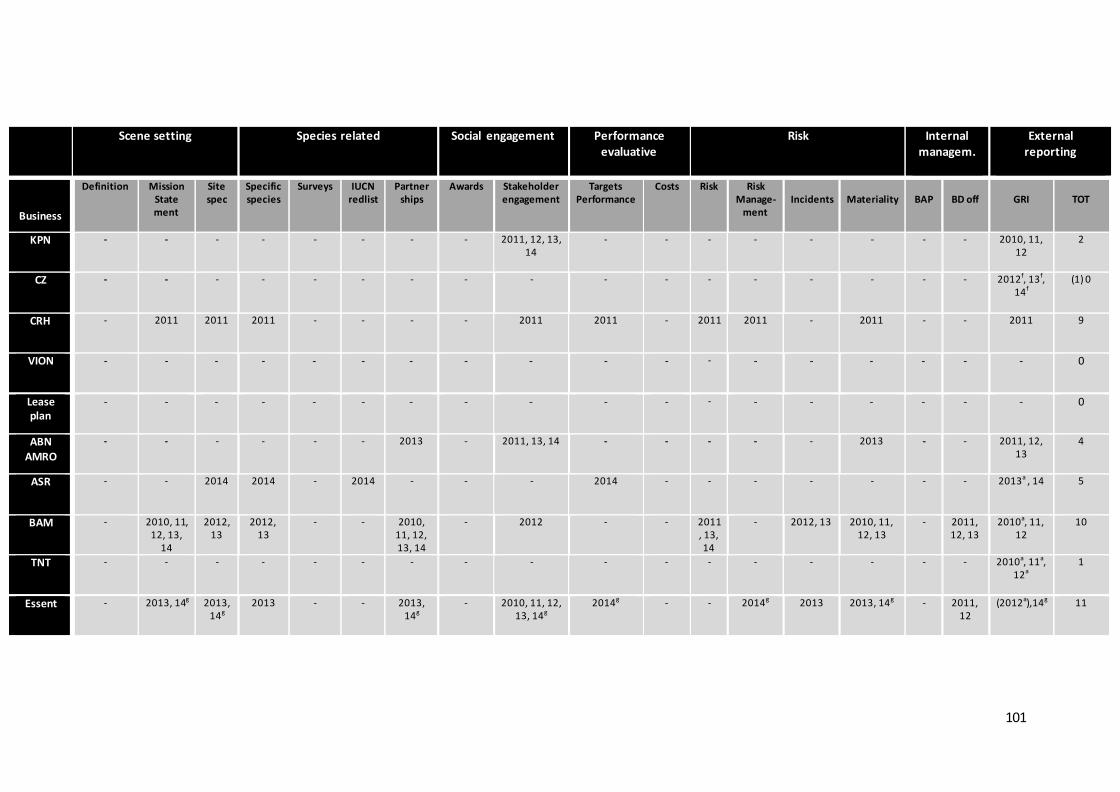
101
Scene setting Species related Social engagement Performance evaluative
Risk
Internal managem.
External reporting
Business
Definition
Mission State ment
Site spec
Specific species
Surveys
IUCN redlist
Partner ships
Awards Stakeholder engagement
Targets Performance
Costs Risk
Risk Manage-
ment
Incidents
Materiality
BAP
BD off
GRI
TOT
KPN - - - - - - - - 2011, 12, 13, 14
- - - - - - - - 2010, 11, 12
2
CZ - - - - - - - - - - - - - - - - - 2012f, 13f, 14f
(1) 0
CRH - 2011 2011 2011 - - - - 2011 2011 - 2011 2011 - 2011 - - 2011 9
VION - - - - - - - - - - - - - - - - - - 0
Lease plan
- - - - - - - - - - - - - - - - - - 0
ABN AMRO
- - - - - - 2013 - 2011, 13, 14 - - - - - 2013 - - 2011, 12, 13
4
ASR - - 2014 2014 - 2014 - - - 2014 - - - - - - - 2013a , 14 5
BAM - 2010, 11, 12, 13,
14
2012, 13
2012, 13
- - 2010, 11, 12, 13, 14
- 2012 - - 2011, 13, 14
- 2012, 13 2010, 11, 12, 13
- 2011, 12, 13
2010a, 11, 12
10
TNT - - - - - - - - - - - - - - - - - 2010a, 11a, 12a
1
Essent - 2013, 14g 2013, 14g
2013 - - 2013, 14g
- 2010, 11, 12, 13, 14g
2014g - - 2014g 2013 2013, 14g - 2011, 12
(2012a),14g 11
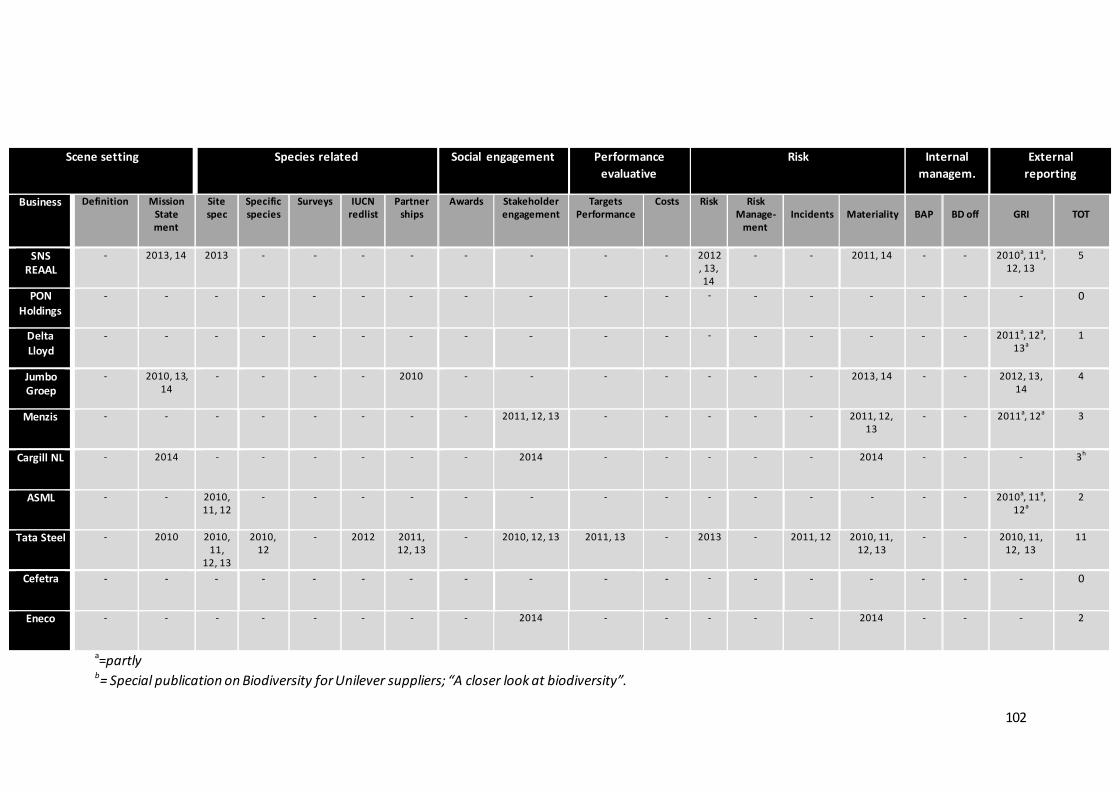
102
a=partly b= Special publication on Biodiversity for Unilever suppliers; “A closer look at biodiversity”.
Scene setting Species related Social engagement Performance
evaluative
Risk
Internal
managem.
External
reporting
Business Definition
Mission State ment
Site spec
Specific species
Surveys
IUCN redlist
Partner ships
Awards Stakeholder engagement
Targets Performance
Costs Risk
Risk Manage-
ment
Incidents
Materiality
BAP
BD off
GRI
TOT
SNS REAAL
- 2013, 14 2013 - - - - - - - - 2012, 13, 14
- - 2011, 14 - - 2010a, 11a, 12, 13
5
PON
Holdings
- - - - - - - - - - - - - - - - - - 0
Delta Lloyd
- - - - - - - - - - - - - - - - - 2011a, 12a, 13a
1
Jumbo Groep
- 2010, 13, 14
- - - - 2010 - - - - - - - 2013, 14 - - 2012, 13, 14
4
Menzis - - - - - - - - 2011, 12, 13 - - - - - 2011, 12, 13
- - 2011a, 12a 3
Cargill NL - 2014 - - - - - - 2014 - - - - - 2014 - - - 3h
ASML - - 2010, 11, 12
- - - - - - - - - - - - - - 2010a, 11a, 12a
2
Tata Steel - 2010 2010, 11,
12, 13
2010, 12
- 2012 2011, 12, 13
- 2010, 12, 13 2011, 13 - 2013 - 2011, 12 2010, 11, 12, 13
- - 2010, 11, 12, 13
11
Cefetra - - - - - - - - - - - - - - - - - - 0
Eneco - - - - - - - - 2014 - - - - - 2014 - - - 2
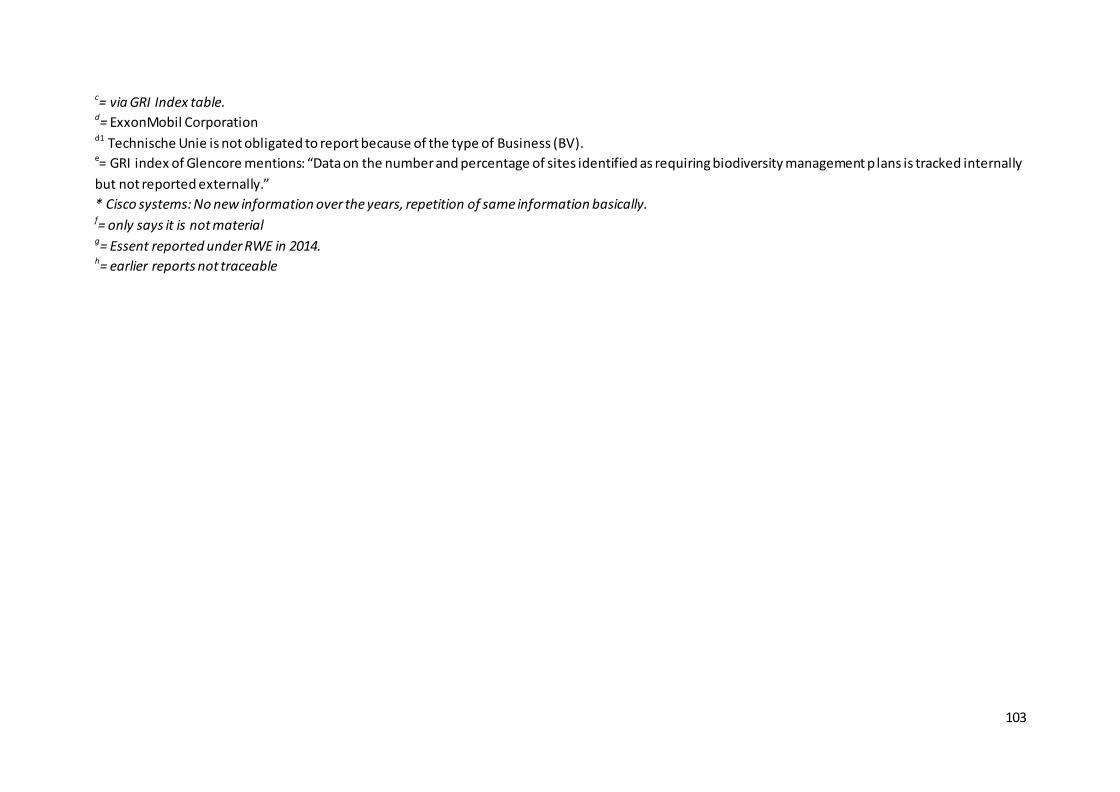
103
c= via GRI Index table. d= ExxonMobil Corporation d1 Technische Unie is not obligated to report because of the type of Business (BV). e= GRI index of Glencore mentions: “Data on the number and percentage of sites identified as requiring biodiversity management p lans is tracked internally
but not reported externally.”
* Cisco systems: No new information over the years, repetition of same information basically. f= only says it is not material g= Essent reported under RWE in 2014. h= earlier reports not traceable
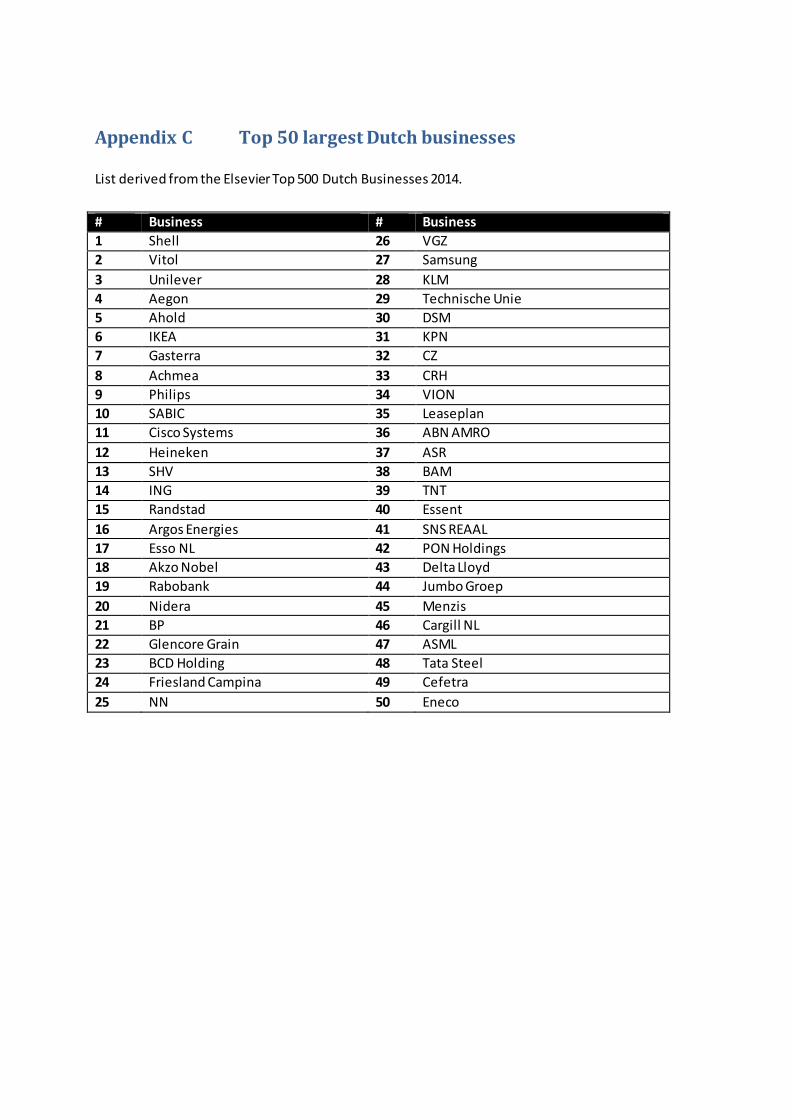
Appendix C Top 50 largest Dutch businesses
List derived from the Elsevier Top 500 Dutch Businesses 2014.
# Business # Business
1 Shell 26 VGZ
2 Vitol 27 Samsung
3 Unilever 28 KLM
4 Aegon 29 Technische Unie
5 Ahold 30 DSM
6 IKEA 31 KPN
7 Gasterra 32 CZ
8 Achmea 33 CRH
9 Philips 34 VION
10 SABIC 35 Leaseplan
11 Cisco Systems 36 ABN AMRO
12 Heineken 37 ASR
13 SHV 38 BAM
14 ING 39 TNT
15 Randstad 40 Essent
16 Argos Energies 41 SNS REAAL
17 Esso NL 42 PON Holdings
18 Akzo Nobel 43 Delta Lloyd
19 Rabobank 44 Jumbo Groep
20 Nidera 45 Menzis
21 BP 46 Cargill NL
22 Glencore Grain 47 ASML
23 BCD Holding 48 Tata Steel
24 Friesland Campina 49 Cefetra
25 NN 50 Eneco
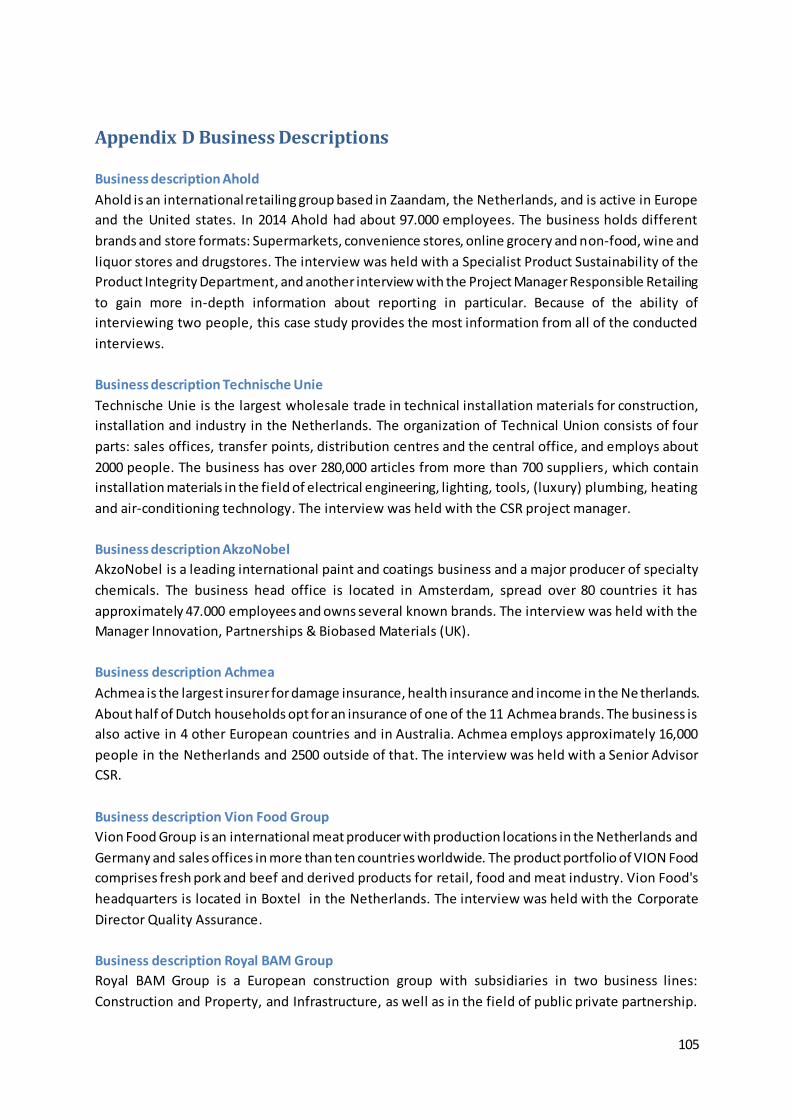
105
Appendix D Business Descriptions
Business description Ahold
Ahold is an international retailing group based in Zaandam, the Netherlands, and is active in Europe
and the United states. In 2014 Ahold had about 97.000 employees. The business holds different
brands and store formats: Supermarkets, convenience stores, online grocery and non-food, wine and
liquor stores and drugstores. The interview was held with a Specialist Product Sustainability of the
Product Integrity Department, and another interview with the Project Manager Responsible Retailing
to gain more in-depth information about reporting in particular. Because of the ability of
interviewing two people, this case study provides the most information from all of the conducted
interviews.
Business description Technische Unie
Technische Unie is the largest wholesale trade in technical installation materials for construction,
installation and industry in the Netherlands. The organization of Technical Union consists of four
parts: sales offices, transfer points, distribution centres and the central office, and employs about
2000 people. The business has over 280,000 articles from more than 700 suppliers, which contain
installation materials in the field of electrical engineering, lighting, tools, (luxury) plumbing, heating
and air-conditioning technology. The interview was held with the CSR project manager.
Business description AkzoNobel
AkzoNobel is a leading international paint and coatings business and a major producer of specialty
chemicals. The business head office is located in Amsterdam, spread over 80 countries it has
approximately 47.000 employees and owns several known brands. The interview was held with the
Manager Innovation, Partnerships & Biobased Materials (UK).
Business description Achmea
Achmea is the largest insurer for damage insurance, health insurance and income in the Ne therlands.
About half of Dutch households opt for an insurance of one of the 11 Achmea brands. The business is
also active in 4 other European countries and in Australia. Achmea employs approximately 16,000
people in the Netherlands and 2500 outside of that. The interview was held with a Senior Advisor
CSR.
Business description Vion Food Group
Vion Food Group is an international meat producer with production locations in the Netherlands and
Germany and sales offices in more than ten countries worldwide. The product portfolio of VION Food
comprises fresh pork and beef and derived products for retail, food and meat industry. Vion Food's
headquarters is located in Boxtel in the Netherlands. The interview was held with the Corporate
Director Quality Assurance.
Business description Royal BAM Group
Royal BAM Group is a European construction group with subsidiaries in two business lines:
Construction and Property, and Infrastructure, as well as in the field of public private partnership.

106
This holds activities in residential and commercial construction, civil construction, dredging,
consultancy and engineering. With some 23,000 employees, BAM realizes thousands of projects on a
yearly basis. The interview was held with the Manager Center for Sustainability.
Business description SABIC
SABIC is a global petrochemical business. The European headquarters is situated in Sittard and a
production site in Geleen (Chemelot), both in the Netherlands. SABIC employs 1,800 people in The
Netherlands, worldwide this is more than 40,000. In Geleen raw materials are made for the
production of various plastics that are made from hydrocarbons, which are derived from refined
petroleum. The interview was held with a sustainability expert from SABIC Netherlands.
Business description Eneco
Eneco is an international renewable energy business with operations in the Netherlands, Great
Britain, Germany, France and Belgium, the headquarters is located in Rotterdam. Eneco provides
energy to more than two million customers and has over 7000 employees. The business invests in
wind farms on land and sea, in solar projects and biomass plants. The interview was held with a
senior business analyst from ENECO Energy.
Business description DSM
Royal DSM N.V. is a global business, and is in the Netherlands at eleven locations active in research &
development, production and sales in the field of food ingredients, pharmaceuticals and high quality
materials. DSM and its affiliated businesses have approximately 25,000 employees, of which 5000
are in located in the Netherlands. The interview was held with a Senior Advisor Sustainability.