Embed Size (px)
Citation preview

(Part of) Working Paper – Do not distribute or quote without permission. Only for CSCI510 and CSCI577use
Business Case Analysis
Business Case as feasibility evidence Business Case can be used as an evidence that the project can be done within the available budget and the
expected return-on-investment.
Cost Analysis Costs include actual client costs for system development, transition, operations, and maintenance. Costs can be
categorized into one-time cost or recurring cost. Cost can also be categorized by type. Three main types are
development/production/personnel cost, and capital/infrastructure cost.
For personnel cost, it is usually easier to estimate personnel cost in terms of effort or number of hours,
which can later be calculated into dollar amount by using salary rate. Examples of one–time effort includes
development and transition effort, while recurring effort includes operational and maintenance effort. Table
14-1 shows how to capture personnel cost.
The other type of cost is capital or infrastructure cost. If your project acquires a Non-Developmental Item
component or Services component, please make sure to consider all the related fees such as transaction fee,
license fee, support fee, per GB fee, and maintenance fee.
Table 14-1 Personnel Costs – Exploration phase
Activities Time Spent (Hours)
Exploration Phase
Conduct market survey (10 hours * 2 people) 20
Architecture Review Board (1.5 hours * 8 people) 12
…. ….
Total 32
Table 14-2 Infrastructure cost - Development phase
Type Cost Rationale
Hardware- Web Server $1500 A new machine is needed to act as a web server for the system.
Software – Adobe Dreamweaver CS3
$399 Used in developing the system and the team website.
…..
(Part of) Working Paper – Do not distribute or quote without permission. Only for CSCI510 and CSCI577use
Benefit Analysis
Quantitative Benefits
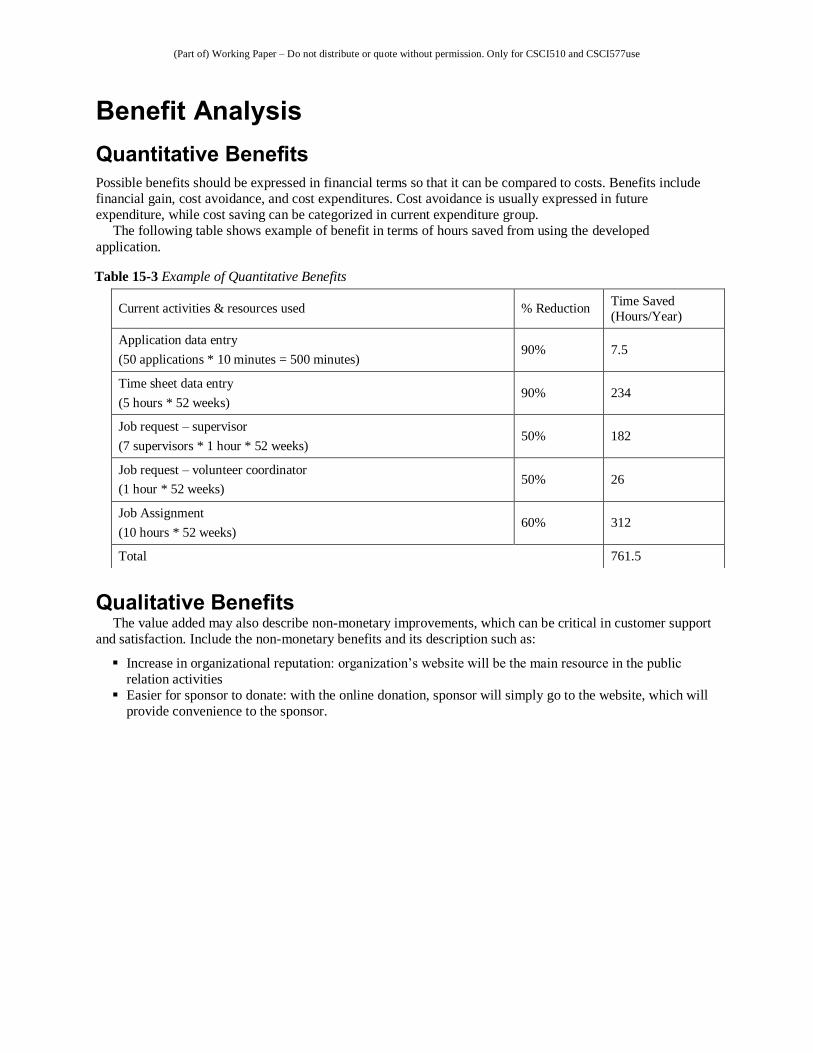
Possible benefits should be expressed in financial terms so that it can be compared to costs. Benefits include
financial gain, cost avoidance, and cost expenditures. Cost avoidance is usually expressed in future
expenditure, while cost saving can be categorized in current expenditure group.
The following table shows example of benefit in terms of hours saved from using the developed
application.
Qualitative Benefits The value added may also describe non-monetary improvements, which can be critical in customer support
and satisfaction. Include the non-monetary benefits and its description such as:
Increase in organizational reputation: organization’s website will be the main resource in the public
relation activities
Easier for sponsor to donate: with the online donation, sponsor will simply go to the website, which will
provide convenience to the sponsor.
Table 15-3 Example of Quantitative Benefits
Current activities & resources used % Reduction Time Saved
(Hours/Year)
Application data entry
(50 applications * 10 minutes = 500 minutes) 90% 7.5
Time sheet data entry
(5 hours * 52 weeks) 90% 234
Job request – supervisor
(7 supervisors * 1 hour * 52 weeks) 50% 182
Job request – volunteer coordinator
(1 hour * 52 weeks) 50% 26
Job Assignment
(10 hours * 52 weeks) 60% 312
Total 761.5
(Part of) Working Paper – Do not distribute or quote without permission. Only for CSCI510 and CSCI577use
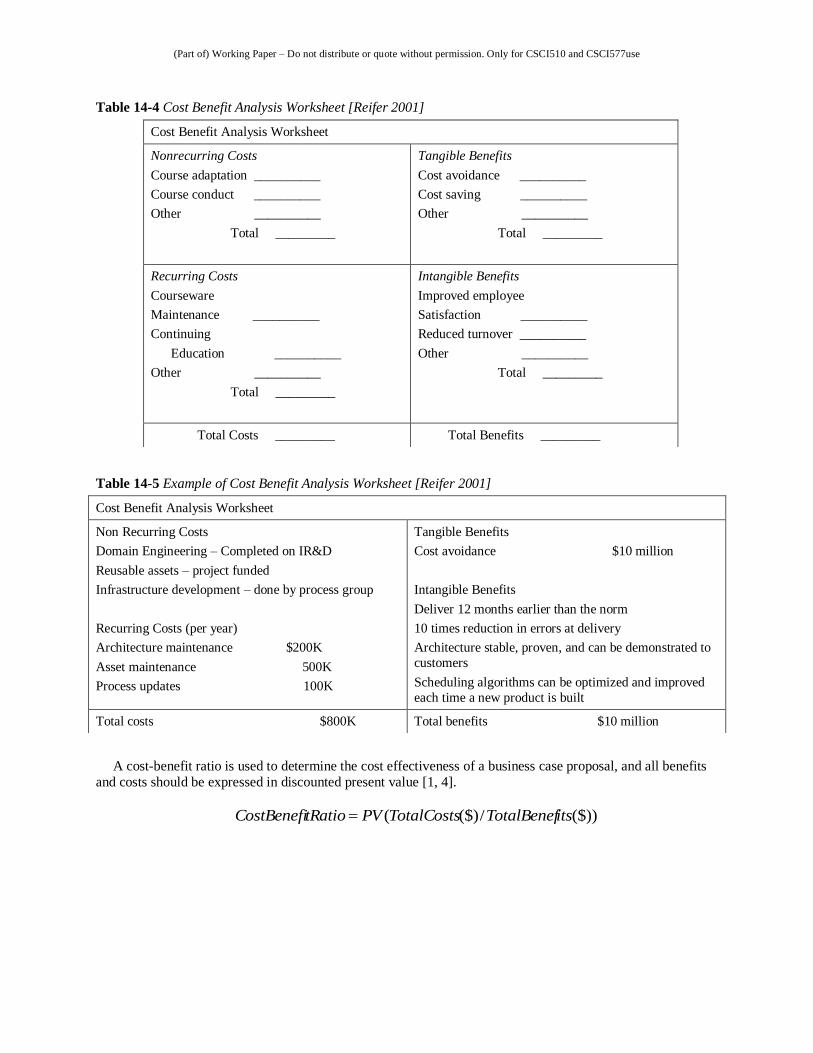
A cost-benefit ratio is used to determine the cost effectiveness of a business case proposal, and all benefits
and costs should be expressed in discounted present value [1, 4].
($))/($)( itsTotalBenefTotalCostsPVtRatioCostBenefi
Table 14-4 Cost Benefit Analysis Worksheet [Reifer 2001]
Cost Benefit Analysis Worksheet
Nonrecurring Costs
Course adaptation __________
Course conduct __________
Other __________
Total _________
Tangible Benefits
Cost avoidance __________
Cost saving __________
Other __________
Total _________
Recurring Costs
Courseware
Maintenance __________
Continuing
Education __________
Other __________
Total _________
Intangible Benefits
Improved employee
Satisfaction __________
Reduced turnover __________
Other __________
Total _________
Total Costs _________ Total Benefits _________
Table 14-5 Example of Cost Benefit Analysis Worksheet [Reifer 2001]
Cost Benefit Analysis Worksheet
Non Recurring Costs
Domain Engineering – Completed on IR&D
Reusable assets – project funded
Infrastructure development – done by process group
Recurring Costs (per year)
Architecture maintenance $200K
Asset maintenance 500K
Process updates 100K
Tangible Benefits
Cost avoidance $10 million
Intangible Benefits
Deliver 12 months earlier than the norm
10 times reduction in errors at delivery
Architecture stable, proven, and can be demonstrated to
customers
Scheduling algorithms can be optimized and improved
each time a new product is built
Total costs $800K Total benefits $10 million

(Part of) Working Paper – Do not distribute or quote without permission. Only for CSCI510 and CSCI577use
Return On Investment Return-On-Investment (ROI) analysis is related to cost-benefit-analysis because to determine the ROI value,
investment costs and benefits have to be identified as monetary value. “Return on investment is frequently
derived as the “return” (incremental gain) from an action divided by the cost of that action [6].”
Moreover, to determine ROI involved with future years (not only for the current year), the time value of
money typically needs to be considered [11]. Therefore, ROI is the ratio of the total present value of net
benefits during the service life of the project to the total present value of the costs [7]. Consequently, the higher
ROI is the better option [5].
Figure 14-1 Return On Investment Graph
Since costs and benefits may occur at different times, the business case analysis will usually discount future cash flows based on likely rates of interest, so that all of cash flows are referenced to a single point in time
(usually the present, as in Present
CostsInvestment
sNetBenefitROI
CostsInvestment
CostsInvestmentGainsROI
-1
0.31
1.02
1.43
-1.5
-1
-0.5
0
0.5
1
1.5
2
2010 2011 2012 2013
Return on Investment
ROI
Table 14-6 Example of Return On Investment
Year Cost Benefit Cumulative Cost Cumulative Benefit ROI
2010 425 0 425 0 -1
2011 156 761.5 581 761.5 0.31
2012 171.6 761.5 752.6 1523 1.02
2013 188.76 761.5 941.36 2284.5 1.43

(Part of) Working Paper – Do not distribute or quote without permission. Only for CSCI510 and CSCI577use
Value)
One can then compare two decision options A and B in terms of their ROI profiles versus time. In Figure 2,
for example, Option A’s ROI becomes positive sooner than Option B’s ROI, but its longer-term ROI is lower.
The stakeholders `can then decide whether the longer wait for a higher ROI in Option B is preferable to the
shorter wait for a lower ROI in Option A. Option Rapid-B illustrates why stakeholders are interested in rapid
application development. If Rapid-B can be developed in half the time, it will be much preferable to either of
Options A or original-B.
Figure 14-2 Example of Business Case Analysis Results
Unquantifiable Benefits, Uncertainties, and Risk Two additional factors may be important in business case analysis. One involves unquantifiable benefits; the
other involves uncertainties and risk. In some cases, Option A might be preferred to Option B or even Rapid-B
if it provided additional benefits that may be difficult to quantify, such as controllability, political benefits, or
stakeholder good will. These can sometimes be addressed by such techniques as multiple-criterion decision-
making or utility functions involving stakeholders’ preferences for financial or non-financial returns. In other
cases, the benefit flows in Figure 15.3 may be predicated on uncertain assumptions. They might assume, for
example, that the Option B product will be the first of its kind to enter the marketplace and will capture a large
market share.
However, if two similar products enter the marketplace first, then the payoff for Option B may be even less
than that for Option A. If the profitability of early competitor marketplace entry can be quantified, it can then
be used to determine the relative value of the rapid development Option Rapid-B. This value can then be used
to determine the advisability of adopting practices that shorten schedule at some additional cost. An example is
pair programming: empirical studies indicate that paired programmers will develop software in 60-70% of the
calendar time required for an individual programmer, but thereby requiring 120-140% of the cost of the
individual programmer. If the profitability of early competitor marketplace entry is unknown, this means that
making a decision between the cheaper Option B and the faster Option Rapid-B involves considerable
uncertainty and risk. It also means that there is a value in performing competitor analysis to determine the
probability of early competitor marketplace entry, or of buying information to reduce risk. This kind of value-
of information analysis can be performed via statistical decision theory; a discussion and examples of its
applicability to software decision making are provided in Chapter 21. An excellent overall introduction to
software business case analysis is (Reifer, 2002). Good examples in this book are in Chapters 11, 22, 24, 41,
and 44

(Part of) Working Paper – Do not distribute or quote without permission. Only for CSCI510 and CSCI577use
Other Financial Analysis Techniques
Breakeven Analysis
This type of analysis is used to determine the point where the benefits equal costs which normally this point is
a function of volume [1].
According to [8], “The definitions used in Breakeven Analysis are
Fixed Cost: The sum of all costs required to produce the first unit of a product. This amount does not
vary as production increases or decreases, until new capital expenditures are needed.
Variable Unit Cost: Costs that vary directly with the production of one additional unit.
Expected Unit Sales: Number of units of the product projected to be sold over a specific period of time.
Unit Price: The amount of money charged to the customer for each unit of a product or service.
Total Variable Cost: The product of expected unit sales and variable unit cost.
(Expected Unit Sales * Variable Unit Cost)
Total Cost: The sum of the fixed cost and total variable cost for any given level of production.
(Fixed Cost + Total Variable Cost)
Total Revenue: The product of expected unit sales and unit price.
(Expected Unit Sales * Unit Price)
Profit (or Loss): The monetary gain (or loss) resulting from revenues after subtracting all associated
costs.
(Total Revenue - Total Costs)
Break Even: Number of units that must be sold in order to produce a profit of zero (but will recover all
associated costs).
(Break Even = Fixed Cost / (Unit Price - Variable Unit Cost))
For example [9], if variable unit cost is $2.50, fixed cost is $500.00, expected unit sales is 250, and unit
price is $5.00, total variable cost, total cost, total revenue and profit can be calculated and plot as the following
graph.

(Part of) Working Paper – Do not distribute or quote without permission. Only for CSCI510 and CSCI577use
Figure 15-3 Breakeven Analysis
From the graph, the breakeven is at 200 units. Therefore, more than 200 products must be sold to make a
profit.
This section presents necessary financial concepts (e.g. present value) and financial analysis techniques for
evaluating software business case analysis.
Present Value and Future Worth Concept
One of the most basic financial concepts used in business case analysis is “cost-of-money” [1]. Present value is
the cost-of-money on a given date of future payments (i.e. discounted to reflect the time value of money) [2,
3]. For example, to determine the worth in today’s dollars of the $10K that will receive in next 2 years can be
calculated from the following formula.
where F is cash flow
r is interest rate per time period
n is the number of time periods
D is the discount rate calculated from interest rate
Therefore, the value in today’s dollars of the $10K that will receive in next 2 years (assume that the interest
rate is 0.8%) is
n
n
FDnrFPV
rD
r
FnrFPV
),,(
1
1
)1(),,(
(Part of) Working Paper – Do not distribute or quote without permission. Only for CSCI510 and CSCI577use
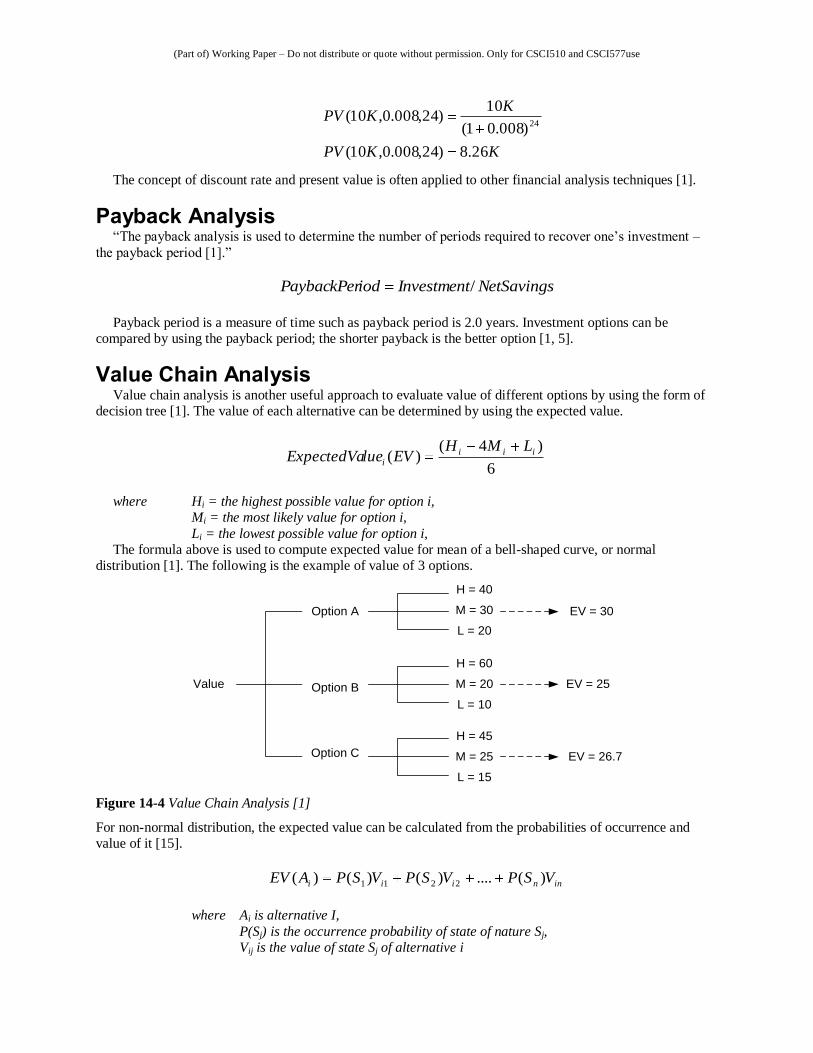
The concept of discount rate and present value is often applied to other financial analysis techniques [1].
Payback Analysis “The payback analysis is used to determine the number of periods required to recover one’s investment –
the payback period [1].”
Payback period is a measure of time such as payback period is 2.0 years. Investment options can be
compared by using the payback period; the shorter payback is the better option [1, 5].
Value Chain Analysis Value chain analysis is another useful approach to evaluate value of different options by using the form of
decision tree [1]. The value of each alternative can be determined by using the expected value.
where Hi = the highest possible value for option i, Mi = the most likely value for option i,
Li = the lowest possible value for option i, The formula above is used to compute expected value for mean of a bell-shaped curve, or normal
distribution [1]. The following is the example of value of 3 options.
Figure 14-4 Value Chain Analysis [1]
For non-normal distribution, the expected value can be calculated from the probabilities of occurrence and
value of it [15].
where Ai is alternative I,
P(Sj) is the occurrence probability of state of nature Sj, Vij is the value of state Sj of alternative i
KKPV
KKPV
26.8)24,008.0,10(
)008.01(
10)24,008.0,10(
24
NetSavingsInvestmentiodPaybackPer /
6
)4()( iii
i
LMHEVlueExpectedVa
Value
Option A
Option B
Option C
H = 40
M = 30
L = 20
H = 60
M = 20
L = 10
H = 45
M = 25
L = 15
EV = 30
EV = 25
EV = 26.7
inniii VSPVSPVSPAEV )(....)()()( 2211

(Part of) Working Paper – Do not distribute or quote without permission. Only for CSCI510 and CSCI577use
Pareto Analysis
“This analysis is based on the Pareto principle, which states that a few of the problems are responsible for most
of the effect, sometimes called the 80-20 rule [1].” To illustrate, the following Pareto chart shows that CBB,
VSS, and CNS functions (about 20% of overall functions) cause 80% of defective costs.
Figure 14-5 Pareto Chart
Thus, “Pareto charts provide insight into causes of problems [1].”
According to [10], “there are seven steps to identifying the important causes using Pareto Analysis:
1. Form a table listing the causes and their frequency as a percentage.
1. Arrange the rows in the decreasing order of importance of the causes, i.e. the most important cause first.
2. Add a cumulative percentage column to the table.
3. Plot with causes on x-axis and cumulative percentage on y-axis.
4. Join the above points to form a curve.
5. Plot (on the same graph) a bar graph with causes on x-axis and percent frequency on y-axis.
6. Draw a line at 80% on y-axis parallel to x-axis. Then drop the line at the point of intersection with the
curve on x-axis. This point on the x-axis separates the important causes on the left and less important
causes on the right.”
0
10
20
30
40
50
60
70
80
90
100
CB
B
VSS
CN
S
LLB
R
BB
R
AN
S
SAP
QM
N
SSA
KLM SS
L
GQ
P
ZKL
YTR
Pareto Chart
Percentage of Defective Costs
Cumulative Percentage of Defective Costs

(Part of) Working Paper – Do not distribute or quote without permission. Only for CSCI510 and CSCI577use
The Comparison of Financial Analysis Techniques This section presents the situations where each analysis technique is proper to used (i.e. corresponding to its
objective) and the limitations or drawbacks of each technique in tubular format as showed below.
Use Business Case to track earned-value management
A technique often used to implement project monitoring and control functions in the software CMM or the
CMMI is Earned Value Management. It works as shown in Figure 14-6
Table 14-7 Comparison of financial analysis techniques
Financial Analysis
Techniques
Objectives Limitations/Drawbacks
Cost-Benefit Analysis (Cost/Benefit Ratio)
Benefit-Cost Analysis
(ROI = NPB/NPC) [11]
Simple technique for evaluating the cost effectiveness of a business case
proposal [1].
Accuracy problem: the outcome of the analysis based on the accuracy of
estimating costs and benefits [11].
Only financial costs and benefits are
considered within the analysis [12].
Payback Analysis To determine how long the project will take to earn back the money spent
on [13].
The straight payback method does not consider the time value of money [13].
To solve this problem net present
value and internal rate of return should
be considered.
The investment after the end of
payback period is ignored [1].
Breakeven Analysis This analysis is used to determine the breakeven point when benefits and
costs are functions of volume [1].
It assumes that fixed costs are constant which it may be not [14].
It assumes that variable costs are
constant per unit of output (i.e. linearity) [14].
Value Chain Analysis (Expected Value of
alternatives)
This analysis is useful for dealing with uncertainty in evaluating alternatives
(options) [1].
Pareto Analysis This analysis is useful for evaluating the source of most system’s failure
costs [1].
This analysis possibly excludes important problems which may be
small initially, but which grow with
time. Thus, other analytical tools (e.g.
Failure mode and effects analysis and
Fault tree analysis) should be
combined [16].

(Part of) Working Paper – Do not distribute or quote without permission. Only for CSCI510 and CSCI577use
Figure 14-6 Earned Value” Feedback Process
The Earned Value Management process is generally good for tracking whether the project is meeting its
original plan. However, it becomes difficult to administer if the project’s plan changes rapidly. More
significantly, it has absolutely nothing to say about the actual value being earned for the organization by the
project’s results. A project can be tremendously successful with respect to its cost-oriented “earned value,” but
an absolute disaster in terms of actual organizational value earned. This frequently happens when the resulting
product has flaws with respect to user acceptability, operational cost-effectiveness, or timely market entry.
Thus, it would be preferable to have techniques which support monitoring and control of the actual value to be
earned by the project’s results.
Business-Case and Benefits-Realized Monitoring and Control
A first step is to use the project’s business case (discussed in Section 15.3) as a means of monitoring the actual
business value of the capabilities to be delivered by the project. This involves continuing update of the
business case to reflect changes in business model assumptions, market conditions, organizational priorities,
and progress with respect to enabling initiatives. Monitoring the delivered value of undelivered capabilities is
difficult; therefore, this approach works best when the project is organized to produce relatively frequent
increments of delivered capability.
A related next step is to monitor assumptions and progress with respect to all of the Initiatives and
Outcomes involved in the project’s Results Chain. The suggested monitoring approach in (Thorp, 1998)
involves coloring in the degree to which Initiatives and Outcomes have been realized. This can be extended to
monitor Contributions and validity of Assumptions as well.
For example, monitoring the Contribution, “Reduce time to deliver product” in Figure 15-1 could uncover
the problem that speeding up order entry will create more order fulfillment delays unless a complementary
order-fulfillment Initiative is established.
The resulting value realization feedback process is shown in Figure 15-6. With respect to the order-entry
example just above, finding out that value was not being realized via reduced delivery times would lead to
some corrective action, most likely the establishment of an order-fulfillment speedup Initiative. This would
require updates of the overall plans and business case, and new time-phased cost and benefit flows to monitor.
A further option in the value realization feedback process involves adjusting the value function to reflect
progress with respect to the product’s production function as illustrated in Figure 15-7. The usual economic
production function is an S-shaped curve in which the early “Investment” segment involves development of
infrastructure and architecture which does not directly generate benefits, but which is necessary for realization

(Part of) Working Paper – Do not distribute or quote without permission. Only for CSCI510 and CSCI577use
of the benefits in the High-payoff and Diminishing-returns segment of the curve. This means that tracking
direct benefits realized usually produces pessimistic results during the Investment segment of the curve. One
can either manage stakeholders’ expectations to accept low early benefit flows (as with the ROI profiles in
Figure 15.3), or use an alternative value function (the dotted line in Figure 15.7), which ascribes additional
indirect value to the early investments in infrastructure and architecture. (Actually, the real-options techniques
in (Sullivan et. al., 2001) and Chapters 11, 24, and 41 can estimate such values). The preferred approach will
depend on the project’s stakeholders and their expectations.
Of course, the actual and potential benefit values realized by each increment of capability need to be
monitored and adjusted for changes. For example, a low-cost and user-friendly animated graphics package
may increase the net value of animated graphics for certain classes of applications (e.g. education and
training), and limited domain speech understanding systems have shown considerable labor-saving value.
Figure 15-7 Example Production Function for Software Product Features
References D. J. Reifer, "Making the Business Case: Principles, Rules, and Analysis Tools," in Making the Software Business
Case: Improvement by the Numbers, 1st ed., A. Ed. New York: Addison-Wesley, 2001, pp. 53-75.
CSCI510 Lecture, Chapter 14 Present versus Future Expenditure and Income
"Present value," Wikipedia, Apr. 8, 2009. [Online]. Available: http://en.wikipedia.org/wiki/Present_value.
[Accessed: Apr. 18, 2009].
"Benefit-cost ratio," Wikipedia, Mar. 13, 2009. [Online]. Available: http://en.wikipedia.org/wiki/Benefit-cost_ratio.
[Accessed: Apr. 18, 2009].
"Business Case Analysis – Solution Matrix Ltd.," Solution Matrix Ltd., [Online]. Available:
http://www.solutionmatrix.com/downloads/FinancialMetricsLite.xls [Accessed: Apr. 18, 2009].
"The Simple Return on Investment," Solution Matrix Ltd., [Online]. Available:
http://www.solutionmatrix.com/return-on-investment-2.html [Accessed: Apr. 18, 2009].

(Part of) Working Paper – Do not distribute or quote without permission. Only for CSCI510 and CSCI577use
"Benefit-Cost Ratio," Prof. Ram M. Shrestha, Jun. 21, 2007. [Online]. Available:
http://www.soi.wide.ad.jp/class/20070041/slides/08/26.html [Accessed: Apr. 21, 2009].
"The Break-Even Calculator," Weatherhead School of Management. [Online]. Available:
http://connection.cwru.edu/mbac424/breakeven/BreakEven.html. [Accessed: Apr. 21, 2009].
"The Breakeven Analysis," KJE Computer Calculation LLC. [Online]. Available:
http://www.dinkytown.net/java/BreakEven.html. [Accessed: Apr. 21, 2009].
D. Haughey, "Pareto Analysis Step by Step," ProjectSmart.co.uk. [Online]. Available:
http://www.projectsmart.co.uk/pareto-analysis-step-by-step.html. [Accessed: Apr. 21, 2009].
["Cost-benefit analysis," Wikipedia, Apr. 16, 2009. [Online]. Available: http://en.wikipedia.org/wiki/Cost-
benefit_analysis. [Accessed: Apr. 22, 2009].
"Cost Benefit analysis," MindTools. [Online]. Available: http://www.mindtools.com/pages/article/newTED_08.htm.
[Accessed: Apr. 22, 2009].
"Business Owner’s Toolkit: Payback Period Analysis," Business’s Owner’s Toolkit. [Online]. Available:
http://www.toolkit.com/small_business_guide/sbg.aspx?nid=P06_6510. [Accessed: Apr. 22, 2009].
"Break even analysis," Wikipedia, Apr. 6, 2009. [Online]. Available:
http://en.wikipedia.org/wiki/Break_even_analysis. [Accessed: Apr. 22, 2009].
CSCI510 Lectures, Chapter 19 Coping with Uncertainties: Risk Analysis and Chapter 20 Statistical Decision
Theory: The Value of Information
"Pareto analysis," Wikipedia, Mar. 3, 2009. [Online]. Available: http://en.wikipedia.org/wiki/Pareto_analysis.
[Accessed: Apr. 22, 2009].