Embed Size (px)
Citation preview
For release 10:00 a.m. (EDT), Wednesday, April 25, 2018 USDL-18-0634
Technical Information: (202) 691-6553 • [email protected] • www.bls.gov/bdm Media Contact: (202) 691-5902 • [email protected]
BUSINESS EMPLOYMENT DYNAMICS – THIRD QUARTER 2017
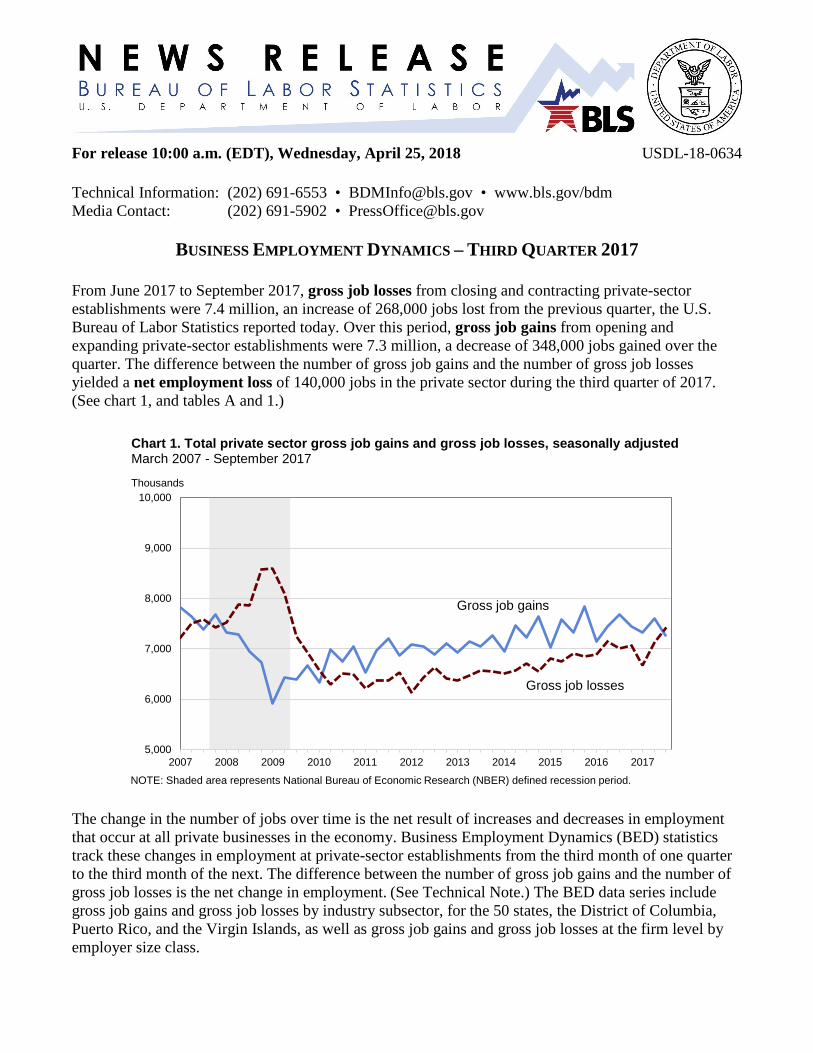
From June 2017 to September 2017, gross job losses from closing and contracting private-sector establishments were 7.4 million, an increase of 268,000 jobs lost from the previous quarter, the U.S. Bureau of Labor Statistics reported today. Over this period, gross job gains from opening and expanding private-sector establishments were 7.3 million, a decrease of 348,000 jobs gained over the quarter. The difference between the number of gross job gains and the number of gross job losses yielded a net employment loss of 140,000 jobs in the private sector during the third quarter of 2017. (See chart 1, and tables A and 1.)
The change in the number of jobs over time is the net result of increases and decreases in employment that occur at all private businesses in the economy. Business Employment Dynamics (BED) statistics track these changes in employment at private-sector establishments from the third month of one quarter to the third month of the next. The difference between the number of gross job gains and the number of gross job losses is the net change in employment. (See Technical Note.) The BED data series include gross job gains and gross job losses by industry subsector, for the 50 states, the District of Columbia, Puerto Rico, and the Virgin Islands, as well as gross job gains and gross job losses at the firm level by employer size class.
Gross job gains
Gross job losses
5,000
6,000
7,000
8,000
9,000
10,000
2007 2008 2009 2010 2011 2012 2013 2014 2015 2016 2017
Chart 1. Total private sector gross job gains and gross job losses, seasonally adjustedMarch 2007 - September 2017
Thousands
NOTE: Shaded area represents National Bureau of Economic Research (NBER) defined recession period.
- 2 -
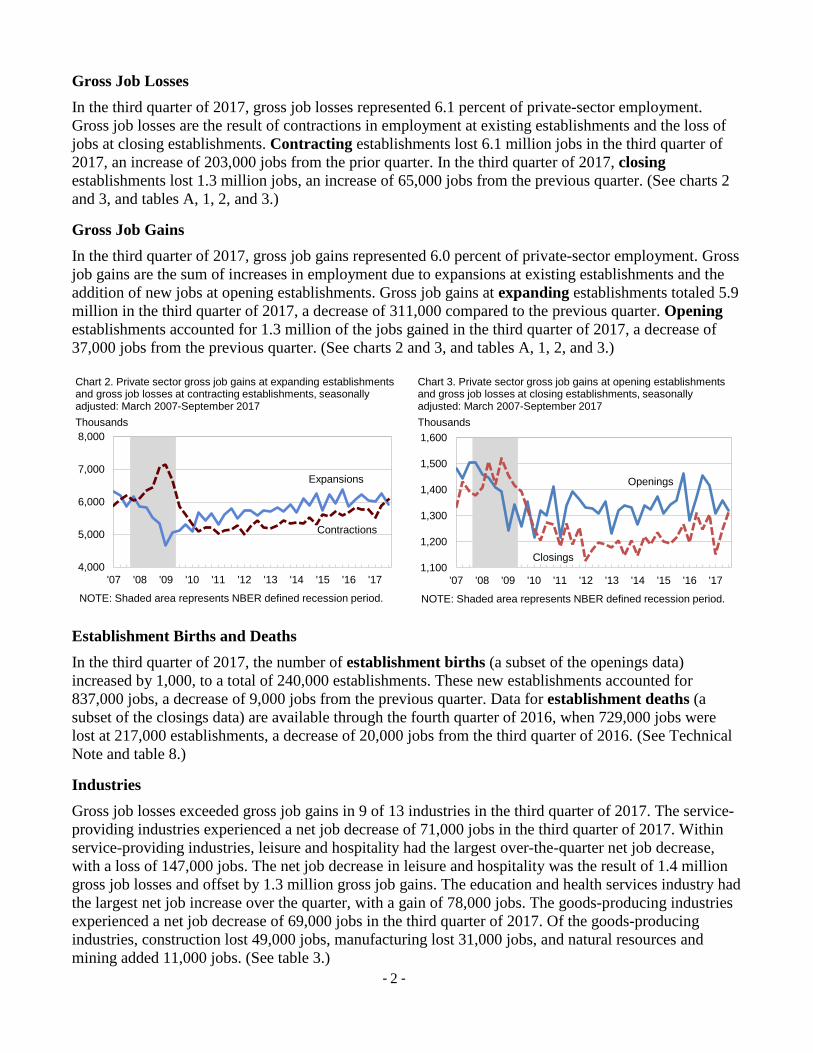
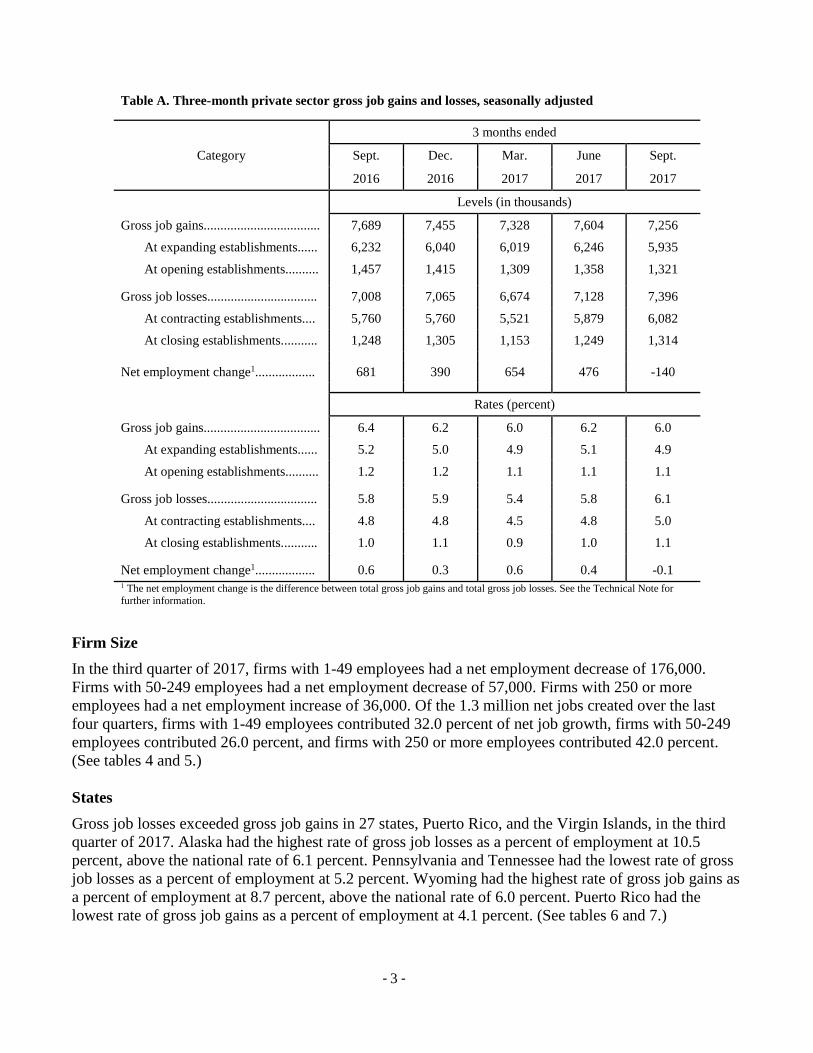
Gross Job Losses In the third quarter of 2017, gross job losses represented 6.1 percent of private-sector employment. Gross job losses are the result of contractions in employment at existing establishments and the loss of jobs at closing establishments. Contracting establishments lost 6.1 million jobs in the third quarter of 2017, an increase of 203,000 jobs from the prior quarter. In the third quarter of 2017, closing establishments lost 1.3 million jobs, an increase of 65,000 jobs from the previous quarter. (See charts 2 and 3, and tables A, 1, 2, and 3.)
Gross Job Gains In the third quarter of 2017, gross job gains represented 6.0 percent of private-sector employment. Gross job gains are the sum of increases in employment due to expansions at existing establishments and the addition of new jobs at opening establishments. Gross job gains at expanding establishments totaled 5.9 million in the third quarter of 2017, a decrease of 311,000 compared to the previous quarter. Opening establishments accounted for 1.3 million of the jobs gained in the third quarter of 2017, a decrease of 37,000 jobs from the previous quarter. (See charts 2 and 3, and tables A, 1, 2, and 3.)
Establishment Births and Deaths In the third quarter of 2017, the number of establishment births (a subset of the openings data) increased by 1,000, to a total of 240,000 establishments. These new establishments accounted for 837,000 jobs, a decrease of 9,000 jobs from the previous quarter. Data for establishment deaths (a subset of the closings data) are available through the fourth quarter of 2016, when 729,000 jobs were lost at 217,000 establishments, a decrease of 20,000 jobs from the third quarter of 2016. (See Technical Note and table 8.)
Industries Gross job losses exceeded gross job gains in 9 of 13 industries in the third quarter of 2017. The service-providing industries experienced a net job decrease of 71,000 jobs in the third quarter of 2017. Within service-providing industries, leisure and hospitality had the largest over-the-quarter net job decrease, with a loss of 147,000 jobs. The net job decrease in leisure and hospitality was the result of 1.4 million gross job losses and offset by 1.3 million gross job gains. The education and health services industry had the largest net job increase over the quarter, with a gain of 78,000 jobs. The goods-producing industries experienced a net job decrease of 69,000 jobs in the third quarter of 2017. Of the goods-producing industries, construction lost 49,000 jobs, manufacturing lost 31,000 jobs, and natural resources and mining added 11,000 jobs. (See table 3.)
Expansions
Contractions
4,000
5,000
6,000
7,000
8,000
'07 '08 '09 '10 '11 '12 '13 '14 '15 '16 '17
Chart 2. Private sector gross job gains at expanding establishments and gross job losses at contracting establishments, seasonally adjusted: March 2007-September 2017 Thousands
NOTE: Shaded area represents NBER defined recession period.
Openings
Closings1,100
1,200
1,300
1,400
1,500
1,600
'07 '08 '09 '10 '11 '12 '13 '14 '15 '16 '17
Chart 3. Private sector gross job gains at opening establishments and gross job losses at closing establishments, seasonally adjusted: March 2007-September 2017Thousands
NOTE: Shaded area represents NBER defined recession period.
- 3 -
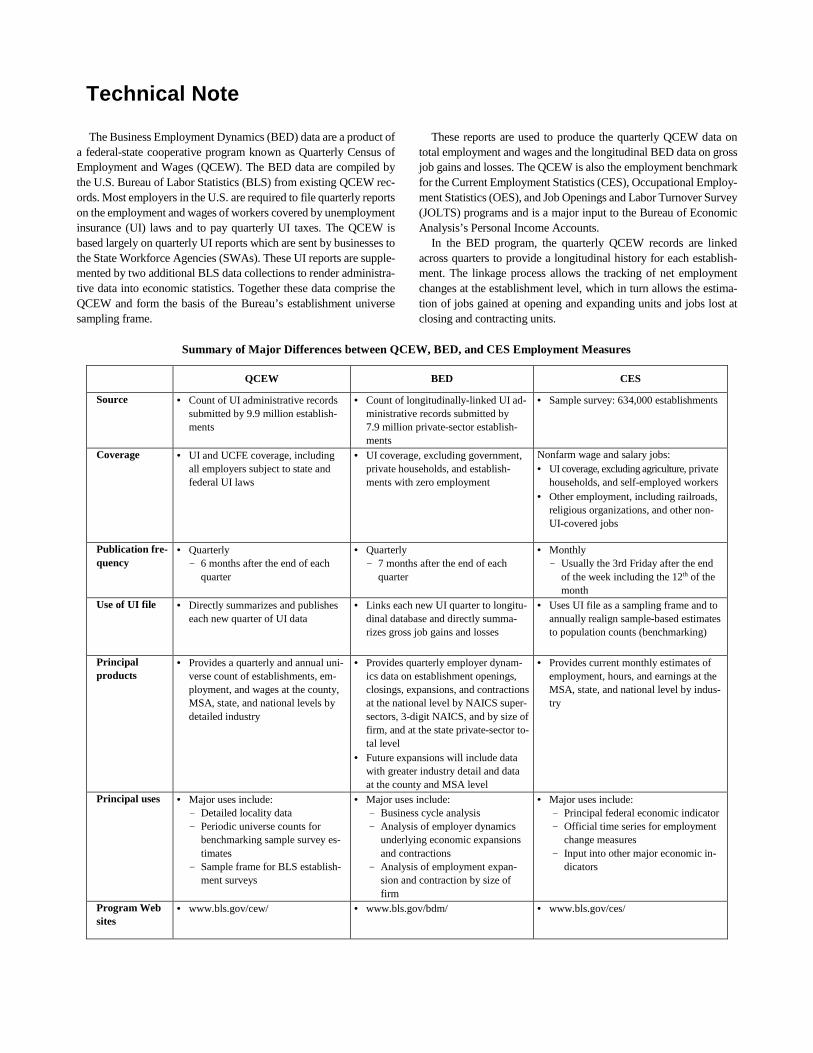
Table A. Three-month private sector gross job gains and losses, seasonally adjusted
Category
3 months ended
Sept. Dec. Mar. June Sept.
2016 2016 2017 2017 2017
Levels (in thousands)
Gross job gains................................... 7,689 7,455 7,328 7,604 7,256
At expanding establishments...... 6,232 6,040 6,019 6,246 5,935
At opening establishments.......... 1,457 1,415 1,309 1,358 1,321
Gross job losses................................. 7,008 7,065 6,674 7,128 7,396
At contracting establishments.... 5,760 5,760 5,521 5,879 6,082
At closing establishments........... 1,248 1,305 1,153 1,249 1,314
Net employment change1.................. 681 390 654 476 -140
Rates (percent)
Gross job gains................................... 6.4 6.2 6.0 6.2 6.0
At expanding establishments...... 5.2 5.0 4.9 5.1 4.9
At opening establishments.......... 1.2 1.2 1.1 1.1 1.1
Gross job losses................................. 5.8 5.9 5.4 5.8 6.1
At contracting establishments.... 4.8 4.8 4.5 4.8 5.0
At closing establishments........... 1.0 1.1 0.9 1.0 1.1
Net employment change1.................. 0.6 0.3 0.6 0.4 -0.1 1 The net employment change is the difference between total gross job gains and total gross job losses. See the Technical Note for further information.
Firm Size In the third quarter of 2017, firms with 1-49 employees had a net employment decrease of 176,000. Firms with 50-249 employees had a net employment decrease of 57,000. Firms with 250 or more employees had a net employment increase of 36,000. Of the 1.3 million net jobs created over the last four quarters, firms with 1-49 employees contributed 32.0 percent of net job growth, firms with 50-249 employees contributed 26.0 percent, and firms with 250 or more employees contributed 42.0 percent. (See tables 4 and 5.)
States Gross job losses exceeded gross job gains in 27 states, Puerto Rico, and the Virgin Islands, in the third quarter of 2017. Alaska had the highest rate of gross job losses as a percent of employment at 10.5 percent, above the national rate of 6.1 percent. Pennsylvania and Tennessee had the lowest rate of gross job losses as a percent of employment at 5.2 percent. Wyoming had the highest rate of gross job gains as a percent of employment at 8.7 percent, above the national rate of 6.0 percent. Puerto Rico had the lowest rate of gross job gains as a percent of employment at 4.1 percent. (See tables 6 and 7.)

- 4 -
Effects of Hurricanes Irma and Maria on the Business Employment Dynamics
Hurricanes Irma and Maria made landfall in the United States on September 7 and September 20, 2017, respectively, during the BED third quarter reference period. These events did not cause changes to BED methodology. However, they did affect data collection in Puerto Rico and the Virgin Islands. For more information, please visit the Quarterly Census of Employment and Wages (QCEW) section of the following webpage: www.bls.gov/bls/hurricanes-harvey-irma-maria.htm.
For More Information Additional information on gross job gains and gross job losses is available online at www.bls.gov/bdm. This information includes data on the levels and rates of gross job gains and gross job losses by firm size, not seasonally adjusted data and other seasonally adjusted time series not presented in this release, charts of gross job gains and gross job losses by industry and firm size, and frequently asked questions on firm size data. Additional information about the Business Employment Dynamics data can be found in the Technical Note of this release or can be obtained by emailing [email protected].
The Business Employment Dynamics for Fourth Quarter 2017 are scheduled to be released on Wednesday, July 25, 2018 at 10:00 a.m. (EDT).
Technical Note
The Business Employment Dynamics (BED) data are a product of a federal-state cooperative program known as Quarterly Census of Employment and Wages (QCEW). The BED data are compiled by the U.S. Bureau of Labor Statistics (BLS) from existing QCEW rec-ords. Most employers in the U.S. are required to file quarterly reports on the employment and wages of workers covered by unemployment insurance (UI) laws and to pay quarterly UI taxes. The QCEW is based largely on quarterly UI reports which are sent by businesses to the State Workforce Agencies (SWAs). These UI reports are supple-mented by two additional BLS data collections to render administra-tive data into economic statistics. Together these data comprise the QCEW and form the basis of the Bureau’s establishment universe sampling frame.
These reports are used to produce the quarterly QCEW data on total employment and wages and the longitudinal BED data on gross job gains and losses. The QCEW is also the employment benchmark for the Current Employment Statistics (CES), Occupational Employ-ment Statistics (OES), and Job Openings and Labor Turnover Survey (JOLTS) programs and is a major input to the Bureau of Economic Analysis’s Personal Income Accounts.
In the BED program, the quarterly QCEW records are linked across quarters to provide a longitudinal history for each establish-ment. The linkage process allows the tracking of net employment changes at the establishment level, which in turn allows the estima-tion of jobs gained at opening and expanding units and jobs lost at closing and contracting units.
Summary of Major Differences between QCEW, BED, and CES Employment Measures
QCEW BED CES
Source · Count of UI administrative recordssubmitted by 9.9 million establish-ments
· Count of longitudinally-linked UI ad-ministrative records submitted by 7.9 million private-sector establish-ments
· Sample survey: 634,000 establishments
Coverage · UI and UCFE coverage, including all employers subject to state andfederal UI laws
· UI coverage, excluding government, private households, and establish-ments with zero employment
Nonfarm wage and salary jobs: · UI coverage, excluding agriculture, private
households, and self-employed workers · Other employment, including railroads,
religious organizations, and other non-UI-covered jobs
Publication fre-quency
· Quarterly — 6 months after the end of each
quarter
· Quarterly — 7 months after the end of each
quarter
· Monthly — Usually the 3rd Friday after the end
of the week including the 12th of the month
Use of UI file · Directly summarizes and publisheseach new quarter of UI data
· Links each new UI quarter to longitu-dinal database and directly summa-rizes gross job gains and losses
· Uses UI file as a sampling frame and toannually realign sample-based estimatesto population counts (benchmarking)
Principal products
· Provides a quarterly and annual uni-verse count of establishments, em-ployment, and wages at the county,MSA, state, and national levels by detailed industry
· Provides quarterly employer dynam-ics data on establishment openings,closings, expansions, and contractions at the national level by NAICS super-sectors, 3-digit NAICS, and by size offirm, and at the state private-sector to-tal level
· Future expansions will include datawith greater industry detail and dataat the county and MSA level
· Provides current monthly estimates ofemployment, hours, and earnings at the MSA, state, and national level by indus-try
Principal uses · Major uses include: — Detailed locality data— Periodic universe counts for
benchmarking sample survey es-timates
— Sample frame for BLS establish-ment surveys
· Major uses include: — Business cycle analysis— Analysis of employer dynamics
underlying economic expansions and contractions
— Analysis of employment expan-sion and contraction by size of firm
· Major uses include: — Principal federal economic indicator — Official time series for employment
change measures — Input into other major economic in-
dicators
Program Web sites
· www.bls.gov/cew/ · www.bls.gov/bdm/ · www.bls.gov/ces/
Differences between QCEW, BED, and CES employment measures
The Bureau publishes three different establishment-based employ-ment measures for any given quarter. Each of these measures—Quar-terly Census of Employment and Wages (QCEW), Business Employ-ment Dynamics (BED), and Current Employment Statistics (CES)—makes use of the quarterly UI employment reports in producing data; however, each measure has a somewhat different universe coverage, estimation procedure, and publication product.
Differences in coverage and estimation methods can result in some-what different measures of employment change over time. It is im-portant to understand program differences and the intended uses of the program products. (See table.) Additional information on each pro-gram can be obtained from the program websites shown in the table.
Coverage Employment and wage data for workers covered by state UI and
Unemployment Compensation for Federal Employees (UCFE) laws are compiled from quarterly contribution reports submitted to the SWAs by employers. In addition to the quarterly contribution reports, employers who operate multiple establishments within a state com-plete a questionnaire, called the “Multiple Worksite Report,” which provides detailed information on the location of their establishments. These reports are based on place of employment rather than place of residence. UI and UCFE coverage is broad and basically comparable from state to state.
Major exclusions from UI coverage are self-employed workers, re-ligious organizations, most agricultural workers on small farms, all members of the Armed Forces, elected officials in most states, most employees of railroads, some domestic workers, most student workers at schools, and employees of certain small nonprofit organizations. Gross job gains and gross job losses in this release are derived from longitudinal histories of 7.9 million private sector employer reports out of 9.9 million total reports of employment and wages submitted by states to BLS in the first quarter of 2017. Gross job gains and gross job losses data in this release do not report estimates for government employees or private households (NAICS 814110) and do not include establishments with zero employment in both previous and current quarters. Data from Puerto Rico and the Virgin Islands are also ex-cluded from the national data. The table below shows, in millions of establishments, the number of establishments excluded from the na-tional gross job gains and gross job losses data in the first quarter 2017.
Number of active establishments included in Business Employment Dynamics data at the national level
Millions Total establishments QCEW program………. 9.9
Excluded: Public sector………………….. 0.3 Private households…………… 0.2 Zero employment…………….. 1.5
Total establishments included in Business Employment Dynamics data………………...7.9
Unit of analysis Establishments are used in the tabulation of the BED statistics by
industry and firms are used in the tabulation of the BED size class statistics. An establishment is defined as an economic unit that pro-duces goods or services, usually at a single physical location, and en-gages in one or predominantly one activity. A firm is a legal business, either corporate or otherwise, and may consist of several establish-ments. Firm-level data are compiled based on an aggregation of estab-lishments under common ownership by a corporate parent using em-ployer tax identification numbers. The firm level aggregation which is consistent with the role of corporations as the economic decision makers are used for the measurement of the BED data elements by size class.
Because of the difference in the unit of analysis, total gross job gains and gross job losses by size class are lower than total gross job gains and gross job losses by industry, as some establishment gains and losses within a firm are offset during the aggregation process. However, the total net changes in employment are the same for not seasonally adjusted data and are similar for seasonally adjusted data.
Concepts and methodology The Business Employment Dynamics data measure the net change
in employment at the establishment or firm level. These changes come about in one of four ways. A net increase in employment can come from either opening units or expanding units. A net decrease in em-ployment can come from either closing units or contracting units. Gross job gains include the sum of all jobs added at either opening or expanding units. Gross job losses include the sum of all jobs lost in either closing or contracting units. The net change in employment is the difference between gross job gains and gross job losses.
The formal definitions of employment changes are as follows: Openings. These are either units with positive third month employ-
ment for the first time in the current quarter, with no links to the prior quarter, or with positive third month employment in the current quar-ter following zero employment in the previous quarter.
Expansions. These are units with positive employment in the third month in both the previous and current quarters, with a net increase in employment over this period.
Closings. These are either units with positive third month employ-ment in the previous quarter, with no employment or zero employ-ment reported in the current quarter.
Contractions. These are units with positive employment in the third month in both the previous and current quarters, with a net decrease in employment over this period.
Births. These are units with positive third month employment for the first time in the current quarter with no links to the prior quarter, or units with positive third month employment in the current quarter and zero employment in the third month of the previous four quarters. Births are a subset of openings not including re-openings of seasonal businesses.
Deaths. These are units with no employment or zero employment reported in the third month of four consecutive quarters following the last quarter with positive employment. Deaths are a subset of closings not including temporary shutdowns of seasonal businesses. A unit that closes during the quarter may be a death, but we wait three quarters to determine whether it is a permanent closing or a temporary shutdown. Therefore, there is always a lag of three quarters for the publication of death statistics.
All employment changes are measured from the third month of the previous quarter to the third month of the current quarter. Not all es-tablishments and firms change their employment levels. Units with no change in employment count towards estimates of total employment, but not for levels of gross job gains and gross job losses.
Gross job gains and gross job losses are expressed as rates by di-viding their levels by the average of employment in the current and previous quarters. This provides a symmetric growth rate. The rates are calculated for the components of gross job gains and gross job losses and then summed to form their respective totals. These rates can be added and subtracted just as their levels can. For instance, the difference between the gross job gains rate and the gross job losses rate is the net growth rate.
Establishment Births and Deaths For the purpose of BED statistics, births are defined as establish-
ments that appear in the longitudinal database for the first time with positive employment in the third month of a quarter, or showed four consecutive quarters of zero employment in the third month followed by a quarter in which it shows positive employment in the third month. Similarly, deaths are defined as establishments that either drop out of the longitudinal database or an establishment that had positive em-ployment in the third month of a given quarter followed by four con-secutive quarters of showing zero employment in the third month. Alt-hough the data for establishment births and deaths are tabulated inde-pendently from the data for openings and closings, the concepts are not mutually exclusive. An establishment that is defined as a birth in a given quarter is necessarily an opening as well, and an establishment defined as a death in a quarter must also be a closing. Since openings include seasonal and other re-openings and closings include tempo-rary shutdowns, the not seasonally adjusted values for births and deaths must be less than those for openings and closings. However, because some BED series do not have many re-openings or temporary shutdowns, as well as the fact that births and deaths are independently seasonally adjusted from openings and closings, there may be in-stances in which the seasonally adjusted value of the former is greater than the latter.
Linkage methodology Prior to the measurement of gross job gains and gross job losses,
QCEW records are linked across two quarters. The linkage process matches establishments' unique SWA identification numbers (SWA-ID). Between 95 and 97 percent of establishments identified as con-tinuous from quarter to quarter are matched by SWA-ID. The rest are linked in one of three ways. The first method uses predecessor and successor information, identified by the states, which relates records with different SWA-IDs across quarters. Predecessor and successor relations can come about for a variety of reasons, including a change in ownership, a firm restructuring, or a UI account restructuring. If a match cannot be attained in this manner, a probability-based match is used. This match attempts to identify two establishments with differ-ent SWA-IDs as continuous. The match is based upon comparisons such as the same name, address, and phone number. Third, an analyst examines unmatched records individually and makes a possible match.
In order to ensure the highest possible quality of data, SWAs verify with employers and update, if necessary, the industry, location, and ownership classification of all establishments on a 3-year cycle. Changes in establishment classification codes resulting from the veri-
fication process are introduced with the data reported for the first quar-ter of the year. Changes resulting from improved employer reporting also are introduced in the first quarter.
Sizing methodology The method of dynamic sizing is used in calculations for the BED
size class data series. Dynamic sizing allocates each firm’s employ-ment gain or loss during a quarter to each respective size class in which the change occurred. For example, if a firm grew from 2 em-ployees in quarter 1 to 38 employees in quarter 2, then, of the 36-em-ployee increase, 2 would be allocated to the first size class, 5 to the size class 5 to 9, 10 to size class 10 to 19, and 19 to size class 20 to 49.
Dynamic sizing provides symmetrical firm-size estimates and elim-inates any systematic effects which may be caused by the transitory and reverting changes in firms’ sizes over time. Additionally, it allo-cates each job gain or loss to the actual size class where it occurred.
Annual Data The annual gross job gains and gross job losses measure the net
change in employment at the establishment level from the third month of a quarter in the previous year to the third month of the same quarter in the current year. The BLS publishes annual BED data based on March-to-March changes once a year with the release of the first quar-ter BED data. The annual data based on over-the-year changes for other quarters of the year are available upon request. The definitions and methodology in measuring annual gross job gains and gross job losses are similar to the quarterly measures. The linkage method con-siders all predecessor and successor relations that may come about due to changes in ownership and corporate restructuring over the entire year. At the establishment level, some of the quarterly job gains and job losses are offset during the estimation over the year. Therefore, the sum of four quarters of gross job gains and gross job losses are not equal to annual gross job gains and gross job losses. The net change in employment over the year, however, is equal to the sum of four quarterly net changes on a not seasonally adjusted basis.
Seasonal adjustment Over the course of a year, the levels of employment and the associ-
ated job flows undergo sharp fluctuations due to such seasonal events as changes in the weather, reduced or expanded production, harvests, major holidays, and the opening and closing of schools. The effect of such seasonal variation can be very large.
Because these seasonal events follow a more or less regular pattern each year, their influence can be eliminated by adjusting these statis-tics from quarter to quarter. These adjustments make nonseasonal de-velopments, such as declines in economic activity, easier to recognize. For example, the large number of youths taking summer jobs is likely to obscure other changes that have taken place in June relative to March, making it difficult to determine if the level of economic activ-ity has risen or declined. However, because the effect of students fin-ishing school in previous years is known, the statistics for the current year can be adjusted to allow for a comparable change. The adjusted figures provide a more useful tool with which to analyze changes in economic activity.
The employment data series for opening, expanding, closing, and contracting units are independently seasonally adjusted; net changes are calculated based on the difference between gross job gains and gross job losses. Similarly, for industry data, the establishment counts data series for opening, expanding, closing, and contracting establish-ments are independently adjusted, and the net changes are calculated
based on the difference between the number of opening and closing establishments. Additionally establishment and employment levels are independently seasonally adjusted to calculate the seasonally ad-justed rates. Concurrent seasonal adjustment is run using X-13 ARIMA-SEATS. Seasonally adjusted data series for total private are the sum of seasonally adjusted data of all sectors including the unclas-sified sector, which is not separately published.
The net over-the-quarter change derived by summing the BED component series will differ from the net employment change esti-mated from the seasonally adjusted total private employment series from the CES program. The intended use of BED statistics is to show the dynamic labor market changes that underlie the net employment change statistic. As such, data users interested particularly in the net employment change and not in the gross job flows underlying this change should refer to CES data for over-the-quarter net employment changes.
Reliability of the data Since the data series on Business Employment Dynamics are based
on administrative rather than sample data, there are no issues related to sampling error. Nonsampling error, however, still exists. Nonsam-pling errors can occur for many reasons, such as the employer submit-ting corrected employment data after the end of the quarter or typo-graphical errors made by businesses when providing information. Such errors, however, are likely to be distributed randomly throughout the dataset.
Changes in administrative data sometimes create complications for the linkage process. This can result in overstating openings and clos-
ings while understating expansions and contractions. The BLS contin-ues to refine methods for improving the linkage process to alleviate the effects of these complications.
The BED data series are subject to periodic minor changes based on corrections in QCEW records, updates on predecessors and succes-sors information, and seasonal adjustment revisions.
Annual revisions are published each year with the release of the first quarter data. These revisions cover the last four quarters of not seasonally adjusted data and 5 years of seasonally adjusted data.
Additional statistics and other information Several other programs within BLS produce closely related infor-
mation. The QCEW program provides both quarterly and annual esti-mates of employment by state, county, and detailed industry. News releases on quarterly county employment and wages and the annual bulletin also are available upon request from the Division of Admin-istrative Statistics and Labor Turnover (Quarterly Census of Employ-ment and Wages), telephone (202) 691-6567; (www.bls.gov/cew/); (e-mail: [email protected]).
The Current Employment Statistics (CES) program produces monthly estimates of employment, its net change, hours, and earnings by detailed industry. These estimates are part of the Employment Sit-uation report put out monthly by BLS.
The Job Openings and Labor Turnover Survey (JOLTS) program provides monthly measures of job openings, as well as employee hires and separations.
Information in this release will be made available to sensory im-paired individuals upon request. Voice phone: (202) 691-5200; TDD message referral phone number: 1 (800) 877-8339.
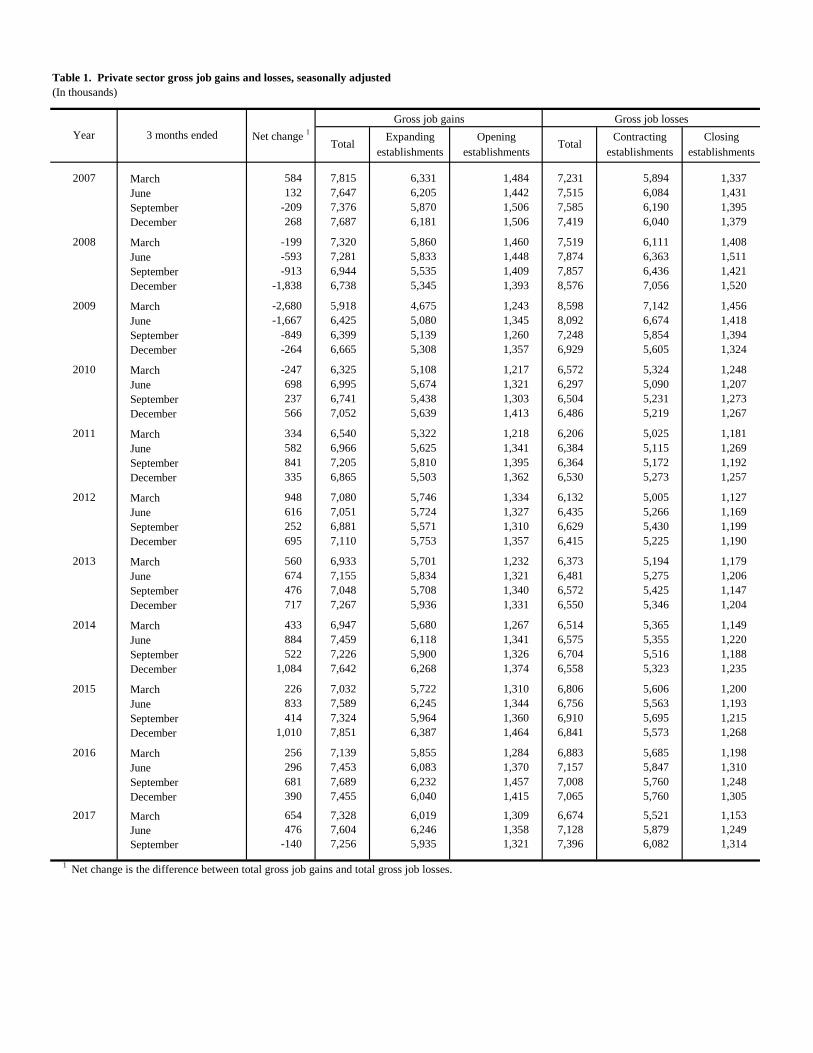
Table 1. Private sector gross job gains and losses, seasonally adjusted(In thousands)
Expanding Opening Contracting Closingestablishments establishments establishments establishments
2007 March 584 7,815 6,331 1,484 7,231 5,894 1,337June 132 7,647 6,205 1,442 7,515 6,084 1,431September -209 7,376 5,870 1,506 7,585 6,190 1,395December 268 7,687 6,181 1,506 7,419 6,040 1,379
2008 March -199 7,320 5,860 1,460 7,519 6,111 1,408June -593 7,281 5,833 1,448 7,874 6,363 1,511September -913 6,944 5,535 1,409 7,857 6,436 1,421December -1,838 6,738 5,345 1,393 8,576 7,056 1,520
2009 March -2,680 5,918 4,675 1,243 8,598 7,142 1,456June -1,667 6,425 5,080 1,345 8,092 6,674 1,418September -849 6,399 5,139 1,260 7,248 5,854 1,394December -264 6,665 5,308 1,357 6,929 5,605 1,324
2010 March -247 6,325 5,108 1,217 6,572 5,324 1,248June 698 6,995 5,674 1,321 6,297 5,090 1,207September 237 6,741 5,438 1,303 6,504 5,231 1,273December 566 7,052 5,639 1,413 6,486 5,219 1,267
2011 March 334 6,540 5,322 1,218 6,206 5,025 1,181June 582 6,966 5,625 1,341 6,384 5,115 1,269September 841 7,205 5,810 1,395 6,364 5,172 1,192December 335 6,865 5,503 1,362 6,530 5,273 1,257
2012 March 948 7,080 5,746 1,334 6,132 5,005 1,127June 616 7,051 5,724 1,327 6,435 5,266 1,169September 252 6,881 5,571 1,310 6,629 5,430 1,199December 695 7,110 5,753 1,357 6,415 5,225 1,190
2013 March 560 6,933 5,701 1,232 6,373 5,194 1,179June 674 7,155 5,834 1,321 6,481 5,275 1,206September 476 7,048 5,708 1,340 6,572 5,425 1,147December 717 7,267 5,936 1,331 6,550 5,346 1,204
2014 March 433 6,947 5,680 1,267 6,514 5,365 1,149June 884 7,459 6,118 1,341 6,575 5,355 1,220September 522 7,226 5,900 1,326 6,704 5,516 1,188December 1,084 7,642 6,268 1,374 6,558 5,323 1,235
2015 March 226 7,032 5,722 1,310 6,806 5,606 1,200June 833 7,589 6,245 1,344 6,756 5,563 1,193September 414 7,324 5,964 1,360 6,910 5,695 1,215December 1,010 7,851 6,387 1,464 6,841 5,573 1,268
2016 March 256 7,139 5,855 1,284 6,883 5,685 1,198June 296 7,453 6,083 1,370 7,157 5,847 1,310September 681 7,689 6,232 1,457 7,008 5,760 1,248December 390 7,455 6,040 1,415 7,065 5,760 1,305
2017 March 654 7,328 6,019 1,309 6,674 5,521 1,153June 476 7,604 6,246 1,358 7,128 5,879 1,249September -140 7,256 5,935 1,321 7,396 6,082 1,314
1 Net change is the difference between total gross job gains and total gross job losses.
Year 3 months ended Net change 1Gross job gains
Total Total
Gross job losses
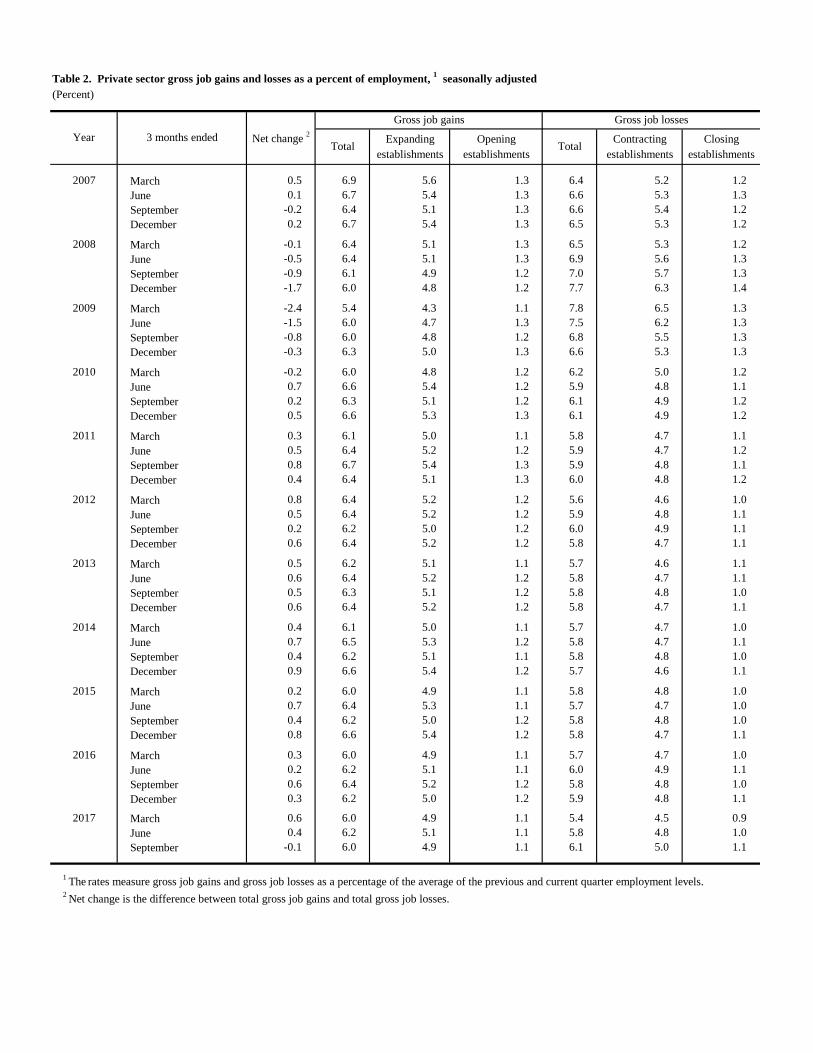
Table 2. Private sector gross job gains and losses as a percent of employment, 1 seasonally adjusted(Percent)
Expanding Opening Contracting Closingestablishments establishments establishments establishments
2007 March 0.5 6.9 5.6 1.3 6.4 5.2 1.2June 0.1 6.7 5.4 1.3 6.6 5.3 1.3September -0.2 6.4 5.1 1.3 6.6 5.4 1.2December 0.2 6.7 5.4 1.3 6.5 5.3 1.2
2008 March -0.1 6.4 5.1 1.3 6.5 5.3 1.2June -0.5 6.4 5.1 1.3 6.9 5.6 1.3September -0.9 6.1 4.9 1.2 7.0 5.7 1.3December -1.7 6.0 4.8 1.2 7.7 6.3 1.4
2009 March -2.4 5.4 4.3 1.1 7.8 6.5 1.3June -1.5 6.0 4.7 1.3 7.5 6.2 1.3September -0.8 6.0 4.8 1.2 6.8 5.5 1.3December -0.3 6.3 5.0 1.3 6.6 5.3 1.3
2010 March -0.2 6.0 4.8 1.2 6.2 5.0 1.2June 0.7 6.6 5.4 1.2 5.9 4.8 1.1September 0.2 6.3 5.1 1.2 6.1 4.9 1.2December 0.5 6.6 5.3 1.3 6.1 4.9 1.2
2011 March 0.3 6.1 5.0 1.1 5.8 4.7 1.1June 0.5 6.4 5.2 1.2 5.9 4.7 1.2September 0.8 6.7 5.4 1.3 5.9 4.8 1.1December 0.4 6.4 5.1 1.3 6.0 4.8 1.2
2012 March 0.8 6.4 5.2 1.2 5.6 4.6 1.0June 0.5 6.4 5.2 1.2 5.9 4.8 1.1September 0.2 6.2 5.0 1.2 6.0 4.9 1.1December 0.6 6.4 5.2 1.2 5.8 4.7 1.1
2013 March 0.5 6.2 5.1 1.1 5.7 4.6 1.1June 0.6 6.4 5.2 1.2 5.8 4.7 1.1September 0.5 6.3 5.1 1.2 5.8 4.8 1.0December 0.6 6.4 5.2 1.2 5.8 4.7 1.1
2014 March 0.4 6.1 5.0 1.1 5.7 4.7 1.0June 0.7 6.5 5.3 1.2 5.8 4.7 1.1September 0.4 6.2 5.1 1.1 5.8 4.8 1.0December 0.9 6.6 5.4 1.2 5.7 4.6 1.1
2015 March 0.2 6.0 4.9 1.1 5.8 4.8 1.0June 0.7 6.4 5.3 1.1 5.7 4.7 1.0September 0.4 6.2 5.0 1.2 5.8 4.8 1.0December 0.8 6.6 5.4 1.2 5.8 4.7 1.1
2016 March 0.3 6.0 4.9 1.1 5.7 4.7 1.0June 0.2 6.2 5.1 1.1 6.0 4.9 1.1September 0.6 6.4 5.2 1.2 5.8 4.8 1.0December 0.3 6.2 5.0 1.2 5.9 4.8 1.1
2017 March 0.6 6.0 4.9 1.1 5.4 4.5 0.9June 0.4 6.2 5.1 1.1 5.8 4.8 1.0September -0.1 6.0 4.9 1.1 6.1 5.0 1.1
1 The rates measure gross job gains and gross job losses as a percentage of the average of the previous and current quarter employment levels. 2 Net change is the difference between total gross job gains and total gross job losses.
Year 3 months ended Net change 2Gross job gains
Total Total
Gross job losses
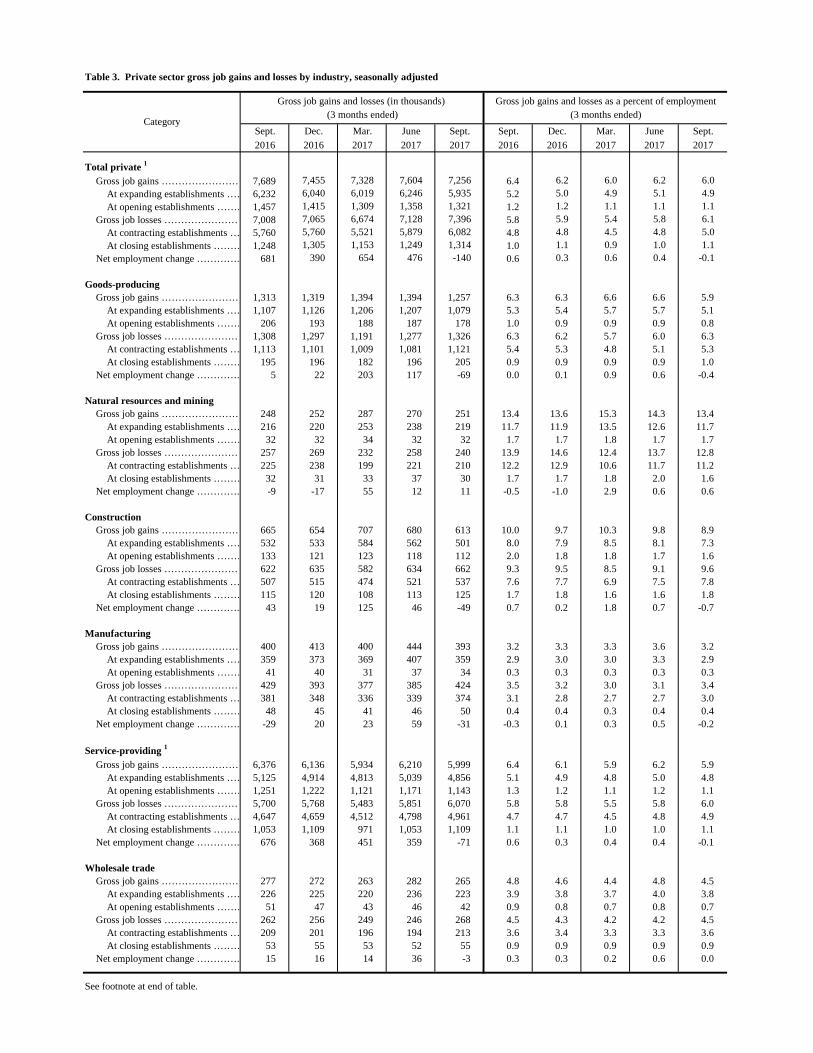
Table 3. Private sector gross job gains and losses by industry, seasonally adjusted
Sept. Dec. Mar. June Sept. Sept. Dec. Mar. June Sept.2016 2016 2017 2017 2017 2016 2016 2017 2017 2017
Total private 1
Gross job gains …………………… 7,689 7,455 7,328 7,604 7,256 6.4 6.2 6.0 6.2 6.0At expanding establishments …… 6,232 6,040 6,019 6,246 5,935 5.2 5.0 4.9 5.1 4.9At opening establishments ……… 1,457 1,415 1,309 1,358 1,321 1.2 1.2 1.1 1.1 1.1
Gross job losses …………………… 7,008 7,065 6,674 7,128 7,396 5.8 5.9 5.4 5.8 6.1At contracting establishments … 5,760 5,760 5,521 5,879 6,082 4.8 4.8 4.5 4.8 5.0At closing establishments ……… 1,248 1,305 1,153 1,249 1,314 1.0 1.1 0.9 1.0 1.1
Net employment change …………. 681 390 654 476 -140 0.6 0.3 0.6 0.4 -0.1
Goods-producingGross job gains …………………… 1,313 1,319 1,394 1,394 1,257 6.3 6.3 6.6 6.6 5.9
At expanding establishments …… 1,107 1,126 1,206 1,207 1,079 5.3 5.4 5.7 5.7 5.1At opening establishments ……… 206 193 188 187 178 1.0 0.9 0.9 0.9 0.8
Gross job losses …………………… 1,308 1,297 1,191 1,277 1,326 6.3 6.2 5.7 6.0 6.3At contracting establishments … 1,113 1,101 1,009 1,081 1,121 5.4 5.3 4.8 5.1 5.3At closing establishments ……… 195 196 182 196 205 0.9 0.9 0.9 0.9 1.0
Net employment change …………. 5 22 203 117 -69 0.0 0.1 0.9 0.6 -0.4
Natural resources and miningGross job gains …………………… 248 252 287 270 251 13.4 13.6 15.3 14.3 13.4
At expanding establishments …… 216 220 253 238 219 11.7 11.9 13.5 12.6 11.7At opening establishments ……… 32 32 34 32 32 1.7 1.7 1.8 1.7 1.7
Gross job losses …………………… 257 269 232 258 240 13.9 14.6 12.4 13.7 12.8At contracting establishments … 225 238 199 221 210 12.2 12.9 10.6 11.7 11.2At closing establishments ……… 32 31 33 37 30 1.7 1.7 1.8 2.0 1.6
Net employment change …………. -9 -17 55 12 11 -0.5 -1.0 2.9 0.6 0.6
ConstructionGross job gains …………………… 665 654 707 680 613 10.0 9.7 10.3 9.8 8.9
At expanding establishments …… 532 533 584 562 501 8.0 7.9 8.5 8.1 7.3At opening establishments ……… 133 121 123 118 112 2.0 1.8 1.8 1.7 1.6
Gross job losses …………………… 622 635 582 634 662 9.3 9.5 8.5 9.1 9.6At contracting establishments … 507 515 474 521 537 7.6 7.7 6.9 7.5 7.8At closing establishments ……… 115 120 108 113 125 1.7 1.8 1.6 1.6 1.8
Net employment change …………. 43 19 125 46 -49 0.7 0.2 1.8 0.7 -0.7
ManufacturingGross job gains …………………… 400 413 400 444 393 3.2 3.3 3.3 3.6 3.2
At expanding establishments …… 359 373 369 407 359 2.9 3.0 3.0 3.3 2.9At opening establishments ……… 41 40 31 37 34 0.3 0.3 0.3 0.3 0.3
Gross job losses …………………… 429 393 377 385 424 3.5 3.2 3.0 3.1 3.4At contracting establishments … 381 348 336 339 374 3.1 2.8 2.7 2.7 3.0At closing establishments ……… 48 45 41 46 50 0.4 0.4 0.3 0.4 0.4
Net employment change …………. -29 20 23 59 -31 -0.3 0.1 0.3 0.5 -0.2
Service-providing 1
Gross job gains …………………… 6,376 6,136 5,934 6,210 5,999 6.4 6.1 5.9 6.2 5.9At expanding establishments …… 5,125 4,914 4,813 5,039 4,856 5.1 4.9 4.8 5.0 4.8At opening establishments ……… 1,251 1,222 1,121 1,171 1,143 1.3 1.2 1.1 1.2 1.1
Gross job losses …………………… 5,700 5,768 5,483 5,851 6,070 5.8 5.8 5.5 5.8 6.0At contracting establishments … 4,647 4,659 4,512 4,798 4,961 4.7 4.7 4.5 4.8 4.9At closing establishments ……… 1,053 1,109 971 1,053 1,109 1.1 1.1 1.0 1.0 1.1
Net employment change …………. 676 368 451 359 -71 0.6 0.3 0.4 0.4 -0.1
Wholesale tradeGross job gains …………………… 277 272 263 282 265 4.8 4.6 4.4 4.8 4.5
At expanding establishments …… 226 225 220 236 223 3.9 3.8 3.7 4.0 3.8At opening establishments ……… 51 47 43 46 42 0.9 0.8 0.7 0.8 0.7
Gross job losses …………………… 262 256 249 246 268 4.5 4.3 4.2 4.2 4.5At contracting establishments … 209 201 196 194 213 3.6 3.4 3.3 3.3 3.6At closing establishments ……… 53 55 53 52 55 0.9 0.9 0.9 0.9 0.9
Net employment change …………. 15 16 14 36 -3 0.3 0.3 0.2 0.6 0.0
See footnote at end of table.
Category
Gross job gains and losses (in thousands) Gross job gains and losses as a percent of employment(3 months ended) (3 months ended)
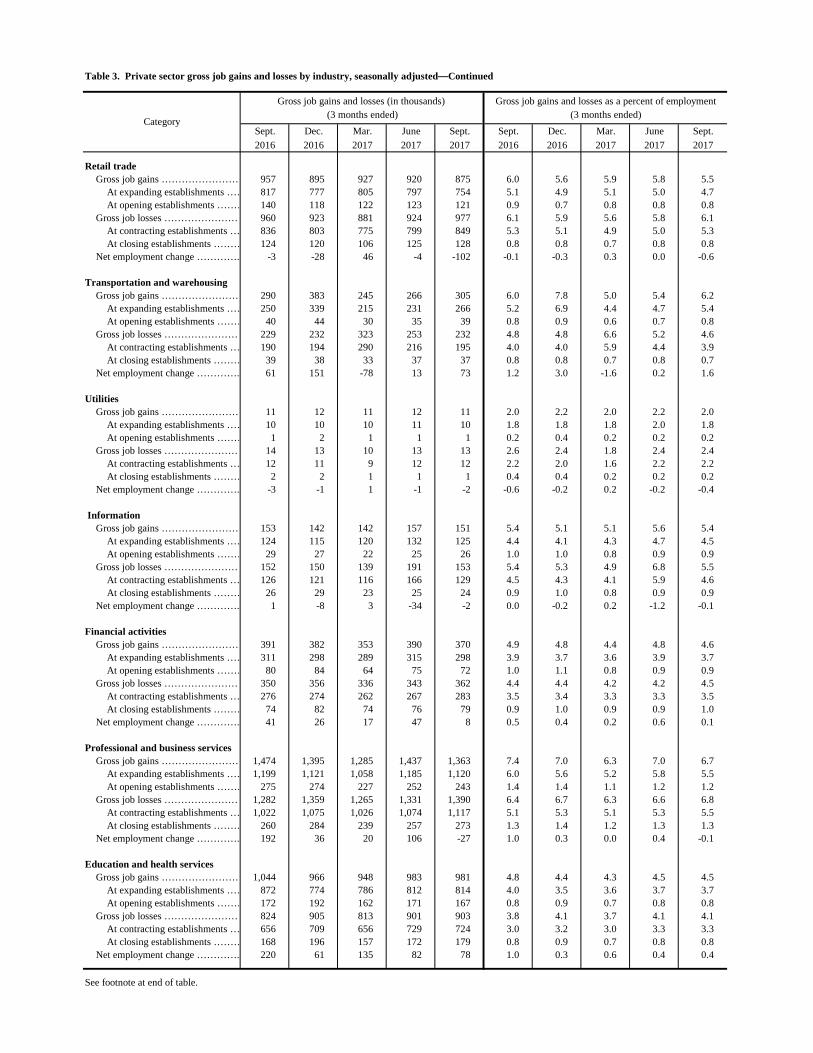
Table 3. Private sector gross job gains and losses by industry, seasonally adjusted—Continued
Sept. Dec. Mar. June Sept. Sept. Dec. Mar. June Sept.2016 2016 2017 2017 2017 2016 2016 2017 2017 2017
Retail tradeGross job gains …………………… 957 895 927 920 875 6.0 5.6 5.9 5.8 5.5
At expanding establishments …… 817 777 805 797 754 5.1 4.9 5.1 5.0 4.7At opening establishments ……… 140 118 122 123 121 0.9 0.7 0.8 0.8 0.8
Gross job losses …………………… 960 923 881 924 977 6.1 5.9 5.6 5.8 6.1At contracting establishments … 836 803 775 799 849 5.3 5.1 4.9 5.0 5.3At closing establishments ……… 124 120 106 125 128 0.8 0.8 0.7 0.8 0.8
Net employment change …………. -3 -28 46 -4 -102 -0.1 -0.3 0.3 0.0 -0.6
Transportation and warehousingGross job gains …………………… 290 383 245 266 305 6.0 7.8 5.0 5.4 6.2
At expanding establishments …… 250 339 215 231 266 5.2 6.9 4.4 4.7 5.4At opening establishments ……… 40 44 30 35 39 0.8 0.9 0.6 0.7 0.8
Gross job losses …………………… 229 232 323 253 232 4.8 4.8 6.6 5.2 4.6At contracting establishments … 190 194 290 216 195 4.0 4.0 5.9 4.4 3.9At closing establishments ……… 39 38 33 37 37 0.8 0.8 0.7 0.8 0.7
Net employment change …………. 61 151 -78 13 73 1.2 3.0 -1.6 0.2 1.6
UtilitiesGross job gains …………………… 11 12 11 12 11 2.0 2.2 2.0 2.2 2.0
At expanding establishments …… 10 10 10 11 10 1.8 1.8 1.8 2.0 1.8At opening establishments ……… 1 2 1 1 1 0.2 0.4 0.2 0.2 0.2
Gross job losses …………………… 14 13 10 13 13 2.6 2.4 1.8 2.4 2.4At contracting establishments … 12 11 9 12 12 2.2 2.0 1.6 2.2 2.2At closing establishments ……… 2 2 1 1 1 0.4 0.4 0.2 0.2 0.2
Net employment change …………. -3 -1 1 -1 -2 -0.6 -0.2 0.2 -0.2 -0.4
InformationGross job gains …………………… 153 142 142 157 151 5.4 5.1 5.1 5.6 5.4
At expanding establishments …… 124 115 120 132 125 4.4 4.1 4.3 4.7 4.5At opening establishments ……… 29 27 22 25 26 1.0 1.0 0.8 0.9 0.9
Gross job losses …………………… 152 150 139 191 153 5.4 5.3 4.9 6.8 5.5At contracting establishments … 126 121 116 166 129 4.5 4.3 4.1 5.9 4.6At closing establishments ……… 26 29 23 25 24 0.9 1.0 0.8 0.9 0.9
Net employment change …………. 1 -8 3 -34 -2 0.0 -0.2 0.2 -1.2 -0.1
Financial activitiesGross job gains …………………… 391 382 353 390 370 4.9 4.8 4.4 4.8 4.6
At expanding establishments …… 311 298 289 315 298 3.9 3.7 3.6 3.9 3.7At opening establishments ……… 80 84 64 75 72 1.0 1.1 0.8 0.9 0.9
Gross job losses …………………… 350 356 336 343 362 4.4 4.4 4.2 4.2 4.5At contracting establishments … 276 274 262 267 283 3.5 3.4 3.3 3.3 3.5At closing establishments ……… 74 82 74 76 79 0.9 1.0 0.9 0.9 1.0
Net employment change …………. 41 26 17 47 8 0.5 0.4 0.2 0.6 0.1
Professional and business servicesGross job gains …………………… 1,474 1,395 1,285 1,437 1,363 7.4 7.0 6.3 7.0 6.7
At expanding establishments …… 1,199 1,121 1,058 1,185 1,120 6.0 5.6 5.2 5.8 5.5At opening establishments ……… 275 274 227 252 243 1.4 1.4 1.1 1.2 1.2
Gross job losses …………………… 1,282 1,359 1,265 1,331 1,390 6.4 6.7 6.3 6.6 6.8At contracting establishments … 1,022 1,075 1,026 1,074 1,117 5.1 5.3 5.1 5.3 5.5At closing establishments ……… 260 284 239 257 273 1.3 1.4 1.2 1.3 1.3
Net employment change …………. 192 36 20 106 -27 1.0 0.3 0.0 0.4 -0.1
Education and health servicesGross job gains …………………… 1,044 966 948 983 981 4.8 4.4 4.3 4.5 4.5
At expanding establishments …… 872 774 786 812 814 4.0 3.5 3.6 3.7 3.7At opening establishments ……… 172 192 162 171 167 0.8 0.9 0.7 0.8 0.8
Gross job losses …………………… 824 905 813 901 903 3.8 4.1 3.7 4.1 4.1At contracting establishments … 656 709 656 729 724 3.0 3.2 3.0 3.3 3.3At closing establishments ……… 168 196 157 172 179 0.8 0.9 0.7 0.8 0.8
Net employment change …………. 220 61 135 82 78 1.0 0.3 0.6 0.4 0.4
See footnote at end of table.
Category
Gross job gains and losses (in thousands) Gross job gains and losses as a percent of employment(3 months ended) (3 months ended)
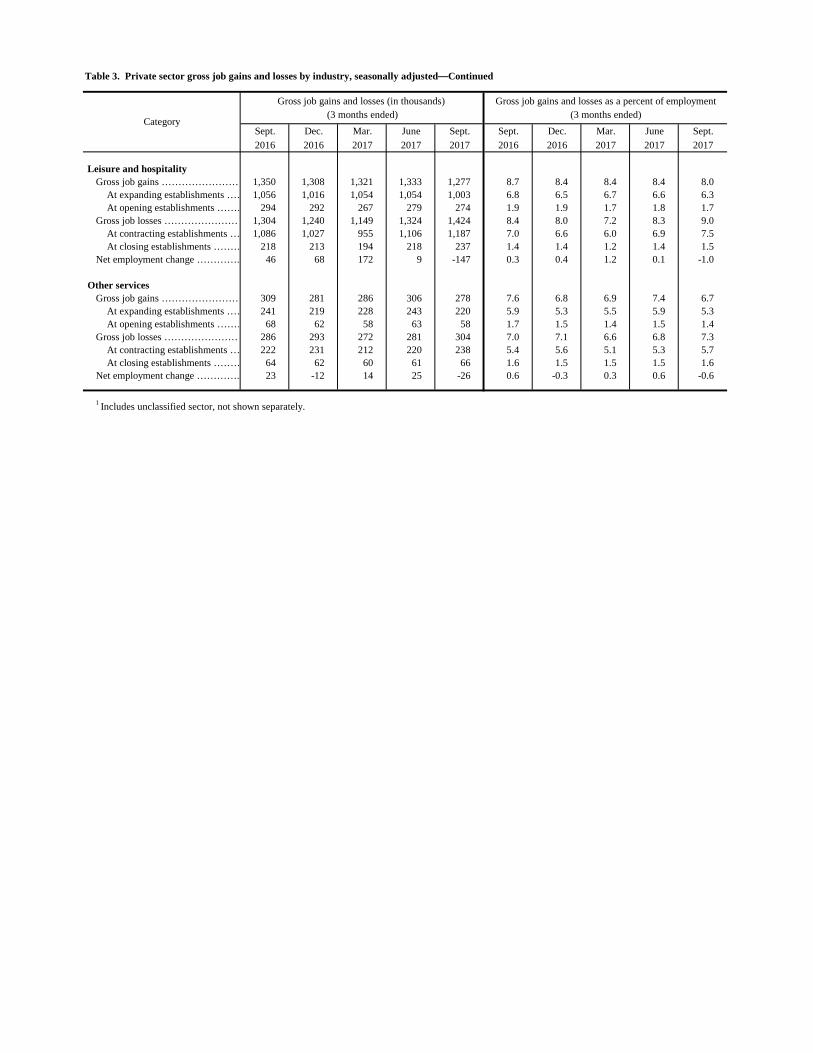
Table 3. Private sector gross job gains and losses by industry, seasonally adjusted—Continued
Sept. Dec. Mar. June Sept. Sept. Dec. Mar. June Sept.2016 2016 2017 2017 2017 2016 2016 2017 2017 2017
Leisure and hospitalityGross job gains …………………… 1,350 1,308 1,321 1,333 1,277 8.7 8.4 8.4 8.4 8.0
At expanding establishments …… 1,056 1,016 1,054 1,054 1,003 6.8 6.5 6.7 6.6 6.3At opening establishments ……… 294 292 267 279 274 1.9 1.9 1.7 1.8 1.7
Gross job losses …………………… 1,304 1,240 1,149 1,324 1,424 8.4 8.0 7.2 8.3 9.0At contracting establishments … 1,086 1,027 955 1,106 1,187 7.0 6.6 6.0 6.9 7.5At closing establishments ……… 218 213 194 218 237 1.4 1.4 1.2 1.4 1.5
Net employment change …………. 46 68 172 9 -147 0.3 0.4 1.2 0.1 -1.0
Other servicesGross job gains …………………… 309 281 286 306 278 7.6 6.8 6.9 7.4 6.7
At expanding establishments …… 241 219 228 243 220 5.9 5.3 5.5 5.9 5.3At opening establishments ……… 68 62 58 63 58 1.7 1.5 1.4 1.5 1.4
Gross job losses …………………… 286 293 272 281 304 7.0 7.1 6.6 6.8 7.3At contracting establishments … 222 231 212 220 238 5.4 5.6 5.1 5.3 5.7At closing establishments ……… 64 62 60 61 66 1.6 1.5 1.5 1.5 1.6
Net employment change …………. 23 -12 14 25 -26 0.6 -0.3 0.3 0.6 -0.6
1 Includes unclassified sector, not shown separately.
Category
Gross job gains and losses (in thousands) Gross job gains and losses as a percent of employment(3 months ended) (3 months ended)
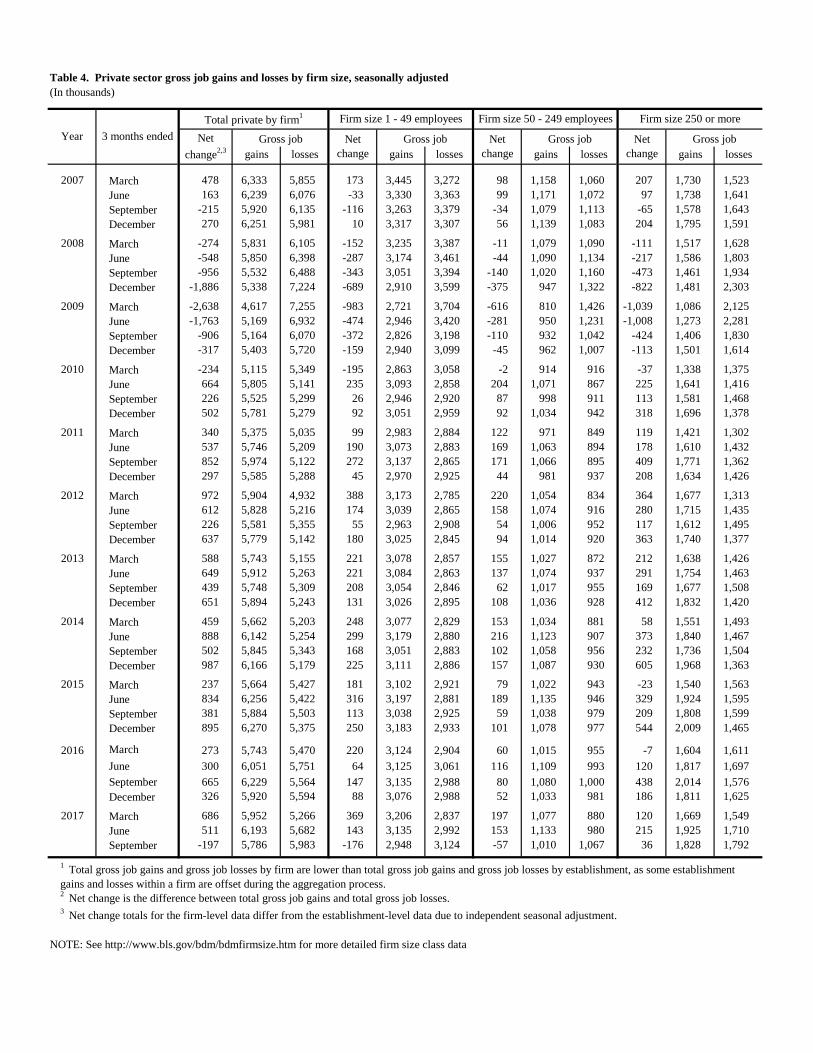
Table 4. Private sector gross job gains and losses by firm size, seasonally adjusted(In thousands)
gains losses gains losses gains losses gains losses
2007 March 478 6,333 5,855 173 3,445 3,272 98 1,158 1,060 207 1,730 1,523June 163 6,239 6,076 -33 3,330 3,363 99 1,171 1,072 97 1,738 1,641September -215 5,920 6,135 -116 3,263 3,379 -34 1,079 1,113 -65 1,578 1,643December 270 6,251 5,981 10 3,317 3,307 56 1,139 1,083 204 1,795 1,591
2008 March -274 5,831 6,105 -152 3,235 3,387 -11 1,079 1,090 -111 1,517 1,628June -548 5,850 6,398 -287 3,174 3,461 -44 1,090 1,134 -217 1,586 1,803September -956 5,532 6,488 -343 3,051 3,394 -140 1,020 1,160 -473 1,461 1,934December -1,886 5,338 7,224 -689 2,910 3,599 -375 947 1,322 -822 1,481 2,303
2009 March -2,638 4,617 7,255 -983 2,721 3,704 -616 810 1,426 -1,039 1,086 2,125June -1,763 5,169 6,932 -474 2,946 3,420 -281 950 1,231 -1,008 1,273 2,281September -906 5,164 6,070 -372 2,826 3,198 -110 932 1,042 -424 1,406 1,830December -317 5,403 5,720 -159 2,940 3,099 -45 962 1,007 -113 1,501 1,614
2010 March -234 5,115 5,349 -195 2,863 3,058 -2 914 916 -37 1,338 1,375June 664 5,805 5,141 235 3,093 2,858 204 1,071 867 225 1,641 1,416September 226 5,525 5,299 26 2,946 2,920 87 998 911 113 1,581 1,468December 502 5,781 5,279 92 3,051 2,959 92 1,034 942 318 1,696 1,378
2011 March 340 5,375 5,035 99 2,983 2,884 122 971 849 119 1,421 1,302June 537 5,746 5,209 190 3,073 2,883 169 1,063 894 178 1,610 1,432September 852 5,974 5,122 272 3,137 2,865 171 1,066 895 409 1,771 1,362December 297 5,585 5,288 45 2,970 2,925 44 981 937 208 1,634 1,426
2012 March 972 5,904 4,932 388 3,173 2,785 220 1,054 834 364 1,677 1,313June 612 5,828 5,216 174 3,039 2,865 158 1,074 916 280 1,715 1,435September 226 5,581 5,355 55 2,963 2,908 54 1,006 952 117 1,612 1,495December 637 5,779 5,142 180 3,025 2,845 94 1,014 920 363 1,740 1,377
2013 March 588 5,743 5,155 221 3,078 2,857 155 1,027 872 212 1,638 1,426June 649 5,912 5,263 221 3,084 2,863 137 1,074 937 291 1,754 1,463September 439 5,748 5,309 208 3,054 2,846 62 1,017 955 169 1,677 1,508December 651 5,894 5,243 131 3,026 2,895 108 1,036 928 412 1,832 1,420
2014 March 459 5,662 5,203 248 3,077 2,829 153 1,034 881 58 1,551 1,493June 888 6,142 5,254 299 3,179 2,880 216 1,123 907 373 1,840 1,467September 502 5,845 5,343 168 3,051 2,883 102 1,058 956 232 1,736 1,504December 987 6,166 5,179 225 3,111 2,886 157 1,087 930 605 1,968 1,363
2015 March 237 5,664 5,427 181 3,102 2,921 79 1,022 943 -23 1,540 1,563June 834 6,256 5,422 316 3,197 2,881 189 1,135 946 329 1,924 1,595September 381 5,884 5,503 113 3,038 2,925 59 1,038 979 209 1,808 1,599December 895 6,270 5,375 250 3,183 2,933 101 1,078 977 544 2,009 1,465
2016 March 273 5,743 5,470 220 3,124 2,904 60 1,015 955 -7 1,604 1,611June 300 6,051 5,751 64 3,125 3,061 116 1,109 993 120 1,817 1,697September 665 6,229 5,564 147 3,135 2,988 80 1,080 1,000 438 2,014 1,576December 326 5,920 5,594 88 3,076 2,988 52 1,033 981 186 1,811 1,625
2017 March 686 5,952 5,266 369 3,206 2,837 197 1,077 880 120 1,669 1,549June 511 6,193 5,682 143 3,135 2,992 153 1,133 980 215 1,925 1,710September -197 5,786 5,983 -176 2,948 3,124 -57 1,010 1,067 36 1,828 1,792
NOTE: See http://www.bls.gov/bdm/bdmfirmsize.htm for more detailed firm size class data
Gross job Net change
Gross job
3 Net change totals for the firm-level data differ from the establishment-level data due to independent seasonal adjustment.
Net change
Gross job Net change
Gross job
1 Total gross job gains and gross job losses by firm are lower than total gross job gains and gross job losses by establishment, as some establishment gains and losses within a firm are offset during the aggregation process. 2 Net change is the difference between total gross job gains and total gross job losses.
Year 3 months endedTotal private by firm1 Firm size 1 - 49 employees Firm size 50 - 249 employees Firm size 250 or more
Net change2,3
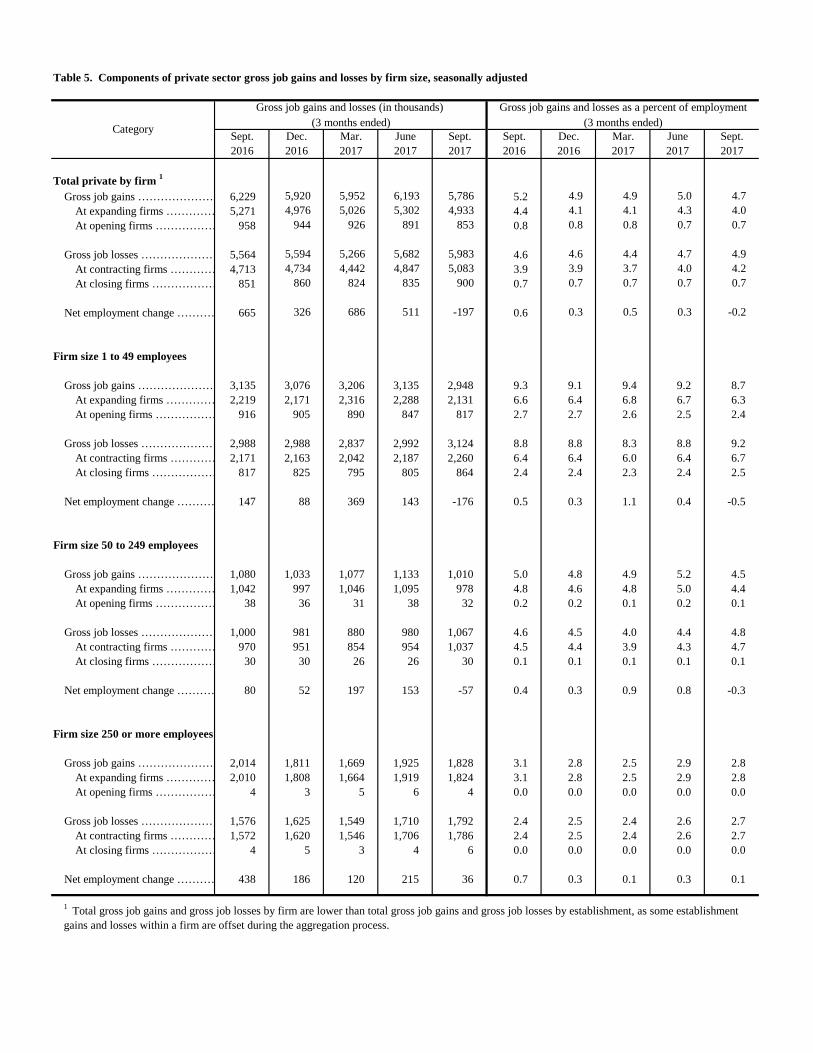
Table 5. Components of private sector gross job gains and losses by firm size, seasonally adjusted
Sept. Dec. Mar. June Sept. Sept. Dec. Mar. June Sept.2016 2016 2017 2017 2017 2016 2016 2017 2017 2017
Total private by firm 1
Gross job gains ………………… 6,229 5,920 5,952 6,193 5,786 5.2 4.9 4.9 5.0 4.7At expanding firms …………… 5,271 4,976 5,026 5,302 4,933 4.4 4.1 4.1 4.3 4.0At opening firms ……………… 958 944 926 891 853 0.8 0.8 0.8 0.7 0.7
Gross job losses ………………… 5,564 5,594 5,266 5,682 5,983 4.6 4.6 4.4 4.7 4.9At contracting firms ………… 4,713 4,734 4,442 4,847 5,083 3.9 3.9 3.7 4.0 4.2At closing firms ……………… 851 860 824 835 900 0.7 0.7 0.7 0.7 0.7
Net employment change ………… 665 326 686 511 -197 0.6 0.3 0.5 0.3 -0.2
Firm size 1 to 49 employees
Gross job gains ………………… 3,135 3,076 3,206 3,135 2,948 9.3 9.1 9.4 9.2 8.7At expanding firms …………… 2,219 2,171 2,316 2,288 2,131 6.6 6.4 6.8 6.7 6.3At opening firms ……………… 916 905 890 847 817 2.7 2.7 2.6 2.5 2.4
Gross job losses ………………… 2,988 2,988 2,837 2,992 3,124 8.8 8.8 8.3 8.8 9.2At contracting firms ………… 2,171 2,163 2,042 2,187 2,260 6.4 6.4 6.0 6.4 6.7At closing firms ……………… 817 825 795 805 864 2.4 2.4 2.3 2.4 2.5
Net employment change ………… 147 88 369 143 -176 0.5 0.3 1.1 0.4 -0.5
Firm size 50 to 249 employees
Gross job gains ………………… 1,080 1,033 1,077 1,133 1,010 5.0 4.8 4.9 5.2 4.5At expanding firms …………… 1,042 997 1,046 1,095 978 4.8 4.6 4.8 5.0 4.4At opening firms ……………… 38 36 31 38 32 0.2 0.2 0.1 0.2 0.1
Gross job losses ………………… 1,000 981 880 980 1,067 4.6 4.5 4.0 4.4 4.8At contracting firms ………… 970 951 854 954 1,037 4.5 4.4 3.9 4.3 4.7At closing firms ……………… 30 30 26 26 30 0.1 0.1 0.1 0.1 0.1
Net employment change ………… 80 52 197 153 -57 0.4 0.3 0.9 0.8 -0.3
Firm size 250 or more employees
Gross job gains ………………… 2,014 1,811 1,669 1,925 1,828 3.1 2.8 2.5 2.9 2.8At expanding firms …………… 2,010 1,808 1,664 1,919 1,824 3.1 2.8 2.5 2.9 2.8At opening firms ……………… 4 3 5 6 4 0.0 0.0 0.0 0.0 0.0
Gross job losses ………………… 1,576 1,625 1,549 1,710 1,792 2.4 2.5 2.4 2.6 2.7At contracting firms ………… 1,572 1,620 1,546 1,706 1,786 2.4 2.5 2.4 2.6 2.7At closing firms ……………… 4 5 3 4 6 0.0 0.0 0.0 0.0 0.0
Net employment change ………… 438 186 120 215 36 0.7 0.3 0.1 0.3 0.1
1 Total gross job gains and gross job losses by firm are lower than total gross job gains and gross job losses by establishment, as some establishment gains and losses within a firm are offset during the aggregation process.
Category
Gross job gains and losses (in thousands) Gross job gains and losses as a percent of employment(3 months ended) (3 months ended)
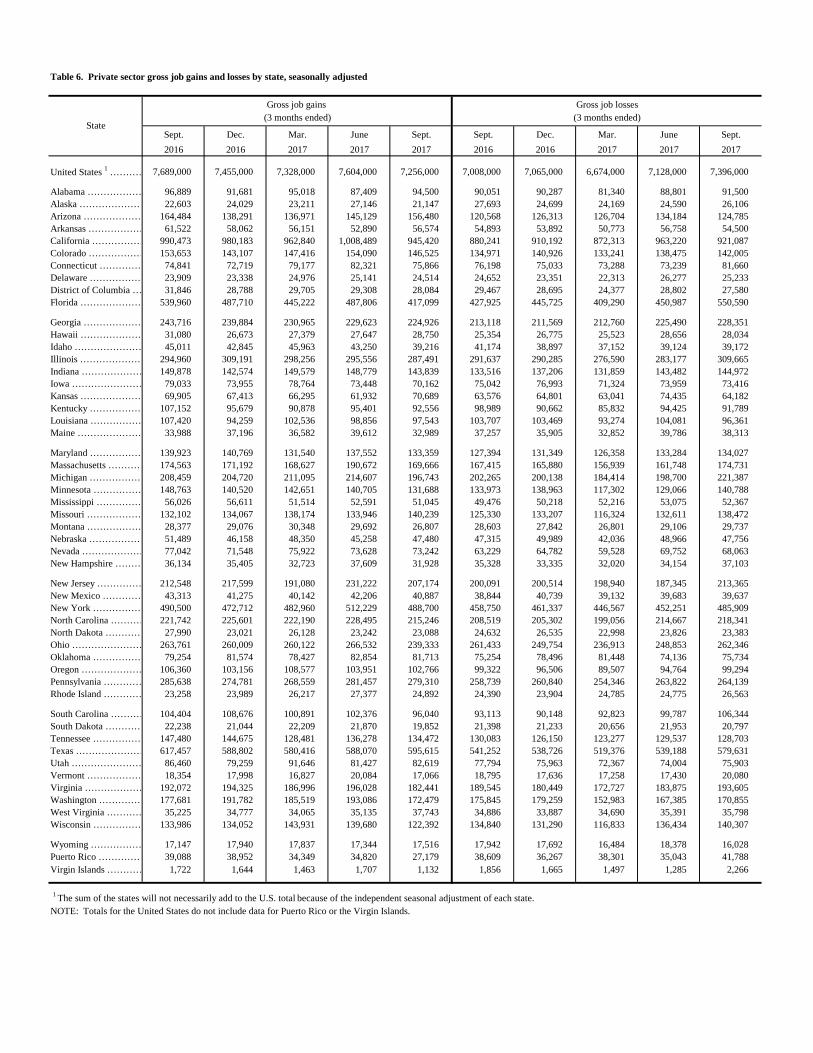
Table 6. Private sector gross job gains and losses by state, seasonally adjusted
Sept. Dec. Mar. June Sept. Sept. Dec. Mar. June Sept.2016 2016 2017 2017 2017 2016 2016 2017 2017 2017
United States 1 ………… 7,689,000 7,455,000 7,328,000 7,604,000 7,256,000 7,008,000 7,065,000 6,674,000 7,128,000 7,396,000
Alabama ……………… 96,889 91,681 95,018 87,409 94,500 90,051 90,287 81,340 88,801 91,500Alaska ………………… 22,603 24,029 23,211 27,146 21,147 27,693 24,699 24,169 24,590 26,106Arizona ……………… 164,484 138,291 136,971 145,129 156,480 120,568 126,313 126,704 134,184 124,785Arkansas ……………… 61,522 58,062 56,151 52,890 56,574 54,893 53,892 50,773 56,758 54,500California ……………… 990,473 980,183 962,840 1,008,489 945,420 880,241 910,192 872,313 963,220 921,087Colorado ……………… 153,653 143,107 147,416 154,090 146,525 134,971 140,926 133,241 138,475 142,005Connecticut …………… 74,841 72,719 79,177 82,321 75,866 76,198 75,033 73,288 73,239 81,660Delaware ……………… 23,909 23,338 24,976 25,141 24,514 24,652 23,351 22,313 26,277 25,233District of Columbia … 31,846 28,788 29,705 29,308 28,084 29,467 28,695 24,377 28,802 27,580Florida ………………… 539,960 487,710 445,222 487,806 417,099 427,925 445,725 409,290 450,987 550,590
Georgia ……………… 243,716 239,884 230,965 229,623 224,926 213,118 211,569 212,760 225,490 228,351Hawaii ………………… 31,080 26,673 27,379 27,647 28,750 25,354 26,775 25,523 28,656 28,034Idaho ………………… 45,011 42,845 45,963 43,250 39,216 41,174 38,897 37,152 39,124 39,172Illinois ………………… 294,960 309,191 298,256 295,556 287,491 291,637 290,285 276,590 283,177 309,665Indiana ………………… 149,878 142,574 149,579 148,779 143,839 133,516 137,206 131,859 143,482 144,972Iowa …………………… 79,033 73,955 78,764 73,448 70,162 75,042 76,993 71,324 73,959 73,416Kansas ………………… 69,905 67,413 66,295 61,932 70,689 63,576 64,801 63,041 74,435 64,182Kentucky ……………… 107,152 95,679 90,878 95,401 92,556 98,989 90,662 85,832 94,425 91,789Louisiana ……………… 107,420 94,259 102,536 98,856 97,543 103,707 103,469 93,274 104,081 96,361Maine ………………… 33,988 37,196 36,582 39,612 32,989 37,257 35,905 32,852 39,786 38,313
Maryland ……………… 139,923 140,769 131,540 137,552 133,359 127,394 131,349 126,358 133,284 134,027Massachusetts ………… 174,563 171,192 168,627 190,672 169,666 167,415 165,880 156,939 161,748 174,731Michigan ……………… 208,459 204,720 211,095 214,607 196,743 202,265 200,138 184,414 198,700 221,387Minnesota …………… 148,763 140,520 142,651 140,705 131,688 133,973 138,963 117,302 129,066 140,788Mississippi …………… 56,026 56,611 51,514 52,591 51,045 49,476 50,218 52,216 53,075 52,367Missouri ……………… 132,102 134,067 138,174 133,946 140,239 125,330 133,207 116,324 132,611 138,472Montana ……………… 28,377 29,076 30,348 29,692 26,807 28,603 27,842 26,801 29,106 29,737Nebraska ……………… 51,489 46,158 48,350 45,258 47,480 47,315 49,989 42,036 48,966 47,756Nevada ………………… 77,042 71,548 75,922 73,628 73,242 63,229 64,782 59,528 69,752 68,063New Hampshire ……… 36,134 35,405 32,723 37,609 31,928 35,328 33,335 32,020 34,154 37,103
New Jersey …………… 212,548 217,599 191,080 231,222 207,174 200,091 200,514 198,940 187,345 213,365New Mexico ………… 43,313 41,275 40,142 42,206 40,887 38,844 40,739 39,132 39,683 39,637New York …………… 490,500 472,712 482,960 512,229 488,700 458,750 461,337 446,567 452,251 485,909North Carolina ………… 221,742 225,601 222,190 228,495 215,246 208,519 205,302 199,056 214,667 218,341North Dakota ………… 27,990 23,021 26,128 23,242 23,088 24,632 26,535 22,998 23,826 23,383Ohio …………………… 263,761 260,009 260,122 266,532 239,333 261,433 249,754 236,913 248,853 262,346Oklahoma …………… 79,254 81,574 78,427 82,854 81,713 75,254 78,496 81,448 74,136 75,734Oregon ………………… 106,360 103,156 108,577 103,951 102,766 99,322 96,506 89,507 94,764 99,294Pennsylvania ………… 285,638 274,781 268,559 281,457 279,310 258,739 260,840 254,346 263,822 264,139Rhode Island ………… 23,258 23,989 26,217 27,377 24,892 24,390 23,904 24,785 24,775 26,563
South Carolina ………… 104,404 108,676 100,891 102,376 96,040 93,113 90,148 92,823 99,787 106,344South Dakota ………… 22,238 21,044 22,209 21,870 19,852 21,398 21,233 20,656 21,953 20,797Tennessee …………… 147,480 144,675 128,481 136,278 134,472 130,083 126,150 123,277 129,537 128,703Texas ………………… 617,457 588,802 580,416 588,070 595,615 541,252 538,726 519,376 539,188 579,631Utah …………………… 86,460 79,259 91,646 81,427 82,619 77,794 75,963 72,367 74,004 75,903Vermont ……………… 18,354 17,998 16,827 20,084 17,066 18,795 17,636 17,258 17,430 20,080Virginia ……………… 192,072 194,325 186,996 196,028 182,441 189,545 180,449 172,727 183,875 193,605Washington …………… 177,681 191,782 185,519 193,086 172,479 175,845 179,259 152,983 167,385 170,855West Virginia ………… 35,225 34,777 34,065 35,135 37,743 34,886 33,887 34,690 35,391 35,798Wisconsin …………… 133,986 134,052 143,931 139,680 122,392 134,840 131,290 116,833 136,434 140,307
Wyoming ……………… 17,147 17,940 17,837 17,344 17,516 17,942 17,692 16,484 18,378 16,028Puerto Rico …………… 39,088 38,952 34,349 34,820 27,179 38,609 36,267 38,301 35,043 41,788Virgin Islands ………… 1,722 1,644 1,463 1,707 1,132 1,856 1,665 1,497 1,285 2,266
1 The sum of the states will not necessarily add to the U.S. total because of the independent seasonal adjustment of each state.NOTE: Totals for the United States do not include data for Puerto Rico or the Virgin Islands.
State
Gross job gains Gross job losses(3 months ended) (3 months ended)
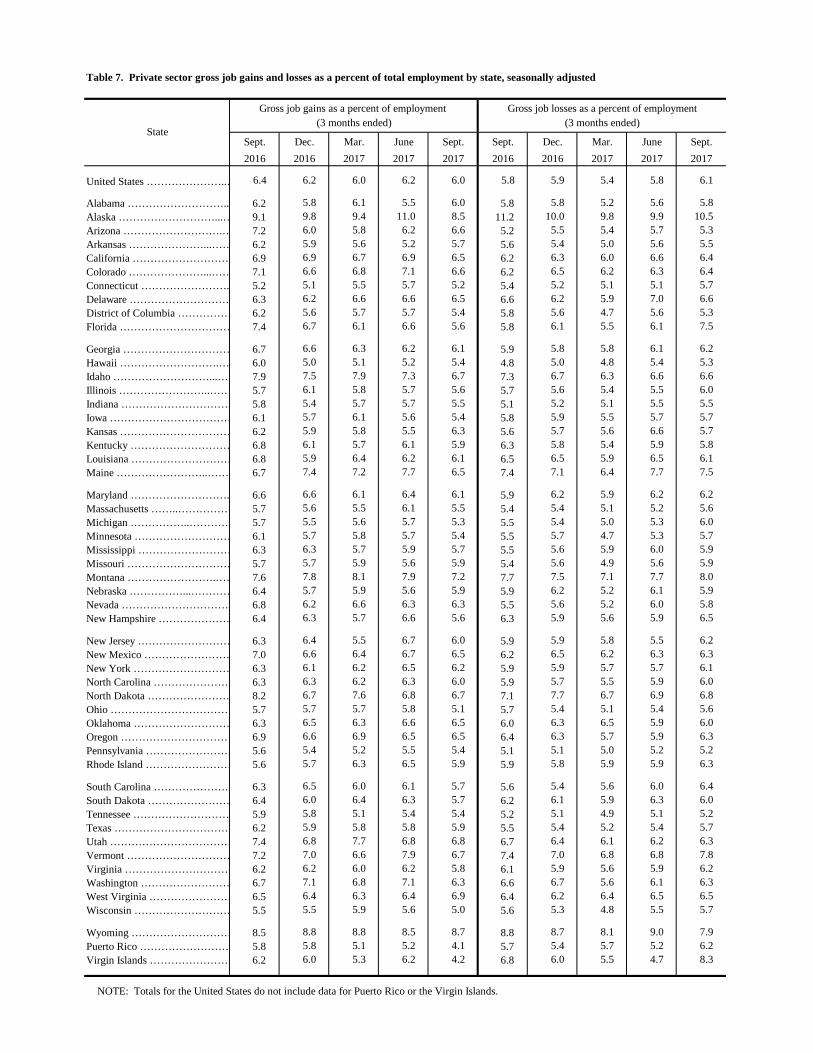
Table 7. Private sector gross job gains and losses as a percent of total employment by state, seasonally adjusted
Sept. Dec. Mar. June Sept. Sept. Dec. Mar. June Sept.2016 2016 2017 2017 2017 2016 2016 2017 2017 2017
United States …………………..… 6.4 6.2 6.0 6.2 6.0 5.8 5.9 5.4 5.8 6.1
Alabama ……………………….. 6.2 5.8 6.1 5.5 6.0 5.8 5.8 5.2 5.6 5.8Alaska ………………………...… 9.1 9.8 9.4 11.0 8.5 11.2 10.0 9.8 9.9 10.5Arizona ……………………….… 7.2 6.0 5.8 6.2 6.6 5.2 5.5 5.4 5.7 5.3Arkansas …………………...…… 6.2 5.9 5.6 5.2 5.7 5.6 5.4 5.0 5.6 5.5California ……………………… 6.9 6.9 6.7 6.9 6.5 6.2 6.3 6.0 6.6 6.4Colorado …………………...…… 7.1 6.6 6.8 7.1 6.6 6.2 6.5 6.2 6.3 6.4Connecticut ……………………. 5.2 5.1 5.5 5.7 5.2 5.4 5.2 5.1 5.1 5.7Delaware ………………………… 6.3 6.2 6.6 6.6 6.5 6.6 6.2 5.9 7.0 6.6District of Columbia …………… 6.2 5.6 5.7 5.7 5.4 5.8 5.6 4.7 5.6 5.3Florida …………………………… 7.4 6.7 6.1 6.6 5.6 5.8 6.1 5.5 6.1 7.5
Georgia ………………………… 6.7 6.6 6.3 6.2 6.1 5.9 5.8 5.8 6.1 6.2Hawaii ……………………….… 6.0 5.0 5.1 5.2 5.4 4.8 5.0 4.8 5.4 5.3Idaho ………………………...… 7.9 7.5 7.9 7.3 6.7 7.3 6.7 6.3 6.6 6.6Illinois ……………………..…… 5.7 6.1 5.8 5.7 5.6 5.7 5.6 5.4 5.5 6.0Indiana …………………………. 5.8 5.4 5.7 5.7 5.5 5.1 5.2 5.1 5.5 5.5Iowa ……………………………… 6.1 5.7 6.1 5.6 5.4 5.8 5.9 5.5 5.7 5.7Kansas …………………………… 6.2 5.9 5.8 5.5 6.3 5.6 5.7 5.6 6.6 5.7Kentucky ………………………… 6.8 6.1 5.7 6.1 5.9 6.3 5.8 5.4 5.9 5.8Louisiana ………………………… 6.8 5.9 6.4 6.2 6.1 6.5 6.5 5.9 6.5 6.1Maine ……………………..…… 6.7 7.4 7.2 7.7 6.5 7.4 7.1 6.4 7.7 7.5
Maryland ………………………. 6.6 6.6 6.1 6.4 6.1 5.9 6.2 5.9 6.2 6.2Massachusetts ……..…………… 5.7 5.6 5.5 6.1 5.5 5.4 5.4 5.1 5.2 5.6Michigan ……………..………… 5.7 5.5 5.6 5.7 5.3 5.5 5.4 5.0 5.3 6.0Minnesota ……………………… 6.1 5.7 5.8 5.7 5.4 5.5 5.7 4.7 5.3 5.7Mississippi ……………………… 6.3 6.3 5.7 5.9 5.7 5.5 5.6 5.9 6.0 5.9Missouri ………………………… 5.7 5.7 5.9 5.6 5.9 5.4 5.6 4.9 5.6 5.9Montana …………………….…… 7.6 7.8 8.1 7.9 7.2 7.7 7.5 7.1 7.7 8.0Nebraska ……………...………… 6.4 5.7 5.9 5.6 5.9 5.9 6.2 5.2 6.1 5.9Nevada ………………………… 6.8 6.2 6.6 6.3 6.3 5.5 5.6 5.2 6.0 5.8New Hampshire ………………… 6.4 6.3 5.7 6.6 5.6 6.3 5.9 5.6 5.9 6.5
New Jersey ……………………… 6.3 6.4 5.5 6.7 6.0 5.9 5.9 5.8 5.5 6.2New Mexico …………………… 7.0 6.6 6.4 6.7 6.5 6.2 6.5 6.2 6.3 6.3New York ……………………… 6.3 6.1 6.2 6.5 6.2 5.9 5.9 5.7 5.7 6.1North Carolina ………………… 6.3 6.3 6.2 6.3 6.0 5.9 5.7 5.5 5.9 6.0North Dakota …………………… 8.2 6.7 7.6 6.8 6.7 7.1 7.7 6.7 6.9 6.8Ohio …………………………… 5.7 5.7 5.7 5.8 5.1 5.7 5.4 5.1 5.4 5.6Oklahoma ……………………… 6.3 6.5 6.3 6.6 6.5 6.0 6.3 6.5 5.9 6.0Oregon ………………………… 6.9 6.6 6.9 6.5 6.5 6.4 6.3 5.7 5.9 6.3Pennsylvania …………………… 5.6 5.4 5.2 5.5 5.4 5.1 5.1 5.0 5.2 5.2Rhode Island …………………… 5.6 5.7 6.3 6.5 5.9 5.9 5.8 5.9 5.9 6.3
South Carolina ………………… 6.3 6.5 6.0 6.1 5.7 5.6 5.4 5.6 6.0 6.4South Dakota …………………… 6.4 6.0 6.4 6.3 5.7 6.2 6.1 5.9 6.3 6.0Tennessee ……………………… 5.9 5.8 5.1 5.4 5.4 5.2 5.1 4.9 5.1 5.2Texas …………………………… 6.2 5.9 5.8 5.8 5.9 5.5 5.4 5.2 5.4 5.7Utah ……………………………… 7.4 6.8 7.7 6.8 6.8 6.7 6.4 6.1 6.2 6.3Vermont ………………………… 7.2 7.0 6.6 7.9 6.7 7.4 7.0 6.8 6.8 7.8Virginia ………………………… 6.2 6.2 6.0 6.2 5.8 6.1 5.9 5.6 5.9 6.2Washington ……………………… 6.7 7.1 6.8 7.1 6.3 6.6 6.7 5.6 6.1 6.3West Virginia …………………… 6.5 6.4 6.3 6.4 6.9 6.4 6.2 6.4 6.5 6.5Wisconsin ……………………… 5.5 5.5 5.9 5.6 5.0 5.6 5.3 4.8 5.5 5.7
Wyoming ………………………… 8.5 8.8 8.8 8.5 8.7 8.8 8.7 8.1 9.0 7.9Puerto Rico ……………………… 5.8 5.8 5.1 5.2 4.1 5.7 5.4 5.7 5.2 6.2Virgin Islands …………………… 6.2 6.0 5.3 6.2 4.2 6.8 6.0 5.5 4.7 8.3
NOTE: Totals for the United States do not include data for Puerto Rico or the Virgin Islands.
State
Gross job gains as a percent of employment Gross job losses as a percent of employment(3 months ended) (3 months ended)
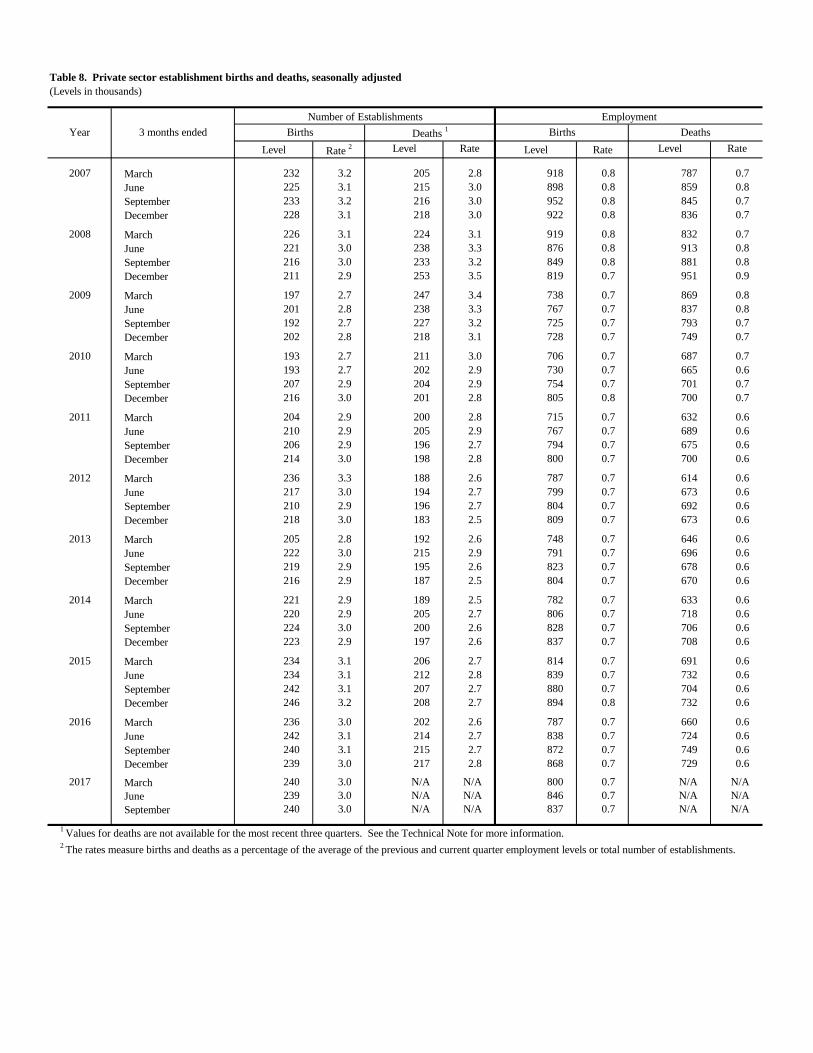
Table 8. Private sector establishment births and deaths, seasonally adjusted(Levels in thousands)
Level Rate 2 Level Rate Level Rate Level Rate
2007 March 232 3.2 205 2.8 918 0.8 787 0.7June 225 3.1 215 3.0 898 0.8 859 0.8September 233 3.2 216 3.0 952 0.8 845 0.7December 228 3.1 218 3.0 922 0.8 836 0.7
2008 March 226 3.1 224 3.1 919 0.8 832 0.7June 221 3.0 238 3.3 876 0.8 913 0.8September 216 3.0 233 3.2 849 0.8 881 0.8December 211 2.9 253 3.5 819 0.7 951 0.9
2009 March 197 2.7 247 3.4 738 0.7 869 0.8June 201 2.8 238 3.3 767 0.7 837 0.8September 192 2.7 227 3.2 725 0.7 793 0.7December 202 2.8 218 3.1 728 0.7 749 0.7
2010 March 193 2.7 211 3.0 706 0.7 687 0.7June 193 2.7 202 2.9 730 0.7 665 0.6September 207 2.9 204 2.9 754 0.7 701 0.7December 216 3.0 201 2.8 805 0.8 700 0.7
2011 March 204 2.9 200 2.8 715 0.7 632 0.6June 210 2.9 205 2.9 767 0.7 689 0.6September 206 2.9 196 2.7 794 0.7 675 0.6December 214 3.0 198 2.8 800 0.7 700 0.6
2012 March 236 3.3 188 2.6 787 0.7 614 0.6June 217 3.0 194 2.7 799 0.7 673 0.6September 210 2.9 196 2.7 804 0.7 692 0.6December 218 3.0 183 2.5 809 0.7 673 0.6
2013 March 205 2.8 192 2.6 748 0.7 646 0.6June 222 3.0 215 2.9 791 0.7 696 0.6September 219 2.9 195 2.6 823 0.7 678 0.6December 216 2.9 187 2.5 804 0.7 670 0.6
2014 March 221 2.9 189 2.5 782 0.7 633 0.6June 220 2.9 205 2.7 806 0.7 718 0.6September 224 3.0 200 2.6 828 0.7 706 0.6December 223 2.9 197 2.6 837 0.7 708 0.6
2015 March 234 3.1 206 2.7 814 0.7 691 0.6June 234 3.1 212 2.8 839 0.7 732 0.6September 242 3.1 207 2.7 880 0.7 704 0.6December 246 3.2 208 2.7 894 0.8 732 0.6
2016 March 236 3.0 202 2.6 787 0.7 660 0.6June 242 3.1 214 2.7 838 0.7 724 0.6September 240 3.1 215 2.7 872 0.7 749 0.6December 239 3.0 217 2.8 868 0.7 729 0.6
2017 March 240 3.0 N/A N/A 800 0.7 N/A N/AJune 239 3.0 N/A N/A 846 0.7 N/A N/ASeptember 240 3.0 N/A N/A 837 0.7 N/A N/A
1 Values for deaths are not available for the most recent three quarters. See the Technical Note for more information.2 The rates measure births and deaths as a percentage of the average of the previous and current quarter employment levels or total number of establishments.
Year 3 months endedNumber of Establishments Employment
Births Deaths 1 Births Deaths