Embed Size (px)
Citation preview


2First Half 2010 Results
Outlook
Businessreview
Financial results
Highlights

3First Half 2010 Results
Operating environment in Morocco
615 689 736 778 816
5,2% 4,0% 4,3%2,7%
5,6%
2007 2008 2009 2010E 2011E
Value GDP growth
• A in Q1-10 with a 5.6% growth for the non-agricultural GDP and a 3.5% growth for the total GDP.
• (+1.4% in Q2-10)
.
21 22 23 24 24 25 25 27 28
T2-08 T3-08 T4-08 T1-09 T2-09 T3-09 T4-09 T1-10 T2-10
Mobile market(millions)
Mobilepenetration
(Source ANRT)
• A growing mobile market• Usage is still limited• Strong growth of internet
subscriptions thanks to the rapid take-off of mobile internet (dongles)
• New entrant
* Haut Commissariat au Plan
GDP in Morocco*
s us tained growth
Contro lled inflation
69%
88%+ 19 pts
Telecom market
(MAD bn)

4First Half 2010 Results
• : • Decrease of the mobile termination rates• Asymmetric tariffs converging at the end of 2012
(MAD/ Min)
Regulatory context in Morocco
0.624
0.749
0.923Wana
Médite l
IAM
0.303
mid 2010 2013
2010-2013 regulatory guide path
Mobile Termination Rates

57% 99%(1)54%
Mobile
+11.3%Growth
88.5%PenetrationQ2 2010
15.9millions
Subscribers Q2
Internet Fixed
Leading operating active on all market segments with a well established brand
477ko/w ADSL
+42.9%Growth
44% of fixed lines
PenetrationADSLQ2 2010
822k lines
Subscribers Q2
-4.1%Growth
4%Penetration(1)
Q2 2010
1.237millions
Subscribers Q2
Market shares(Q2 2010):
(1) Excluding limited mobility
o/w postpaid 731 k
First Half 2010 results

6First Half 2010 Results
Sub-Saharan Africa
• in all markets where Maroc Telecomis operating (2.7% in 2010)
+ 4.7%+ 4.7%
•
• (Burkina Faso, Mali) will benefit from a strong growth of the subscribers base
• will support the growth of the mobile penetration in more matured countries (Gabon, Mauritania)
Average GDP growth in the sub-Saharan area (IMF 2010)
(Source: Dataxis)
26% 32%
87%101%
Burkina Faso Mali Mauritania Gabon
5,1%4,6% 4,4%5,4%
Mauritania Burkina Faso Gabon Mali
Inflation is under control
Mobile penetratio n (Q1 2010)
Real GDP gro wth in 2010e
Markets with a limited pene tration
Prepaid offers

Appealing results in Maroc Telecom’ subsidiaries
First Half 2010 results
Mauritania Mali
+4 pts+13 pts
21%30%
Market share*Market shareH1-10**
+130%1,464Mobile subs. (000) Q2 2010
Gabon
-34%Market share*
+8%577Mobile subs. (000) Q2 2010
Burkina Faso
+2 pts43%Market share*
+52%1,994Mobile subs. (000) Q2 2010
-53%Market share*
+18%1,547Mobile subs. (000) Q2 2010
* Q1-2010 vs. Q1-2009Source Dataxis
Photo
** Maroc Telecom estimates
Mauritel Sotelma
Gabon Telecom
Onatel
vs 20092010
vs 20092010
vs 20092010
vs 20092010

8First Half 2010 Results
Key figures Maroc Telecom Group
Revenues
Operating income
Cash Flow from operations
15,465
6,667
5,510
MMAD
+6.0%
+1.8%
+1.6%
+2.2%
+2.6%
Operating margin 43.1% +0.2pt -1.8 pt
% Comparable bas is

9First Half 2010 Results
Outlook
Highlights
Financial results
Businessreview

HighlightsMobile in Morocco
Free additional bonus on prepaid refills above MAD50 (permanent offer)
More free minutes in the postpaid offers
Development of the distribution network and launch of new services
335 owned-shops,o/w 12 new in H1 2010
Extension and improvement
First Half 2010 results
PREPAIDLOYALTY PROGRAM
PREPAIDPOSTPAID
MOBILE PAYMENT
EXTENSION OF THE DISTRIBUTION NETWORK

11First Half 2010 Results
Q2-09 Q3-09 Q4-09 Q1-10 Q2-10
Prepaid Postpaid
Business reviewMorocco
• is still growing
22.8%
33.5%36.5%
Q2-09 Q3-09 Q4-09 Q1-10 Q2-10
thanks to:
• The launch of offers improving loyalty
• Loyalty programs
-7.8pts
1 3 ,61814,570 14 ,590
14 ,8 72 15 17 3671
669 68 2706
731
Mobile cus to mers bas e
Cus tomer bas e
Churn
35.2%
27.4%
Churn is decreas ing
+11.3%
14,289
15,904

12First Half 2010 Results
97 98 91
Q2-09 Q3-09 Q4-09 Q1-10 Q2-10
4451
55
Q2-09 Q3-09 Q4-09 Q1-10 Q2-10
Mobile in MoroccoARPU et usage
• is stabilizing at a high level despite the growth of the customers base
(MAD / customer / month) (Minutes / customer / months)
~ -9.1%
Blended ARPU
94 94 4954
Blended outgoing us ag e
ARPU

13First Half 2010 Results
Business reviewMorocco
4 ,5 3 74 ,8 4 75 ,0 0 4
2 ,6 0 53 ,0 7 13 ,1 1 5
6 2 .5 %5 7 .4 %6 3 .4 %6 2 .2 %5 9 .7 %
Q 2 -0 9 Q 3 -0 9 Q 4 -0 9 Q 1 -1 0 Q 2 -1 0
Revenues EBITD A EBITDA margin
Mobile(MADm)
+7.4%
+12.5%
+2.8 pts
Mobile revenues are growing significantly, margins continue to be improved
4,6384,983
3,1172,770
(in MADm)

HighlightsFixed & Internet in Morocco
Robust growth of the
•from
abroad to the fixed lines in Morocco
• with triple-play offers(telephony over Internet)
Free doubling of the ADSL bandwidth speeds
First Half 2010 results
enterpris e market
Decreas e of the termination rates
Free national calls

15First Half 2010 Results
Business reviewFixed & Internet in Maroc
• Stabilization of the number of line in 2010
753 735 707 705 706
164 164 158 155 154
373 371 369 372 376
Q2-09 Q3-09 Q4-09 Q1-10 Q2-10
Residential Public telephony Corporate
484 474 477
89 116 174265
343
469471
Q2-09 Q3-09 Q4-09 Q1-10 Q2-10
ADSL 3G dongles
• Strong growth thanks to (dongles)
-4.1%
+43.1%
Fixed lines c us tomer bas e
Bas e Clients Internet
Mobile Internet
1,290 1,237
573
820

16First Half 2010 Results
Business ReviewFixed & Internet in Morocco
2,268 2,284 2,193
1,133 1,075 1,064
47.8%48.5%47.1%49.9%49.8%
T2-09 Q3-09 Q4-09 Q1-10 Q2-10
Revenues EBITDA EBITDA margin
(MADm)
-11.1%
-14.7%
-2 pts
Slight decrease of the fixed lines base, but stabilization in 2010
Fixed
1,187
2,384
1,013
2,119
(in MADm)

17First Half 2010 Results
Mauritania
Ouguiya (MRO)+2.7% vs. H1 2009
+4.9% in 2009 +4.6% in 2010e
˜ $ 2 038-2.2% in 2009e
-1.1% in 2009 +4.6% in 2010e
$ 3.03 billions
3.1 millions
+8%509472Mobile
113 -2.4%110Fixed and Internet
-33%711Customers (000)
-22Nb of operators
-3.0%3.0%Penetration
44.2%
56
3
74%
53%
63
1,315
-44.2%Market share
-25%42Lines (000)
-3Nb of operators
+13pts87%Penetration*
-53%Market share*
-11%56ARPU (MAD)
+18%1,547Customers (000)
* Source Dataxis à fin T1-2010
32.07
S ource: IMF
32.7%36.3%% of revenues
50.4%52.9%% of revenues
var.H1-2010H1-2009In MADm – IFR S
H1-2009 var.H1-2010
MAD 1 =
Inflatio n
Revenue perinhabitant (ppp)
GDP
Populatio n
-4.9%195205Operating inco me
299
565
+0.4%300EBITDA
+5.3%595Revenues (net)
Internet
Fixed
Mobile

18First Half 2010 Results
Burkina Faso
FCFA 58.60-0.2% vs. H1 2009
-0.3% in 2009+2.0% in 2010e
˜ $ 1,304+2.1% in 2009
+3.2% in 2009+4.4% in 2010e
$ 8.1 billions
14.4 millions
+20%2521Customers (000)
-11Nb of operators
-1.1%1.1%Penetration
100%
151
3
18%
41%
78
1,316
-100%Market Share
+2%154Lines (000)
-3Nb of operators
+8pts26%Penetration*
+2pts43%Market share*
-22%61ARPU (MAD)
+52%1,994Customers (000)
+21.3%677558Mobile
399 -1.8%391Fixed and Internet
* Source: Dataxis at end of Q1-2010
MAD 1 =
Inflatio n
Revenue perinhabitant (ppp)
GDP
Populatio n
Internet
Fixed
Mobile
84%281153Operating inco me
359
833
+33.9%481EBITDA
+12.1%934Revenues (net)
S ource: IMF
H1-2009 var.H1-2010
30.1%18.4%% of revenues
51.5%43.1%% of revenues
var.H1-2010H1-2009In MADm - IFR S
19First Half 2010 Results
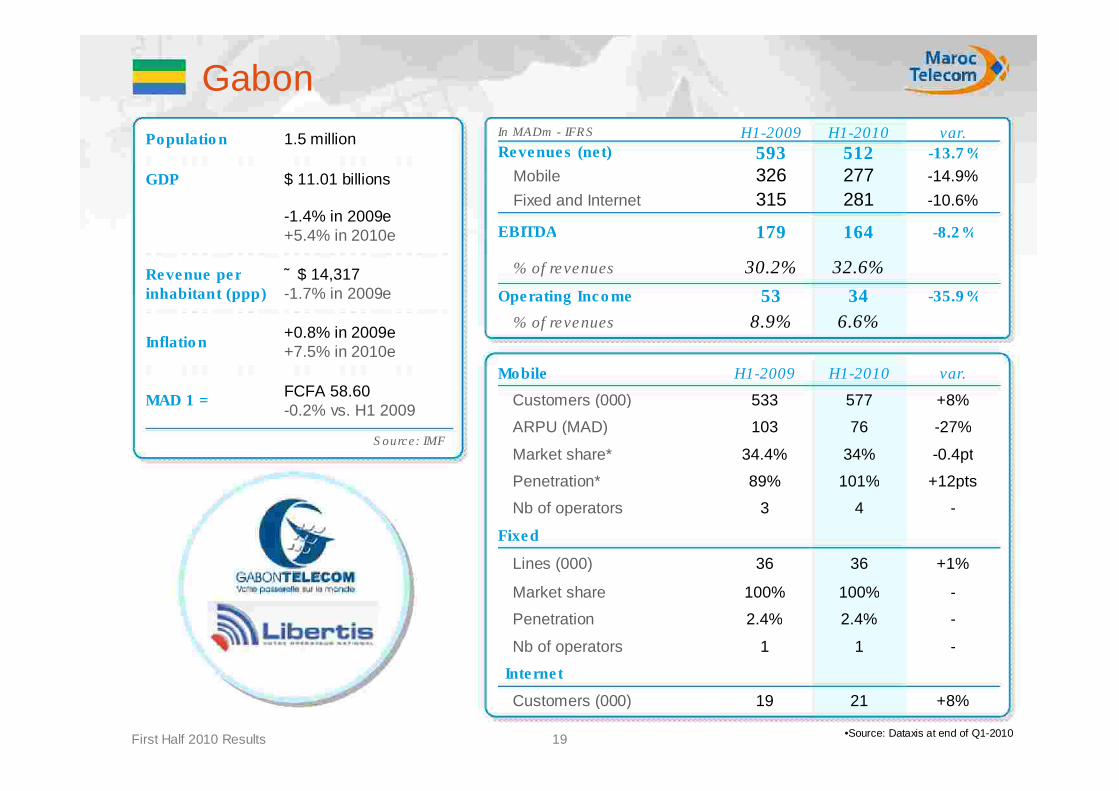
Gabon
FCFA 58.60-0.2% vs. H1 2009
+0.8% in 2009e+7.5% in 2010e
˜ $ 14,317-1.7% in 2009e
-1.4% in 2009e+5.4% in 2010e
$ 11.01 billions
1.5 million
+8%2119Customers (000)
-11Nb of operators
-2.4%2.4%Penetration
100%
36
3
89%
34.4%
103
533
-100%Market share
+1%36Lines (000)
-4Nb of operators
+12pts101%Penetration*
-0.4pt34%Market share*
-27%76ARPU (MAD)
+8%577Customers (000)
-14.9%277326Mobile
315 -10.6%281Fixed and Internet
•Source: Dataxis at end of Q1-2010
MAD 1 =
Inflatio n
Revenue perinhabitant (ppp)
GDP
Populatio n
Internet
Fixed
Mobile
-35.9 %3453Operating Inco me
179
593
-8.2 %164EBITDA
-13.7 %512Revenues (net)
H1-2009 var.H1-2010
S ource: IMF
6.6%8.9%% of revenues
32.6%30.2%% of revenues
var.H1-2010H1-2009In MADm - IFR S

20First Half 2010 Results
Mali
FCFA 58.60-0.2% vs. H1 2009
+1.6% in 2009e+2.3% in 2010e
˜ $ 1.173+3.3% in 2009e
+4.5% in 2009e+5.1% in 2010e
$ 8.96 billions
13.7 millions
+118%146Customers (000)
-22Nb of operators
-0.6%0.6%Penetration
88.0%
71
2
26%
17%
119
635
+7pts95.0%Market share
+1%72Lines (000)
-2Nb of operators
+6pts32%Penetration*
+13pts30%Market share**
-26%88ARPU (MAD)
+130%1,464Customers (000)
+19.5%538449Mobile
160 +7.5%172Fixed and Internet
•Source Dataxis à fin T1-2010** Estimation Maroc Telecom
MAD 1 =
Inflatio n
Revenue perinhabitant (ppp)
GDP
Populatio n
Internet
Fixed
Mobile
ns54-55Operating Inco me
92
600
+184%262EBITDA
+17%703Revenues (net)
S ource: IMF
H1-2009 var.H1-2010
8.8%-58.9%% of revenues
37.3%15.3%% of revenues
var.H1-2010H1-2009In MADm - IFR S
21First Half 2010 Results
Outlook
HighlightsBusinessreview
Financial results

22First Half 2010 Results
Consolidated income statement
-1.8pt44.9%43.1%% of revenues
+9.5%-8,034-8,799Operating expenses
-3.1pts31.9%28.8%% of revenues
-0.7pt58.9%58.2%% of revenues
varH1 2009H1 2010In MADm
+1.8%6,5526,667Operating income
-4.1%4,6464,455Net Profit group s hare
+4.8%8,5899,004EBITDA
+6.0%14,58615,465Revenues

23First Half 2010 Results
Revenues & EBITDA
443824
8,061 7,8007,766
1,205
H1-08 H1-09 H1-10
1,8552,075
2,772
12,76312,57512,511
H1-08 H1-09 H1-10MoroccoSub-Saharan Africa
14,30814,586
15,465 9,004
8,5898,504
+46.2%
+0.4%+1.5%
+33.6%
+6.0%+4.8%
Revenues EBITDA (MADm ) (MADm)

24First Half 2010 Results
Investments
H1 2009 H1 2010 H1 2009 H1 2010 H1 2009 H1 2010
755 763
381550
473
1,091
H1 2009 H1 2010
• CAPEX are back-end loaded in H2-2010, with a target of slightly more than 20% of revenues for the full year (15.5% in H1-2010)
• Stabilization of CAPEX in Morocco for the full year
• Increase of mobile network coverage in the subsidiaries
763755550
381
1,091
473
Mobile in Morocco
Fixed & Internet in Morocco
Sub-S aharan Afric a
Total Cape x
1,611
2,404
~
+49%
+44% +130%

25First Half 2010 Results
Cash Flow Statement
-3.3%
+263%
5,321
100
5,148
363
Maroc Telecom
Subsidiaries
+15.6%
+130.7%
-1,138
-473
-1,313
-1,091
Maroc Telecom
Subsidiaries
+0.4%
+46.4%
7,766
824
7,799
1,205
Maroc Telecom
Subsidiaries
72.6%7.8%
4,905409
8,464441
Maroc TelecomSubsidiaries
varH1 2009H1 2010In MMAD
67.6%5,3148,905Net Debt
+49.4%-1,611-2,404CAPEX
+1.6%5,4215,510Cas h Flow from operations
+30.0%-1,572-1,090Change in working capital
+4.8%8,5899,004EBITDA

26First Half 2010 Results
Outlook
HighlightsBusinessreview
Financial results

27First Half 2010 Results
Clear targets
•
•
•
First Half 2010 results
Maintain the leaders hip while controlling the margins
Sus tain the growth profile thanks to inves tments , the development o f our s ubs idiaries and the s earch o f new M&A opportunities
Strengthening s ocial res pons ibility and civicmis s ions o f Maroc Telecom by extending the coverage o f remote areas , reducing the dig ital divideand more broadly s us tainable development.

28First Half 2010 Results
Unchanged 2010 guidance
•
•
First Half 2010 results
Moderate growth in revenues
Profitability to be maintained at high leve ls