Embed Size (px)
Citation preview

Business Intelligence Channel
Training
Roger Ward
Data Project Manager
Court Improvement Program

“It is not the strongest of the species
that survives, or the most intelligent
that survives. It is the one that is
most adaptable to change.”
-Charles Darwin
2
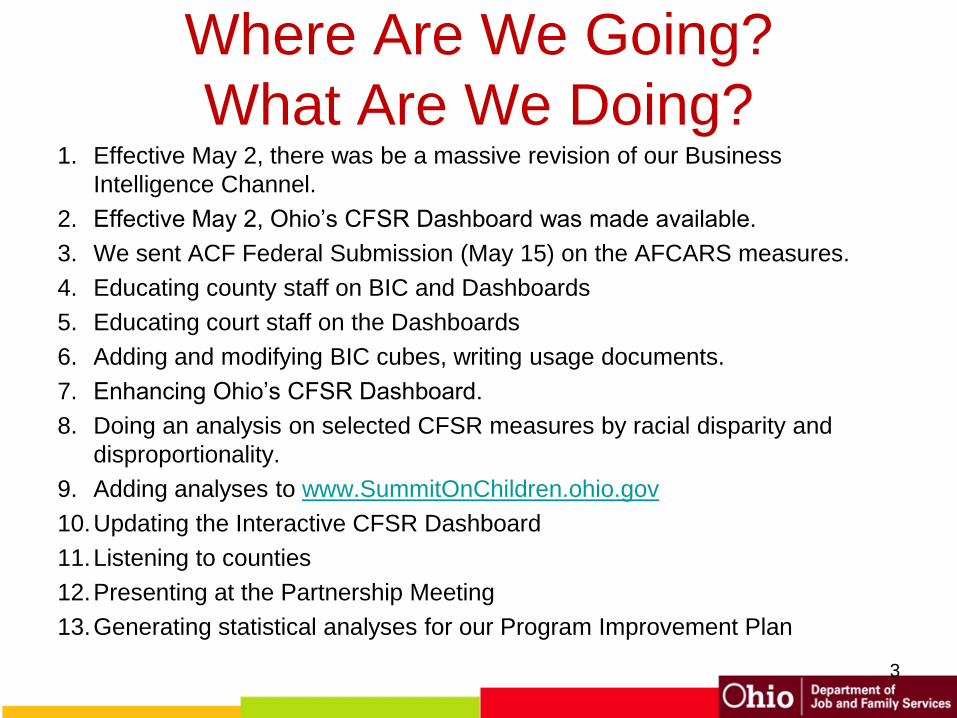
Where Are We Going?
What Are We Doing?1. Effective May 2, there was be a massive revision of our Business
Intelligence Channel.
2. Effective May 2, Ohio’s CFSR Dashboard was made available.
3. We sent ACF Federal Submission (May 15) on the AFCARS measures.
4. Educating county staff on BIC and Dashboards
5. Educating court staff on the Dashboards
6. Adding and modifying BIC cubes, writing usage documents.
7. Enhancing Ohio’s CFSR Dashboard.
8. Doing an analysis on selected CFSR measures by racial disparity and
disproportionality.
9. Adding analyses to www.SummitOnChildren.ohio.gov
10.Updating the Interactive CFSR Dashboard
11.Listening to counties
12.Presenting at the Partnership Meeting
13.Generating statistical analyses for our Program Improvement Plan
3

www.SummitOnChildren.ohio.gov
5

6
7

From Internet Explorer,
Type BIC
Firefox is not recommended 8

Log On to Bic
9

Welcome to the New
Business Intelligence Channel
There are no multiple folders (Blue or Yellow) for you to try to recall where what
you want is now.
10

Inside the Office of Families &
Children
Naming conventions match what counties know.
11
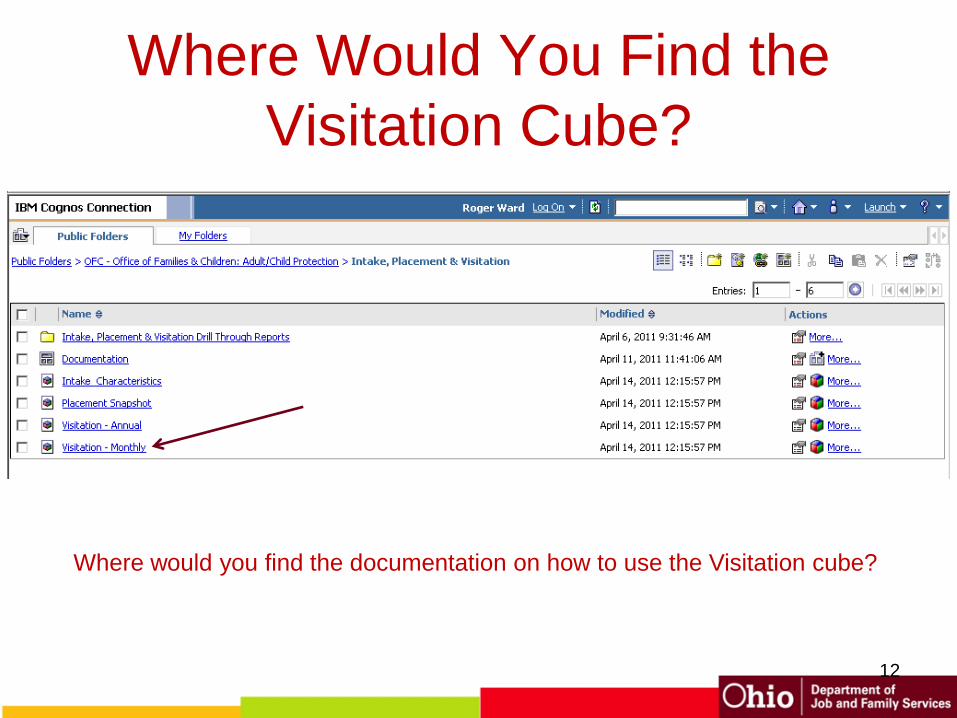
Where Would You Find the
Visitation Cube?
Where would you find the documentation on how to use the Visitation cube?
12
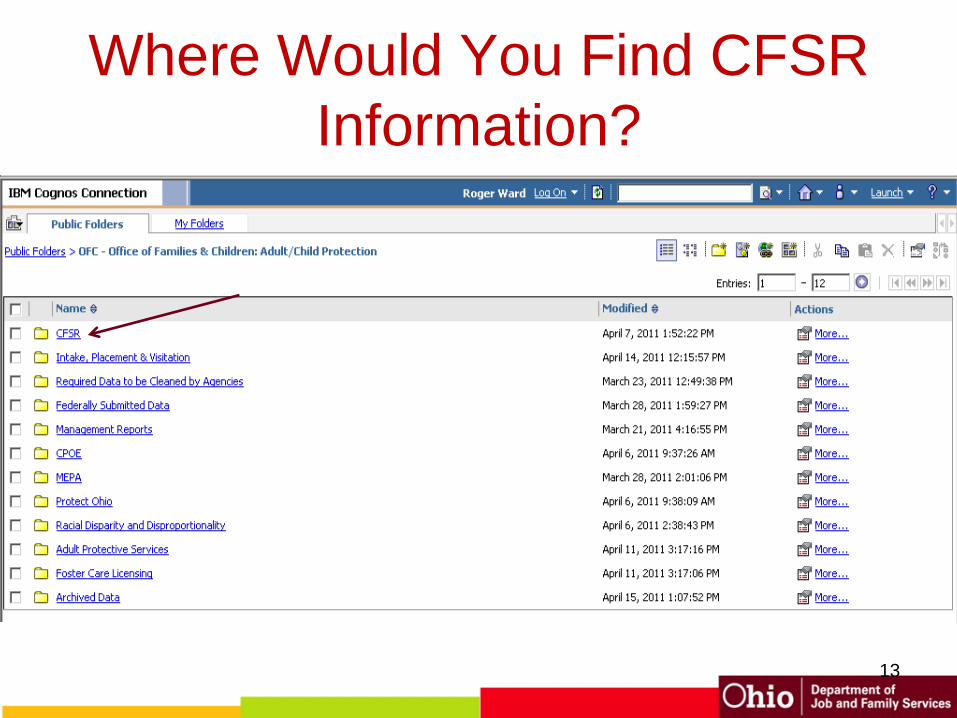
Where Would You Find CFSR
Information?
13

Insert CFSR content tab
What date were these update?
In the CFSR tab
14

We want to know if reports stall…
If they stall (meaning they do not return results, or if it takes
a long time), send an email to BIC_Customer_Service, and
copy Roger,[email protected].
15

CFSR Dashboard
16

You Want it in PDF?

Who Are The Children We
Should Focus On?


Make certain Pop-up Blockers (e.g., IE, and Google) are OFF.
Excel is Ready

Drill-Thru To the Child Detail

You Want to Access the Report Quickly
in the Future?

You Want to Access the Report Quickly
in the Future?


Return to the “Office”
25
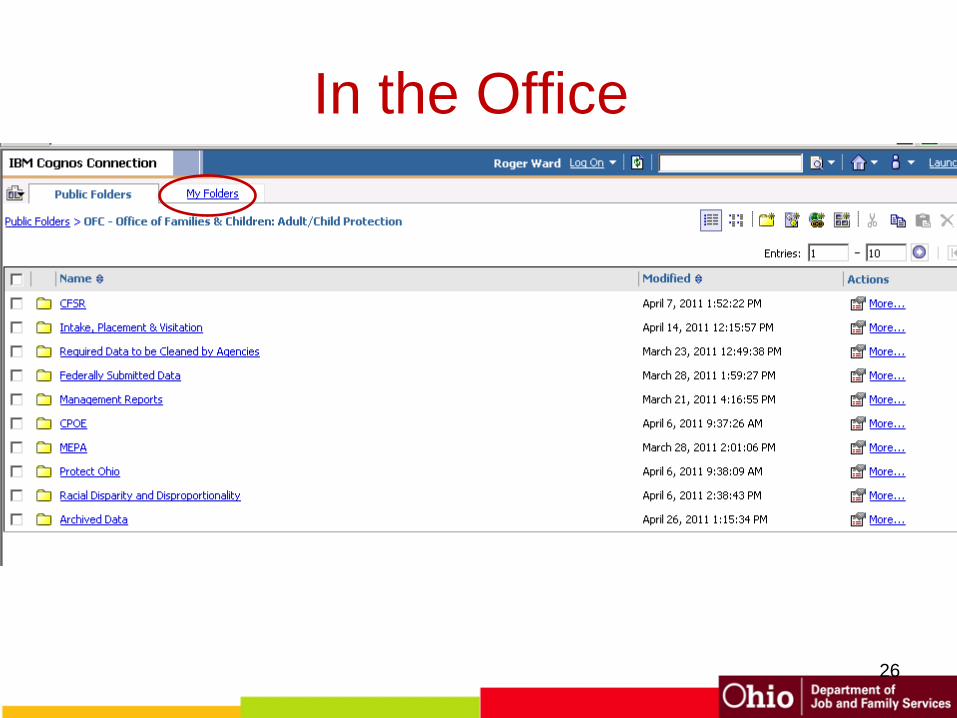
In the Office
26
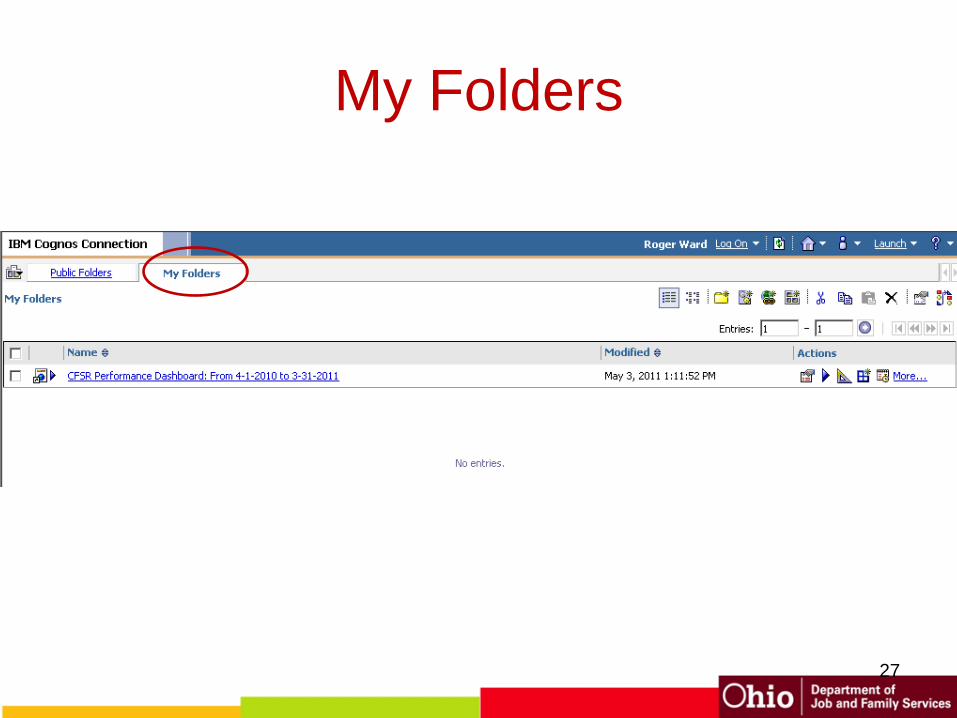
My Folders
27

C2-3: In Care 17+ Months, Adopted
By Year’s End
28

Who is Being Observed?
This indicator includes children who were in foster care for at
least 17 continuous months on April 1. To meet the target,
22.7% of this group needs to be discharged to adoption by
March 31. This is a fixed population and will not increase over
the evaluation period. If a child was in care for exactly 17
continuous months on April 2, they are excluded from this
analysis.
Example: If 100 children were in care for at least 17
continuous months on April 1, then 23 children need to be
discharged to adoption by March 31 to achieve the target.
29

Go toPublic Folders > OFC - Office of Families & Children: Adult/Child Protection > CFSR
30
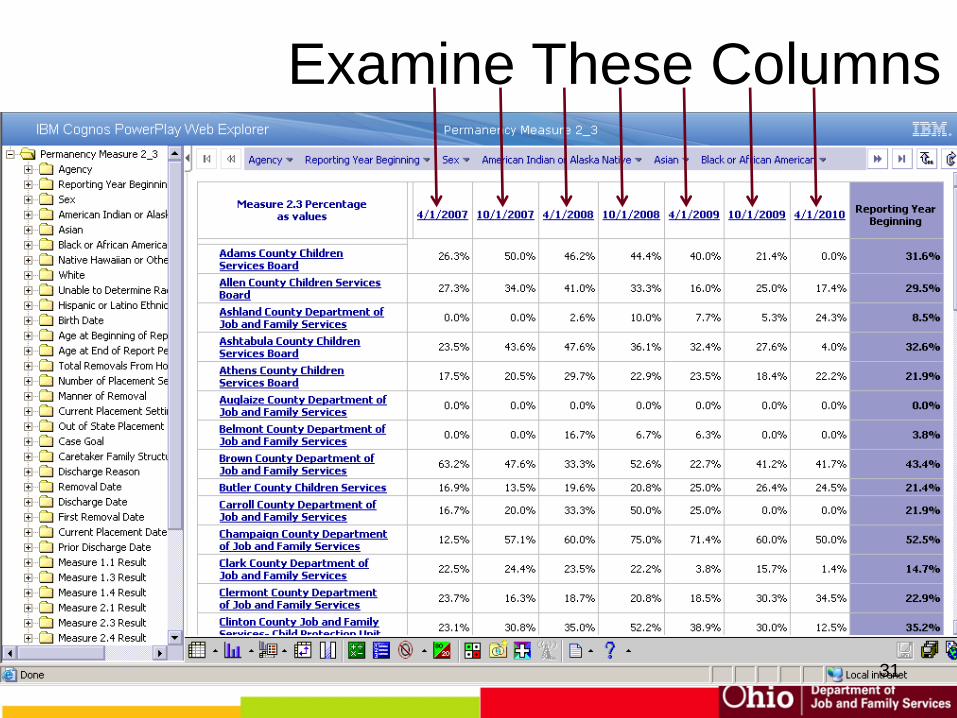
Examine These Columns
31
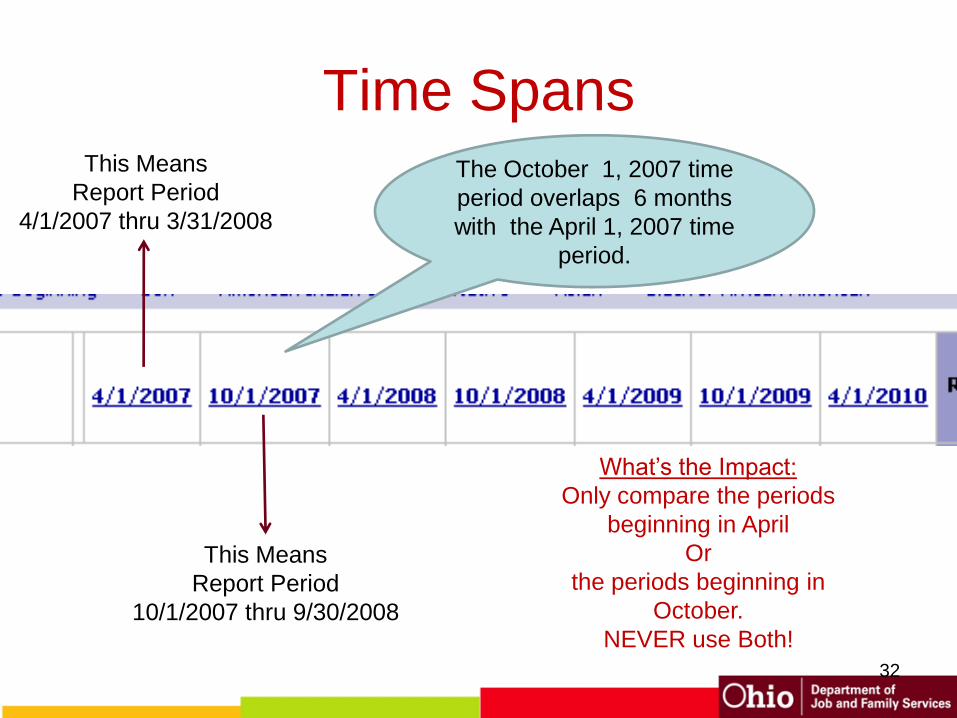
Time SpansThis Means
Report Period
4/1/2007 thru 3/31/2008
This Means
Report Period
10/1/2007 thru 9/30/2008
The October 1, 2007 time
period overlaps 6 months
with the April 1, 2007 time
period.
What’s the Impact:
Only compare the periods
beginning in April
Or
the periods beginning in
October.
NEVER use Both!
32
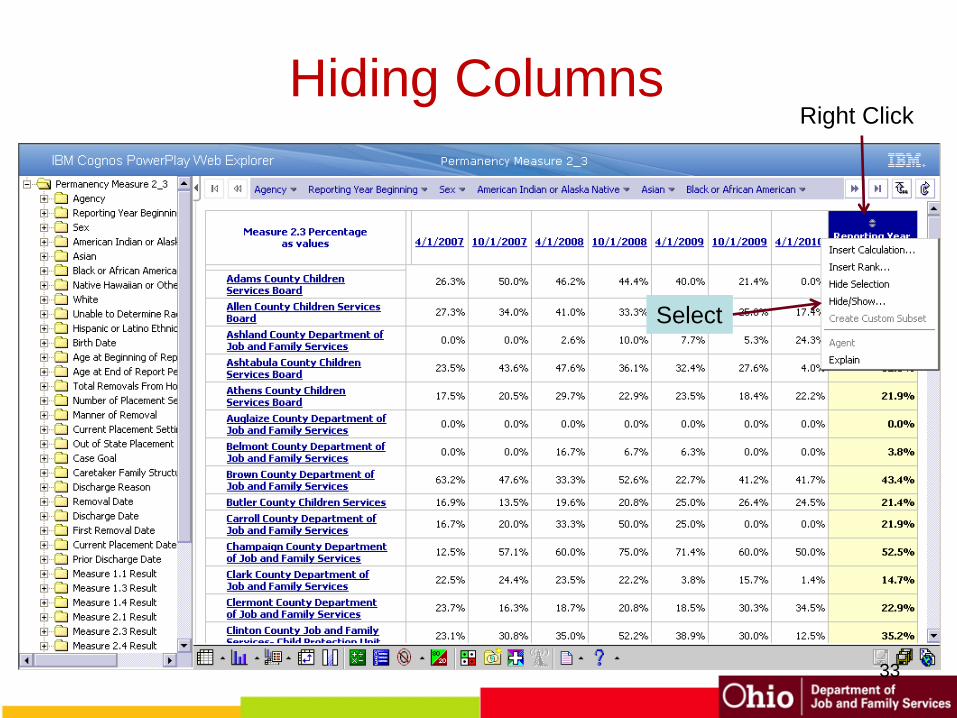
33
Right Click
Select
Hiding Columns

Hide All Except the April Time
Periods
34

35

Click on the Most Recent Time
Period
36

37
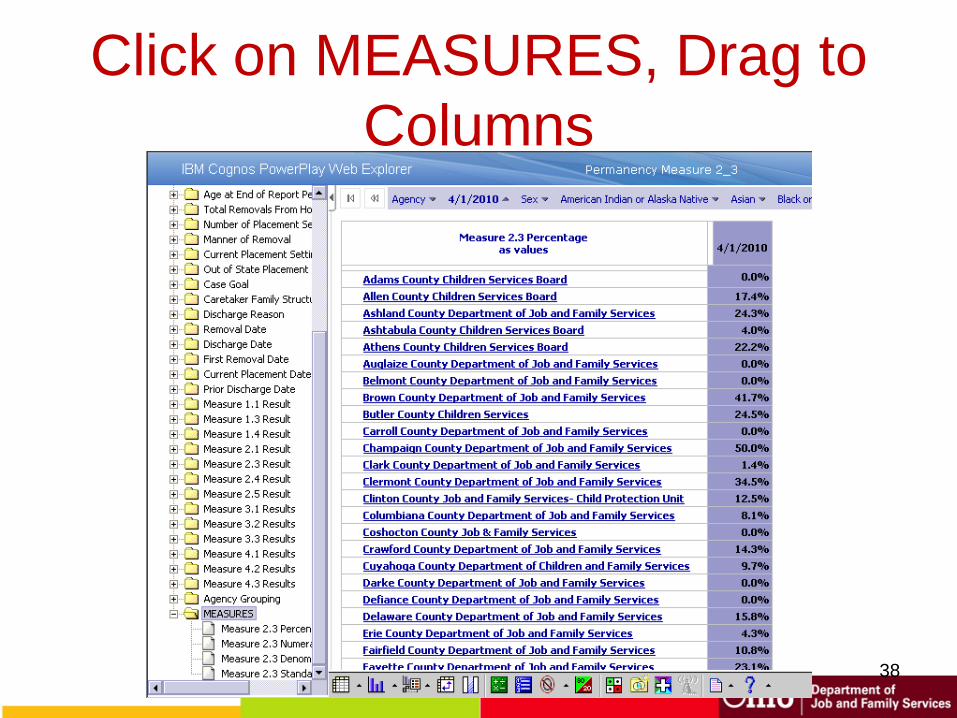
Click on MEASURES, Drag to
Columns
38

39

Drag “Age at Beginning of Review
Period” to Rows
40
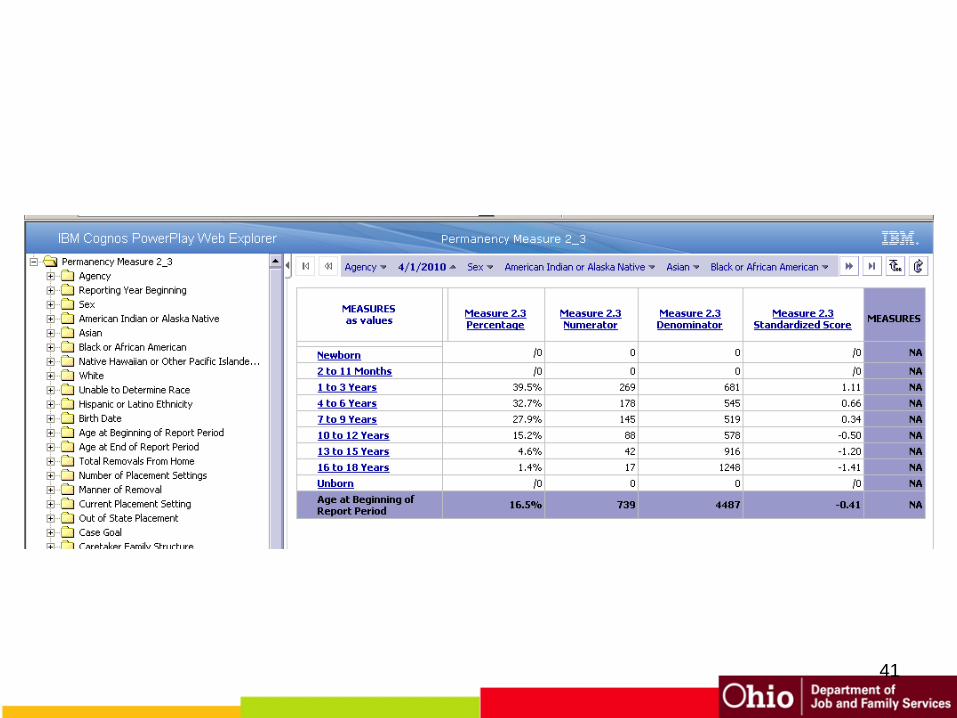
41

Mouse Over the Narrow Lines
42

Right Click, Down a Level
43

44

Click Zero Suppression
45

46

Right Click
47
Select Hide/Show

48

49
Click
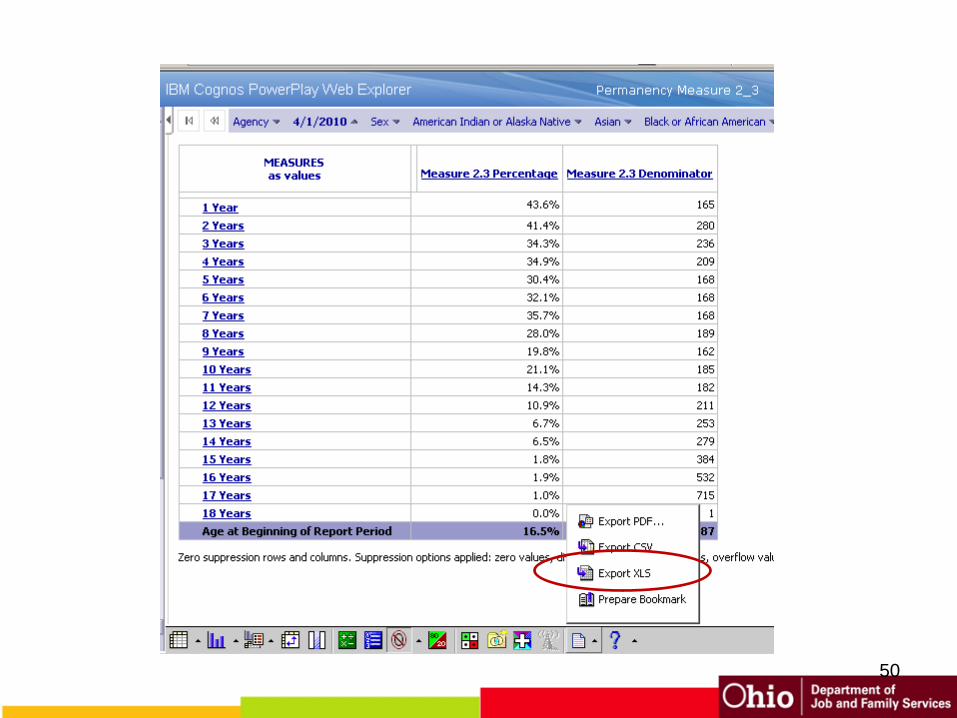
50

While in Training, Select Open
51

Click Yes
52

Excel
53

Change Title of First Column
54

Select Insert
55
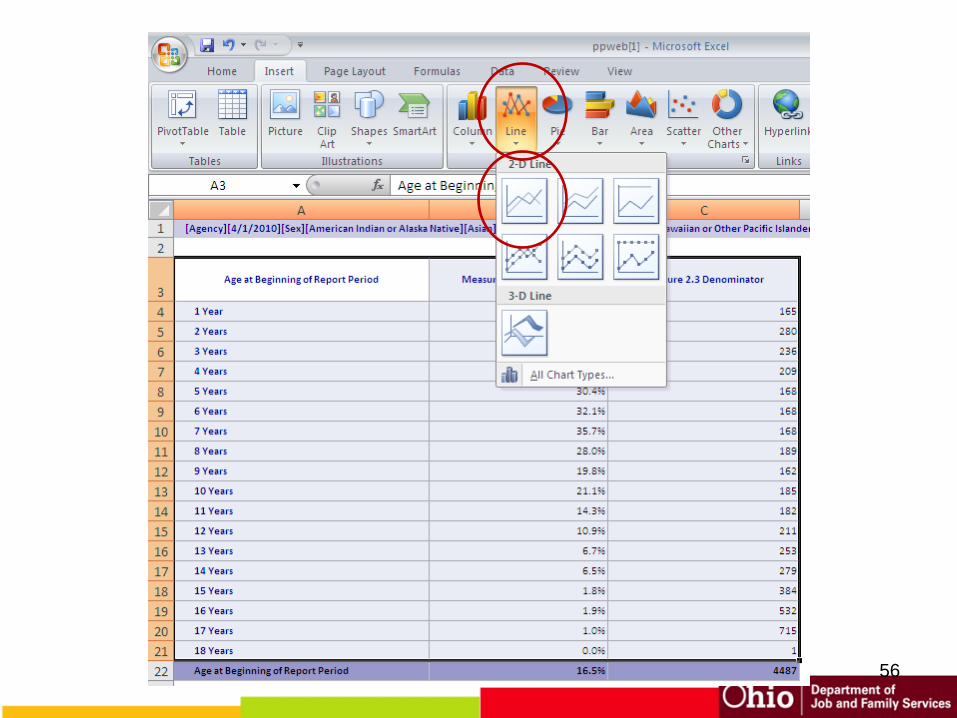
56
57

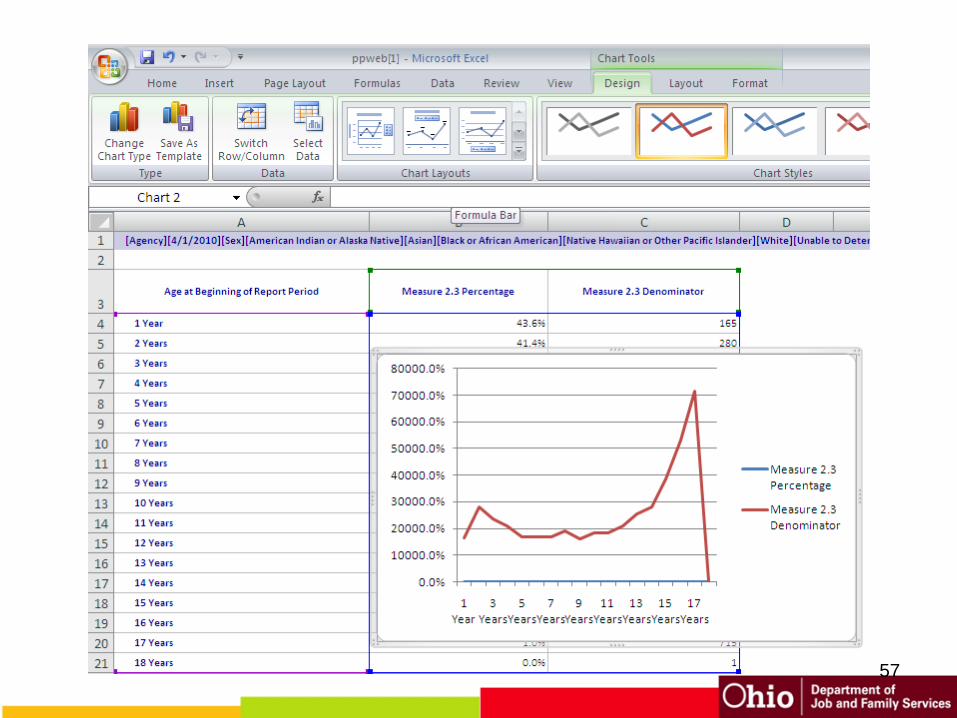
Click on One of the Percentage
Values
58

59

60

Right Click, Format Data Series,
61
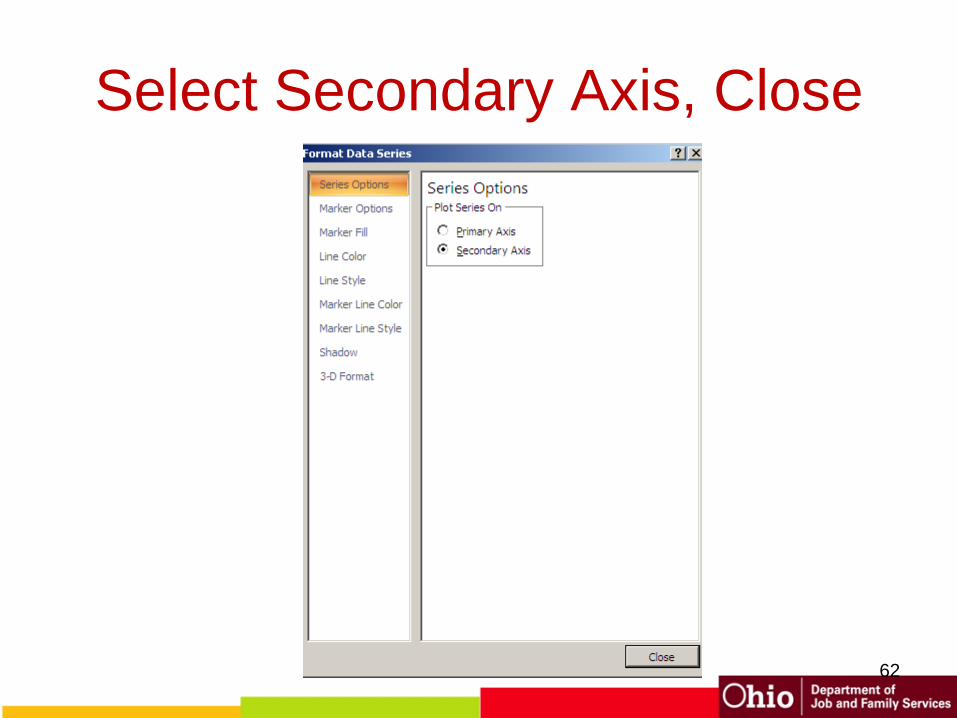
Select Secondary Axis, Close
62

63

64
Click

Right Click, Select Font
65
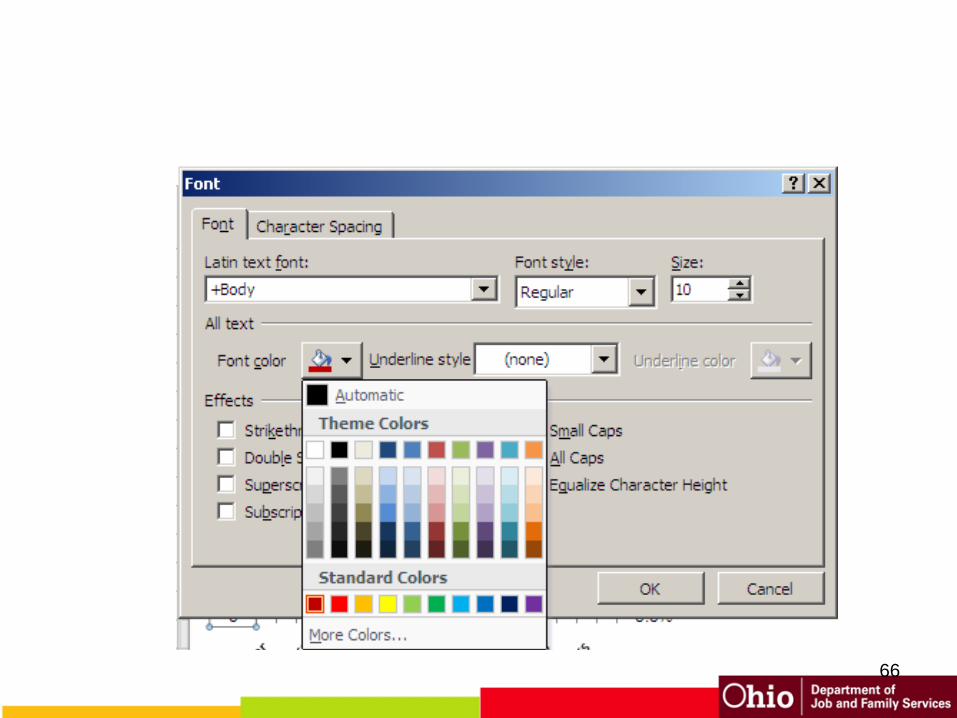
66
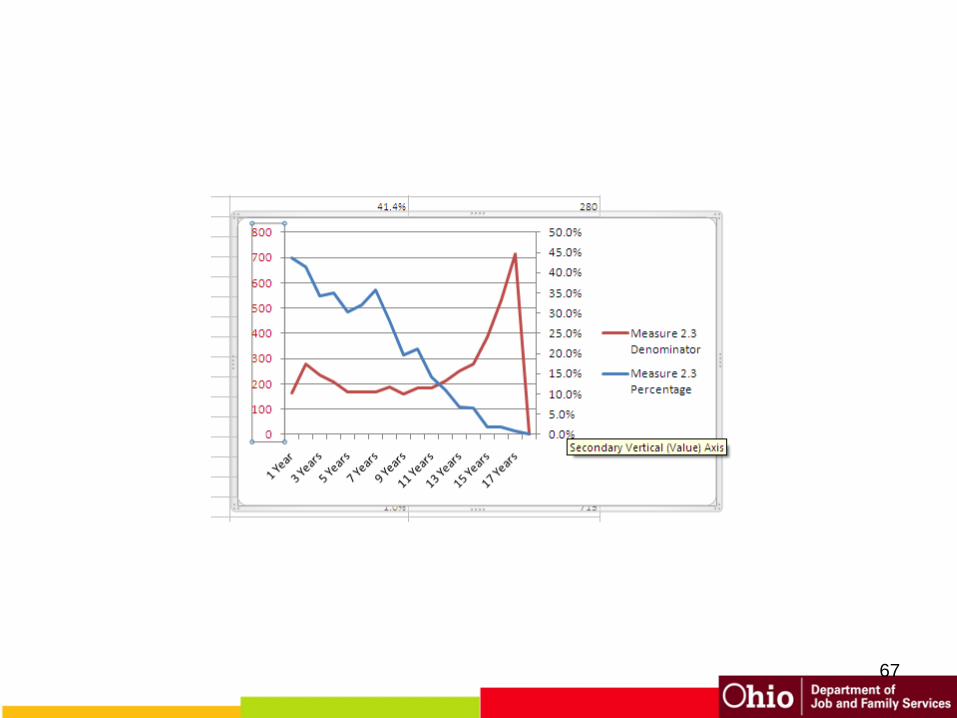
67

Repeat to Change the Percent
Color Values
68

69
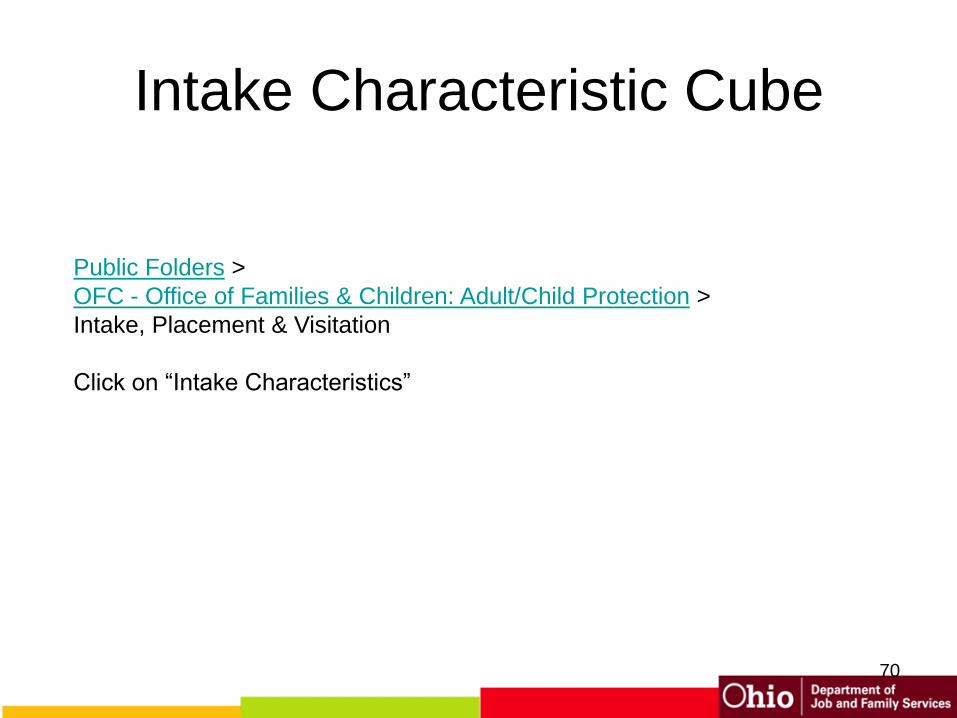
Intake Characteristic Cube
70
Public Folders >
OFC - Office of Families & Children: Adult/Child Protection >
Intake, Placement & Visitation
Click on “Intake Characteristics”

Intake Cube, Click on Public
71

72

Select Your Agency
73

Select a Agency, and Swap
74

Drop in Screening Decision
75

In the CPOE Folder
76
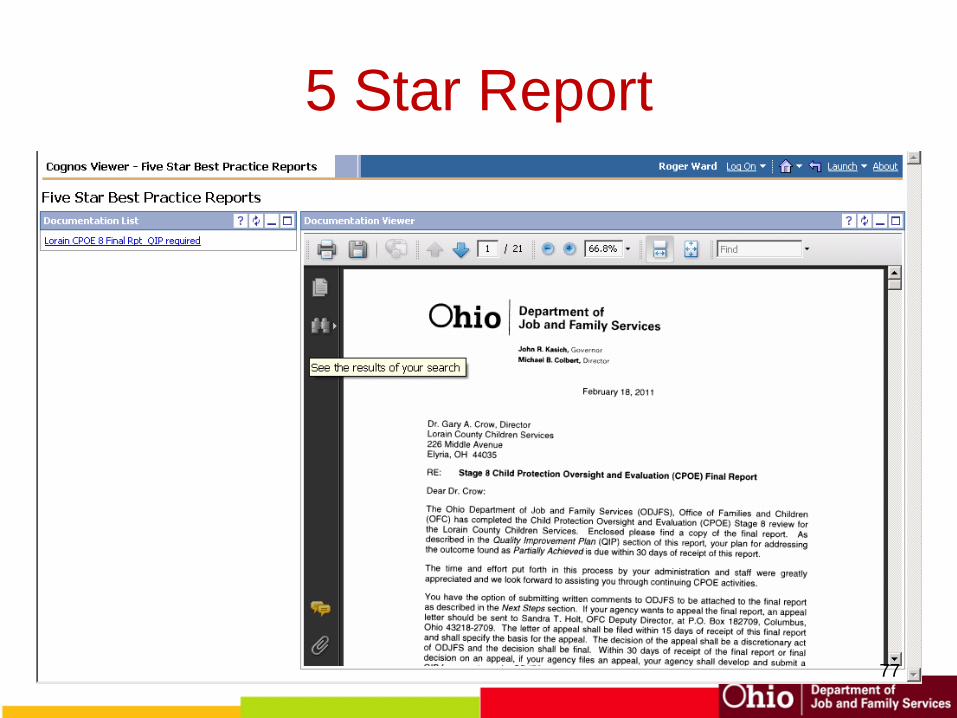
5 Star Report
77

CPOE
78

Protect Ohio
79

In the Disproportionality Folder
80
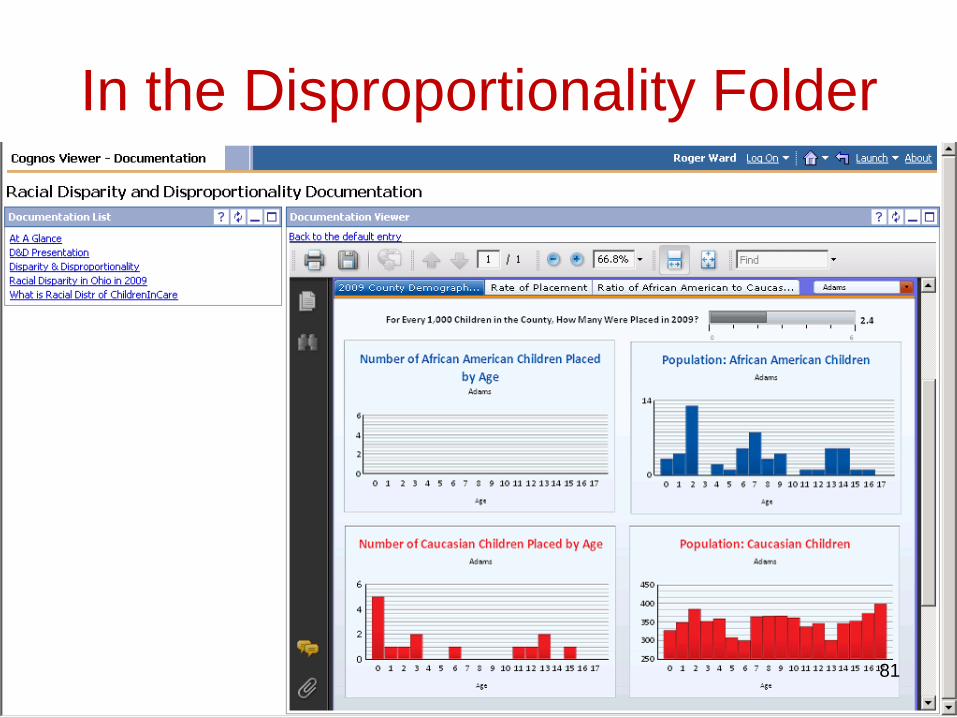
In the Disproportionality Folder
81