Embed Size (px)
Citation preview
business location data
#TulsaChamber
Tulsa Business location data
The Tulsa business location Data is a publication of:
tulsa Regional chamber, economic developmentWilliams center tower ione West third street, suite 100tulsa, oK 74103Ph: 918.585.1201 · 800.624.6822 Fx: 918.585.8386GrowMetroTulsa.com
Facilities· Industrial Buildings 4· Office Buildings 4· Land 5· Retail Buildings 5
Utilities· Electricity 6· Natural Gas 6· Water & Sewer 6· Telecommunications 7
Workforce· Labor Force 8· Wage & Salary Employment 8· Employment by Sector 8· Unemployment Rates 9· Wage Rates 9· Union Information 10· Workers’ Compensation 10
Market Access· Air 11· Motor Freight 12· Rail 13· Waterway 13
Business Environment· Largest Employers 14· Incentives 14· Taxes 16· Community Data 17· Business Announcements 18
Quality of Life· Tulsa MSA Demographics 19· Cost of Living Index 20· Education 20· Health Care 23· Culture & Recreation 24· Climate 25· Other Facts 25
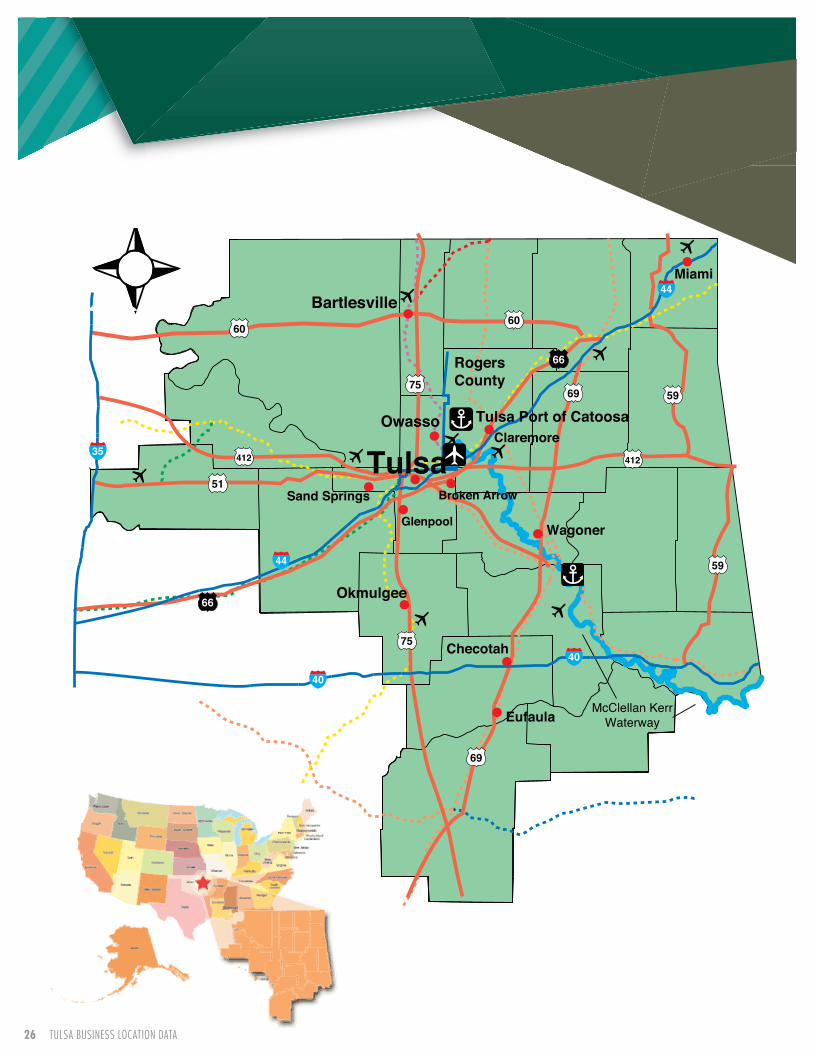
Location & Maps· Tulsa & Region Maps 26
4 tulsa Business location data
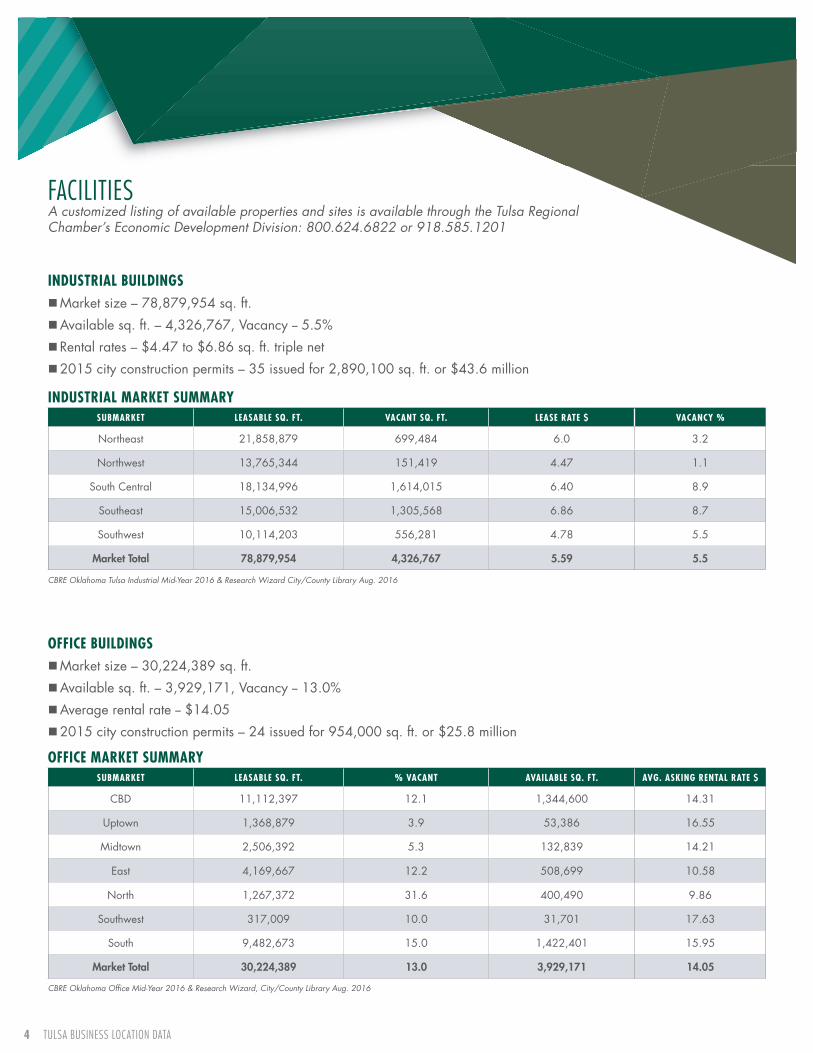
FacilitiesA customized listing of available properties and sites is available through the Tulsa Regional Chamber’s Economic Development Division: 800.624.6822 or 918.585.1201
inDusTrial builDinGs �Market size – 78,879,954 sq. ft.
�Available sq. ft. – 4,326,767, Vacancy -- 5.5%
�Rental rates – $4.47 to $6.86 sq. ft. triple net
�2015 city construction permits – 35 issued for 2,890,100 sq. ft. or $43.6 million
office builDinGs �Market size – 30,224,389 sq. ft.
�Available sq. ft. – 3,929,171, Vacancy -- 13.0%
�Average rental rate -- $14.05
�2015 city construction permits – 24 issued for 954,000 sq. ft. or $25.8 million
inDusTrial MarKeT suMMarYsubMarKeT leasable sq. fT. VacanT sq. fT. lease raTe $ VacancY %
Northeast 21,858,879 699,484 6.0 3.2
Northwest 13,765,344 151,419 4.47 1.1
South Central 18,134,996 1,614,015 6.40 8.9
Southeast 15,006,532 1,305,568 6.86 8.7
Southwest 10,114,203 556,281 4.78 5.5
Market Total 78,879,954 4,326,767 5.59 5.5
office MarKeT suMMarYsubMarKeT leasable sq. fT. % VacanT aVailable sq. fT. aVG. asKinG renTal raTe $
CBD 11,112,397 12.1 1,344,600 14.31
Uptown 1,368,879 3.9 53,386 16.55
Midtown 2,506,392 5.3 132,839 14.21
East 4,169,667 12.2 508,699 10.58
North 1,267,372 31.6 400,490 9.86
Southwest 317,009 10.0 31,701 17.63
South 9,482,673 15.0 1,422,401 15.95
Market Total 30,224,389 13.0 3,929,171 14.05
CBRE Oklahoma Tulsa Industrial Mid-Year 2016 & Research Wizard City/County Library Aug. 2016
CBRE Oklahoma Office Mid-Year 2016 & Research Wizard, City/County Library Aug. 2016
GRoWMetRotulsa.coM 5
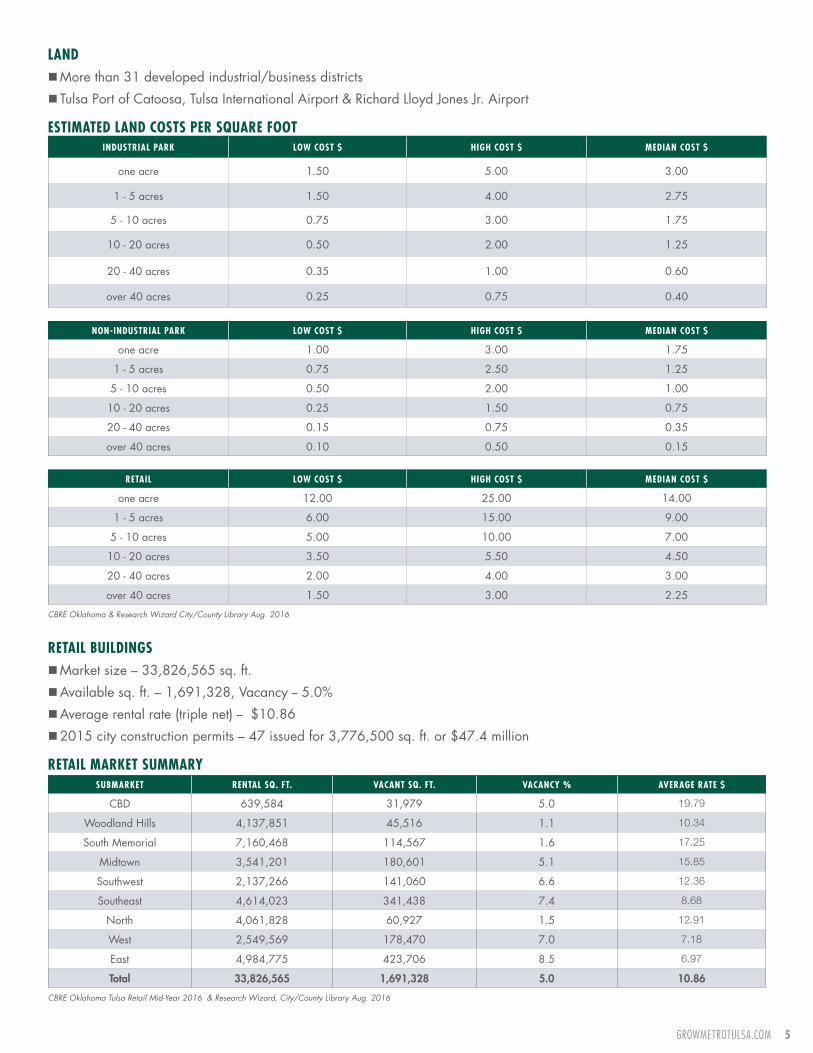
lanD �More than 31 developed industrial/business districts
� Tulsa Port of Catoosa, Tulsa International Airport & Richard Lloyd Jones Jr. Airport
reTail builDinGs �Market size – 33,826,565 sq. ft.
�Available sq. ft. – 1,691,328, Vacancy -- 5.0%
�Average rental rate (triple net) -- $10.86
�2015 city construction permits – 47 issued for 3,776,500 sq. ft. or $47.4 million
esTiMaTeD lanD cosTs Per square fooT inDusTrial ParK loW cosT $ HiGH cosT $ MeDian cosT $
one acre 1.50 5.00 3.00
1 - 5 acres 1.50 4.00 2.75
5 - 10 acres 0.75 3.00 1.75
10 - 20 acres 0.50 2.00 1.25
20 - 40 acres 0.35 1.00 0.60
over 40 acres 0.25 0.75 0.40
non-inDusTrial ParK loW cosT $ HiGH cosT $ MeDian cosT $
one acre 1.00 3.00 1.75
1 - 5 acres 0.75 2.50 1.25
5 - 10 acres 0.50 2.00 1.00
10 - 20 acres 0.25 1.50 0.75
20 - 40 acres 0.15 0.75 0.35
over 40 acres 0.10 0.50 0.15
reTail loW cosT $ HiGH cosT $ MeDian cosT $
one acre 12.00 25.00 14.00
1 - 5 acres 6.00 15.00 9.00
5 - 10 acres 5.00 10.00 7.00
10 - 20 acres 3.50 5.50 4.50
20 - 40 acres 2.00 4.00 3.00
over 40 acres 1.50 3.00 2.25
CBRE Oklahoma & Research Wizard City/County Library Aug. 2016
reTail MarKeT suMMarYsubMarKeT renTal sq. fT. VacanT sq. fT. VacancY % aVeraGe raTe $
CBD 639,584 31,979 5.0 19.79
Woodland Hills 4,137,851 45,516 1.1 10.34
South Memorial 7,160,468 114,567 1.6 17.25
Midtown 3,541,201 180,601 5.1 15.85
Southwest 2,137,266 141,060 6.6 12.36
Southeast 4,614,023 341,438 7.4 8.68
North 4,061,828 60,927 1.5 12.91
West 2,549,569 178,470 7.0 7.18
East 4,984,775 423,706 8.5 6.97
Total 33,826,565 1,691,328 5.0 10.86
CBRE Oklahoma Tulsa Retail Mid-Year 2016 & Research Wizard, City/County Library Aug. 2016
6 tulsa Business location data
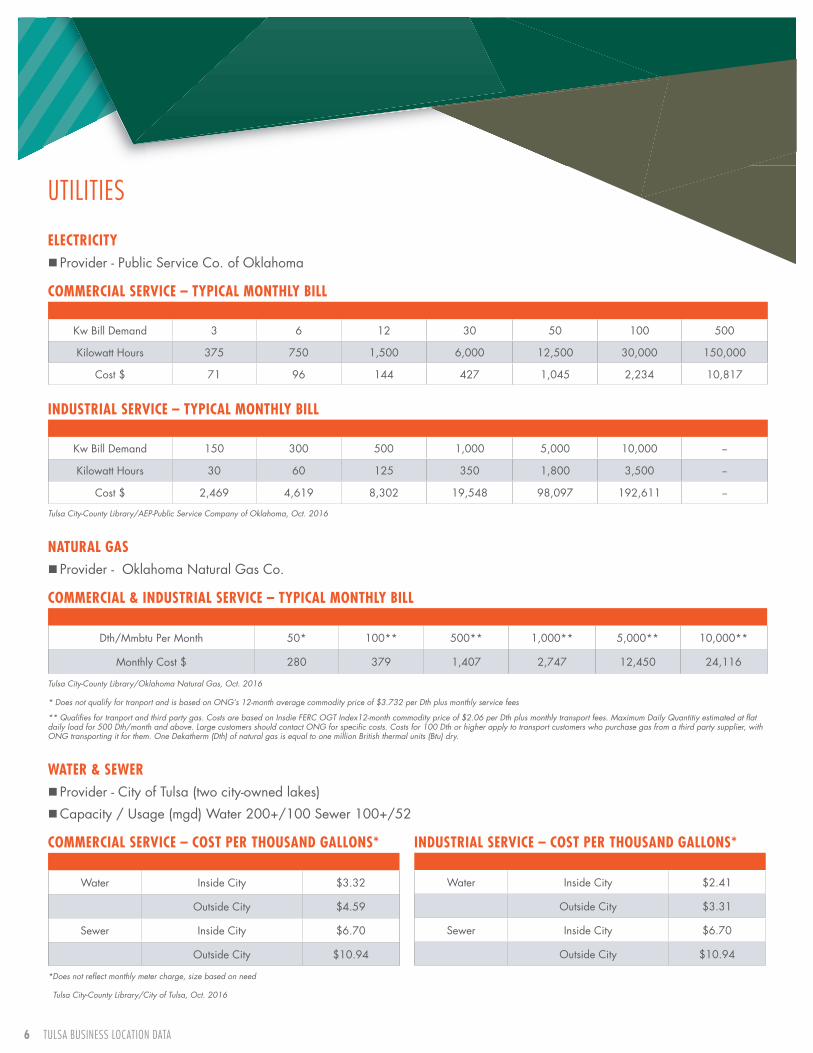
naTural Gas � Provider - Oklahoma Natural Gas Co.
coMMercial serVice – cosT Per THousanD Gallons*
Water Inside City $3.32
Outside City $4.59
Sewer Inside City $6.70
Outside City $10.94
inDusTrial serVice – cosT Per THousanD Gallons*
Water Inside City $2.41
Outside City $3.31
Sewer Inside City $6.70
Outside City $10.94
coMMercial & inDusTrial serVice – TYPical MonTHlY bill
Dth/Mmbtu Per Month 50* 100** 500** 1,000** 5,000** 10,000**
Monthly Cost $ 280 379 1,407 2,747 12,450 24,116
elecTriciTY � Provider - Public Service Co. of Oklahoma
coMMercial serVice – TYPical MonTHlY bill
Kw Bill Demand 3 6 12 30 50 100 500
Kilowatt Hours 375 750 1,500 6,000 12,500 30,000 150,000
Cost $ 71 96 144 427 1,045 2,234 10,817
inDusTrial serVice – TYPical MonTHlY bill
Kw Bill Demand 150 300 500 1,000 5,000 10,000 --
Kilowatt Hours 30 60 125 350 1,800 3,500 --
Cost $ 2,469 4,619 8,302 19,548 98,097 192,611 --
Tulsa City-County Library/AEP-Public Service Company of Oklahoma, Oct. 2016
*Does not reflect monthly meter charge, size based on need
Tulsa City-County Library/City of Tulsa, Oct. 2016
Tulsa City-County Library/Oklahoma Natural Gas, Oct. 2016
* Does not qualify for tranport and is based on ONG’s 12-month average commodity price of $3.732 per Dth plus monthly service fees
** Qualifies for tranport and third party gas. Costs are based on Insdie FERC OGT Index12-month commodity price of $2.06 per Dth plus monthly transport fees. Maximum Daily Quantitiy estimated at flat daily load for 500 Dth/month and above. Large customers should contact ONG for specific costs. Costs for 100 Dth or higher apply to transport customers who purchase gas from a third party supplier, with ONG transporting it for them. One Dekatherm (Dth) of natural gas is equal to one million British thermal units (Btu) dry.
WaTer & seWer � Provider - City of Tulsa (two city-owned lakes)
�Capacity / Usage (mgd) Water 200+/100 Sewer 100+/52
utilities
GRoWMetRotulsa.coM 7
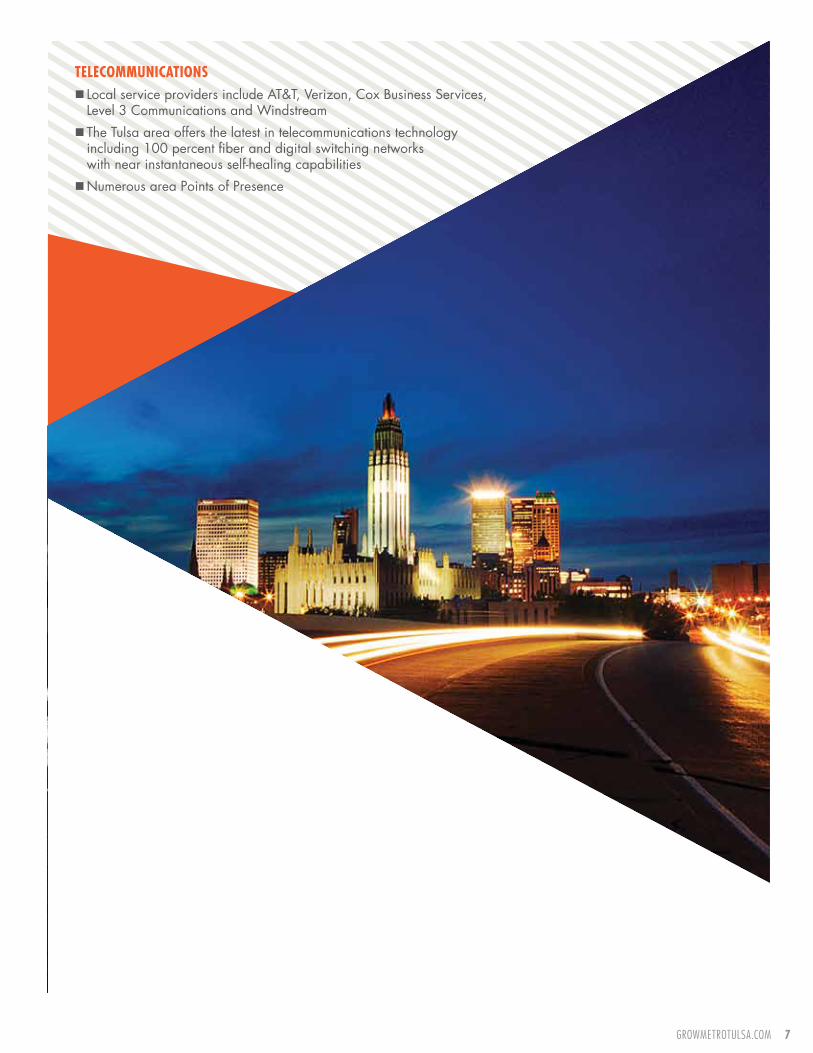
TelecoMMunicaTions � Local service providers include AT&T, Verizon, Cox Business Services, Level 3 Communications and Windstream
� The Tulsa area offers the latest in telecommunications technology including 100 percent fiber and digital switching networks with near instantaneous self-healing capabilities
�Numerous area Points of Presence
8 tulsa Business location data
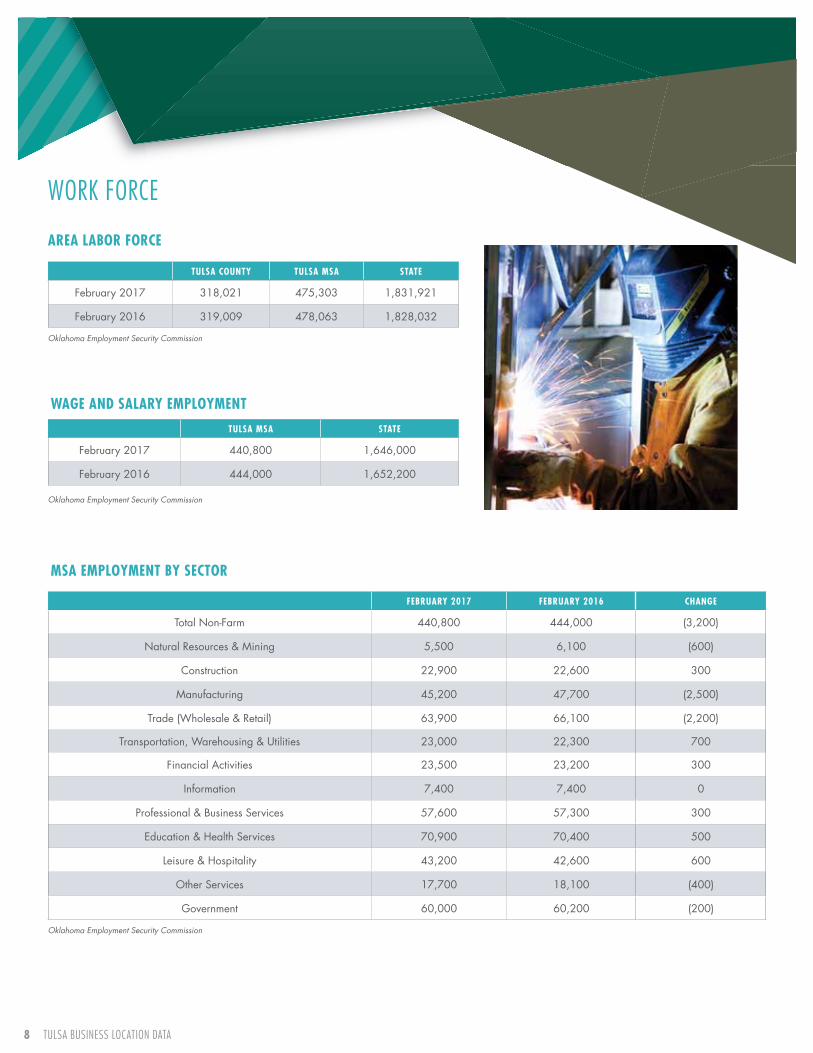
WoRK FoRce
area labor force
WaGe anD salarY eMPloYMenT
Msa eMPloYMenT bY secTor
Tulsa counTY Tulsa Msa sTaTe
February 2017 318,021 475,303 1,831,921
February 2016 319,009 478,063 1,828,032
Tulsa Msa sTaTe
February 2017 440,800 1,646,000
February 2016 444,000 1,652,200
februarY 2017 februarY 2016 cHanGe
Total Non-Farm 440,800 444,000 (3,200)
Natural Resources & Mining 5,500 6,100 (600)
Construction 22,900 22,600 300
Manufacturing 45,200 47,700 (2,500)
Trade (Wholesale & Retail) 63,900 66,100 (2,200)
Transportation, Warehousing & Utilities 23,000 22,300 700
Financial Activities 23,500 23,200 300
Information 7,400 7,400 0
Professional & Business Services 57,600 57,300 300
Education & Health Services 70,900 70,400 500
Leisure & Hospitality 43,200 42,600 600
Other Services 17,700 18,100 (400)
Government 60,000 60,200 (200)
Oklahoma Employment Security Commission
Oklahoma Employment Security Commission
Oklahoma Employment Security Commission
GRoWMetRotulsa.coM 9
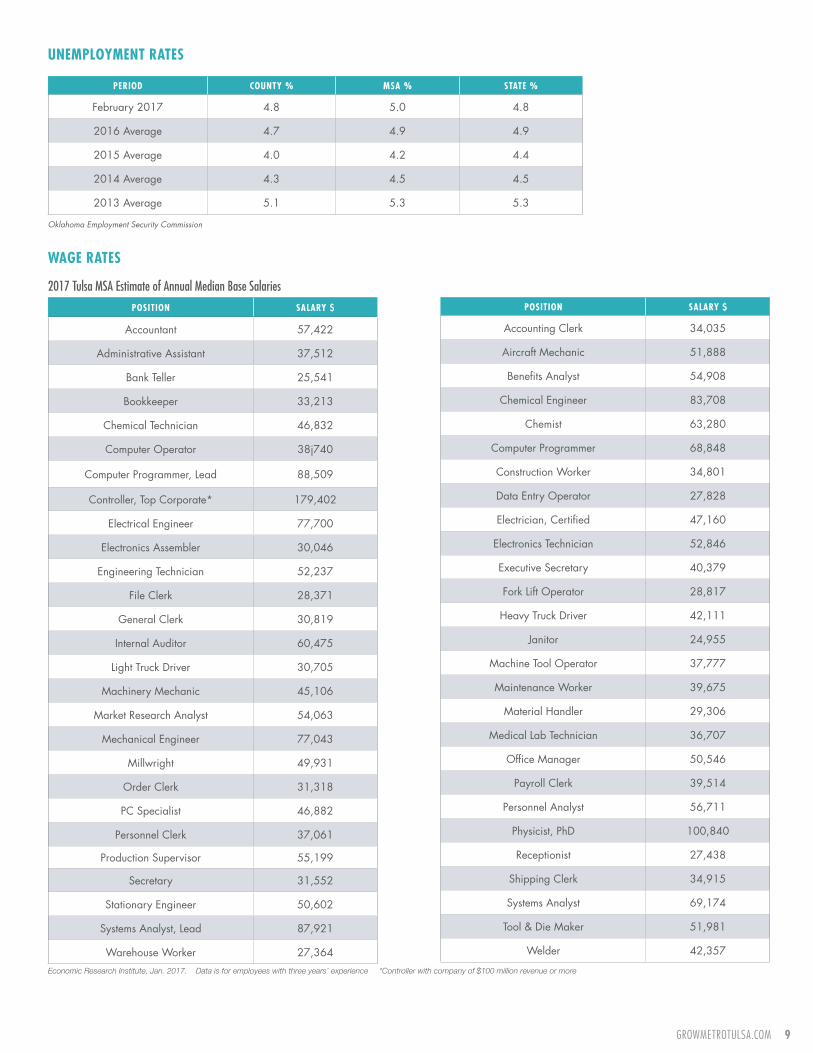
uneMPloYMenT raTes
WaGe raTes
PerioD counTY % Msa % sTaTe %
February 2017 4.8 5.0 4.8
2016 Average 4.7 4.9 4.9
2015 Average 4.0 4.2 4.4
2014 Average 4.3 4.5 4.5
2013 Average 5.1 5.3 5.3
PosiTion salarY $
Accountant 57,422
Administrative Assistant 37,512
Bank Teller 25,541
Bookkeeper 33,213
Chemical Technician 46,832
Computer Operator 38j740
Computer Programmer, Lead 88,509
Controller, Top Corporate* 179,402
Electrical Engineer 77,700
Electronics Assembler 30,046
Engineering Technician 52,237
File Clerk 28,371
General Clerk 30,819
Internal Auditor 60,475
Light Truck Driver 30,705
Machinery Mechanic 45,106
Market Research Analyst 54,063
Mechanical Engineer 77,043
Millwright 49,931
Order Clerk 31,318
PC Specialist 46,882
Personnel Clerk 37,061
Production Supervisor 55,199
Secretary 31,552
Stationary Engineer 50,602
Systems Analyst, Lead 87,921
Warehouse Worker 27,364
PosiTion salarY $
Accounting Clerk 34,035
Aircraft Mechanic 51,888
Benefits Analyst 54,908
Chemical Engineer 83,708
Chemist 63,280
Computer Programmer 68,848
Construction Worker 34,801
Data Entry Operator 27,828
Electrician, Certified 47,160
Electronics Technician 52,846
Executive Secretary 40,379
Fork Lift Operator 28,817
Heavy Truck Driver 42,111
Janitor 24,955
Machine Tool Operator 37,777
Maintenance Worker 39,675
Material Handler 29,306
Medical Lab Technician 36,707
Office Manager 50,546
Payroll Clerk 39,514
Personnel Analyst 56,711
Physicist, PhD 100,840
Receptionist 27,438
Shipping Clerk 34,915
Systems Analyst 69,174
Tool & Die Maker 51,981
Welder 42,357
Oklahoma Employment Security Commission
Economic Research Institute, Jan. 2017. Data is for employees with three years’ experience *Controller with company of $100 million revenue or more
2017 Tulsa MSA Estimate of Annual Median Base Salaries
10 tulsa Business location data
union inforMaTion
union MeMbersHiP 2015 2014 2013 2012 2011
Employment 383,874 388,210 404,444 422,281 415,158
Union Members 22,266 22,892 28,350 28,712 29,399
Percent Unionized 5.8% 5.9% 7.0% 6.8% 7.1%
PeTiTions2015 2014 2013 2012 2011
Petitions 0 5 2 0 4
Wins 0 3 1 0 2
Losses 0 2 1 0 2
Percent of Losses 0 40% 50% 0 50%
Union Membership and Coverage Database (UnionStats.com), Sept. 2016. Membership includes both private & public
National Labor Relations Board, Sept. 2016
Research Wizard - City County Library, Feb. 2017
� Tulsa – 5.8%
�National average – 11.1%
�Albuquerque, NM – 7.4%
�Denver, CO – 7.4%
�Kansas City, MO – 7.6%
� Little Rock, AR – 4.5%
� Louisville, KY – 15.2%
�St. Louis, MO – 11.7%
WorKers coMPensaTion �Rates are only quoted by job code. Oklahoma offers three options for insurance:
Union Membership and Coverage Database (UnionStats.com), September 2016
Private carrier (for list of private carriers)
Oklahoma Insurance Commissioner’s OfficeProperty & Casualty Rates Division(405) 521-3681 or www.ok.gov/oid
compsource oKState Underwriting(405) 232-7663 (800) 347-3863 or www.compsourceok.com
self insuranceOklahoma Worker’s Compensation CourtInsurance Department(405) 522-8680 or www.cec.ok.gov
2015 reGional PercenTaGe of union MeMbersHiP
GRoWMetRotulsa.coM 11
ricHarD lloYD Jones Jr. �700-acre facility with three runways – 5,101, 4,207 and 2,641 feet in length
� Two full-service fixed-base operators with six hangars for 70 aircraft
�211 commercial and private hangars
�Home to Spartan College of Aeronautics and Technology and five other flight schools
�Home to Tulsa Technology Center’s aviation campus
� Ten minutes south of downtown
�Base for 500+ aircraft and 350+ employees
�Among top 100 busiest general aviation airports in the nation
�Annual economic output of $36.5 million
oKMulGee reGional airPorT � Located three miles north of downtown Okmulgee on 1,200 acres
�General aviation airport with convenient location adjacent to Highway 75
�5,100’ x 100’ concrete runway accommodates dual tandem aircraft up to 300,000 pounds
�Home to Covington Aircraft
�22 hangars
�Original terminal building is listed on National Register of Historic Places
MaRKet accessair
Tulsa inTernaTional � Located on 4,711 acres – 700+ acres available for immediate development
� Ten minutes from most points in the city including downtown and the Port of Catoosa
�22 gates and three runways – 10,000, 7,376 and 6,101 feet in length
�Approximately 2.8 million passengers served annually
�Non-stop service to 17 cities with an average 55+ departures per day
� Three freight carriers; 2016 air freight – 59,000+ tons
� Five fixed base operators, 30 hangars and general aviation services
�U.S. Customs offices
�13,000+ people employed at 75 aerospace companies including American Airlines, Lufthansa Technik Component Services, L3 Aeromet and Spirit AeroSystems.
�Daily flights on American, Delta, Southwest, United & Allegiant Air
�Current flight information: www.TulsaAirports.com
Tulsa Airport Authority, Feb. 2017
12 tulsa Business location data
MoTor freiGHT
�Central location for major distribution centers
�Access to I-44, I-40 & I-35
�One-to-two day delivery time to major cities in West South Central region
�Numerous carriers including FedEx, UPS, Melton, Yellow, and others
roaD DisTance To MaJor MarKeTsciTY Miles KiloMeTers
Atlanta 772 1,242
Boston 1,537 2,473
Charlotte 990 1,593
Chicago 683 1,099
Cleveland 925 1,488
Dallas 263 423
Denver 681 1,096
Detroit 909 1,463
Houston 478 769
Kansas City 248 399
Los Angeles 1,452 2,336
Memphis 401 645
New Orleans 647 1,041
New York 1,344 2,162
Oklahoma City 105 169
St. Louis 396 637
Seattle 1,982 3,189
San Francisco 1,760 2,832
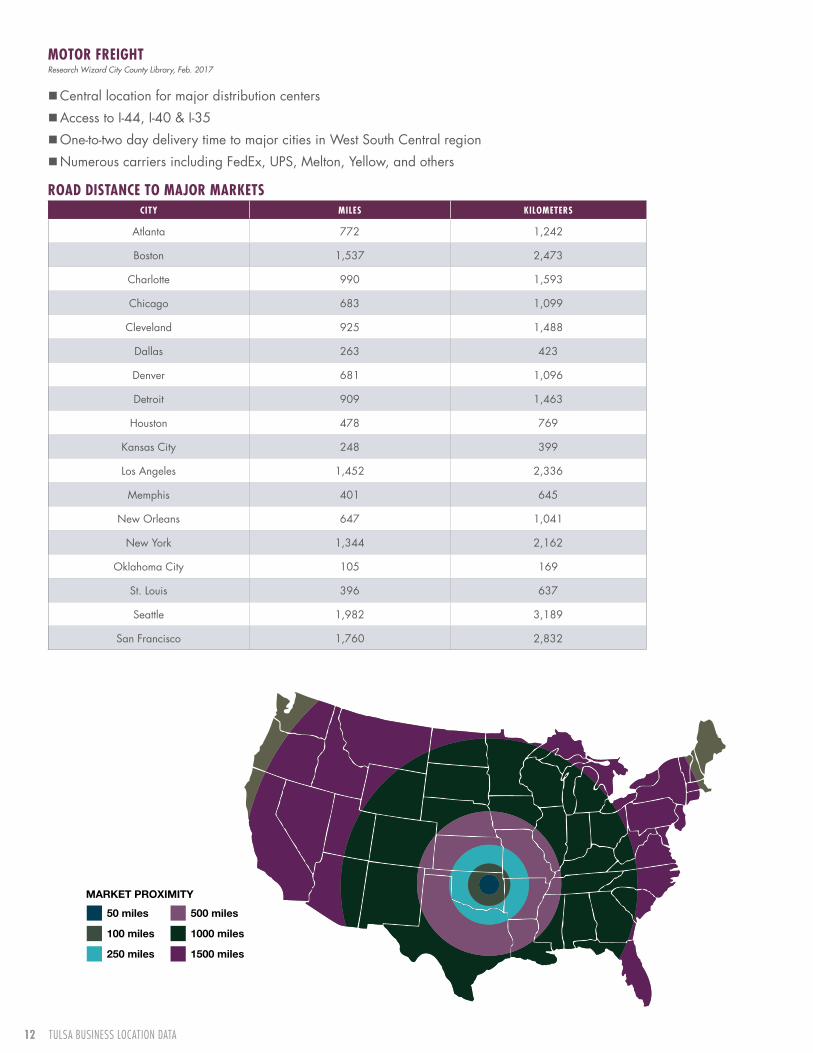
50 miles
100 miles
250 miles
500 miles
1000 miles
1500 miles
Market ProxiMity
Research Wizard City County Library, Feb. 2017
GRoWMetRotulsa.coM 13
� Two mainline carriers – BNSF & Union Pacific
� Three short line carriers – Sand Springs (OmniTRAX), Tulsa-Sapulpa Union and Southern Kansas Oklahoma (Watco Cos.)
�Area switching services and piggyback facilities
�Rail serves major industrial parks including the Tulsa Port of Catoosa
�Expediter services
rail DisTance To MaJor MarKeTsciTY DaYs
Atlanta 3
Cleveland 3
Denver 2
Houston 2
Little Rock 1
Memphis 2
Nashville 3
New York 4
Phoenix 3
Seattle 4
ciTY DaYs
Chicago 2
Dallas 1
Detroit 3
Kansas City 1
Los Angeles 4
Miami 4
New Orleans 2
Oklahoma City 1
Pittsburgh 3
St. Louis 2
� Provider – Tulsa Port of Catoosa
�Year round service – ice free
� Foreign Trade Zone 53
�500-acre terminal facilities
�1,500-acre industrial park
�2016 tonnage – 2.3 million
�2016 port industry employment – 70 businesses; 2,700+ people
�Stevedore services
�200-ton bridge crane
�Roll-on/Roll-off dock
� Port-owned rail service, truck and barge loading facilities
riVer MileaGe & TiMeDesTinaTion Miles KiloMeTers DaYs
Mississippi River 445 716 4 – 5
New Orleans 937 1,508 8 – 10
Memphis 584 940 5 – 6
Houston 1,340 2,156 10 – 12
Pittsburgh 1,799 2,895 15 – 20
Little Rock 324 526 2 – 3
Chicago 1,368 2,201 10 – 12
rail
WaTerWaY
Research Wizard City County Library, Feb. 2017
Tulsa Port of Catoosa, March 2017
14 tulsa Business location data
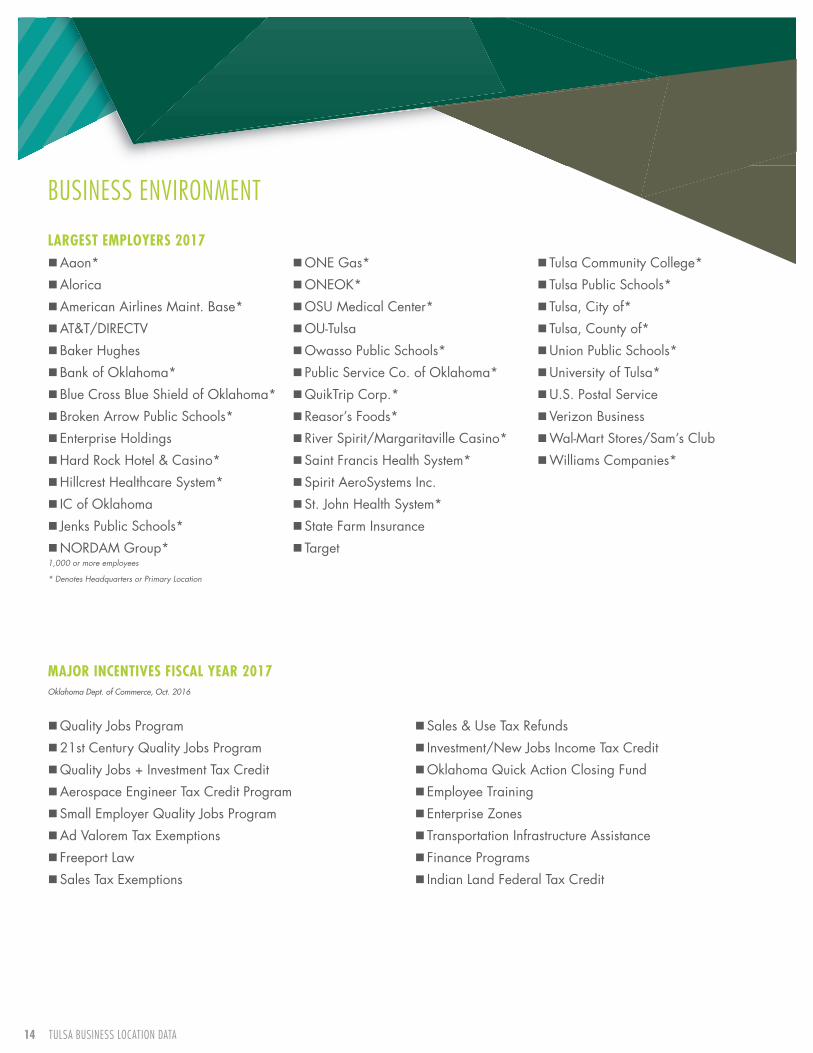
�Quality Jobs Program
�21st Century Quality Jobs Program
�Quality Jobs + Investment Tax Credit
�Aerospace Engineer Tax Credit Program
�Small Employer Quality Jobs Program
�Ad Valorem Tax Exemptions
� Freeport Law
�Sales Tax Exemptions
�Sales & Use Tax Refunds
� Investment/New Jobs Income Tax Credit
�Oklahoma Quick Action Closing Fund
�Employee Training
�Enterprise Zones
� Transportation Infrastructure Assistance
� Finance Programs
� Indian Land Federal Tax Credit
�Aaon*
�Alorica
�American Airlines Maint. Base*
�AT&T/DIRECTV
�Baker Hughes
�Bank of Oklahoma*
�Blue Cross Blue Shield of Oklahoma*
�Broken Arrow Public Schools*
�Enterprise Holdings
�Hard Rock Hotel & Casino*
�Hillcrest Healthcare System*
� IC of Oklahoma
� Jenks Public Schools*
�NORDAM Group*
�ONE Gas*
�ONEOK*
�OSU Medical Center*
�OU-Tulsa
�Owasso Public Schools*
� Public Service Co. of Oklahoma*
�QuikTrip Corp.*
�Reasor’s Foods*
�River Spirit/Margaritaville Casino*
�Saint Francis Health System*
�Spirit AeroSystems Inc.
�St. John Health System*
�State Farm Insurance
� Target
� Tulsa Community College*
� Tulsa Public Schools*
� Tulsa, City of*
� Tulsa, County of*
�Union Public Schools*
�University of Tulsa*
�U.S. Postal Service
�Verizon Business
�Wal-Mart Stores/Sam’s Club
�Williams Companies*
1,000 or more employees
* Denotes Headquarters or Primary Location
Oklahoma Dept. of Commerce, Oct. 2016
larGesT eMPloYers 2017
Business enviRonMent
MaJor incenTiVes fiscal Year 2017
GRoWMetRotulsa.coM 15
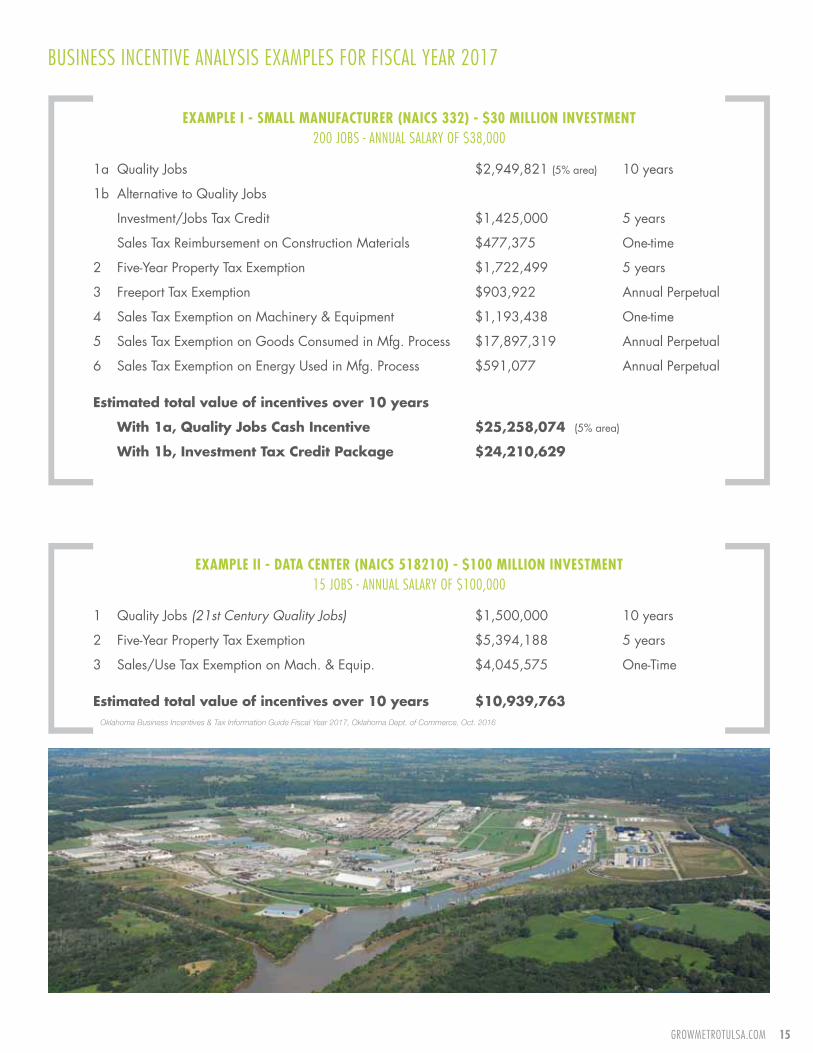
Business incentive analysis exaMPles FoR Fiscal yeaR 2017
exaMPle i - sMall ManufacTurer (naics 332) - $30 Million inVesTMenT200 joBs - annual salaRy oF $38,000
1a Quality Jobs $2,949,821 (5% area) 10 years
1b Alternative to Quality Jobs
Investment/Jobs Tax Credit $1,425,000 5 years
Sales Tax Reimbursement on Construction Materials $477,375 One-time
2 Five-Year Property Tax Exemption $1,722,499 5 years
3 Freeport Tax Exemption $903,922 Annual Perpetual
4 Sales Tax Exemption on Machinery & Equipment $1,193,438 One-time
5 Sales Tax Exemption on Goods Consumed in Mfg. Process $17,897,319 Annual Perpetual
6 Sales Tax Exemption on Energy Used in Mfg. Process $591,077 Annual Perpetual
Estimated total value of incentives over 10 years
With 1a, Quality Jobs Cash Incentive $25,258,074 (5% area)
With 1b, Investment Tax Credit Package $24,210,629
exaMPle ii - DaTa cenTer (naics 518210) - $100 Million inVesTMenT15 joBs - annual salaRy oF $100,000
1 Quality Jobs (21st Century Quality Jobs) $1,500,000 10 years
2 Five-Year Property Tax Exemption $5,394,188 5 years
3 Sales/Use Tax Exemption on Mach. & Equip. $4,045,575 One-Time
Estimated total value of incentives over 10 years $10,939,763Oklahoma Business Incentives & Tax Information Guide Fiscal Year 2017, Oklahoma Dept. of Commerce, Oct. 2016
16 tulsa Business location data
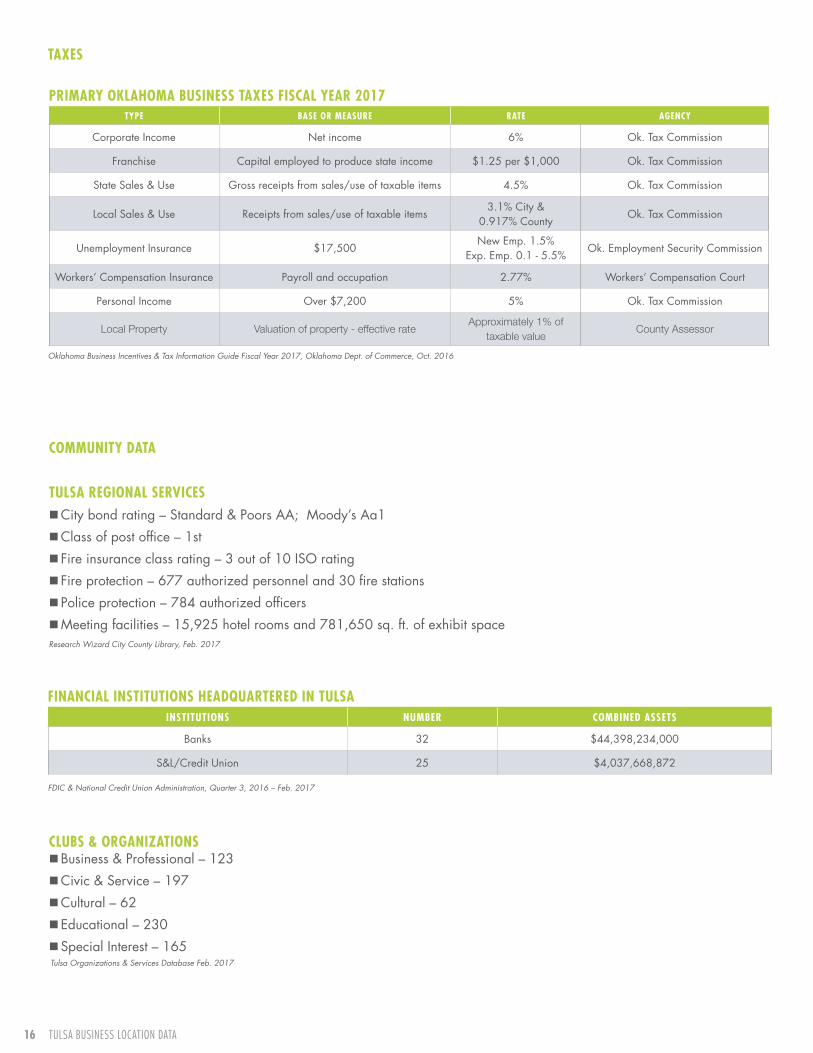
PriMarY oKlaHoMa business Taxes fiscal Year 2017TYPe base or Measure raTe aGencY
Corporate Income Net income 6% Ok. Tax Commission
Franchise Capital employed to produce state income $1.25 per $1,000 Ok. Tax Commission
State Sales & Use Gross receipts from sales/use of taxable items 4.5% Ok. Tax Commission
Local Sales & Use Receipts from sales/use of taxable items3.1% City &
0.917% CountyOk. Tax Commission
Unemployment Insurance $17,500New Emp. 1.5%
Exp. Emp. 0.1 - 5.5%Ok. Employment Security Commission
Workers’ Compensation Insurance Payroll and occupation 2.77% Workers’ Compensation Court
Personal Income Over $7,200 5% Ok. Tax Commission
Local Property Valuation of property - effective rateApproximately 1% of
taxable valueCounty Assessor
financial insTiTuTions HeaDquarTereD in TulsainsTiTuTions nuMber coMbineD asseTs
Banks 32 $44,398,234,000
S&L/Credit Union 25 $4,037,668,872
Oklahoma Business Incentives & Tax Information Guide Fiscal Year 2017, Oklahoma Dept. of Commerce, Oct. 2016
FDIC & National Credit Union Administration, Quarter 3, 2016 – Feb. 2017
Tulsa Organizations & Services Database Feb. 2017
Tulsa reGional serVices �City bond rating – Standard & Poors AA; Moody’s Aa1
�Class of post office – 1st
� Fire insurance class rating – 3 out of 10 ISO rating
� Fire protection – 677 authorized personnel and 30 fire stations
� Police protection – 784 authorized officers
�Meeting facilities – 15,925 hotel rooms and 781,650 sq. ft. of exhibit space
�Business & Professional – 123
�Civic & Service – 197
�Cultural – 62
�Educational – 230
�Special Interest – 165
clubs & orGanizaTions
Taxes
coMMuniTY DaTa
Research Wizard City County Library, Feb. 2017
GRoWMetRotulsa.coM 17
18 tulsa Business location data
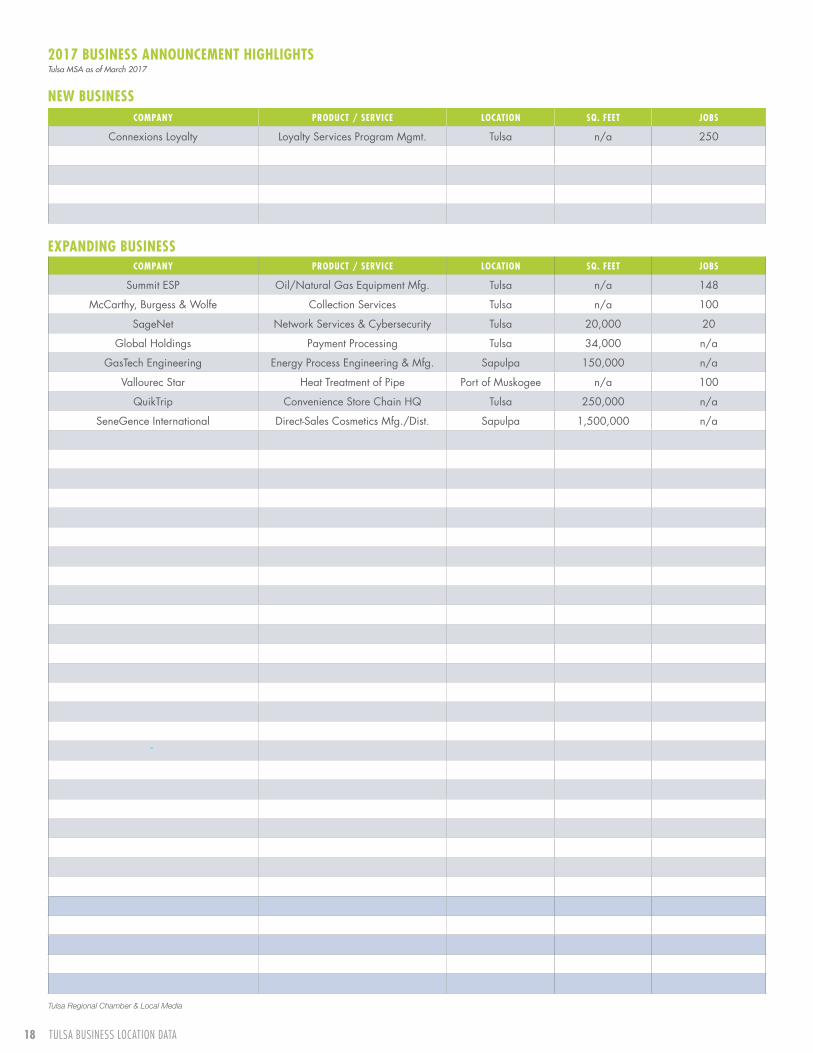
coMPanY ProDucT / serVice locaTion sq. feeT Jobs
Summit ESP Oil/Natural Gas Equipment Mfg. Tulsa n/a 148
McCarthy, Burgess & Wolfe Collection Services Tulsa n/a 100
SageNet Network Services & Cybersecurity Tulsa 20,000 20
Global Holdings Payment Processing Tulsa 34,000 n/a
GasTech Engineering Energy Process Engineering & Mfg. Sapulpa 150,000 n/a
Vallourec Star Heat Treatment of Pipe Port of Muskogee n/a 100
QuikTrip Convenience Store Chain HQ Tulsa 250,000 n/a
SeneGence International Direct-Sales Cosmetics Mfg./Dist. Sapulpa 1,500,000 n/a
Tulsa Regional Chamber & Local Media
2017 business announceMenT HiGHliGHTs
coMPanY ProDucT / serVice locaTion sq. feeT Jobs
Connexions Loyalty Loyalty Services Program Mgmt. Tulsa n/a 250
exPanDinG business
neW business
Tulsa MSA as of March 2017
GRoWMetRotulsa.coM 19
Quality oF liFe
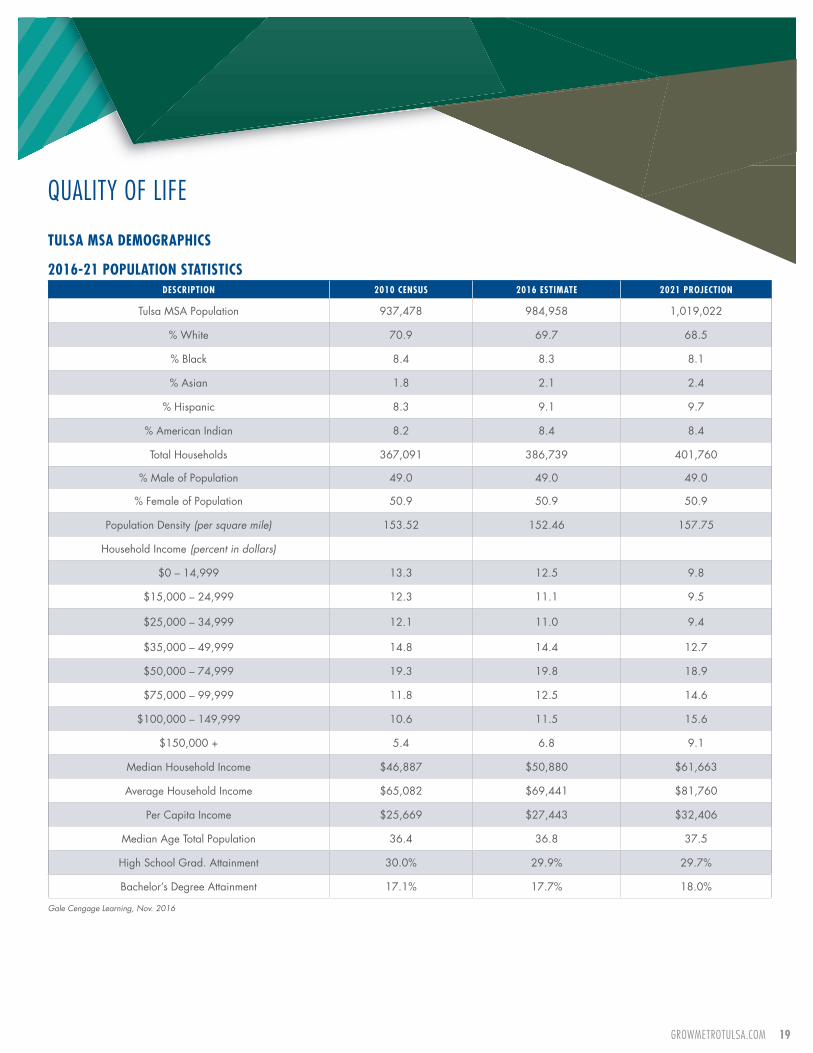
Tulsa Msa DeMoGraPHics
2016-21 PoPulaTion sTaTisTicsDescriPTion 2010 census 2016 esTiMaTe 2021 ProJecTion
Tulsa MSA Population 937,478 984,958 1,019,022
% White 70.9 69.7 68.5
% Black 8.4 8.3 8.1
% Asian 1.8 2.1 2.4
% Hispanic 8.3 9.1 9.7
% American Indian 8.2 8.4 8.4
Total Households 367,091 386,739 401,760
% Male of Population 49.0 49.0 49.0
% Female of Population 50.9 50.9 50.9
Population Density (per square mile) 153.52 152.46 157.75
Household Income (percent in dollars)
$0 – 14,999 13.3 12.5 9.8
$15,000 – 24,999 12.3 11.1 9.5
$25,000 – 34,999 12.1 11.0 9.4
$35,000 – 49,999 14.8 14.4 12.7
$50,000 – 74,999 19.3 19.8 18.9
$75,000 – 99,999 11.8 12.5 14.6
$100,000 – 149,999 10.6 11.5 15.6
$150,000 + 5.4 6.8 9.1
Median Household Income $46,887 $50,880 $61,663
Average Household Income $65,082 $69,441 $81,760
Per Capita Income $25,669 $27,443 $32,406
Median Age Total Population 36.4 36.8 37.5
High School Grad. Attainment 30.0% 29.9% 29.7%
Bachelor’s Degree Attainment 17.1% 17.7% 18.0%
Gale Cengage Learning, Nov. 2016
20 tulsa Business location data
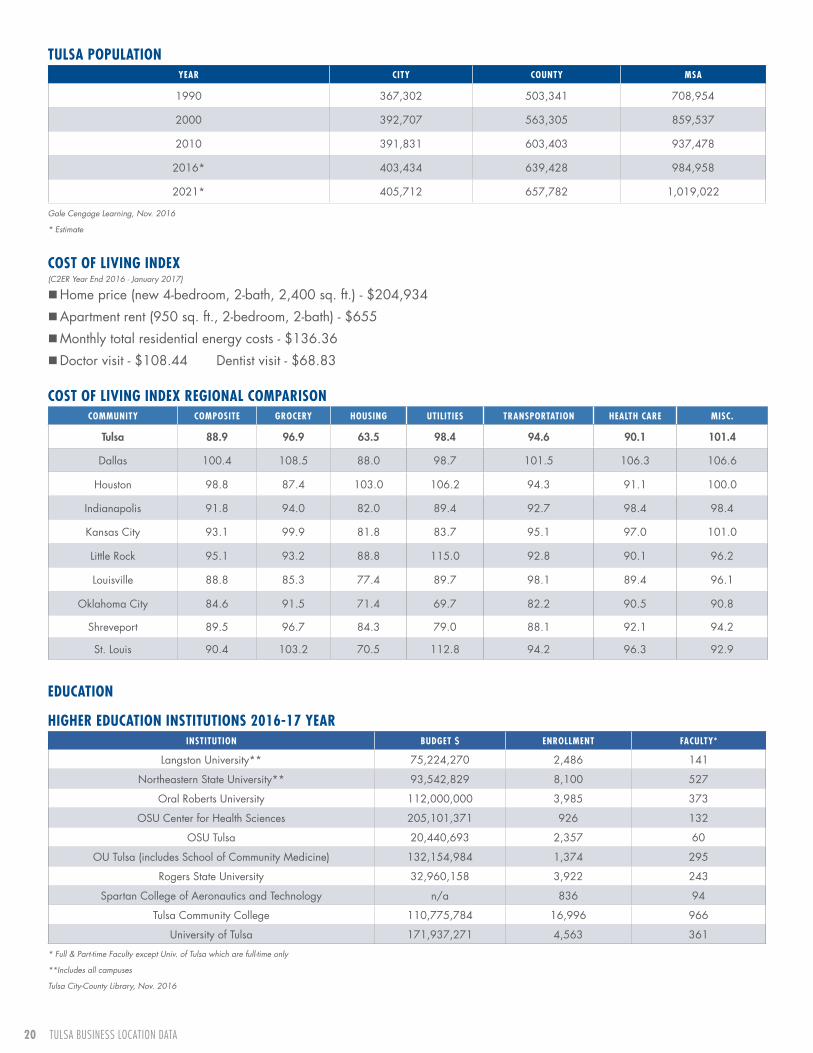
Tulsa PoPulaTionYear ciTY counTY Msa
1990 367,302 503,341 708,954
2000 392,707 563,305 859,537
2010 391,831 603,403 937,478
2016* 403,434 639,428 984,958
2021* 405,712 657,782 1,019,022
Gale Cengage Learning, Nov. 2016
* Estimate
* Full & Part-time Faculty except Univ. of Tulsa which are full-time only
**Includes all campuses
Tulsa City-County Library, Nov. 2016
cosT of liVinG inDex
eDucaTion
cosT of liVinG inDex reGional coMParison coMMuniTY coMPosiTe GrocerY HousinG uTiliTies TransPorTaTion HealTH care Misc.
Tulsa 88.9 96.9 63.5 98.4 94.6 90.1 101.4
Dallas 100.4 108.5 88.0 98.7 101.5 106.3 106.6
Houston 98.8 87.4 103.0 106.2 94.3 91.1 100.0
Indianapolis 91.8 94.0 82.0 89.4 92.7 98.4 98.4
Kansas City 93.1 99.9 81.8 83.7 95.1 97.0 101.0
Little Rock 95.1 93.2 88.8 115.0 92.8 90.1 96.2
Louisville 88.8 85.3 77.4 89.7 98.1 89.4 96.1
Oklahoma City 84.6 91.5 71.4 69.7 82.2 90.5 90.8
Shreveport 89.5 96.7 84.3 79.0 88.1 92.1 94.2
St. Louis 90.4 103.2 70.5 112.8 94.2 96.3 92.9
HiGHer eDucaTion insTiTuTions 2016-17 YearinsTiTuTion buDGeT $ enrollMenT faculTY*
Langston University** 75,224,270 2,486 141
Northeastern State University** 93,542,829 8,100 527
Oral Roberts University 112,000,000 3,985 373
OSU Center for Health Sciences 205,101,371 926 132
OSU Tulsa 20,440,693 2,357 60
OU Tulsa (includes School of Community Medicine) 132,154,984 1,374 295
Rogers State University 32,960,158 3,922 243
Spartan College of Aeronautics and Technology n/a 836 94
Tulsa Community College 110,775,784 16,996 966
University of Tulsa 171,937,271 4,563 361
�Home price (new 4-bedroom, 2-bath, 2,400 sq. ft.) - $204,934
�Apartment rent (950 sq. ft., 2-bedroom, 2-bath) - $655
�Monthly total residential energy costs - $136.36
�Doctor visit - $108.44 Dentist visit - $68.83
(C2ER Year End 2016 - January 2017)
GRoWMetRotulsa.coM 21
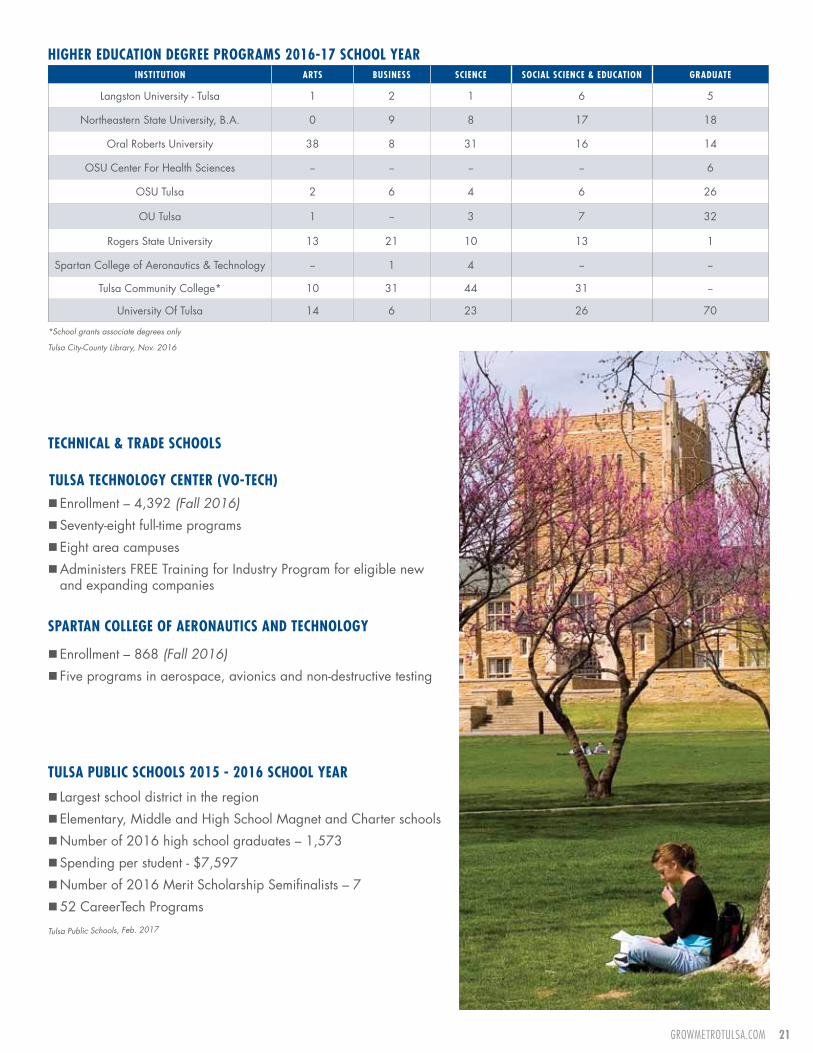
*School grants associate degrees only
Tulsa City-County Library, Nov. 2016
TecHnical & TraDe scHools
HiGHer eDucaTion DeGree ProGraMs 2016-17 scHool YearinsTiTuTion arTs business science social science & eDucaTion GraDuaTe
Langston University - Tulsa 1 2 1 6 5
Northeastern State University, B.A. 0 9 8 17 18
Oral Roberts University 38 8 31 16 14
OSU Center For Health Sciences -- -- -- -- 6
OSU Tulsa 2 6 4 6 26
OU Tulsa 1 -- 3 7 32
Rogers State University 13 21 10 13 1
Spartan College of Aeronautics & Technology -- 1 4 -- --
Tulsa Community College* 10 31 44 31 --
University Of Tulsa 14 6 23 26 70
�Enrollment – 4,392 (Fall 2016)
�Seventy-eight full-time programs
�Eight area campuses
�Administers FREE Training for Industry Program for eligible new and expanding companies
Tulsa TecHnoloGY cenTer (Vo-TecH)
�Enrollment – 868 (Fall 2016)
� Five programs in aerospace, avionics and non-destructive testing
sParTan colleGe of aeronauTics anD TecHnoloGY
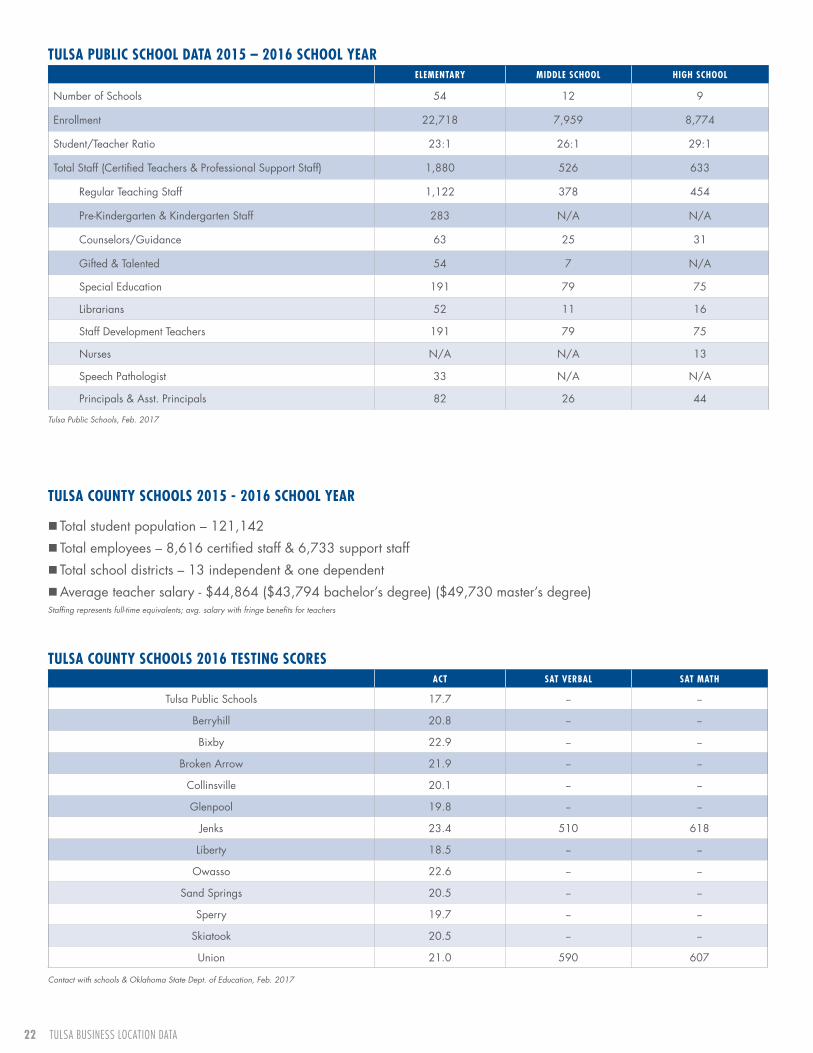
Tulsa Public scHools 2015 - 2016 scHool Year
� Largest school district in the region
�Elementary, Middle and High School Magnet and Charter schools
�Number of 2016 high school graduates – 1,573
�Spending per student - $7,597
�Number of 2016 Merit Scholarship Semifinalists – 7
�52 CareerTech Programs
Tulsa Public Schools, Feb. 2017
22 tulsa Business location data
Tulsa Public Schools, Feb. 2017
Contact with schools & Oklahoma State Dept. of Education, Feb. 2017
Tulsa Public scHool DaTa 2015 – 2016 scHool YeareleMenTarY MiDDle scHool HiGH scHool
Number of Schools 54 12 9
Enrollment 22,718 7,959 8,774
Student/Teacher Ratio 23:1 26:1 29:1
Total Staff (Certified Teachers & Professional Support Staff) 1,880 526 633
Regular Teaching Staff 1,122 378 454
Pre-Kindergarten & Kindergarten Staff 283 N/A N/A
Counselors/Guidance 63 25 31
Gifted & Talented 54 7 N/A
Special Education 191 79 75
Librarians 52 11 16
Staff Development Teachers 191 79 75
Nurses N/A N/A 13
Speech Pathologist 33 N/A N/A
Principals & Asst. Principals 82 26 44
Tulsa counTY scHools 2016 TesTinG scoresacT saT Verbal saT MaTH
Tulsa Public Schools 17.7 -- --
Berryhill 20.8 -- --
Bixby 22.9 -- --
Broken Arrow 21.9 -- --
Collinsville 20.1 -- --
Glenpool 19.8 -- --
Jenks 23.4 510 618
Liberty 18.5 -- --
Owasso 22.6 -- --
Sand Springs 20.5 -- --
Sperry 19.7 -- --
Skiatook 20.5 -- --
Union 21.0 590 607
Tulsa counTY scHools 2015 - 2016 scHool Year
� Total student population – 121,142
� Total employees – 8,616 certified staff & 6,733 support staff
� Total school districts – 13 independent & one dependent
�Average teacher salary - $44,864 ($43,794 bachelor’s degree) ($49,730 master’s degree)Staffing represents full-time equivalents; avg. salary with fringe benefits for teachers
GRoWMetRotulsa.coM 23
State Dept. of Education & Tulsa City-County Library, July 2016
Tulsa HosPiTals (VISION TULSA 2017, FEB. 2017)
FACILITY BEDS BASSINETS BIRTHS INPATIENT -OUTPATIENT ADMISSIONS
EMERGENCY ADMISSIONS
Cancer Treatment Centers of America 40 N/A N/A 683/21,942 N/A
Children’s Hospital at Saint Francis 162 N/A N/A 8,427/N/A N/A
Hillcrest Medical Center 727 32 2,950 23,594/183,112 44,631
Hillcrest Hospital South 180 33 1,407 7,609/25,495 22,795
Laureate Psychiatric Clinic & Hospital 91 N/A N/A 2,759/10,876 N/A
OSU Medical Center 249 15 413 7,061/19,558 39,171
Saint Francis Hospital 1,112 34 4,128 36,519/315,641 104,004
Saint Francis Hospital South 84 12 1,086 4,419/49,534 27,178
St. John Medical Center 555 20 2,440 32,300/252,000 62,100
reVenue 2014 - 2015 Tulsa counTY scHool Year reVenue aMounT $ PercenT
Total Local & County 263,914,653 34.9
Total State Dedicated & Appropriated 427,902,996 56.6
Total Federal 64,313,272 8.5
Grand Total 756,130,921 100
� Physicians – 1,698
�Dentists – 513
� Local HMO’s – 7
�Ambulatory surgery centers - 11
�Medical clinics – 196
HealTH care
area serVices (Research Wizard, Tulsa City-County Library, Feb. 2017)
24 tulsa Business location data
�American Theatre Company
� Theatre Tulsa
� Tulsa Ballet Theater
� Tulsa Opera
� Tulsa Symphony
�Celebrity Attractions Broadway Theater
� Tulsa State Fair
�Mayfest Arts Festival
� Linde Oktoberfest
�ONEOK Freedomfest July 4th Celebration
�Gatesway Balloon Festival
�BOK Winterfest Holiday Festival
�Center of the Universe Music Festival
�Numerous Ethnic & Cultural Festivals
�BOK Center Arena
�Cain’s Ballroom
�Brady Theater
�Oklahoma Aquarium
�Golfing – 24 public; 10 private
�138 Area Parks
�Expo Square Events
�Safari Joe’s H2O Waterpark
� Tulsa Zoo, Mohawk Park & Oxley Nature Center
�Municipal Rose Garden
�Seven Area Lakes
�River Parks and Trails
�Guthrie Green & Events
� Tulsa Drillers Baseball
� Tulsa Oilers Hockey
� Tulsa Athletics Soccer
� Tulsa Roughnecks USL Pro Soccer
�Annual Tulsa Run
�University of Tulsa Golden Hurricane
�Oral Roberts University Golden Eagles
� Fair Meadows Horse Racing
�Woodland Hills Mall – 165 stores including Sears, Dillard’s, Macy’s & JC Penney
� Tulsa Promenade Mall – 96 stores including Dillard’s & JC Penney
�Utica Square – 60 stores including Saks Fifth Avenue
� The Farm – Unique outdoor center with more than 40 specialty shops
� Tulsa Hills – 146-acre outdoor center including Lowe’s, Belk, Target, Sam’s and 46 others
�And 149 other centers
PerforMinG arTs
fesTiVals & fairs
local enTerTainMenT & ouTDoor recreaTion
sPorTinG eVenTs
MaJor sHoPPinG DesTinaTions
�Alexandre Hogue Gallery
�Elsing Museum
�Gilcrease Museum
�Hardesty Arts Center (AHHA Tulsa)
� Ida Dennie Willis Museum
�Oklahoma Jazz Hall of Fame
� Philbrook Museum of Art & Philbrook Downtown
�Sherwin Miller Museum of Jewish Art
� Tulsa Air & Space Museum
� Tulsa Children’s Museum
� Tulsa Historical Society
�Woody Guthrie Center
culTure & recreaTion HiGHliGHTs
MuseuMs
GRoWMetRotulsa.coM 25
�Average annual rainfall – 41 in., snowfall – 9 in.
�Average humidity – 81% morning & 56% afternoon
�Average temperature
�Robberies – 98.6
�Rapes – 59.5
�Homicides – 8.1
�Assaults – 334.6
�Central time zone
�Area code – 918 or 539
� Founded in 1898
�Metro area square miles – 5,151
�City area square miles – 192
�Elevation – 725 feet above sea level
�27 local radio stations
�100+ digital/HD cable-television channels
�One daily metro newspaper and numerous weekly
�Estimated average hotel costs - $79 per day
�Number of hotels and motels – 235
�Estimated average food and other costs - $51 per day
�Number of restaurants – 2,169
�Direction of prevailing wind and speed – southerly, 10 mph.
�Average days of sunshine per year – 227
cliMaTe
oTHer facTs
Tulsa Msa ciTY criMe raTes
Miscellaneous facTs
MeDia
VisiTor cosTs
MonTH HiGH loW
July 94 73
January 46 25
FBI Uniform Crime Reports, Feb. 2017
ERI Geographic Reference Report, Feb. 2017
(PeR 100,000 POPuLATiOn)
26 tulsa Business location data
In Tulsa7912 East 31st Court, Suite 200Tulsa, OK 74145T 918.665.3830F 918.663.6402
In Oklahoma City1200 N. W. 63rd Street, Suite 300Oklahoma City, OK 73116T 405.272.5300F 405.272.5355
LAKE
YAHOLA
LAKE
SAHOMA
Arkansas
Arkansas
River
River
Rive
r
Verdigris
SKIATOOKLAKE
TU
LSA
CO
UN
TY
WA
GO
NE
R
C
OU
NT
Y
TU
LSA
CO
UN
TY
WA
GO
NE
R
C
OU
NT
Y
TU
LSA
CO
UN
TY
CR
EE
K
C
OU
NT
Y
TULSA COUNTY
CREEK COUNTY
TU
LSA
CO
UN
TY
RO
GE
RS
CO
UN
TY
ROGERS CO.WAGONER CO.
TU
LSA
CO
UN
TY
OS
AG
E
C
OU
NT
Y
TULSA ZOO
ORALROBERTS UNIV.
UNIV. OFTULSA
THOMASGILCREASE MUSEUM
TULSA STATEFAIRGROUNDS
EXPOSQUARE
DRILLERSSTADIUM
SKELLYSTADIUM
PHILBROOK MUSEUM OF ART
Woodward Park
GARDEN CTR.
MABEE CTR.
Whiteside Park
HicksPark
Mohawk Park
LaFortune Park
McClure Park
O Brine Park
ReedPark
TurkeyMountain Park
Crawford Park
New Block Park
BARTLETT
MEM. HOSP.
+
BROKEN ARROW
MED. CTR. +
ST. FRANCIS
HOSP.
+
ST. JOHN MED. CTR.
+
HILLCREST
MED. CTR.
+
OU-OSUTULSA
W. Country Rd.
W. C. Rogers Blvd.
BIXBY
SAPULPA
SPRINGS
SAND
BROKEN
ARROW
JENKS
SKIATOOK
OWASSO
COLLINSVILLE
GLENPOOL
SPERRY
CATOOSA
LEONARD
BOWDEN
MARGLO
OAK-
HURST
KIEFER
FAIR OAKS
VERDIGRIS
KEETONVILLE
TURLEY
ONETA
NEW
TULSA
One
ta
R
d.
Mid
way
Rd.
Eva
ns
R
d.
Lynn
Lane
Cou
nty
Lin
e
Rd.
209t
h
E.
Ave
.
185t
h
9th
St.
St.
1st
P
l.M
ain
0 2 4 6 M I LES1 3 5
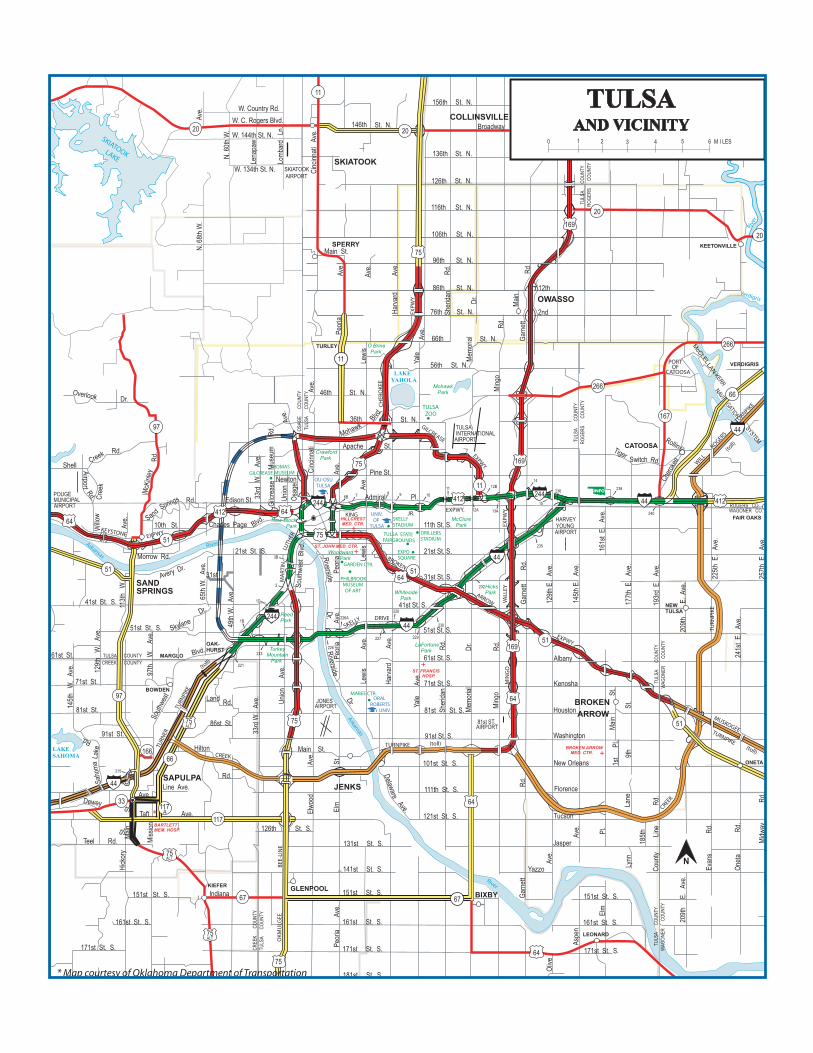
TULSAAND VICINITY
Pine St.
Apache
Mohawk
Blvd.
St.
Admiral Pl.
Newton
21st St. S.
41st St. S.
51st St. S.
61st St.
71st St.
81st St.
LandRd.
Rd.
Hilton
DeweyAve.
Ave.
Teel Rd.
Mai
n
S
t.H
icko
ry
St.
Mis
sion
Line Ave.
Taft
101st St. S.
141st St. S.
126th St. S.
131st St. S.
151st St. S.151st St. S. Indiana 151st St. S.
161st St. S.161st St. S. 161st St. S.
171st St. S.171st St. S. 171st St. S.
181st St. S.
121st St. S.
Delaw
are
Riverside
Ave.
111th St. S.
91st St.
86st St.
Main St.
Sah
oma
Lake
Rd.
Edison St.
Charles Page Blvd.
Springs
Sand
Creek
Overlook
Cre
ek
McK
inle
yR
d.
Will
ow
Rd.
Rd.
Dr.
Rd.
Shell
10th St.
Airport
Morrow Rd.
Avery Dr.
Dr.
Blvd.
(toll)
Sou
thw
est
Sou
thw
est
Blv
d.
Skylane
11th St. S.
Che
roke
e
Rollins
Switch
TigerRd.
St. N.
St. N.
St. N.
St. N.
St. N.
St. N. 12th
2nd
Main St.
W. 144th St. N.
W. 134th St. N.
St. N.
St. N.
St. N.
St. N.
St. N.
St. N. Broadway
St. N.
36th
46th
56th
66th
76th
86th
96th
106th
116th
126th
136th
146th
156th
21st St. S.
31st St. S.31st
41st St. S.
51st St. S.
61st St. S.
71st St. S.
91st St. S.
Jasper
Yazzo
Tucson
Florence
New Orleans
Washington
Houston
Kenosha
MUSKOGEE
CREEK
CREEK
TURN
ER
OK
MU
LGEE
BEE
-LIN
E
KEYSTONE
KING
SKELLY
JR.
DRIVE
BROKEN
ARROW
EXPWY.
MA
RTI
N
EXPWY.
EXPWY.
EXPWY.
GILCREASE
LUTH
ER
EXPW
Y.
CH
ERO
KEE
EXPW
Y.
VALL
EYM
ING
O
TURNPIKETURNPIKE
TURN
PIK
E
(toll)(toll)
TURN
PIKE
Albany
81st St. S.
Ave
.
Ave
.
W.
A
ve.
Ave
.
Ave
.
Ave
.
Ave
.
Ave
.N
. 68t
h W
.
N. 6
0th
W.
Cin
cinn
ati
Ave
.
Lom
bard
Ln
.
Lena
paw
Ave
.
Rd.
Rd.
Mai
n
Rd.
Dr.
Ave
.
Lew
is
Peo
ria
Uni
on
A
ve.
Lew
is
Peo
riaP
eoria
Har
vard
Yal
e
She
ridan
Mem
oria
l
Min
go
Gar
nett
Gar
nett
Oliv
e
Asp
en
Elm
Elw
ood
Elm
Ave
.
Ave
.
Ave
.A
ve.
Ave
.
Ave
.
Rd.
Dr.
Rd.
Rd.
Rd.
Ave
.
Ave
.
Pl.
St.
33rd
W.
Ave
.
129t
h E
. A
ve.
145t
h E
. A
ve.
177t
h E
. A
ve.
193r
d E
. A
ve.
225t
h E
. A
ve.
257t
h E
. A
ve.
209t
h
E
. A
ve.
161s
t E
. A
ve.
241s
t E
. A
ve.
145t
h W
. A
ve.
129t
h W
. A
ve.
Ave
.11
3th
W.
49th
W.
Ave
.
97th
W
. A
ve.
65th
W.
Ave
.
Riverside
Dr.
Dr.
Osa
ge
Uni
on
Peo
ria
Lew
is
Mem
oria
l
Min
go
Gar
nett
Yal
e
She
ridan
Har
vard
Mus
eum
Rd.
Gilc
reas
e
33rd
Cin
cinn
ati
169
169
169
51
97
97
51
51
51
67
66
33
117
166
117A
51
20
20
167
66
11
11
64
412412
412
75
75ALT
75ALT
75ALT
TULSA
JONES
81st ST.
HARVEYYOUNG
WILL
ROGERS
TURNPIKE
INTERNATIONALAIRPORT
SKIATOOK AIRPORT
AIRPORT
AIRPORT
AIRPORT
AIRPORT
POUGEMUNICIPAL
11
75
67
(toll)
SYSTEM
NAVI
-KERR
PORTOF
CATOOSA
LAN
McCLEL
GATIO
N
266
266
1D
3B
215
2
221
232
226
230
235
227
12A 13A
15
240
229
223
1B 226A
228
6B 8
11
7 10
14
236 238
9
12B
TU
LSA
CO
UN
TY
RO
GE
RS
CO
UN
TY
N
2020
44
44
44
44
244
244
244
44
75
64
64
75
64
75
64
64
* Map courtesy of Oklahoma Department of Transportation
COklahoma

GrowMetroTulsa.com TulsaChamber.com