Embed Size (px)
Citation preview
Business Optimisation of the Ya Rena Precast Plant
By
BARRY GLEN WOOD
24188086
Submitted in partial fulfillment of the requirements for the degree of
BACHELORS OF INDUSTRIAL ENGINEERING
in the
FACULTY OF ENGINEERING, BUILT ENVIRONMENT AND
INFORMATION TECHNOLOGY
UNIVERSITY OF PRETORIA
PRETORIA
OCTOBER 2008
Business Optimisation of the Ya Rena Precast Plant
1
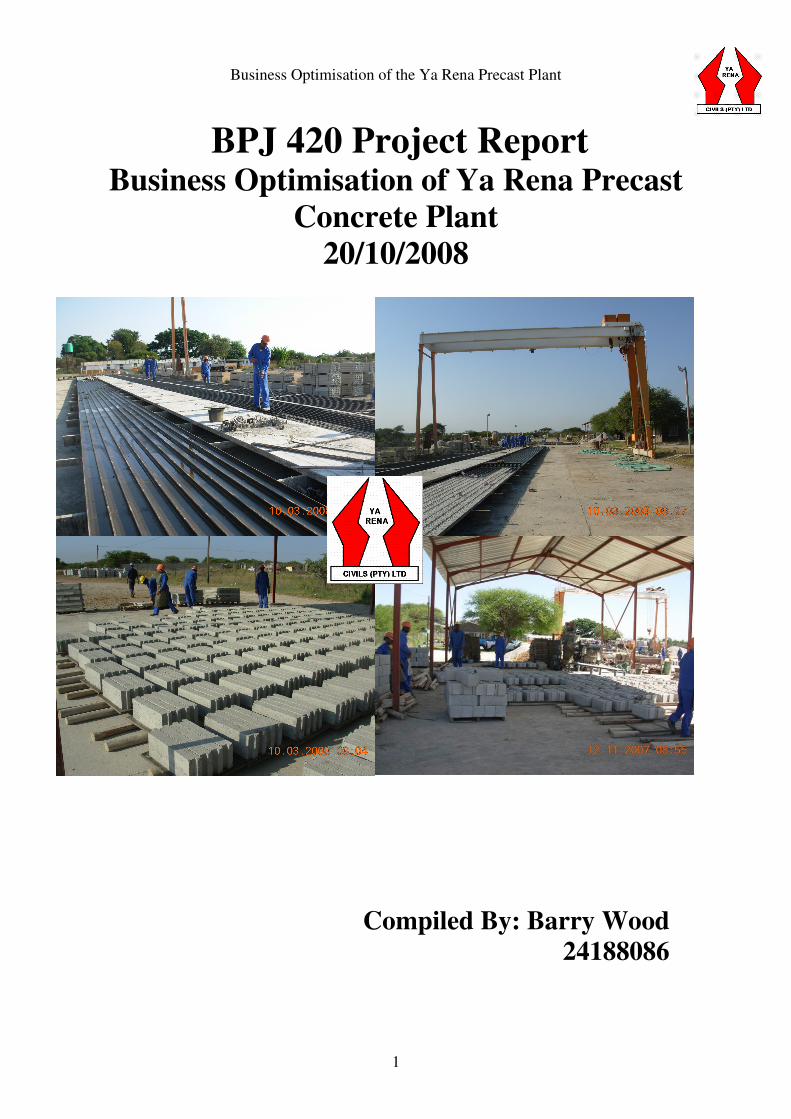
BPJ 420 Project Report Business Optimisation of Ya Rena Precast
Concrete Plant
20/10/2008
Compiled By: Barry Wood
24188086
Business Optimisation of the Ya Rena Precast Plant
2
Executive Summary
This report documents the work that was conducted for the Business Optimisation of the Ya
Rena Precast Plant. The project was completed as part of the course in Industrial Engineering
at The University of Pretoria.
The precast plant, which is located in Polokwane, is a fairly new business and as a result
there are a few minor issues which are currently hampering the organisation from performing
at its full potential. The project focuses on four different areas where improvement could be
made namely the storing of production information, production planning, material
requirement planning & production and onsite ergonomics.
Literature studies were conducted on each section followed by a design phase. To address the
issues at hand the following items were developed; a Microsoft Access Database system to
aid in data capturing, a production planning algorithm which is executed using LINGO and
interfaces with the Access Database, an ARENA Simulation of the block forming production
line and recommendation over onsite ergonomics including relevant aids and worker moral
improvement suggestions.
The project aims at empowering the onsite manager with the required tools which would
enable him/her to make more informed decisions on the day to day running of the plant. A
user manual has been attached to the project which clearly explains how each tool is to be
used.
Business Optimisation of the Ya Rena Precast Plant
3
Table of Contents:
List of Figures: .........................................................................................................................4
List of Tables: ...........................................................................................................................4
Chapter 1: Project Information and Proposal ......................................................................5
1. Introduction and Background ....................................................................................5
2. Project Aim...................................................................................................................5
3. Project Scope ................................................................................................................6
Chapter 2: Literature Study ...................................................................................................7
4. Deliverable Reasoning and Literature Review..........................................................7
4.1. Development of Microsoft Access Database for Use by the Onsite Manager 7
4.2. Production Planning ............................................................................................8
4.3. Material Requirements Planning (MRP) & Optimisation of Production
Lines ......................................................................................................................9
4.4. Evaluation and Recommendations over Onsite Ergonomic Features ..........10
5. Data Collection ...........................................................................................................11
Chapter 3: Design Stage ........................................................................................................13
6. Main Design ................................................................................................................13
6.1. Microsoft Access Database for use by the Onsite Manager ...........................13
6.2. Production Planning ..........................................................................................20
6.3. Material Requirements Planning (MRP) & Optimisation of Production
Lines ....................................................................................................................24
6.3.1 Model Overview ................................................................................................24
6.3.2 Problem Background........................................................................................28
6.3.3 Development of Model ......................................................................................29
6.3.4 Results ................................................................................................................30
6.4 Onsite Ergonomics ...................................................................................................34
6.4.1 Ergonomic Aid ..................................................................................................34
6.4.2 On-site Moral ....................................................................................................36
Chapter 4: Conclusion ...........................................................................................................38
Appendices..............................................................................................................................39
References ...............................................................................................................................58
Business Optimisation of the Ya Rena Precast Plant
4
List of Figures:
Figure 1 - Entity Relationship Diagram...................................................................................14
Figure 2 - Database Main Menu Interface ...............................................................................15
Figure 3 - Production Information Interface............................................................................16
Figure 4 - Outgoing Orders Interface.......................................................................................16
Figure 5 - Production Interface ................................................................................................17
Figure 6 - Employee Attendance Register Interface................................................................17
Figure 7 - Received Orders Interface.......................................................................................18
Figure 8 - Employees Information Interface............................................................................19
Figure 9 - Reports Page............................................................................................................20
Figure 10 - Production Planning User Interface ......................................................................23
Figure 11 - FT 90 User Interface (1)........................................................................................25
Figure 12 - FT 90 Simulation User Interface (2) .....................................................................26
Figure 13 - FT 200 Simulation User Interface (1) ...................................................................27
Figure 14 - FT 200 Simulation User Interface (2) ...................................................................28
Figure 15 – ARENA Model of Raw Material Stock Level and Order Process .......................32
Figure 16 – ARENA Model of Block Forming Production.....................................................33
Figure 17 – Back Support ........................................................................................................39
Figure 18 – Wrist Support........................................................................................................39
Figure 19 – Elbow Support ......................................................................................................40
Figure 20 – Knee Pads .............................................................................................................40
Figure 21 - Lintel Production...................................................................................................41
Figure 22 - Overhead Crane and Lintel Production Line ........................................................41
Figure 23 - Curb Production ....................................................................................................41
Figure 24 - FT 90 Block Production ........................................................................................42
Figure 25 - Curb Stock.............................................................................................................42
Figure 26 - Block Production Shed..........................................................................................42
Figure 27 - Form Block Handler..............................................................................................43
Figure 28 - Lintel Labourers Kneeling ....................................................................................43
Figure 29 - Form Block Trolley...............................................................................................43
List of Tables:
Table 1 - FT 90 Simulation Results .........................................................................................31
Table 2 - FT 200 Simulation Results .......................................................................................31
Table 3 - Job Description & Ergonomic Aid Correlation........................................................35
Table 4 - Production on 110 x Lintel Bays ..............................................................................44
Table 5 - Production on 140 x 70 Lintels ................................................................................46
Table 6 - Production on FT 90 Blocks.....................................................................................49
Table 7 - Production on FT 200 Blocks...................................................................................51
Table 8 - Production on Lattice Beams....................................................................................52
Table 99 - Lintels Monthly Production....................................................................................56
Table 100 - FT 90 Monthly Production ...................................................................................56
Table 112 - Curb Monthly Production Figures........................................................................57

Business Optimisation of the Ya Rena Precast Plant
5
Chapter 1: Project Information and Proposal
1. Introduction and Background
Ya Rena Civils (Pty) Ltd are located in Polokwane and have been running for 10 years. The
company employs around 70 – 100 people and deals mainly in civil construction with an
emphasis on concrete related works.
About two years ago a decision was taken by the company’s management to open a precast
concrete plant in Polokwane as there was a large demand for these products in the area yet
very little supply.
The plant, named Ya Rena Precast, deals mainly in the supply of precast lintels, road curbing,
bricks and various types of hollow form blocks used in the construction of suspended floors.
The business supplies these precast concrete products to building suppliers and hardware
stores in Polokwane and the nearby surrounding communities. On an average day the plant
produces around 1000 meters of lintel and pre-stressed beams, 500 hollow form blocks and
80 meters of curbing.
The precast plant is run by a full time onsite manager who has 30 laborers all with various
levels of experience and expertise.
The business deals in high volume and low variety products. Due to the fact that the business
is fairly new there are many small problems which are currently hampering the business from
being able to perform at its full potential.
2. Project Aim
The project takes an in-depth look into the operation of the Ya Rena Precast Plant. Specific
areas in the company were analysed and problems identified. Solutions to these problems
Business Optimisation of the Ya Rena Precast Plant
6
have been suggested as well as ways to implement them into the company. Optimisation tools
for the block forming production line, materials and product control as well as system
improvement are a key point of the project. The project gives a broad overview into the
improvement and streamlining of various aspects within the company’s system and
production strategy.
The various systems which have been developed focus on empowering the onsite manager
with the ability to make use of the tools without the need of recruiting outside assistance. For
this reason all of the programs come complete with a user interface and a user manual has
been attached to the project to aid in the understanding of how the programs are to be used.
3. Project Scope
The project is restricted to Ya Rena Precast and does not involve any studies into the parent
company Ya Rena Civils although there may be overlaps between the two companies in
terms of the management and overheads of the companies.
The studies are based on information gathered from the various board members, directors and
managers of Ya Rena Precast as well as from time studies and past records of the plant.
Marketing, imaging and the securing of clients are not included in the project.
The implementation of the various ideas and solutions will be decided by the management of
Ya Rena Precast yet recommendations are given in the context of the project.
Business Optimisation of the Ya Rena Precast Plant
7
Chapter 2: Literature Study
4. Deliverable Reasoning and Literature Review
The deliverable reasoning and literature review has been divided up among the four
deliverables with each one being discussed and reported on separately.
4.1. Development of Microsoft Access Database for Use by the Onsite Manager
At the present stage there is no set method for storing various pieces of data and information
that are accumulated from the operations of the plant. This poses a serious problem in that the
manager’s decision making abilities are based on a ‘gut feel’ more than on statistics. It was
decided that a database program needed to be developed as a middle management data
capturing tool.
This interface will provided the manager with the opportunity to record various key pieces of
information on a daily basis and keep records of events. The information, based on
production, sales or staff performance, can be used to monitor the plants operation. The
system will also be used to keep a running check on product stock levels and purchases which
could be useful in detecting theft or unnecessary waste of material.
Monthly reports can be generated from the program which could then be presented to the
board members. These reports give a clear insight into various aspects of the plants operation
which allows for control and understanding of the month’s performance results.
Research was conducted into various databases which could have been used for the
development of the program yet it was found that due to the specific nature, detail and type of
information which this database would be required to store and the reports which
management requires from the program, it was best to begin a database from the ground up.
Business Optimisation of the Ya Rena Precast Plant
8
Building a new database allowed for more accuracy to be placed into the essential areas of
the program allowing for less troubleshooting and error fixing due to the developer knowing
exactly how the database was created.
To aid in the development of the database reference was be made to:
- Systems Analysis & Design for the Global Enterprise 7th
Edition by Bentley and Whitten.
- The relevant work carried out in the course Information Design 320.
4.2. Production Planning
The plant produces many different products each with their own advantages and
disadvantages. Some items make a good profit yet take a long time or are difficult to produce.
Certain products i.e. curbing, are ordered in mass and there may not be enough stock on hand
to supply certain customers. Research was done into the availability and production time for
products to produce quantities on such a time scale that the available stocks should never be
depleted.
Identification of two journals which were used to aid in giving a better understanding of
which products should be produced when, were sourced. All of the journals which were
studied made reference to the fact that production scheduling and forecasting are techniques
which have not yet been fully explored or standardized for the precast industry and these
decisions are based mainly on experience and knowledge.
In conclusion to the journal “A Survey of Current Production Planning Practices in the
Precast Industry” Dawood and Neale (1990) identified that there was a need for the
development of a computerized system which could assist middle management in forecasting
and production planning.
Business Optimisation of the Ya Rena Precast Plant
9
The production planning was done by making reference to the planning algorithm constructed
and documented in Nashwan N Dawood’s journal, “Developing a Production Management
Modeling Approach for Precast Concrete Building Products” (1992).
4.3. Material Requirements Planning (MRP) & Optimisation of Production Lines
The quantities of products produced are dependant on the efficiency and productivity of the
workers. A study was done using linear programming and ARENA Simulation to depict and
provide an optimisation tool for the hollow form block production line in an effort to
streamline the production and increase profits.
Raw materials are stored in stock piles on the plant but due to there being limited available
storage space and the cost of double handling, these raw materials are only ordered once
critical levels of the materials are reached. Occasionally the raw materials are completely
depleted resulting in production ceasing. The materials requirements plan seeks to develop a
system whereby a minimal level of raw material and stock will be kept on hand yet it will
ensure that production should never stop due to a shortage of materials.
These two topics, MRP and optimisation of the production line, have been grouped together
due to the fact that they were investigated by constructing a simulation model of the plant
which was analysed to determine an optimal situation.
Research was conducted and there were a vast number of journals available on this topic. The
journals range in their complexities and depth to which they deal with the simulation yet most
of them share insight into how the development of a simulation should be done. The analysis
and evaluation of alternatives from the journal “Simulation of Large Precast Operations” by
Edmundo Babontin-Bravo (1990) was used as a guideline in the collection and processing of
data which was used in the simulation model. The main basis around which the simulation
will be focused has been drawn from the journal “Simulation Based Planning for Precast
Production with Two Critical Resources” by Tiong et al (2007). As an introduction and a
general overview of this journal the author explains and states:
Business Optimisation of the Ya Rena Precast Plant
10
“A specialized planning model based on simulation technique and genetic algorithm
(GA) is presented in this paper for precast production with two critical resources. A
novel priority rule, the critical precast component (CP) rule, is established for mold
considerations during simulation, and a bi-directional simulation is adopted to reduce
excessive overtime and precast stock. On this basis, three simulation approaches are
designed using different simulation heuristics and directions. To test the validity of
the proposed model with different approaches, a planning experiment is carried out.
By comparison, it is clear that the Simulation-GA based model using CP rule and bi-
directional simulation can generate a satisfying resource plan and production
schedule”.
The two journals were used in conjunction with Rockwell Simulation ARENA 10.0 as well
as making reference to the syllabus given in Simulation Modeling
4.4. Evaluation and Recommendations over Onsite Ergonomic Features
Due to the fact that the workers are working in extreme conditions consisting of being
exposed to the elements for long hours, working with heavy products and machinery and
being in a dangerous environment the ergonomic elements are very harsh and this often
results in minor injuries and fatigue among the workers. A study was conducted over the
possible advances that could be made in the working environment that could benefit the staff
and make the working environment easier.
Production follows a monotonous and mundane procedure and this leads to boredom amongst
the workers. Ways to correct this were looked into which should give the workers a feeling
that a good day’s work was had at the end of their shift.
The journals which were located did not deal specifically to the precast concrete industry but
gave more of a general overview to ergonomics in the production industry as well as in
dealing with boredom and monotony in production which ultimately can lead to accidents.
Business Optimisation of the Ya Rena Precast Plant
11
To combat boredom and monotony in the workplace as well as to reduce the injuries caused,
two journals were consulted.
The first journal which was consulted was by Paul Branton and is named “A Field Study of
Repetitive Manual Work in Relation to Accidents at the Work Place”. It will be noted from
this journal that repetitive work does lead to accidents which are both costly and delay
production.
The second journal, “Work satisfaction and social reward quota” by Donald F. Roy looked
into ways in which the average day of the worker could be made more rewarding was by
introducing a monetary incentive scheme based on production figures. Studies into alternative
ways of alleviating boredom were looked into and these included rotation of work and
placing more production responsibility into the job of the worker.
Due to the heavy weight of the products being produced and that these products are moved by
hand, journals have been sourced which give reference to various aids and techniques
whereby the stresses experienced can be reduced. The two journals which were consulted are
“Hand-Intensive Jobs” by Stephen Bao and “Ergonomic Aids for Industrial Workers” by
Julie Copeland. The aids which the journal by Julie Copeland has documented will serve a
great purpose for the workers yet further aids were needed to be sourced as the one’s
mentioned are not sufficient.
5. Data Collection
A system was developed to calculate theoretical values for the various products that are
produced. These values range from theoretical production cost to theoretical production times.
The main phases of each stage of production were noted and these were split up into activities
which make up each phase. A time study was done on each activity being completed at 100%
efficiency. These times were all noted and combined with hourly monetary rates for labour as
well as raw material costs giving an indication of what each products activity cost per metre

Business Optimisation of the Ya Rena Precast Plant
12
is. These activities were summed for each phase and each phase summed for each product
giving a theoretical total of what a metre/unit of each product should cost the company.
These values were used in various aspects of the deliverables which included:
- Production times in the development of the simulation model
- Various figures which were required in the planning algorithm
- Reference to the bulk weight which labourers have to handle on a daily basis.
The tables containing the time studies are located in the appendices section of this project.
The sales information depicted in the appendices was gathered from the on-hand records at
Ya Rena Civils. As can be seen the data is very limited and no real information or
conclusions can be drawn from the day to day production runs of the plant. The helps to
prove that the need for a middle management computerized data capturing system is well
founded.

Business Optimisation of the Ya Rena Precast Plant
13
Chapter 3: Design Stage
6. Main Design
6.1. Microsoft Access Database for use by the Onsite Manager
As a first step in developing the system an informal interview was held with the management
of Ya Rena. The aim of this interview was to discover what functions the managers would
like the Access Database to perform. All of the requirements were summarized and
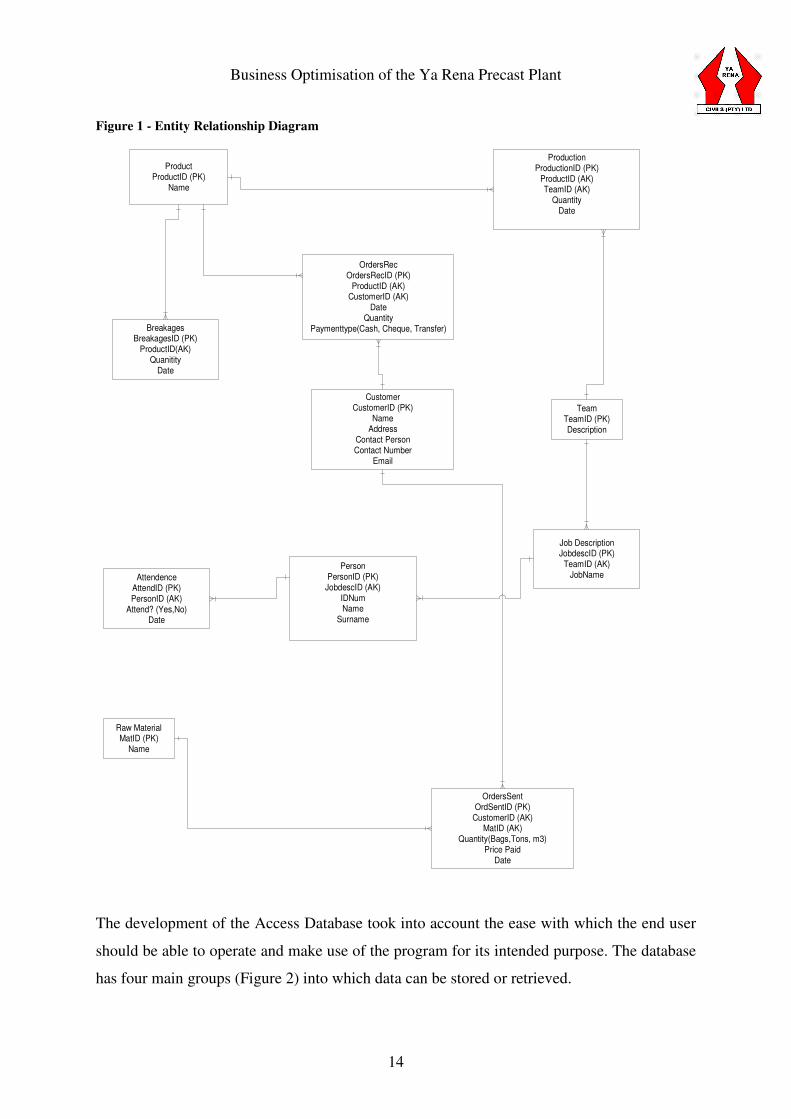
documented. An Entity Relationship Diagram (ERD) (Figure 1) was drawn up which would
aided in the development of the program.
Business Optimisation of the Ya Rena Precast Plant
14
Figure 1 - Entity Relationship Diagram
Product
ProductID (PK)
Name
Production
ProductionID (PK)
ProductID (AK)TeamID (AK)
Quantity
Date
BreakagesBreakagesID (PK)
ProductID(AK)
Quanitity
Date
OrdersRec
OrdersRecID (PK)
ProductID (AK)CustomerID (AK)
Date
Quantity
Paymenttype(Cash, Cheque, Transfer)
Customer
CustomerID (PK)
NameAddress
Contact Person
Contact Number
Job DescriptionJobdescID (PK)
TeamID (AK)
JobNamePerson
PersonID (PK)
JobdescID (AK)
IDNumName
Surname
Attendence
AttendID (PK)
PersonID (AK)
Attend? (Yes,No)Date
Raw MaterialMatID (PK)
Name
OrdersSent
OrdSentID (PK)
CustomerID (AK)MatID (AK)
Quantity(Bags,Tons, m3)
Price Paid
Date
Team
TeamID (PK)
Description
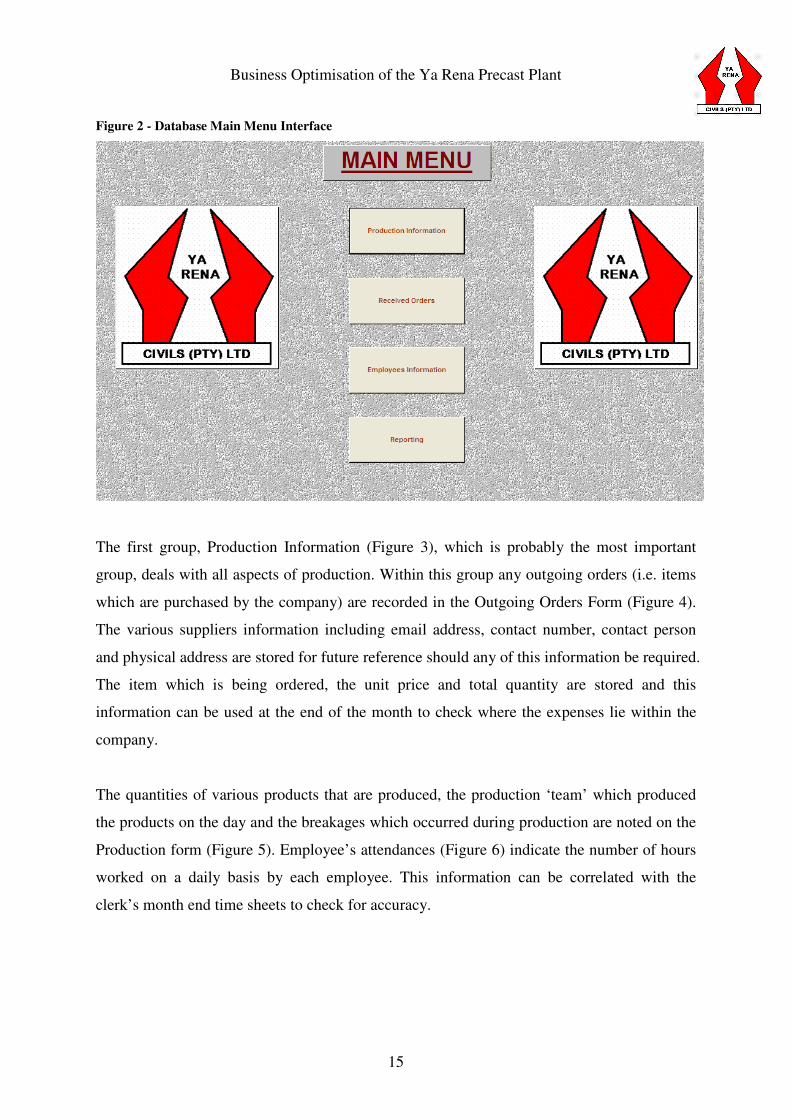
The development of the Access Database took into account the ease with which the end user
should be able to operate and make use of the program for its intended purpose. The database
has four main groups (Figure 2) into which data can be stored or retrieved.
Business Optimisation of the Ya Rena Precast Plant
15
Figure 2 - Database Main Menu Interface
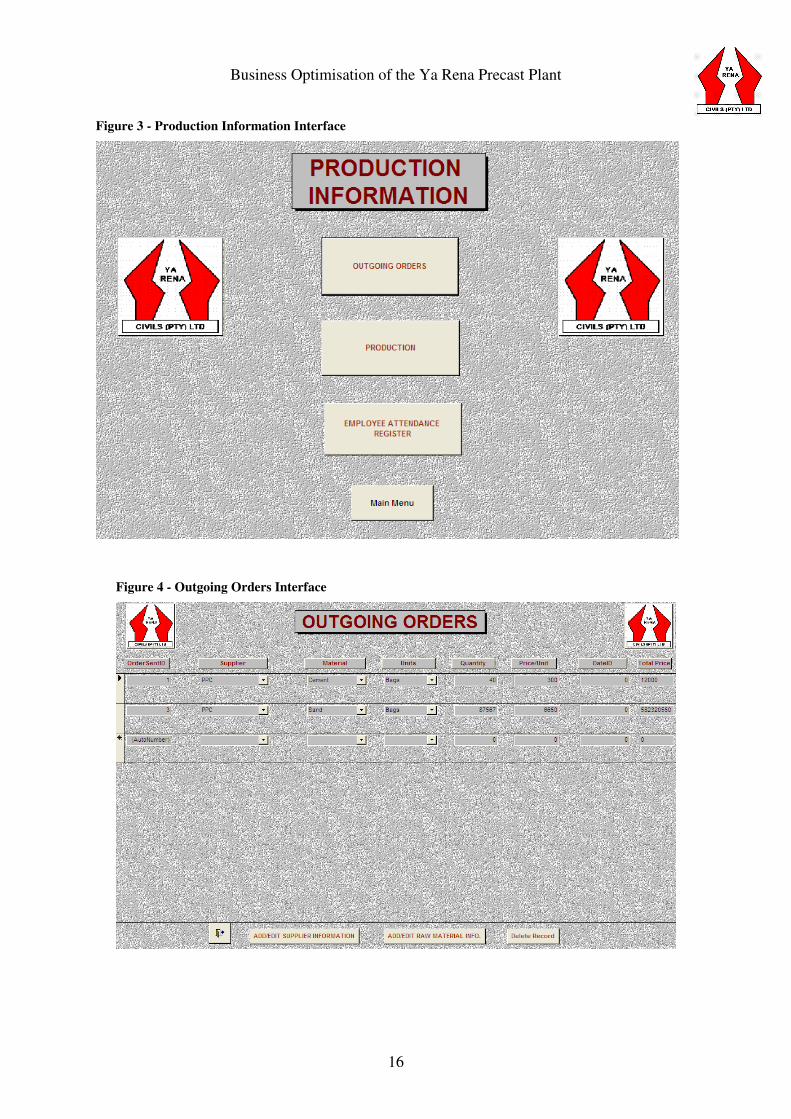
The first group, Production Information (Figure 3), which is probably the most important
group, deals with all aspects of production. Within this group any outgoing orders (i.e. items
which are purchased by the company) are recorded in the Outgoing Orders Form (Figure 4).
The various suppliers information including email address, contact number, contact person
and physical address are stored for future reference should any of this information be required.
The item which is being ordered, the unit price and total quantity are stored and this
information can be used at the end of the month to check where the expenses lie within the
company.
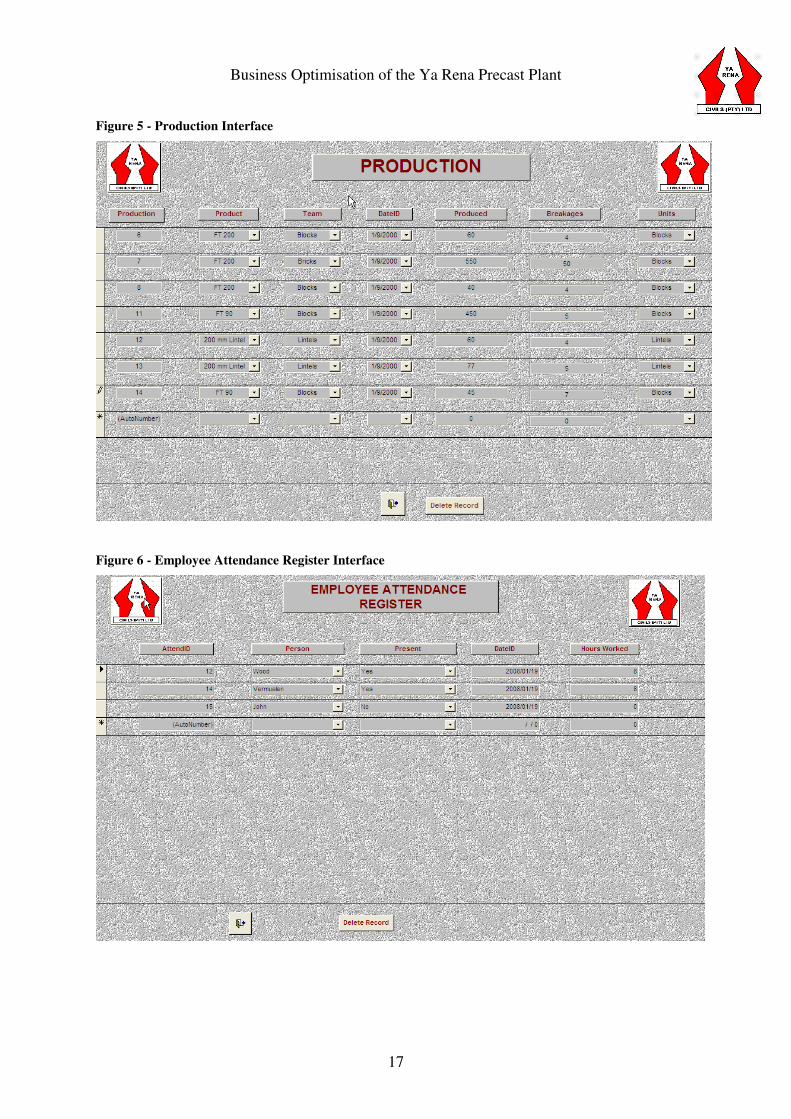
The quantities of various products that are produced, the production ‘team’ which produced
the products on the day and the breakages which occurred during production are noted on the
Production form (Figure 5). Employee’s attendances (Figure 6) indicate the number of hours
worked on a daily basis by each employee. This information can be correlated with the
clerk’s month end time sheets to check for accuracy.
Business Optimisation of the Ya Rena Precast Plant
16
Figure 3 - Production Information Interface
Figure 4 - Outgoing Orders Interface
Business Optimisation of the Ya Rena Precast Plant
17
Figure 5 - Production Interface
Figure 6 - Employee Attendance Register Interface
Business Optimisation of the Ya Rena Precast Plant
18
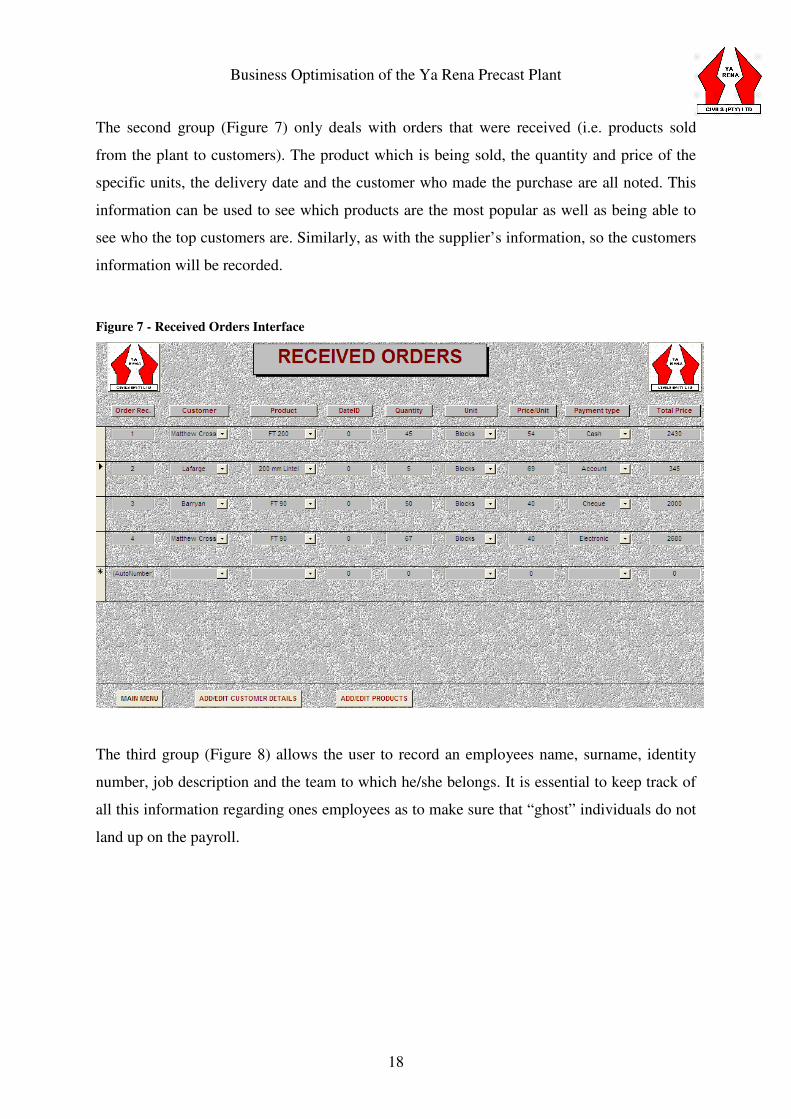
The second group (Figure 7) only deals with orders that were received (i.e. products sold
from the plant to customers). The product which is being sold, the quantity and price of the
specific units, the delivery date and the customer who made the purchase are all noted. This
information can be used to see which products are the most popular as well as being able to
see who the top customers are. Similarly, as with the supplier’s information, so the customers
information will be recorded.
Figure 7 - Received Orders Interface
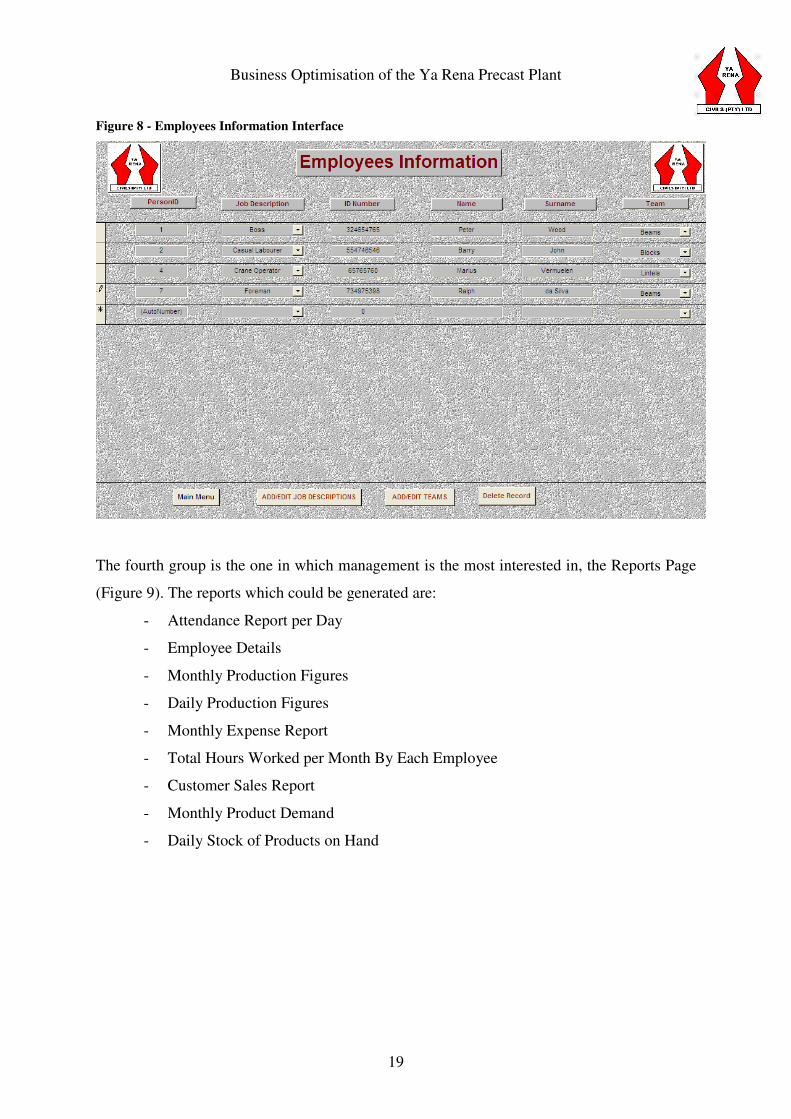
The third group (Figure 8) allows the user to record an employees name, surname, identity
number, job description and the team to which he/she belongs. It is essential to keep track of
all this information regarding ones employees as to make sure that “ghost” individuals do not
land up on the payroll.
Business Optimisation of the Ya Rena Precast Plant
19
Figure 8 - Employees Information Interface
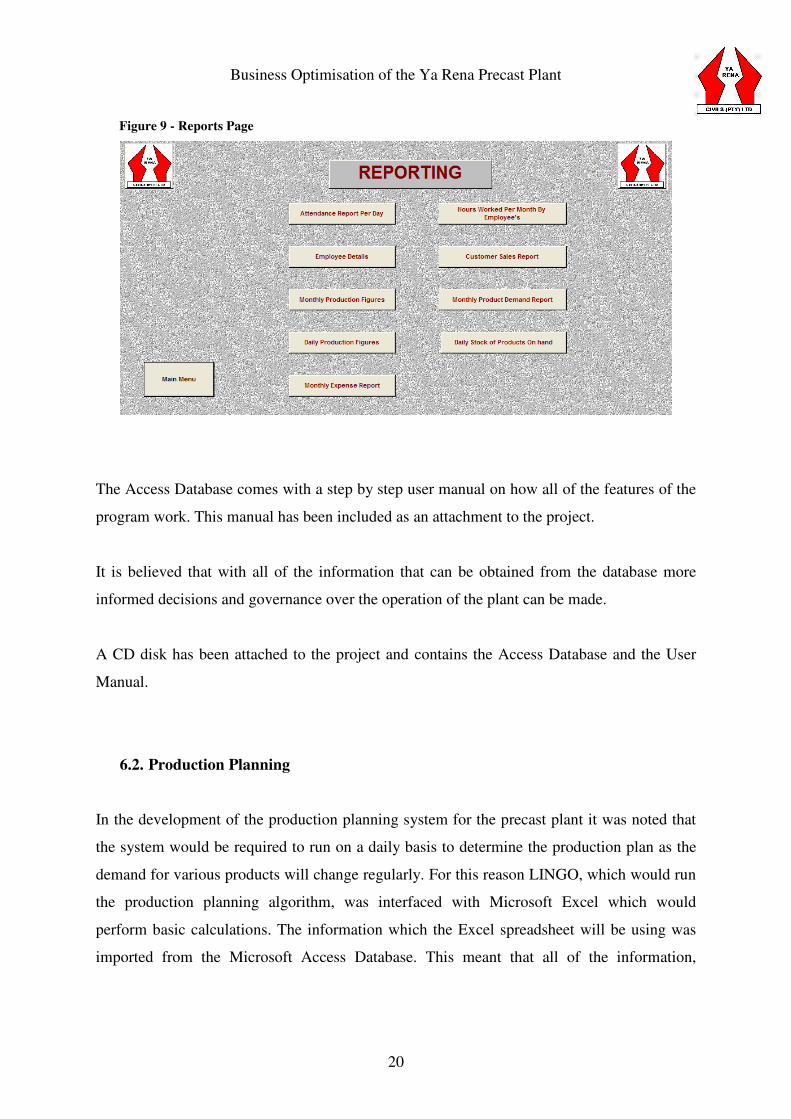
The fourth group is the one in which management is the most interested in, the Reports Page
(Figure 9). The reports which could be generated are:
- Attendance Report per Day
- Employee Details
- Monthly Production Figures
- Daily Production Figures
- Monthly Expense Report
- Total Hours Worked per Month By Each Employee
- Customer Sales Report
- Monthly Product Demand
- Daily Stock of Products on Hand
Business Optimisation of the Ya Rena Precast Plant
20
Figure 9 - Reports Page
The Access Database comes with a step by step user manual on how all of the features of the
program work. This manual has been included as an attachment to the project.
It is believed that with all of the information that can be obtained from the database more
informed decisions and governance over the operation of the plant can be made.
A CD disk has been attached to the project and contains the Access Database and the User
Manual.
6.2. Production Planning
In the development of the production planning system for the precast plant it was noted that
the system would be required to run on a daily basis to determine the production plan as the
demand for various products will change regularly. For this reason LINGO, which would run
the production planning algorithm, was interfaced with Microsoft Excel which would
perform basic calculations. The information which the Excel spreadsheet will be using was
imported from the Microsoft Access Database. This meant that all of the information,
Business Optimisation of the Ya Rena Precast Plant
21
including the current product stock levels and the future demand for products would be based
on true and current information.
The basis of the algorithm theory is to lower stock levels as far as possible yet insure that
there will never be a shortage of the various products. There are a large variety of products
that can be produced on limited pieces of machinery and moulds by a limited number of
teams of workers.
The production planning model will be able to indicate which resources should be used on
which day to produce a certain product. This should aid the production manager in his
decision as to what his production plan should look like. It is not to say that the plan
generated from the algorithm should be followed directly but it would give the production
manager deeper insight into what steps he should follow.
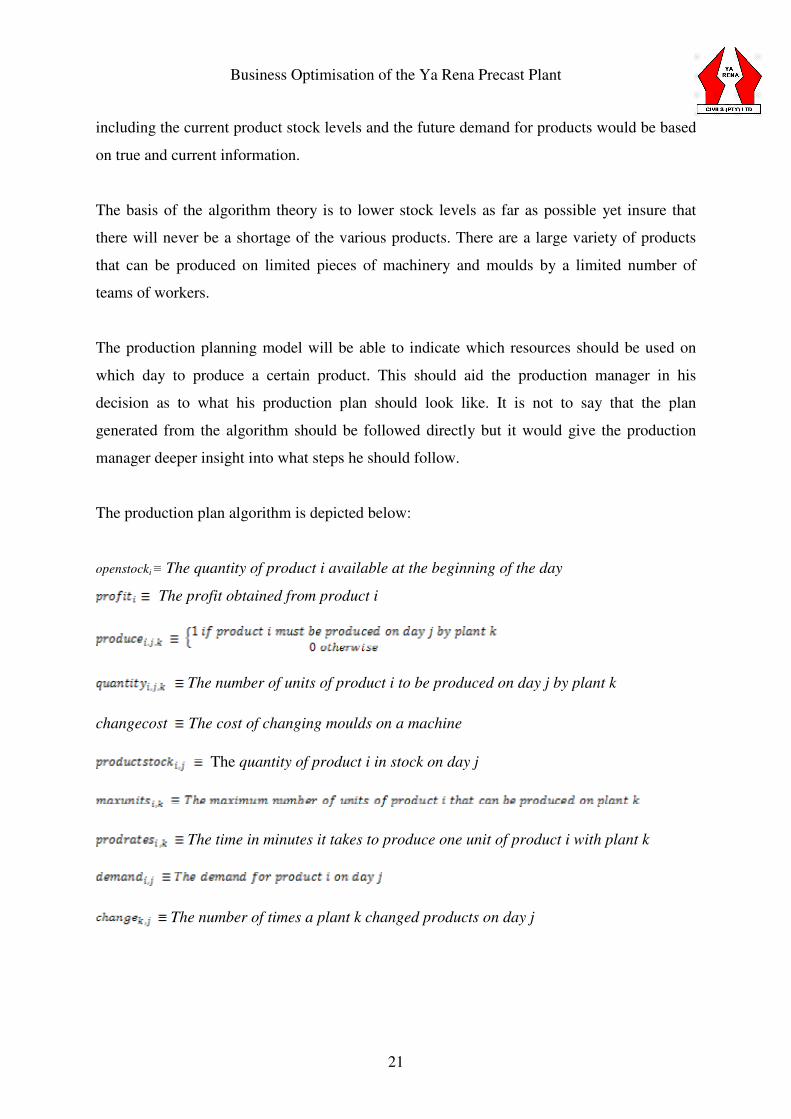
The production plan algorithm is depicted below:
openstocki ≡ The quantity of product i available at the beginning of the day
The profit obtained from product i
The number of units of product i to be produced on day j by plant k
changecost The cost of changing moulds on a machine
The quantity of product i in stock on day j
The time in minutes it takes to produce one unit of product i with plant k
The number of times a plant k changed products on day j
Business Optimisation of the Ya Rena Precast Plant
22
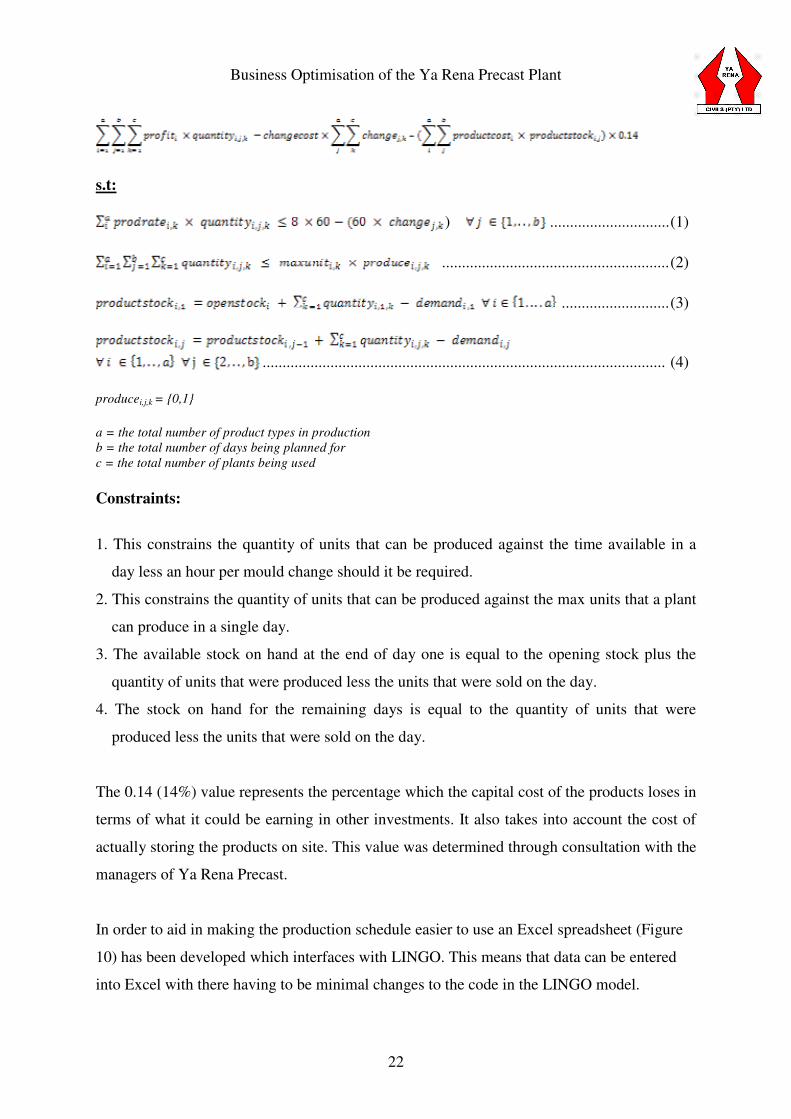
s.t:
) .............................. (1)
......................................................... (2)
........................... (3)
..................................................................................................... (4)
producei,j,k = {0,1}
a = the total number of product types in production
b = the total number of days being planned for
c = the total number of plants being used
Constraints:
1. This constrains the quantity of units that can be produced against the time available in a
day less an hour per mould change should it be required.
2. This constrains the quantity of units that can be produced against the max units that a plant
can produce in a single day.
3. The available stock on hand at the end of day one is equal to the opening stock plus the
quantity of units that were produced less the units that were sold on the day.
4. The stock on hand for the remaining days is equal to the quantity of units that were
produced less the units that were sold on the day.
The 0.14 (14%) value represents the percentage which the capital cost of the products loses in
terms of what it could be earning in other investments. It also takes into account the cost of
actually storing the products on site. This value was determined through consultation with the
managers of Ya Rena Precast.
In order to aid in making the production schedule easier to use an Excel spreadsheet (Figure
10) has been developed which interfaces with LINGO. This means that data can be entered
into Excel with there having to be minimal changes to the code in the LINGO model.
Business Optimisation of the Ya Rena Precast Plant
23
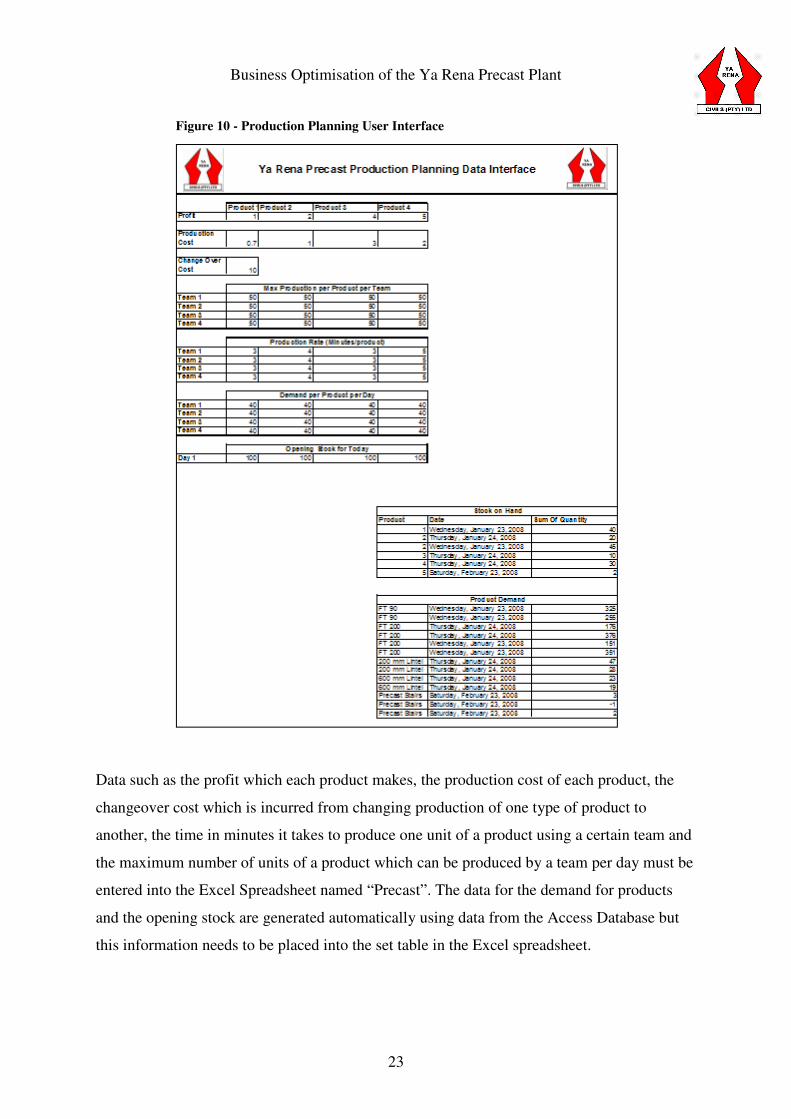
Figure 10 - Production Planning User Interface
Data such as the profit which each product makes, the production cost of each product, the
changeover cost which is incurred from changing production of one type of product to
another, the time in minutes it takes to produce one unit of a product using a certain team and
the maximum number of units of a product which can be produced by a team per day must be
entered into the Excel Spreadsheet named “Precast”. The data for the demand for products
and the opening stock are generated automatically using data from the Access Database but
this information needs to be placed into the set table in the Excel spreadsheet.
Business Optimisation of the Ya Rena Precast Plant
24
The only changes in the LINGO code which would need to be made occur if new products or
plants are added/deleted from the system. Should this be the case then the first two lines of
the code would need to have the value at the end changed to the total number of products or
plants which are to be run by the system. This needs to correlate with the products and teams
in the Excel Spreadsheet.
Once all of the information has been correctly entered into the system the LINGO file can be
opened and run. The output which will be received will indicate what quantity of products
should be produced over the next four days.
A Compact Disk had been included with this project and this contains the LINGO model and
Excel Spreadsheet. An illustrative example has been set up but it should be noted that the
values contained in the Excel Spreadsheet are random values and do not depict actual data
which would be required to be entered by the user. In order to run the model copy the Excel
spreadsheet labeled “Precast” to the ‘C’ drive of a computer and run the Lingo model.
6.3. Material Requirements Planning (MRP) & Optimisation of Production Lines
6.3.1 Model Overview
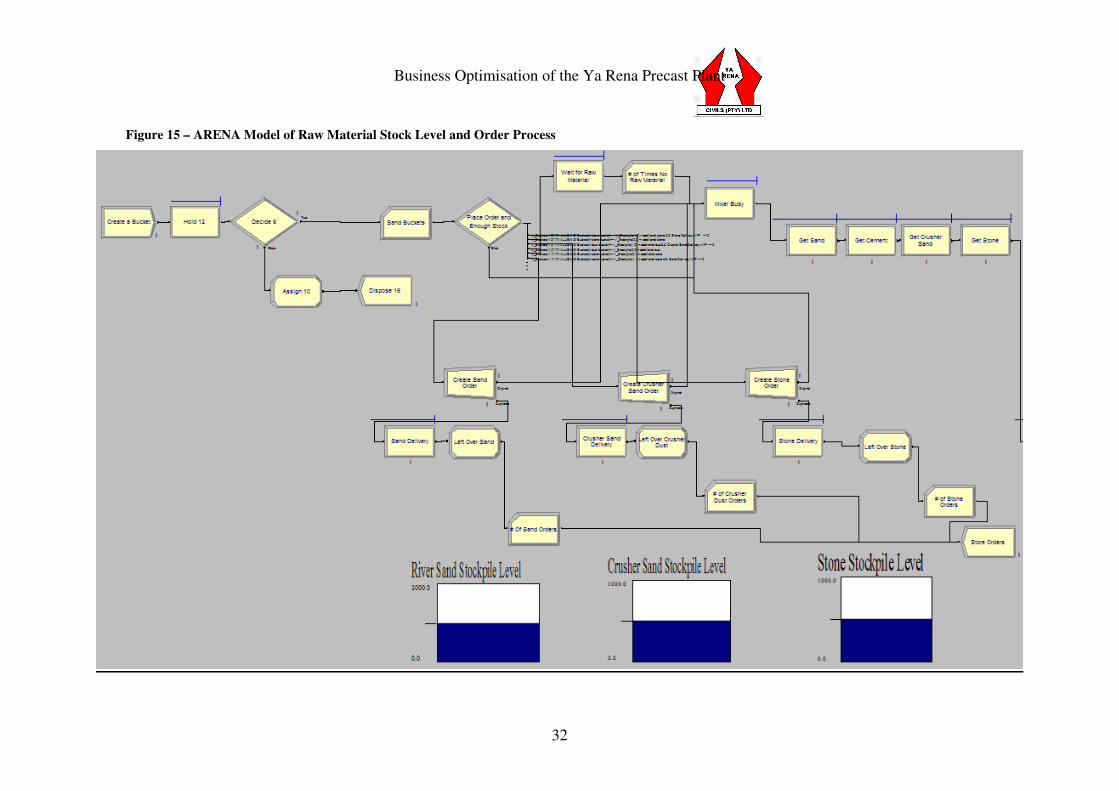
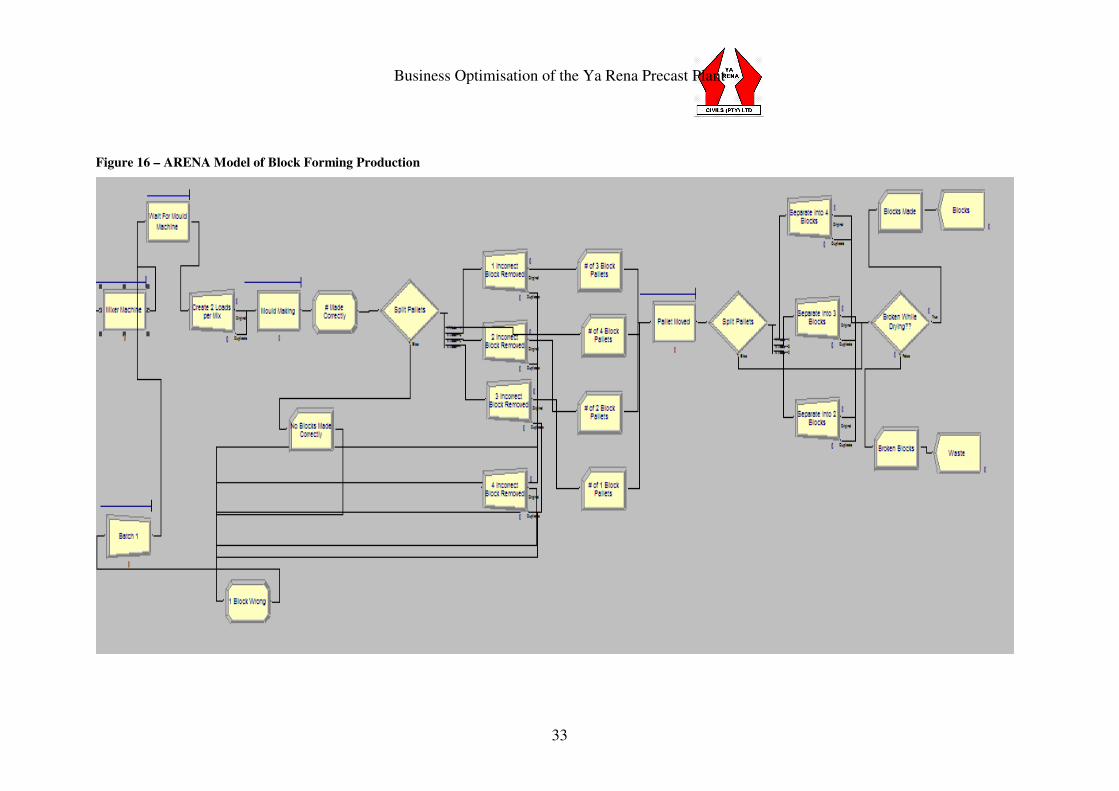
An ARENA simulation of the block forming production has been developed. The model has
been split into two halves. The first section (Figure 9) represents the stockpile of the raw
materials with order processing and delivery of materials included. The second section
(Figure 10) represents the actual production of the blocks.
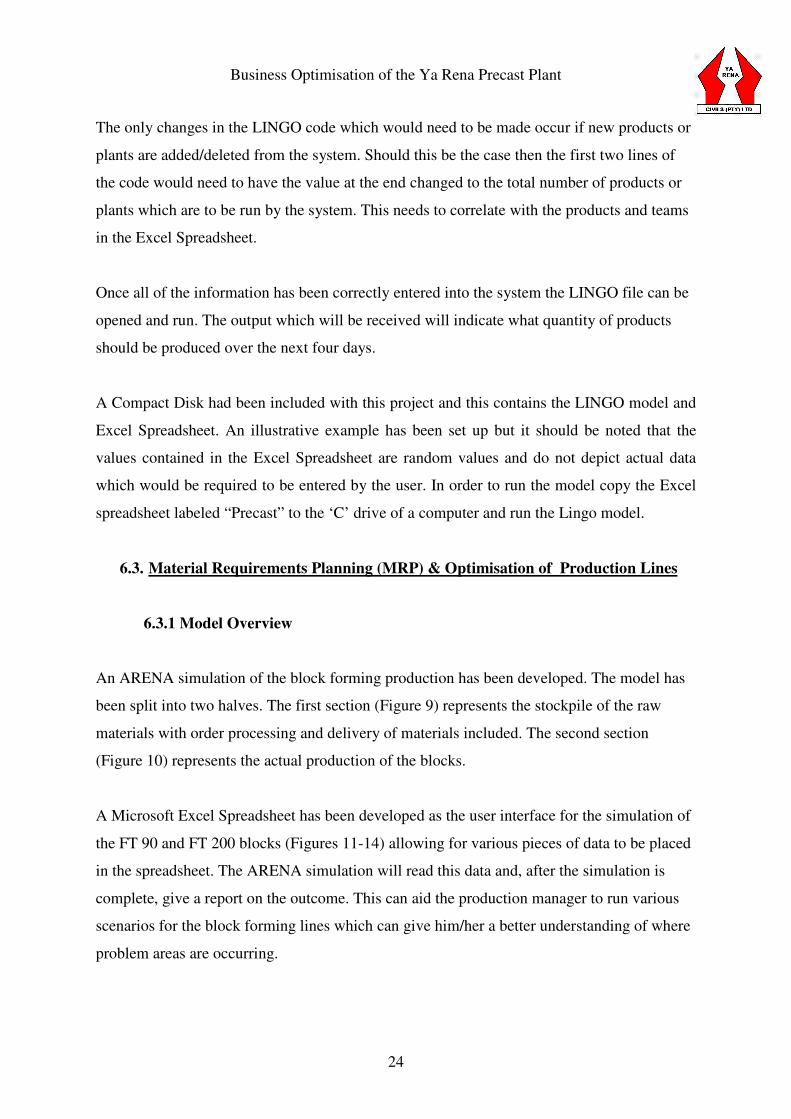
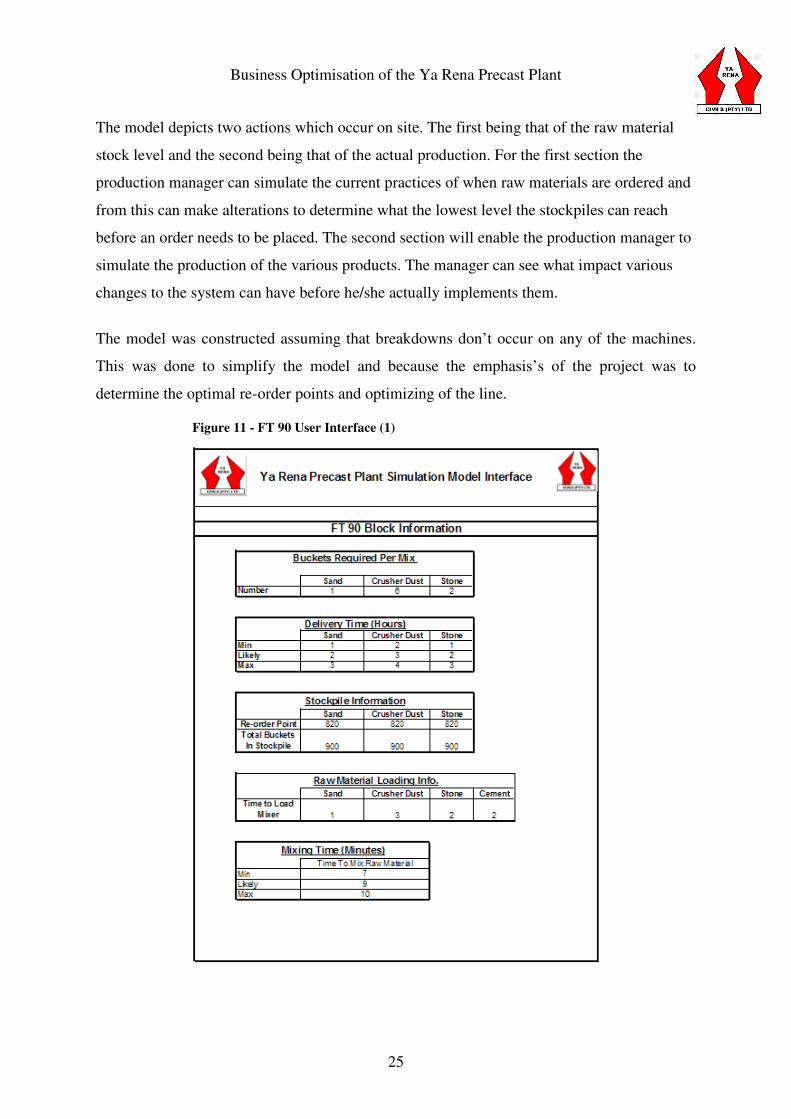
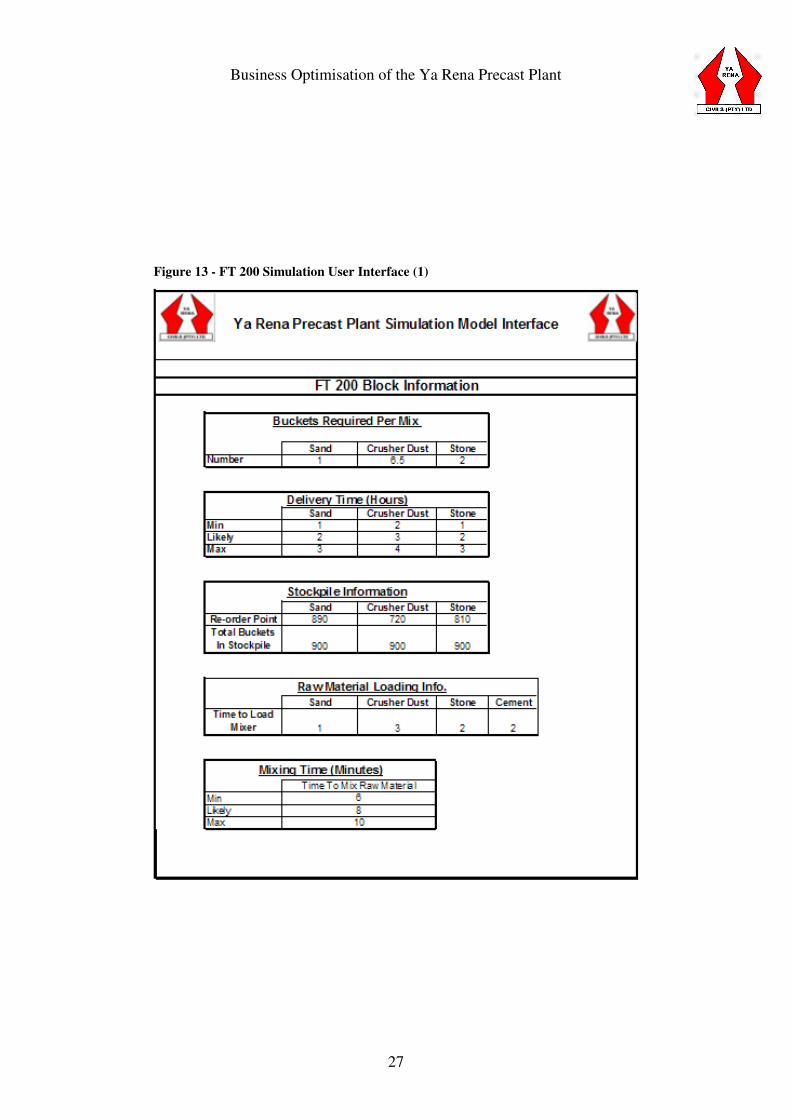
A Microsoft Excel Spreadsheet has been developed as the user interface for the simulation of
the FT 90 and FT 200 blocks (Figures 11-14) allowing for various pieces of data to be placed
in the spreadsheet. The ARENA simulation will read this data and, after the simulation is
complete, give a report on the outcome. This can aid the production manager to run various
scenarios for the block forming lines which can give him/her a better understanding of where
problem areas are occurring.
Business Optimisation of the Ya Rena Precast Plant
25
The model depicts two actions which occur on site. The first being that of the raw material
stock level and the second being that of the actual production. For the first section the
production manager can simulate the current practices of when raw materials are ordered and
from this can make alterations to determine what the lowest level the stockpiles can reach
before an order needs to be placed. The second section will enable the production manager to
simulate the production of the various products. The manager can see what impact various
changes to the system can have before he/she actually implements them.
The model was constructed assuming that breakdowns don’t occur on any of the machines.
This was done to simplify the model and because the emphasis’s of the project was to
determine the optimal re-order points and optimizing of the line.
Figure 11 - FT 90 User Interface (1)
Business Optimisation of the Ya Rena Precast Plant
26
Figure 12 - FT 90 Simulation User Interface (2)
Business Optimisation of the Ya Rena Precast Plant
27
Figure 13 - FT 200 Simulation User Interface (1)
Business Optimisation of the Ya Rena Precast Plant
28
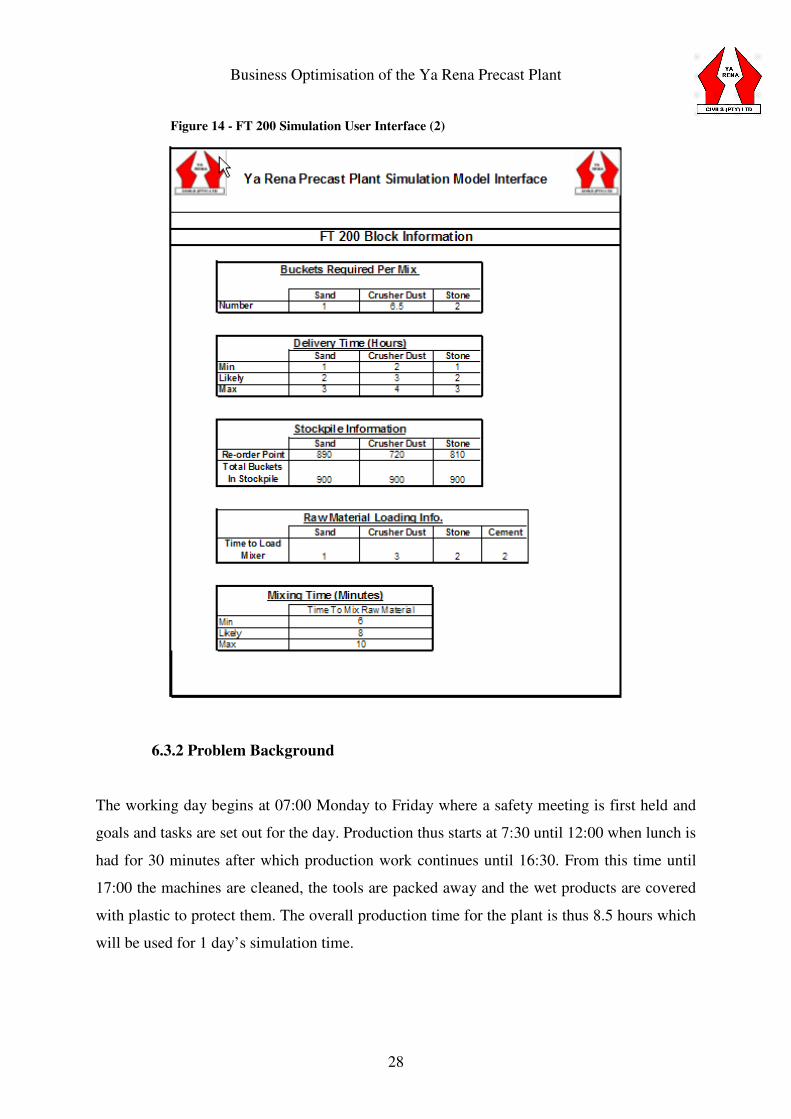
Figure 14 - FT 200 Simulation User Interface (2)
6.3.2 Problem Background
The working day begins at 07:00 Monday to Friday where a safety meeting is first held and
goals and tasks are set out for the day. Production thus starts at 7:30 until 12:00 when lunch is
had for 30 minutes after which production work continues until 16:30. From this time until
17:00 the machines are cleaned, the tools are packed away and the wet products are covered
with plastic to protect them. The overall production time for the plant is thus 8.5 hours which
will be used for 1 day’s simulation time.
Business Optimisation of the Ya Rena Precast Plant
29
The process for the production of the blocks runs as follows:
Whilst the conveyor is being loaded the mixer mixes the previous load. The time for the
mixing varies due the operator having to add water and test the aggregate to achieve the
required consistency.
While the mixer is mixing, the aggregate is placed into the moulds of the uni-stacker and
compacted to produce the blocks of which there are 2 pallets produced per load from the
mixer. Once the mixer is available for use the conveyor belt places all the raw materials into
the mixer. The time for this process to occur is constant.
During the forming of the blocks in the moulds errors can occur i.e. breaks, cracks etc. An
inspection of the blocks is performed and if a fault is detected the broken block is removed
from the pallet and the aggregate is recycled and placed back into the mould machine.
The pallets containing the products which have been correctly made are laid out to dry. The
process of moving the pallets varies in time as the distance which the pallets are carried
changes. During the drying process some of the blocks crack, break or are damaged. These
blocks are scraped and cannot be sold.
6.3.3 Development of Model
The production of the module is set to run for 8.5 hours a day for 30 days (255 hours). This
time is the average time per day for which the plant is producing blocks.
The model firstly creates an entity which represents the loading of the conveyor belt with the
various raw materials which results in the conveyor being loaded with 1 mixing unit. If a
stockpile has reached its safety level an order is created and if a stockpile has run out the
production stops until the material has been replenished.
The mixing unit is then fed from the conveyor to the mixer which then produces enough
aggregate for 2 production runs of the product forming machine. Once the pallet has been
Business Optimisation of the Ya Rena Precast Plant
30
emitted from the machine the numbers of incorrect blocks are removed from the pallet and
the aggregate is fed back into the machine. The pallet containing the correct blocks is moved
to a drying area. The model then duplicates the entities according to how many blocks are on
the pallet and then separates the blocks which are damaged or broken during the curing
process to a waste bin and the quantity of correct blocks made are recorded.
Once all the production information had been entered correctly into the model the current
situation of the re-order point was simulated and the results were recorded. Due to the fact
that the current situations re-order point was not optimal experimentation with the re-order
points was done. Currently the size of the stockpiles for the crusher dust, sand and stone are
as big as a 1 standard delivery truckload or 9 tons. Once the level of a stockpile reaches
around 20% an order is placed for a delivery of that material. The delivery time of the
materials vary due to availability of the material, delivery trucks and the distance which the
supplier is located from the plant.
It is believed that with this model greater insight can be given into the quantity of raw
materials which needs to be kept on hand, the re-order points, the safety limits, the rate at
which the materials will be used and the production times which can be achieved.
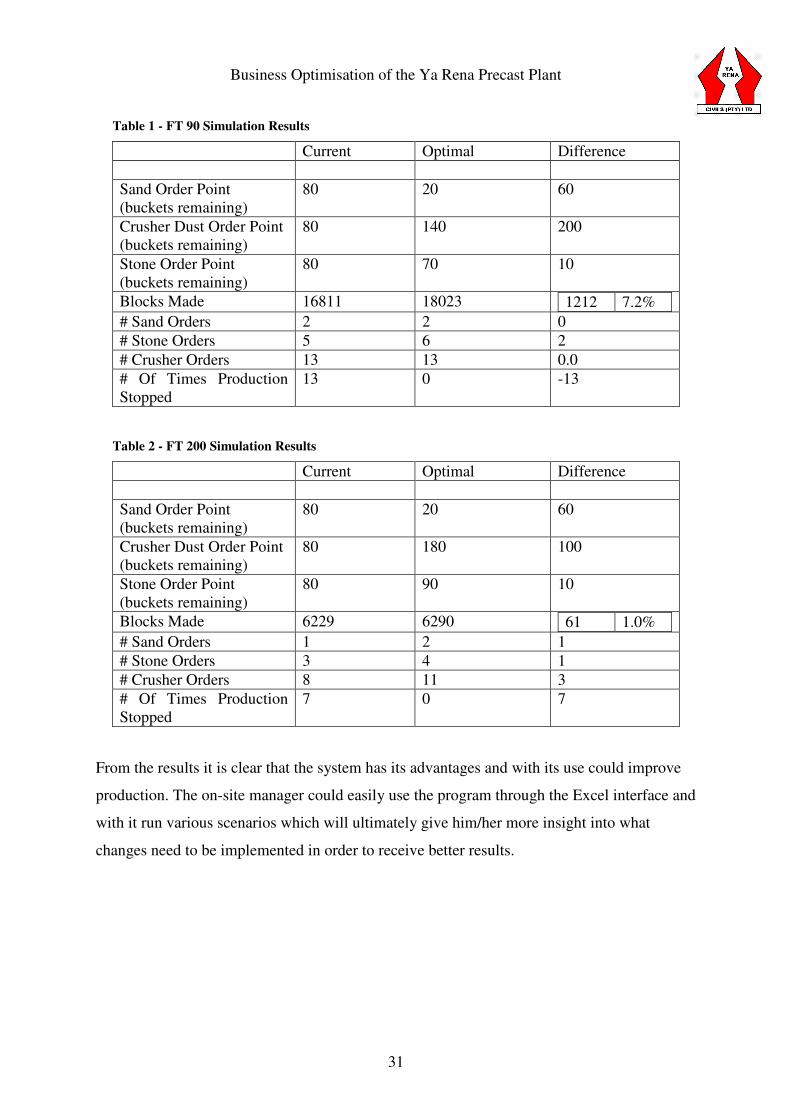
6.3.4 Results
The model was run to simulate the current situation on-site for both the FT 90 block and the
FT 200 block. The results that were obtained were not optimal which lead to further
investigation into new re-order points were investigated. The tables depicted below show the
correlation between the current situation and an optimal situation.
Business Optimisation of the Ya Rena Precast Plant
31
Table 1 - FT 90 Simulation Results
Current Optimal Difference
Sand Order Point
(buckets remaining)
80 20 60
Crusher Dust Order Point
(buckets remaining)
80 140 200
Stone Order Point
(buckets remaining)
80 70 10
Blocks Made 16811 18023 1212 7.2% # Sand Orders 2 2 0
# Stone Orders 5 6 2
# Crusher Orders 13 13 0.0
# Of Times Production
Stopped
13 0 -13
Table 2 - FT 200 Simulation Results
Current Optimal Difference
Sand Order Point
(buckets remaining)
80 20 60
Crusher Dust Order Point
(buckets remaining)
80 180 100
Stone Order Point
(buckets remaining)
80 90 10
Blocks Made 6229 6290 61 1.0% # Sand Orders 1 2 1
# Stone Orders 3 4 1
# Crusher Orders 8 11 3
# Of Times Production
Stopped
7 0 7
From the results it is clear that the system has its advantages and with its use could improve
production. The on-site manager could easily use the program through the Excel interface and
with it run various scenarios which will ultimately give him/her more insight into what
changes need to be implemented in order to receive better results.
Business Optimisation of the Ya Rena Precast Plant
32
Figure 15 – ARENA Model of Raw Material Stock Level and Order Process
Business Optimisation of the Ya Rena Precast Plant
33
Figure 16 – ARENA Model of Block Forming Production

6.4 Onsite Ergonomics
6.4.1 Ergonomic Aid
After a site visit to the Ya Rena Precast facility it was clear that there were strict rules and
regulations regarding the personal protective equipment (PPE) that was to be worn by all
individuals entering the production area of the plant. The compulsory PPE which has to be
worn includes hardhats, ear plugs, safety glasses, dust masks, gloves and safety boots.
Overalls are provided to the labourers but are only compulsory to the labourers. It can be seen
that the PPE which is issued to the labourers is fairly adequate and in most instances will
provide sufficient safety.
As has been discussed earlier the majority of the workers handle raw materials and precast
products by hand. The products are extremely heavy due to them being made from concrete
which is a very heavy and an abrasive product. Through research based on sourced articles
there are a few aids which could help certain labourers.
A study was conducted into the various types of jobs where labourers would be required to
wear one of or a combination of back support (Figure 8), wrist support (Figure 9), elbow
support (Figure 10), knee support or pads (Figure 11).
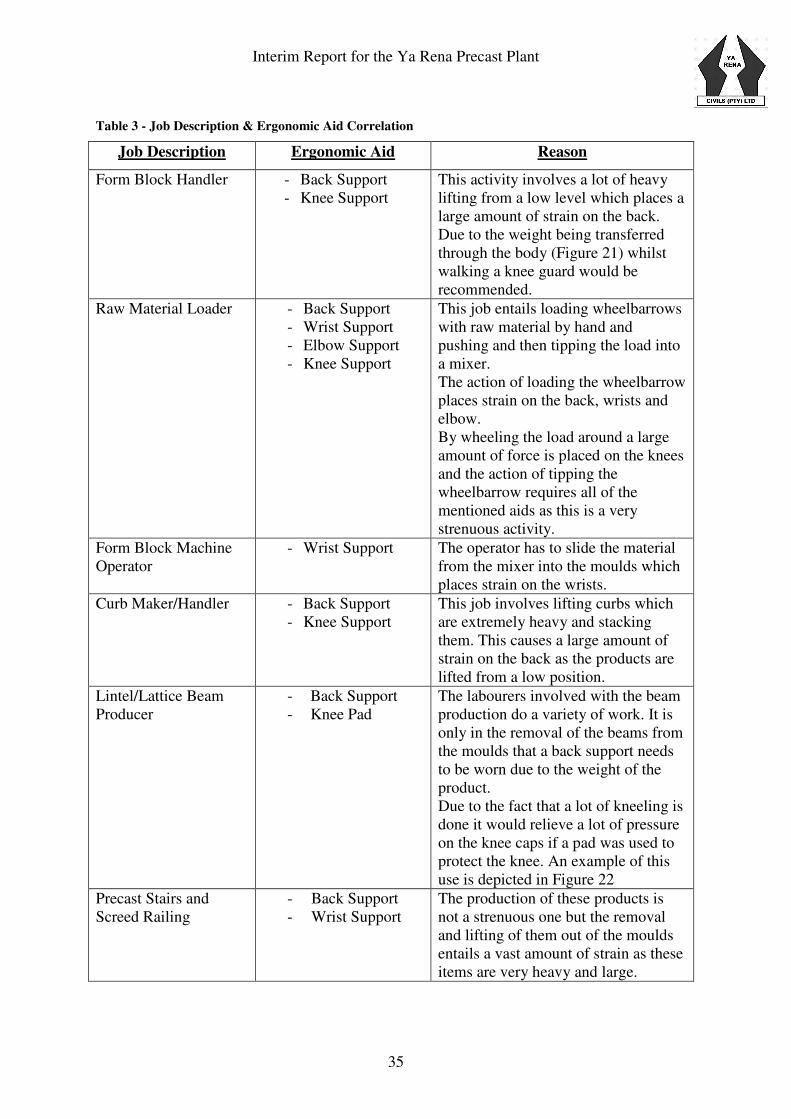
The table below depicts the various job types which are currently being used on the plant.
These job types have been matched to the different aids which could be used as well as a
reason for why the aids may be required.
Interim Report for the Ya Rena Precast Plant
35
Table 3 - Job Description & Ergonomic Aid Correlation
Job Description Ergonomic Aid Reason
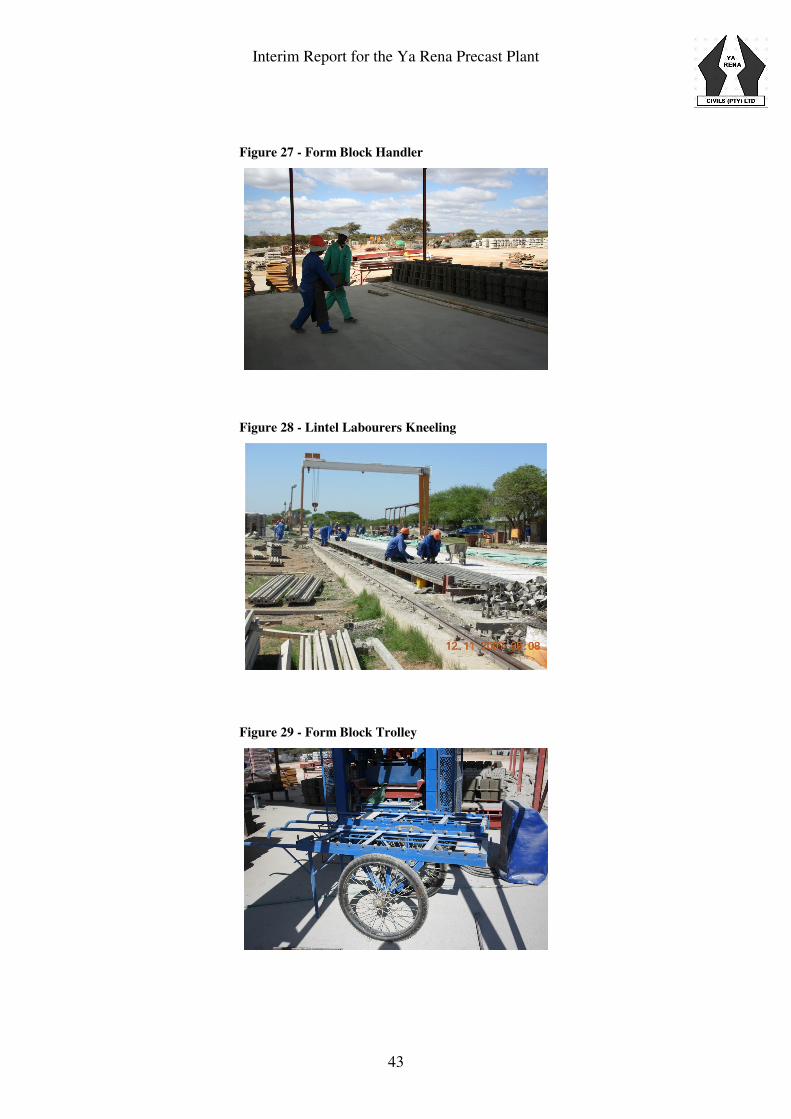
Form Block Handler - Back Support
- Knee Support
This activity involves a lot of heavy
lifting from a low level which places a
large amount of strain on the back.
Due to the weight being transferred
through the body (Figure 21) whilst
walking a knee guard would be
recommended.
Raw Material Loader - Back Support
- Wrist Support
- Elbow Support
- Knee Support
This job entails loading wheelbarrows
with raw material by hand and
pushing and then tipping the load into
a mixer.
The action of loading the wheelbarrow
places strain on the back, wrists and
elbow.
By wheeling the load around a large
amount of force is placed on the knees
and the action of tipping the
wheelbarrow requires all of the
mentioned aids as this is a very
strenuous activity.
Form Block Machine
Operator
- Wrist Support The operator has to slide the material
from the mixer into the moulds which
places strain on the wrists.
Curb Maker/Handler - Back Support
- Knee Support
This job involves lifting curbs which
are extremely heavy and stacking
them. This causes a large amount of
strain on the back as the products are
lifted from a low position.
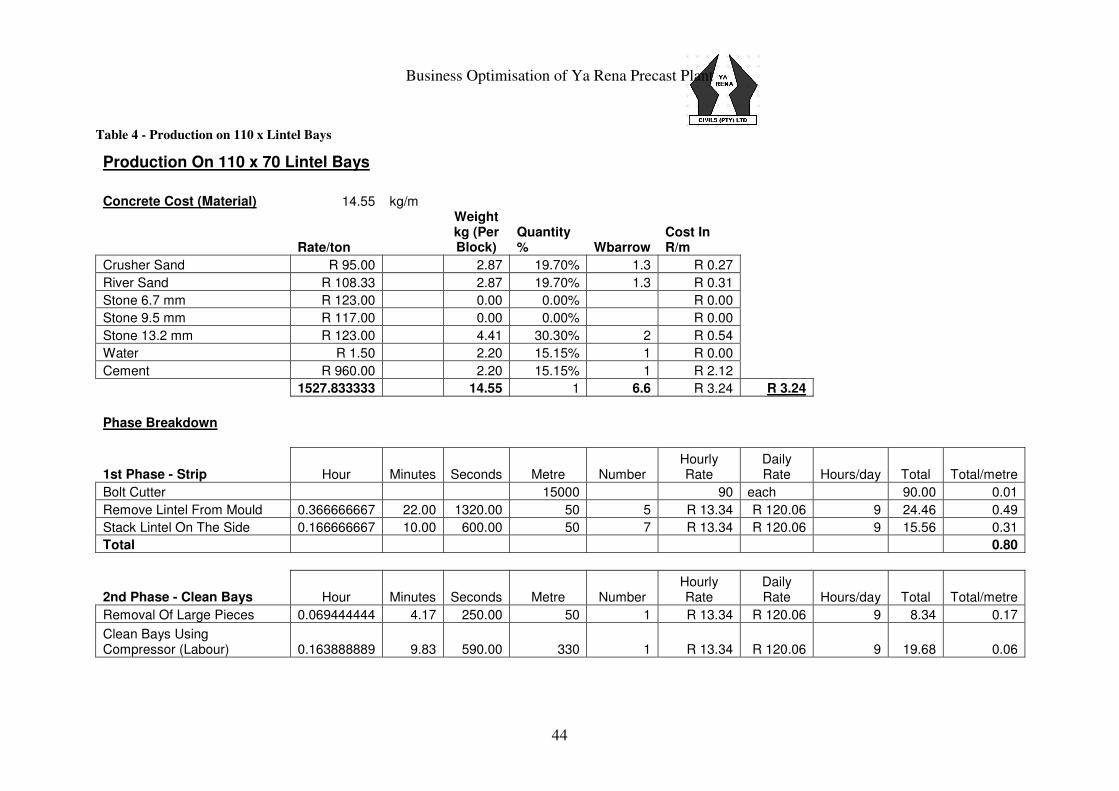
Lintel/Lattice Beam
Producer
- Back Support
- Knee Pad
The labourers involved with the beam
production do a variety of work. It is
only in the removal of the beams from
the moulds that a back support needs
to be worn due to the weight of the
product.
Due to the fact that a lot of kneeling is
done it would relieve a lot of pressure
on the knee caps if a pad was used to
protect the knee. An example of this
use is depicted in Figure 22
Precast Stairs and
Screed Railing
- Back Support
- Wrist Support
The production of these products is
not a strenuous one but the removal
and lifting of them out of the moulds
entails a vast amount of strain as these
items are very heavy and large.
Interim Report for the Ya Rena Precast Plant
36
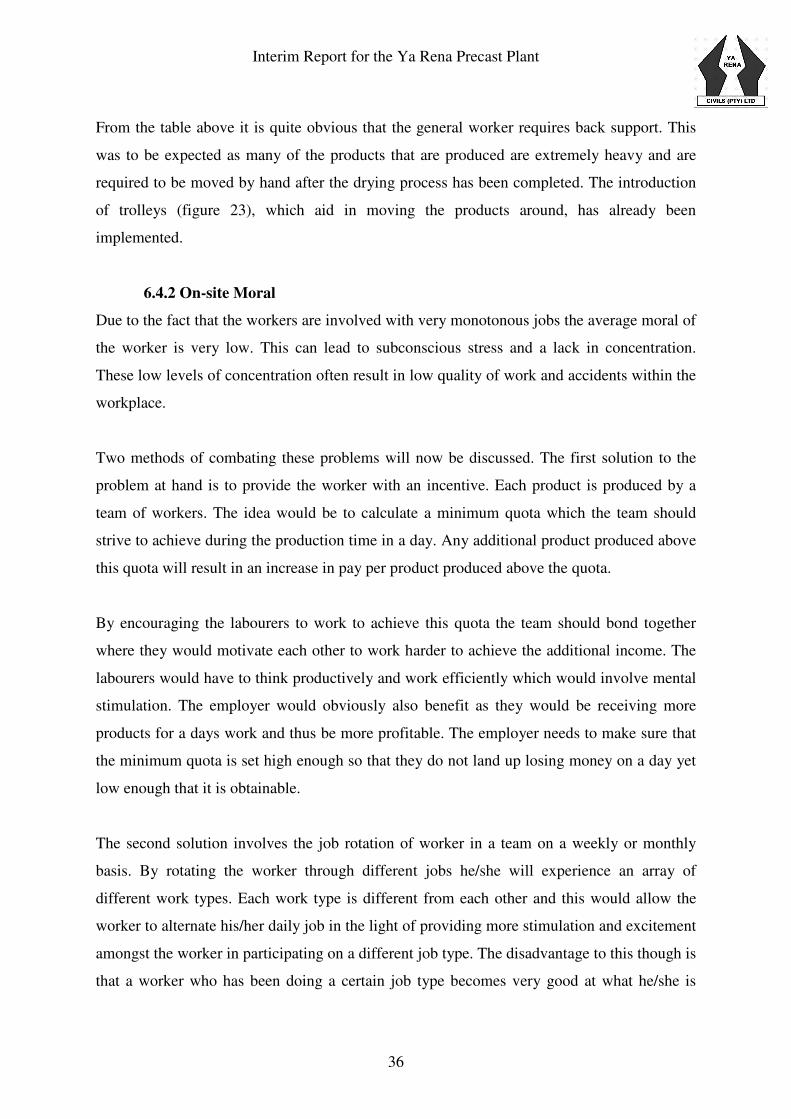
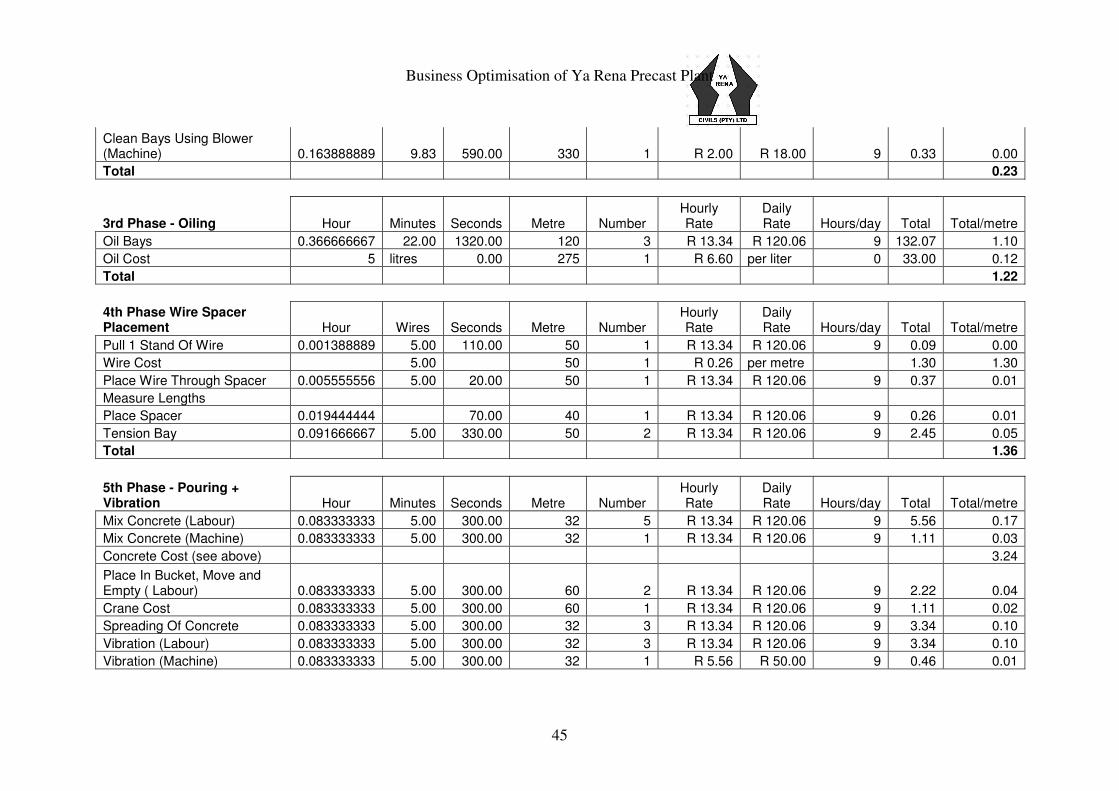
From the table above it is quite obvious that the general worker requires back support. This
was to be expected as many of the products that are produced are extremely heavy and are
required to be moved by hand after the drying process has been completed. The introduction
of trolleys (figure 23), which aid in moving the products around, has already been
implemented.
6.4.2 On-site Moral
Due to the fact that the workers are involved with very monotonous jobs the average moral of
the worker is very low. This can lead to subconscious stress and a lack in concentration.
These low levels of concentration often result in low quality of work and accidents within the
workplace.
Two methods of combating these problems will now be discussed. The first solution to the
problem at hand is to provide the worker with an incentive. Each product is produced by a
team of workers. The idea would be to calculate a minimum quota which the team should
strive to achieve during the production time in a day. Any additional product produced above
this quota will result in an increase in pay per product produced above the quota.
By encouraging the labourers to work to achieve this quota the team should bond together
where they would motivate each other to work harder to achieve the additional income. The
labourers would have to think productively and work efficiently which would involve mental
stimulation. The employer would obviously also benefit as they would be receiving more
products for a days work and thus be more profitable. The employer needs to make sure that
the minimum quota is set high enough so that they do not land up losing money on a day yet
low enough that it is obtainable.
The second solution involves the job rotation of worker in a team on a weekly or monthly
basis. By rotating the worker through different jobs he/she will experience an array of
different work types. Each work type is different from each other and this would allow the
worker to alternate his/her daily job in the light of providing more stimulation and excitement
amongst the worker in participating on a different job type. The disadvantage to this though is
that a worker who has been doing a certain job type becomes very good at what he/she is

Interim Report for the Ya Rena Precast Plant
37
doing and by continuously rotating the workers the learning curve that each labourer would
have to go through could mean that the overall production levels could be lower.
The final decision over which method, or even a combination of the methods, should be used
lies in the hands of the employer yet it must be stated that something should be done to
improve the moral of the on-site labourer.
Interim Report for the Ya Rena Precast Plant
38
Chapter 4: Conclusion
The Ya Rena Precast Plant is still a relatively new business and so it will be expected that
problems will arise within the organisation. The content of this project serves to address some
of the issues but obviously not all of the problems.
The basis around the project is to supply the on site manager with tools which he/she can use
on a daily basis. The user interface and user manuals will enable the on site manager to use of
the program’s supplied to him/her without a large amount of training or having the need to
employ an Industrial Engineer to conduct the studies.
The use of the Microsoft Access Data Capturing System could prove to be an invaluable tool
if used correctly. The information that can be retrieved from the reports can help management
to pin point areas of concern as well as to give on overall view of the operations of the
organisation. It must be stated that in order for the system to work correctly it needs to be
updated everyday.
The production planning algorithm will give the onsite manager a better idea of what his
production plan should look like. The program will point out the need to increase or decrease
stock levels and aid the manager in knowing what the production demand for the near future
will look like. The Excel user interface is fairly simple to use and is the only real centre
where input data needs to be placed. This makes the program very user friendly and easy to
use.
With use of the ARENA model depicting the production of the hollow form blocks the onsite
manager should get a deeper understanding of where valuable time within the production can
be made up. The system will allow him/her to run various scenarios and based on the results
that can be obtained, give the manager confidence in knowing that a newly implemented
change in the system will be a beneficial one. The calculation of the re-order points for the
raw material stock piles will aid the manager in knowing exactly when an order for new
material should be placed thus eliminating the guess work involved in the task.
It is vitally important that care of the onsite labour is taken. The image of the employer in
supplying the labourers with the necessary ergonomic aids and incentive schemes will place
the management in good light in the eyes of the workers. Although this is not the point of the
implementation of the aids it is a definitely an advantage. Medical bills and loss in production
time due to injured workers is currently a problem yet it is believed that with the aids this
should not be a major issue in the future.
Overall the project has aimed at improving various functions at the precast plant and
particularly in aiding the production manger and upper management of the plant. It is
believed that with the implementation of the systems a great improvement to the organisation
will be felt.

Interim Report for the Ya Rena Precast Plant
39
Appendices
Figure 17 – Back Support
Figure 18 – Wrist Support

Interim Report for the Ya Rena Precast Plant
40
Figure 19 – Elbow Support
Figure 20 – Knee Pads
Interim Report for the Ya Rena Precast Plant
41
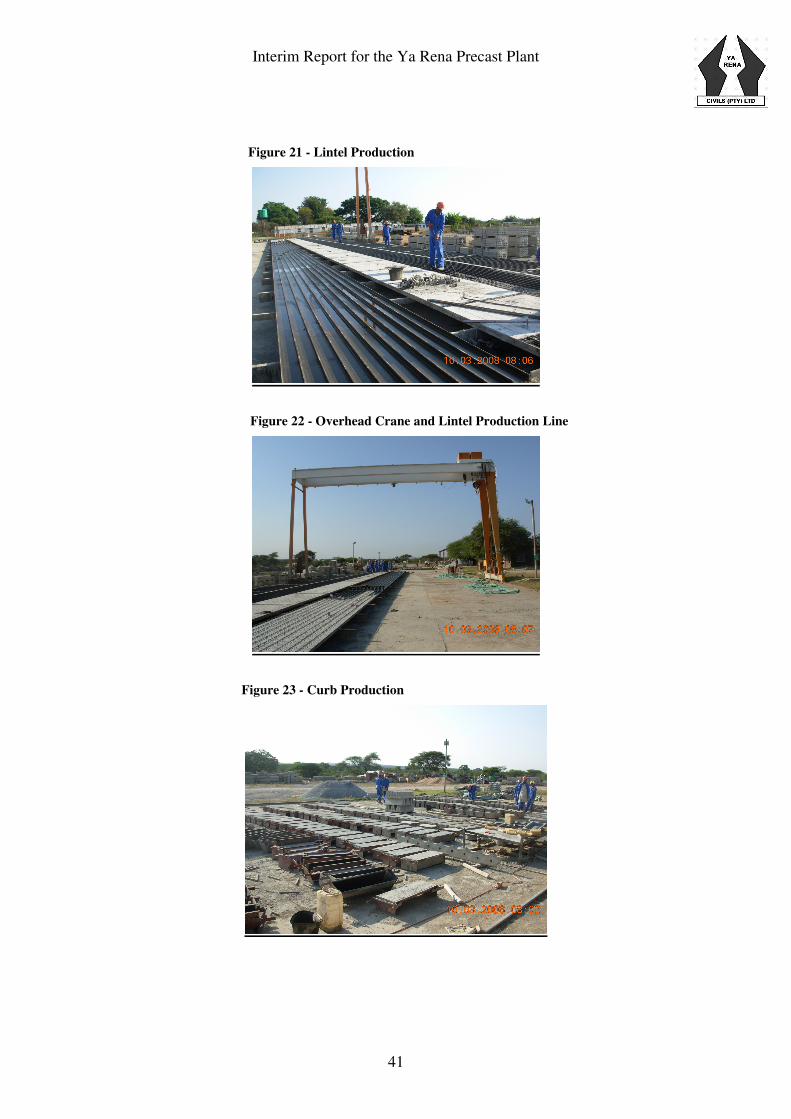
Figure 21 - Lintel Production
Figure 22 - Overhead Crane and Lintel Production Line
Figure 23 - Curb Production
Interim Report for the Ya Rena Precast Plant
42
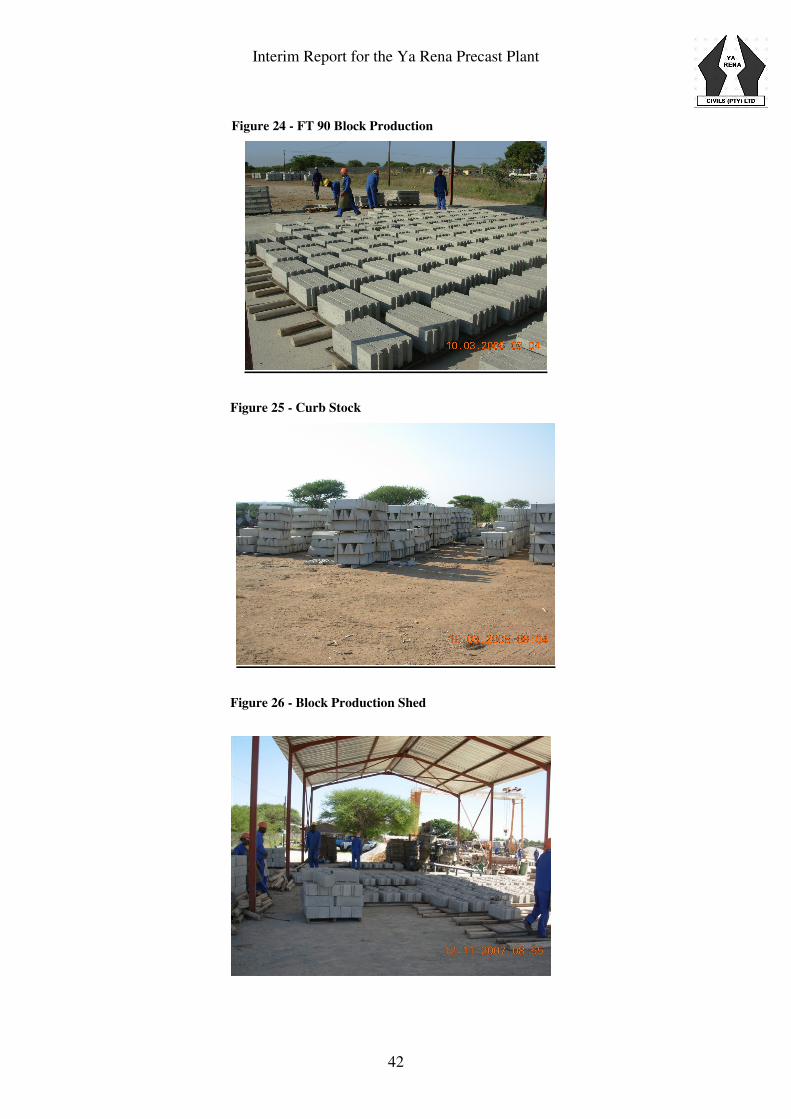
Figure 24 - FT 90 Block Production
Figure 25 - Curb Stock
Figure 26 - Block Production Shed
Interim Report for the Ya Rena Precast Plant
43
Figure 27 - Form Block Handler
Figure 28 - Lintel Labourers Kneeling
Figure 29 - Form Block Trolley
Business Optimisation of Ya Rena Precast Plant
44
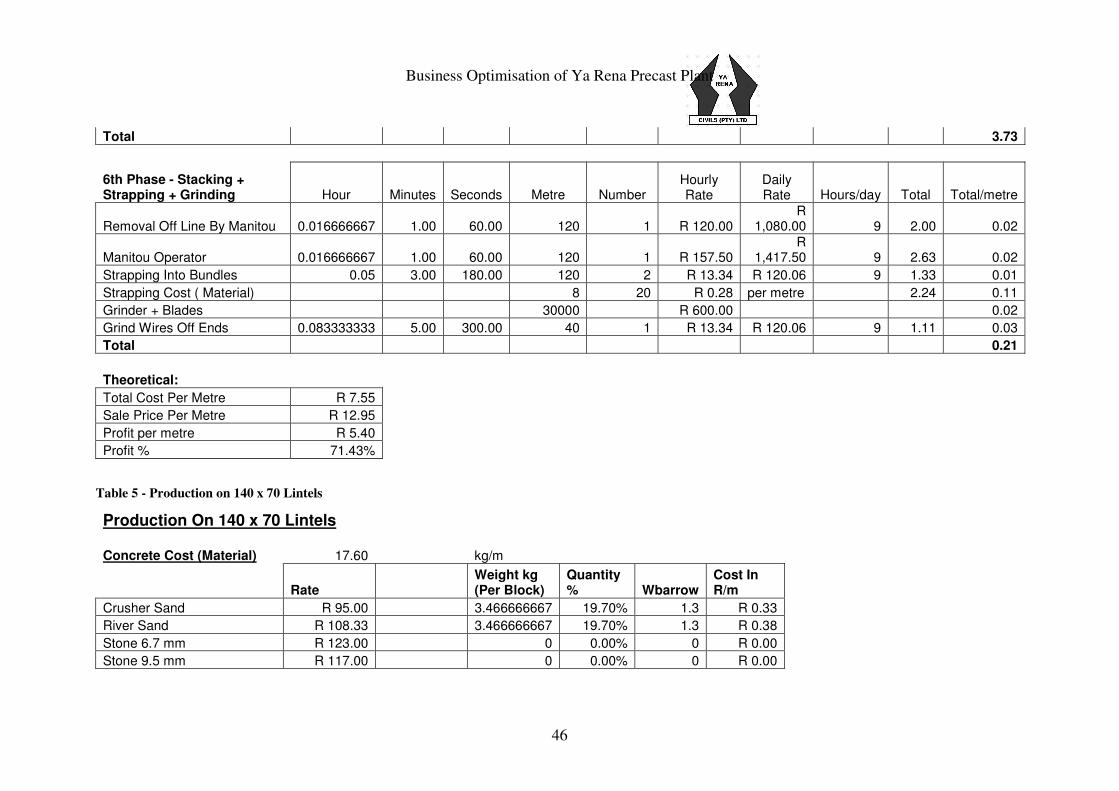
Table 4 - Production on 110 x Lintel Bays
Production On 110 x 70 Lintel Bays
Concrete Cost (Material) 14.55 kg/m
Rate/ton
Weight kg (Per Block)
Quantity % Wbarrow
Cost In R/m
Crusher Sand R 95.00 2.87 19.70% 1.3 R 0.27
River Sand R 108.33 2.87 19.70% 1.3 R 0.31
Stone 6.7 mm R 123.00 0.00 0.00% R 0.00
Stone 9.5 mm R 117.00 0.00 0.00% R 0.00
Stone 13.2 mm R 123.00 4.41 30.30% 2 R 0.54
Water R 1.50 2.20 15.15% 1 R 0.00
Cement R 960.00 2.20 15.15% 1 R 2.12
1527.833333 14.55 1 6.6 R 3.24 R 3.24
Phase Breakdown
1st Phase - Strip Hour Minutes Seconds Metre Number Hourly Rate
Daily Rate Hours/day Total Total/metre
Bolt Cutter 15000 90 each 90.00 0.01
Remove Lintel From Mould 0.366666667 22.00 1320.00 50 5 R 13.34 R 120.06 9 24.46 0.49
Stack Lintel On The Side 0.166666667 10.00 600.00 50 7 R 13.34 R 120.06 9 15.56 0.31
Total 0.80
2nd Phase - Clean Bays Hour Minutes Seconds Metre Number Hourly Rate
Daily Rate Hours/day Total Total/metre
Removal Of Large Pieces 0.069444444 4.17 250.00 50 1 R 13.34 R 120.06 9 8.34 0.17
Clean Bays Using Compressor (Labour) 0.163888889 9.83 590.00 330 1 R 13.34 R 120.06 9 19.68 0.06
Business Optimisation of Ya Rena Precast Plant
45
Clean Bays Using Blower (Machine) 0.163888889 9.83 590.00 330 1 R 2.00 R 18.00 9 0.33 0.00
Total 0.23
3rd Phase - Oiling Hour Minutes Seconds Metre Number Hourly Rate
Daily Rate Hours/day Total Total/metre
Oil Bays 0.366666667 22.00 1320.00 120 3 R 13.34 R 120.06 9 132.07 1.10
Oil Cost 5 litres 0.00 275 1 R 6.60 per liter 0 33.00 0.12
Total 1.22
4th Phase Wire Spacer Placement Hour Wires Seconds Metre Number
Hourly Rate
Daily Rate Hours/day Total Total/metre
Pull 1 Stand Of Wire 0.001388889 5.00 110.00 50 1 R 13.34 R 120.06 9 0.09 0.00
Wire Cost 5.00 50 1 R 0.26 per metre 1.30 1.30
Place Wire Through Spacer 0.005555556 5.00 20.00 50 1 R 13.34 R 120.06 9 0.37 0.01
Measure Lengths
Place Spacer 0.019444444 70.00 40 1 R 13.34 R 120.06 9 0.26 0.01
Tension Bay 0.091666667 5.00 330.00 50 2 R 13.34 R 120.06 9 2.45 0.05
Total 1.36
5th Phase - Pouring + Vibration Hour Minutes Seconds Metre Number
Hourly Rate
Daily Rate Hours/day Total Total/metre
Mix Concrete (Labour) 0.083333333 5.00 300.00 32 5 R 13.34 R 120.06 9 5.56 0.17
Mix Concrete (Machine) 0.083333333 5.00 300.00 32 1 R 13.34 R 120.06 9 1.11 0.03
Concrete Cost (see above) 3.24
Place In Bucket, Move and Empty ( Labour) 0.083333333 5.00 300.00 60 2 R 13.34 R 120.06 9 2.22 0.04
Crane Cost 0.083333333 5.00 300.00 60 1 R 13.34 R 120.06 9 1.11 0.02
Spreading Of Concrete 0.083333333 5.00 300.00 32 3 R 13.34 R 120.06 9 3.34 0.10
Vibration (Labour) 0.083333333 5.00 300.00 32 3 R 13.34 R 120.06 9 3.34 0.10
Vibration (Machine) 0.083333333 5.00 300.00 32 1 R 5.56 R 50.00 9 0.46 0.01
Business Optimisation of Ya Rena Precast Plant
46
Total 3.73
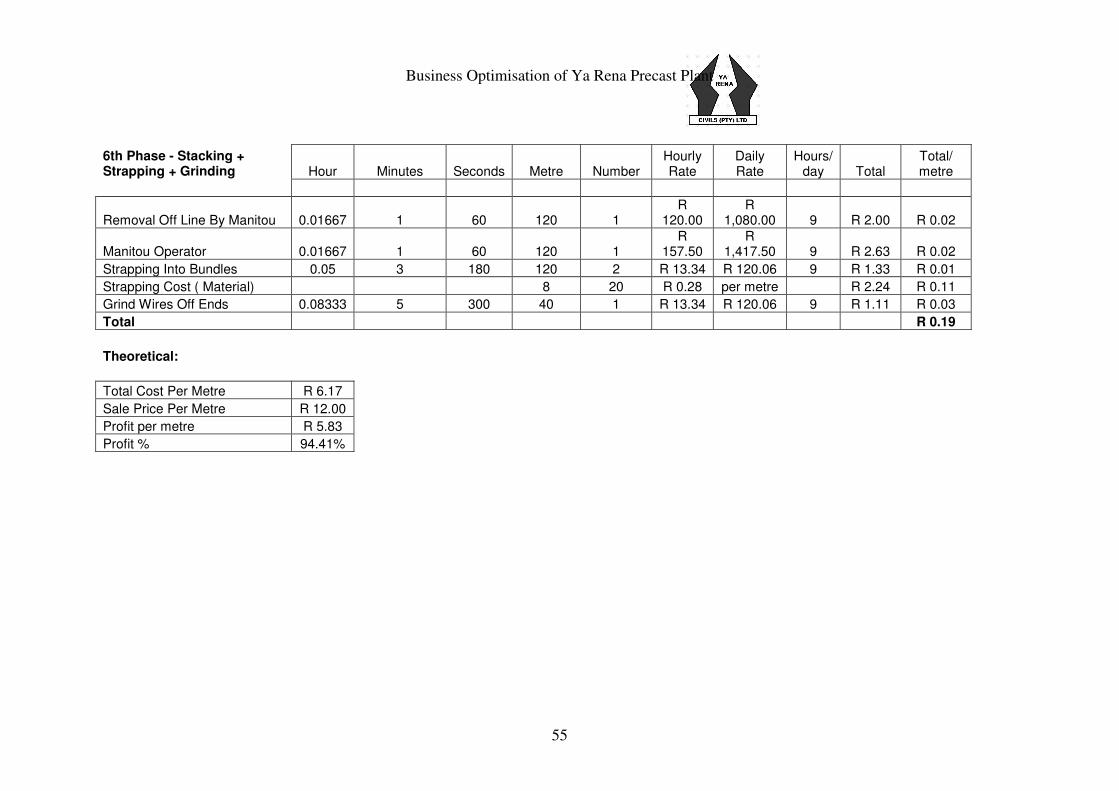
6th Phase - Stacking + Strapping + Grinding Hour Minutes Seconds Metre Number
Hourly Rate
Daily Rate Hours/day Total Total/metre
Removal Off Line By Manitou 0.016666667 1.00 60.00 120 1 R 120.00 R
1,080.00 9 2.00 0.02
Manitou Operator 0.016666667 1.00 60.00 120 1 R 157.50 R
1,417.50 9 2.63 0.02
Strapping Into Bundles 0.05 3.00 180.00 120 2 R 13.34 R 120.06 9 1.33 0.01
Strapping Cost ( Material) 8 20 R 0.28 per metre 2.24 0.11
Grinder + Blades 30000 R 600.00 0.02
Grind Wires Off Ends 0.083333333 5.00 300.00 40 1 R 13.34 R 120.06 9 1.11 0.03
Total 0.21
Theoretical:
Total Cost Per Metre R 7.55
Sale Price Per Metre R 12.95
Profit per metre R 5.40
Profit % 71.43%
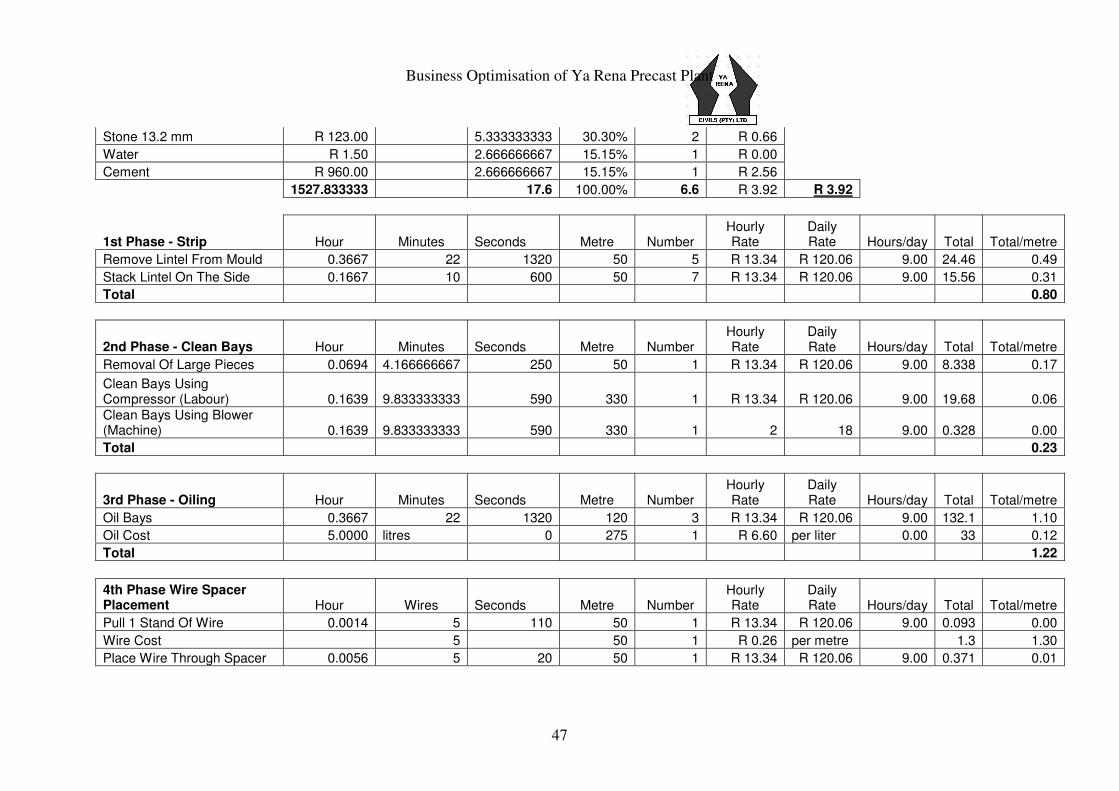
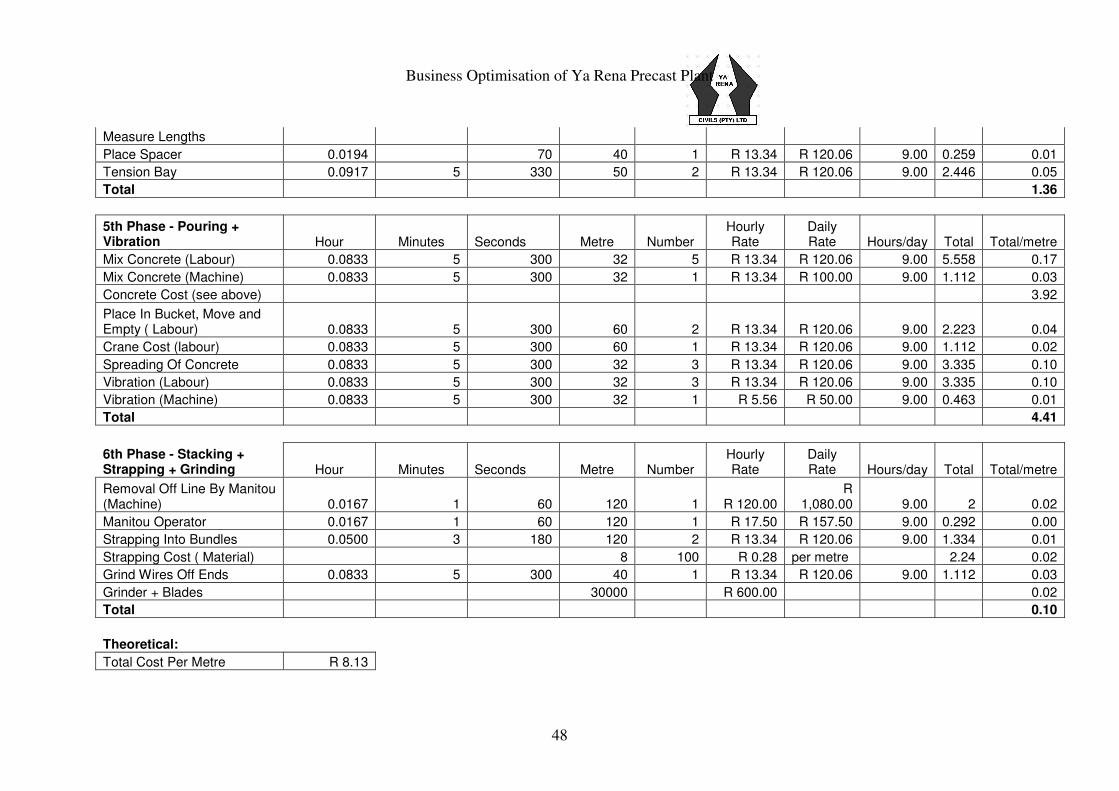
Table 5 - Production on 140 x 70 Lintels
Production On 140 x 70 Lintels
Concrete Cost (Material) 17.60 kg/m
Rate Weight kg (Per Block)
Quantity % Wbarrow
Cost In R/m
Crusher Sand R 95.00 3.466666667 19.70% 1.3 R 0.33
River Sand R 108.33 3.466666667 19.70% 1.3 R 0.38
Stone 6.7 mm R 123.00 0 0.00% 0 R 0.00
Stone 9.5 mm R 117.00 0 0.00% 0 R 0.00
Business Optimisation of Ya Rena Precast Plant
47
Stone 13.2 mm R 123.00 5.333333333 30.30% 2 R 0.66
Water R 1.50 2.666666667 15.15% 1 R 0.00
Cement R 960.00 2.666666667 15.15% 1 R 2.56
1527.833333 17.6 100.00% 6.6 R 3.92 R 3.92
1st Phase - Strip Hour Minutes Seconds Metre Number Hourly Rate
Daily Rate Hours/day Total Total/metre
Remove Lintel From Mould 0.3667 22 1320 50 5 R 13.34 R 120.06 9.00 24.46 0.49
Stack Lintel On The Side 0.1667 10 600 50 7 R 13.34 R 120.06 9.00 15.56 0.31
Total 0.80
2nd Phase - Clean Bays Hour Minutes Seconds Metre Number Hourly Rate
Daily Rate Hours/day Total Total/metre
Removal Of Large Pieces 0.0694 4.166666667 250 50 1 R 13.34 R 120.06 9.00 8.338 0.17
Clean Bays Using Compressor (Labour) 0.1639 9.833333333 590 330 1 R 13.34 R 120.06 9.00 19.68 0.06
Clean Bays Using Blower (Machine) 0.1639 9.833333333 590 330 1 2 18 9.00 0.328 0.00
Total 0.23
3rd Phase - Oiling Hour Minutes Seconds Metre Number Hourly Rate
Daily Rate Hours/day Total Total/metre
Oil Bays 0.3667 22 1320 120 3 R 13.34 R 120.06 9.00 132.1 1.10
Oil Cost 5.0000 litres 0 275 1 R 6.60 per liter 0.00 33 0.12
Total 1.22
4th Phase Wire Spacer Placement Hour Wires Seconds Metre Number
Hourly Rate
Daily Rate Hours/day Total Total/metre
Pull 1 Stand Of Wire 0.0014 5 110 50 1 R 13.34 R 120.06 9.00 0.093 0.00
Wire Cost 5 50 1 R 0.26 per metre 1.3 1.30
Place Wire Through Spacer 0.0056 5 20 50 1 R 13.34 R 120.06 9.00 0.371 0.01
Business Optimisation of Ya Rena Precast Plant
48
Measure Lengths
Place Spacer 0.0194 70 40 1 R 13.34 R 120.06 9.00 0.259 0.01
Tension Bay 0.0917 5 330 50 2 R 13.34 R 120.06 9.00 2.446 0.05
Total 1.36
5th Phase - Pouring + Vibration Hour Minutes Seconds Metre Number
Hourly Rate
Daily Rate Hours/day Total Total/metre
Mix Concrete (Labour) 0.0833 5 300 32 5 R 13.34 R 120.06 9.00 5.558 0.17
Mix Concrete (Machine) 0.0833 5 300 32 1 R 13.34 R 100.00 9.00 1.112 0.03
Concrete Cost (see above) 3.92
Place In Bucket, Move and Empty ( Labour) 0.0833 5 300 60 2 R 13.34 R 120.06 9.00 2.223 0.04
Crane Cost (labour) 0.0833 5 300 60 1 R 13.34 R 120.06 9.00 1.112 0.02
Spreading Of Concrete 0.0833 5 300 32 3 R 13.34 R 120.06 9.00 3.335 0.10
Vibration (Labour) 0.0833 5 300 32 3 R 13.34 R 120.06 9.00 3.335 0.10
Vibration (Machine) 0.0833 5 300 32 1 R 5.56 R 50.00 9.00 0.463 0.01
Total 4.41
6th Phase - Stacking + Strapping + Grinding Hour Minutes Seconds Metre Number
Hourly Rate
Daily Rate Hours/day Total Total/metre
Removal Off Line By Manitou (Machine) 0.0167 1 60 120 1 R 120.00
R 1,080.00 9.00 2 0.02
Manitou Operator 0.0167 1 60 120 1 R 17.50 R 157.50 9.00 0.292 0.00
Strapping Into Bundles 0.0500 3 180 120 2 R 13.34 R 120.06 9.00 1.334 0.01
Strapping Cost ( Material) 8 100 R 0.28 per metre 2.24 0.02
Grind Wires Off Ends 0.0833 5 300 40 1 R 13.34 R 120.06 9.00 1.112 0.03
Grinder + Blades 30000 R 600.00 0.02
Total 0.10
Theoretical:
Total Cost Per Metre R 8.13
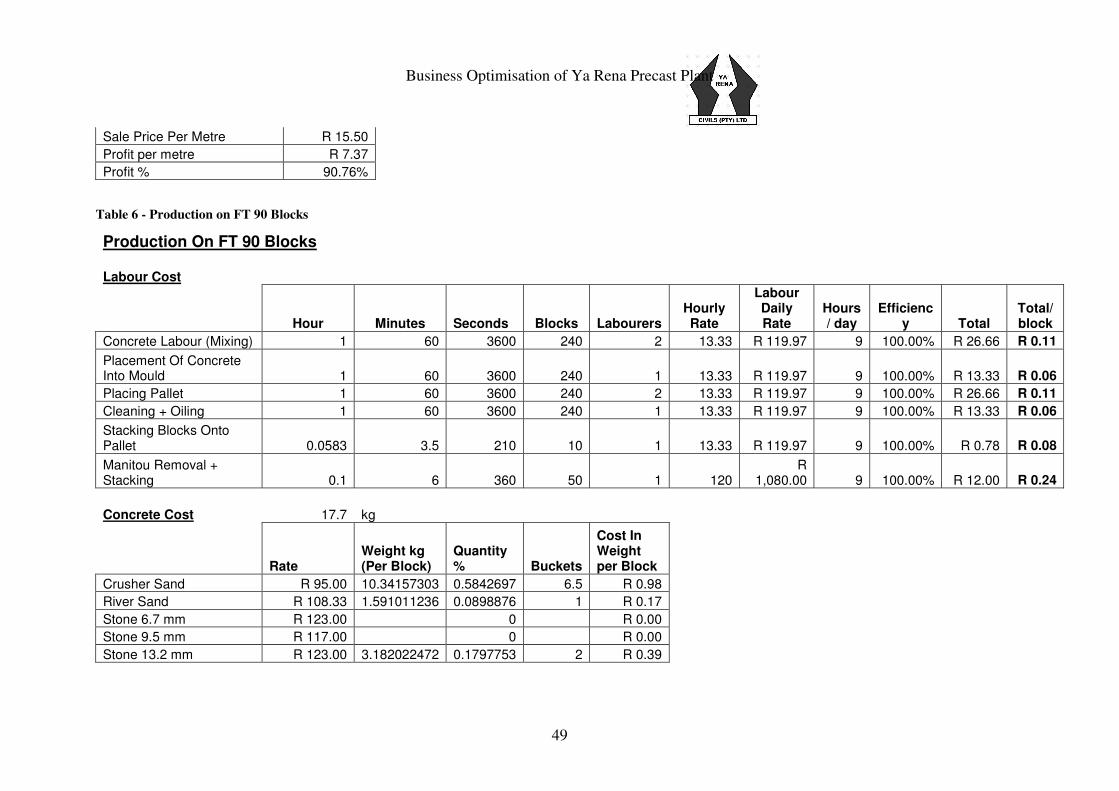
Business Optimisation of Ya Rena Precast Plant
49
Sale Price Per Metre R 15.50
Profit per metre R 7.37
Profit % 90.76%
Table 6 - Production on FT 90 Blocks
Production On FT 90 Blocks
Labour Cost
Hour Minutes Seconds Blocks Labourers Hourly Rate
Labour Daily Rate
Hours/ day
Efficiency Total
Total/ block
Concrete Labour (Mixing) 1 60 3600 240 2 13.33 R 119.97 9 100.00% R 26.66 R 0.11
Placement Of Concrete Into Mould 1 60 3600 240 1 13.33 R 119.97 9 100.00% R 13.33 R 0.06
Placing Pallet 1 60 3600 240 2 13.33 R 119.97 9 100.00% R 26.66 R 0.11
Cleaning + Oiling 1 60 3600 240 1 13.33 R 119.97 9 100.00% R 13.33 R 0.06
Stacking Blocks Onto Pallet 0.0583 3.5 210 10 1 13.33 R 119.97 9 100.00% R 0.78 R 0.08
Manitou Removal + Stacking 0.1 6 360 50 1 120
R 1,080.00 9 100.00% R 12.00 R 0.24
Concrete Cost 17.7 kg
Rate Weight kg (Per Block)
Quantity % Buckets
Cost In Weight per Block
Crusher Sand R 95.00 10.34157303 0.5842697 6.5 R 0.98
River Sand R 108.33 1.591011236 0.0898876 1 R 0.17
Stone 6.7 mm R 123.00 0 R 0.00
Stone 9.5 mm R 117.00 0 R 0.00
Stone 13.2 mm R 123.00 3.182022472 0.1797753 2 R 0.39
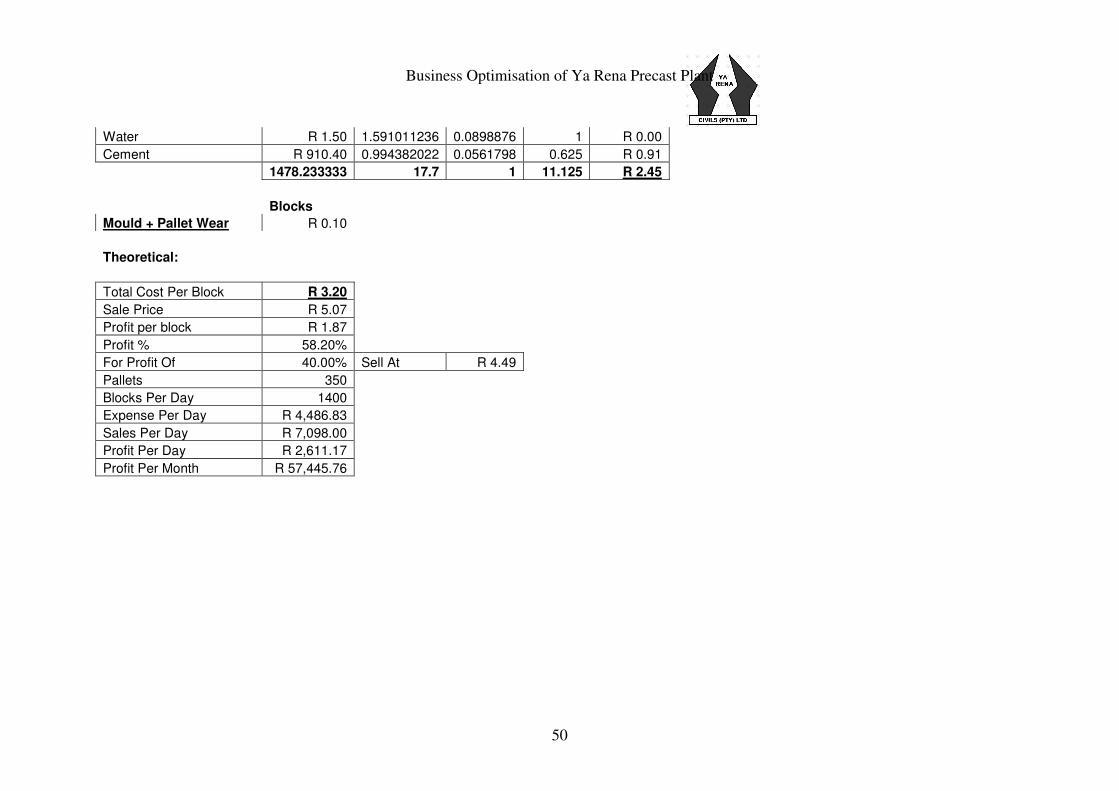
Business Optimisation of Ya Rena Precast Plant
50
Water R 1.50 1.591011236 0.0898876 1 R 0.00
Cement R 910.40 0.994382022 0.0561798 0.625 R 0.91
1478.233333 17.7 1 11.125 R 2.45
Blocks
Mould + Pallet Wear R 0.10
Theoretical:
Total Cost Per Block R 3.20
Sale Price R 5.07
Profit per block R 1.87
Profit % 58.20%
For Profit Of 40.00% Sell At R 4.49
Pallets 350
Blocks Per Day 1400
Expense Per Day R 4,486.83
Sales Per Day R 7,098.00
Profit Per Day R 2,611.17
Profit Per Month R 57,445.76
Business Optimisation of Ya Rena Precast Plant
51
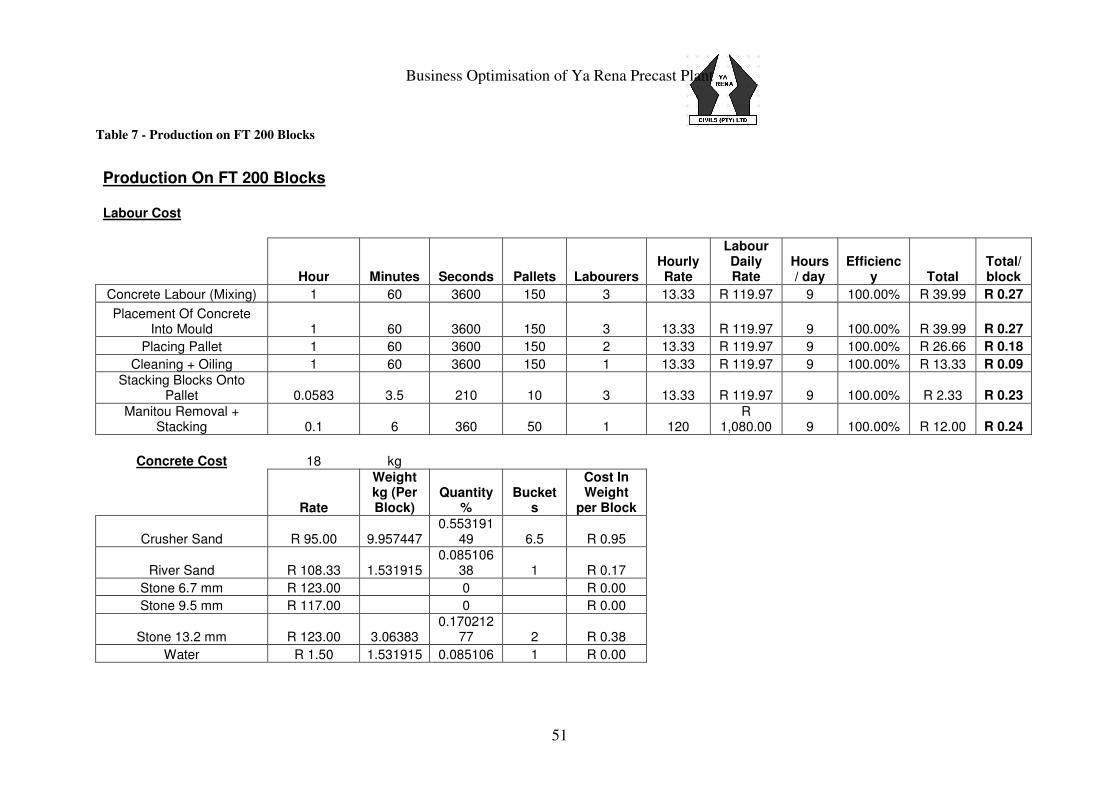
Table 7 - Production on FT 200 Blocks
Production On FT 200 Blocks
Labour Cost
Hour Minutes Seconds Pallets Labourers Hourly Rate
Labour Daily Rate
Hours/ day
Efficiency Total
Total/ block
Concrete Labour (Mixing) 1 60 3600 150 3 13.33 R 119.97 9 100.00% R 39.99 R 0.27
Placement Of Concrete Into Mould 1 60 3600 150 3 13.33 R 119.97 9 100.00% R 39.99 R 0.27
Placing Pallet 1 60 3600 150 2 13.33 R 119.97 9 100.00% R 26.66 R 0.18
Cleaning + Oiling 1 60 3600 150 1 13.33 R 119.97 9 100.00% R 13.33 R 0.09
Stacking Blocks Onto Pallet 0.0583 3.5 210 10 3 13.33 R 119.97 9 100.00% R 2.33 R 0.23
Manitou Removal + Stacking 0.1 6 360 50 1 120
R 1,080.00 9 100.00% R 12.00 R 0.24
Concrete Cost 18 kg
Rate
Weight kg (Per Block)
Quantity %
Buckets
Cost In Weight
per Block
Crusher Sand R 95.00 9.957447 0.553191
49 6.5 R 0.95
River Sand R 108.33 1.531915 0.085106
38 1 R 0.17
Stone 6.7 mm R 123.00 0 R 0.00
Stone 9.5 mm R 117.00 0 R 0.00
Stone 13.2 mm R 123.00 3.06383 0.170212
77 2 R 0.38
Water R 1.50 1.531915 0.085106 1 R 0.00
Business Optimisation of Ya Rena Precast Plant
52
38
Cement R 45.52 1.914894 0.106382
98 1.25 R 0.09
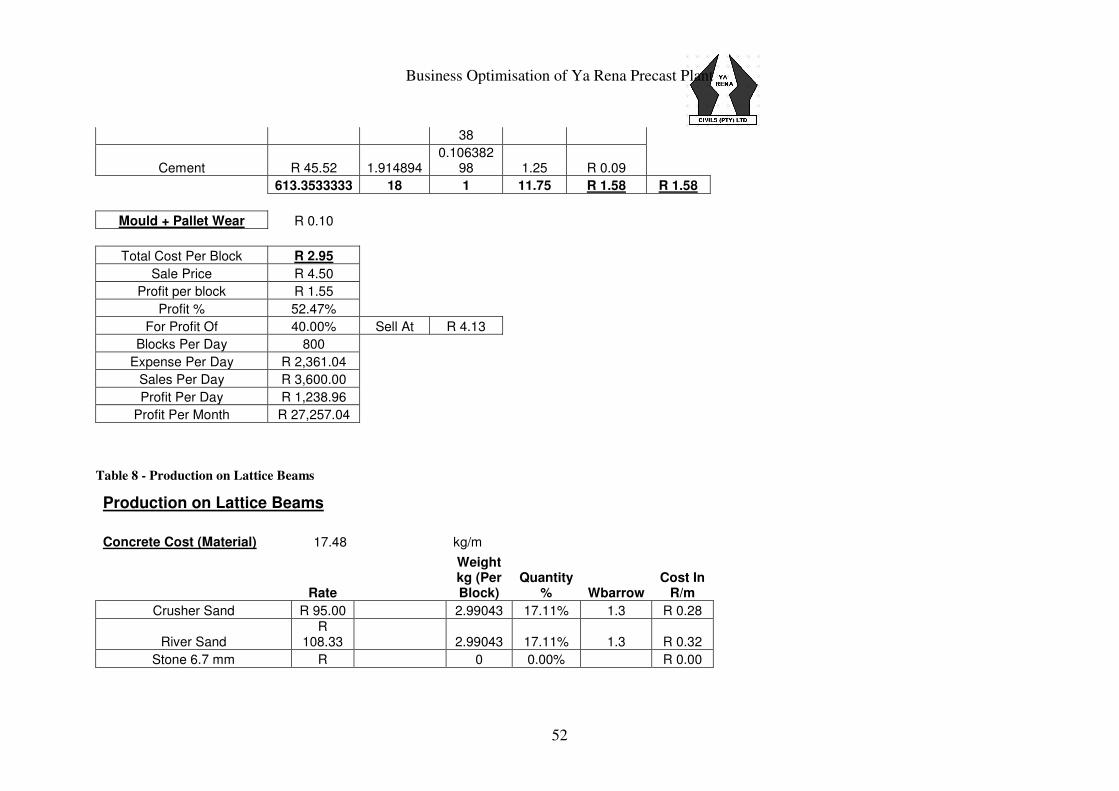
613.3533333 18 1 11.75 R 1.58 R 1.58
Mould + Pallet Wear R 0.10
Total Cost Per Block R 2.95
Sale Price R 4.50
Profit per block R 1.55
Profit % 52.47%
For Profit Of 40.00% Sell At R 4.13
Blocks Per Day 800
Expense Per Day R 2,361.04
Sales Per Day R 3,600.00
Profit Per Day R 1,238.96
Profit Per Month R 27,257.04
Table 8 - Production on Lattice Beams
Production on Lattice Beams
Concrete Cost (Material) 17.48 kg/m
Rate
Weight kg (Per Block)
Quantity % Wbarrow
Cost In R/m
Crusher Sand R 95.00 2.99043 17.11% 1.3 R 0.28
River Sand R
108.33 2.99043 17.11% 1.3 R 0.32
Stone 6.7 mm R 0 0.00% R 0.00
Business Optimisation of Ya Rena Precast Plant
53
123.00
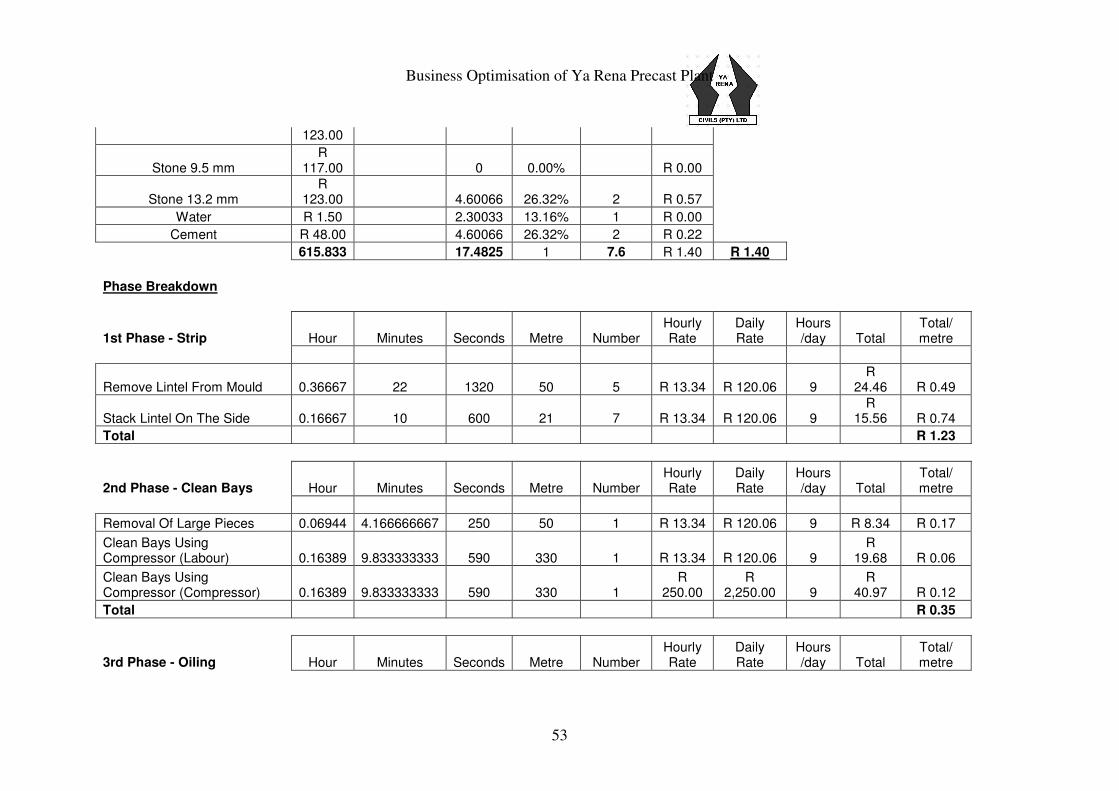
Stone 9.5 mm R
117.00 0 0.00% R 0.00
Stone 13.2 mm R
123.00 4.60066 26.32% 2 R 0.57
Water R 1.50 2.30033 13.16% 1 R 0.00
Cement R 48.00 4.60066 26.32% 2 R 0.22
615.833 17.4825 1 7.6 R 1.40 R 1.40
Phase Breakdown
1st Phase - Strip Hour Minutes Seconds Metre Number Hourly Rate
Daily Rate
Hours /day Total
Total/ metre
Remove Lintel From Mould 0.36667 22 1320 50 5 R 13.34 R 120.06 9 R
24.46 R 0.49
Stack Lintel On The Side 0.16667 10 600 21 7 R 13.34 R 120.06 9 R
15.56 R 0.74
Total R 1.23
2nd Phase - Clean Bays Hour Minutes Seconds Metre Number Hourly Rate
Daily Rate
Hours /day Total
Total/ metre
Removal Of Large Pieces 0.06944 4.166666667 250 50 1 R 13.34 R 120.06 9 R 8.34 R 0.17
Clean Bays Using Compressor (Labour) 0.16389 9.833333333 590 330 1 R 13.34 R 120.06 9
R 19.68 R 0.06
Clean Bays Using Compressor (Compressor) 0.16389 9.833333333 590 330 1
R 250.00
R 2,250.00 9
R 40.97 R 0.12
Total R 0.35
3rd Phase - Oiling Hour Minutes Seconds Metre Number Hourly Rate
Daily Rate
Hours /day Total
Total/ metre
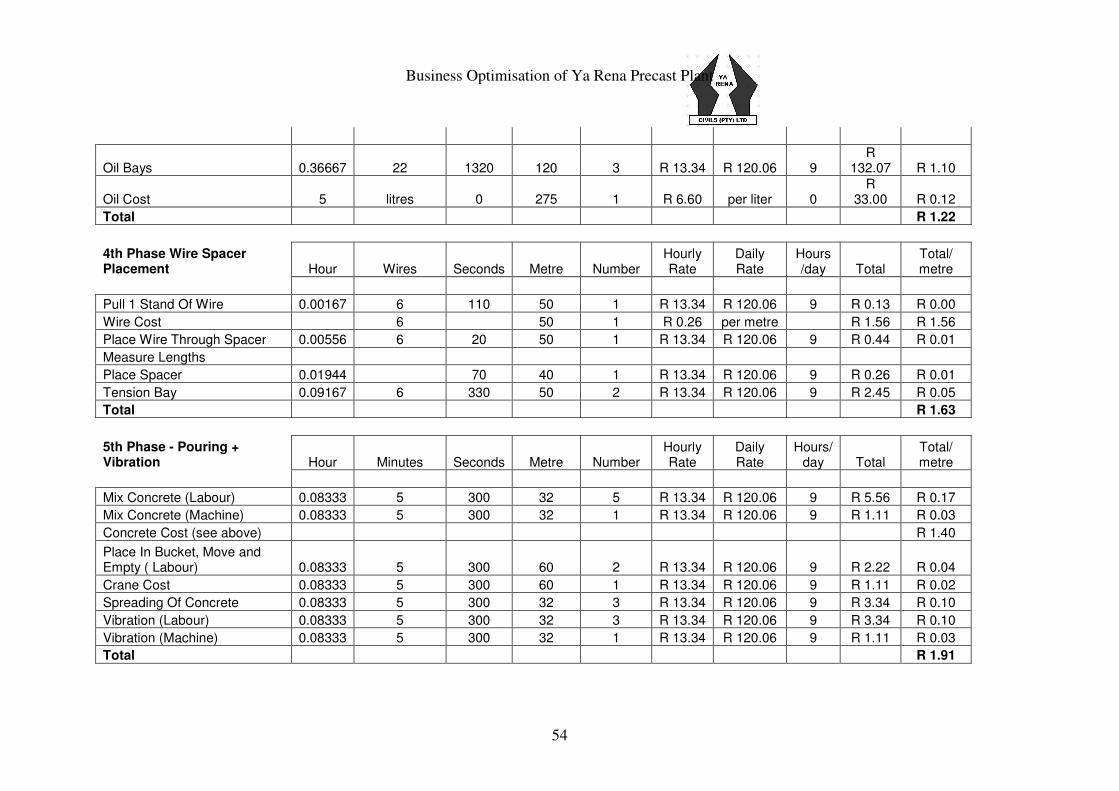
Business Optimisation of Ya Rena Precast Plant
54
Oil Bays 0.36667 22 1320 120 3 R 13.34 R 120.06 9 R
132.07 R 1.10
Oil Cost 5 litres 0 275 1 R 6.60 per liter 0 R
33.00 R 0.12
Total R 1.22
4th Phase Wire Spacer Placement Hour Wires Seconds Metre Number
Hourly Rate
Daily Rate
Hours /day Total
Total/ metre
Pull 1 Stand Of Wire 0.00167 6 110 50 1 R 13.34 R 120.06 9 R 0.13 R 0.00
Wire Cost 6 50 1 R 0.26 per metre R 1.56 R 1.56
Place Wire Through Spacer 0.00556 6 20 50 1 R 13.34 R 120.06 9 R 0.44 R 0.01
Measure Lengths
Place Spacer 0.01944 70 40 1 R 13.34 R 120.06 9 R 0.26 R 0.01
Tension Bay 0.09167 6 330 50 2 R 13.34 R 120.06 9 R 2.45 R 0.05
Total R 1.63
5th Phase - Pouring + Vibration Hour Minutes Seconds Metre Number
Hourly Rate
Daily Rate
Hours/ day Total
Total/ metre
Mix Concrete (Labour) 0.08333 5 300 32 5 R 13.34 R 120.06 9 R 5.56 R 0.17
Mix Concrete (Machine) 0.08333 5 300 32 1 R 13.34 R 120.06 9 R 1.11 R 0.03
Concrete Cost (see above) R 1.40
Place In Bucket, Move and Empty ( Labour) 0.08333 5 300 60 2 R 13.34 R 120.06 9 R 2.22 R 0.04
Crane Cost 0.08333 5 300 60 1 R 13.34 R 120.06 9 R 1.11 R 0.02
Spreading Of Concrete 0.08333 5 300 32 3 R 13.34 R 120.06 9 R 3.34 R 0.10
Vibration (Labour) 0.08333 5 300 32 3 R 13.34 R 120.06 9 R 3.34 R 0.10
Vibration (Machine) 0.08333 5 300 32 1 R 13.34 R 120.06 9 R 1.11 R 0.03
Total R 1.91
Business Optimisation of Ya Rena Precast Plant
55
6th Phase - Stacking + Strapping + Grinding Hour Minutes Seconds Metre Number
Hourly Rate
Daily Rate
Hours/ day Total
Total/ metre
Removal Off Line By Manitou 0.01667 1 60 120 1 R
120.00 R
1,080.00 9 R 2.00 R 0.02
Manitou Operator 0.01667 1 60 120 1 R
157.50 R
1,417.50 9 R 2.63 R 0.02
Strapping Into Bundles 0.05 3 180 120 2 R 13.34 R 120.06 9 R 1.33 R 0.01
Strapping Cost ( Material) 8 20 R 0.28 per metre R 2.24 R 0.11
Grind Wires Off Ends 0.08333 5 300 40 1 R 13.34 R 120.06 9 R 1.11 R 0.03
Total R 0.19
Theoretical:
Total Cost Per Metre R 6.17
Sale Price Per Metre R 12.00
Profit per metre R 5.83
Profit % 94.41%
Business Optimisation of Ya Rena Precast Plant
56
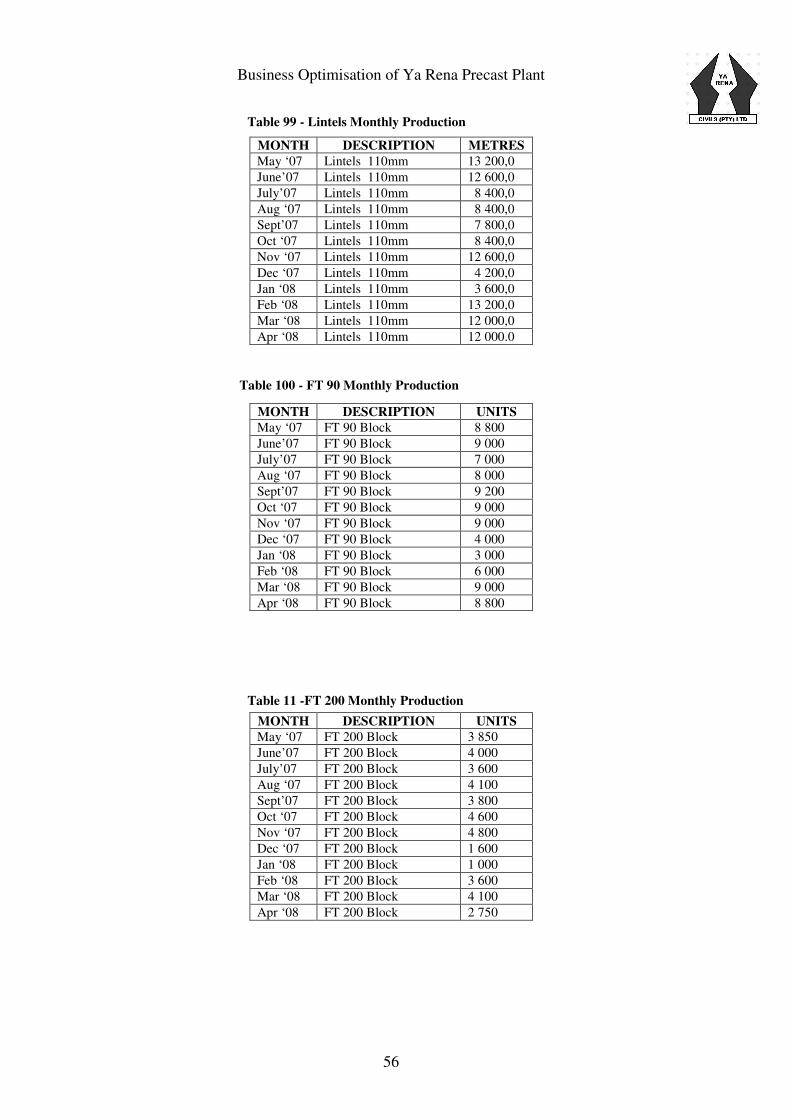
MONTH DESCRIPTION METRES
May ‘07 Lintels 110mm 13 200,0
June’07 Lintels 110mm 12 600,0
July’07 Lintels 110mm 8 400,0
Aug ‘07 Lintels 110mm 8 400,0
Sept’07 Lintels 110mm 7 800,0
Oct ‘07 Lintels 110mm 8 400,0
Nov ‘07 Lintels 110mm 12 600,0
Dec ‘07 Lintels 110mm 4 200,0
Jan ‘08 Lintels 110mm 3 600,0
Feb ‘08 Lintels 110mm 13 200,0
Mar ‘08 Lintels 110mm 12 000,0
Apr ‘08 Lintels 110mm 12 000.0
Table 99 - Lintels Monthly Production
Table 100 - FT 90 Monthly Production
MONTH DESCRIPTION UNITS
May ‘07 FT 90 Block 8 800
June’07 FT 90 Block 9 000
July’07 FT 90 Block 7 000
Aug ‘07 FT 90 Block 8 000
Sept’07 FT 90 Block 9 200
Oct ‘07 FT 90 Block 9 000
Nov ‘07 FT 90 Block 9 000
Dec ‘07 FT 90 Block 4 000
Jan ‘08 FT 90 Block 3 000
Feb ‘08 FT 90 Block 6 000
Mar ‘08 FT 90 Block 9 000
Apr ‘08 FT 90 Block 8 800
MONTH DESCRIPTION UNITS
May ‘07 FT 200 Block 3 850
June’07 FT 200 Block 4 000
July’07 FT 200 Block 3 600
Aug ‘07 FT 200 Block 4 100
Sept’07 FT 200 Block 3 800
Oct ‘07 FT 200 Block 4 600
Nov ‘07 FT 200 Block 4 800
Dec ‘07 FT 200 Block 1 600
Jan ‘08 FT 200 Block 1 000
Feb ‘08 FT 200 Block 3 600
Mar ‘08 FT 200 Block 4 100
Apr ‘08 FT 200 Block 2 750
Table 11 -FT 200 Monthly Production
Business Optimisation of Ya Rena Precast Plant
57
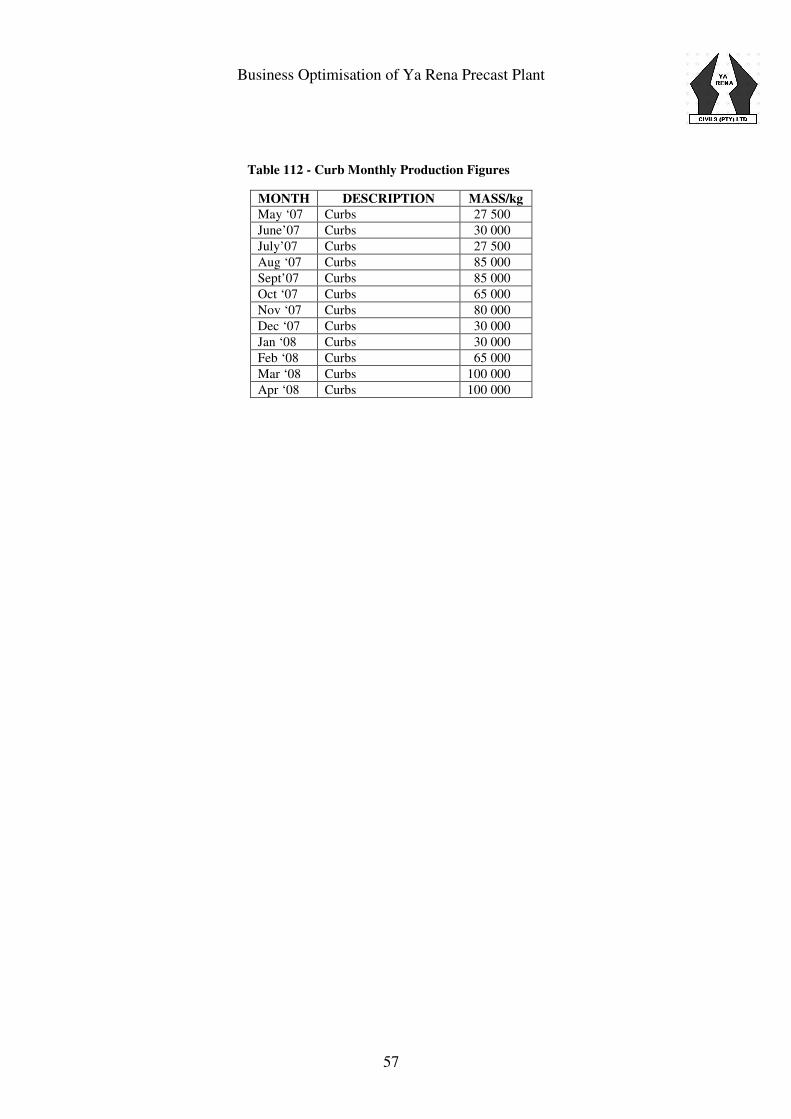
MONTH DESCRIPTION MASS/kg
May ‘07 Curbs 27 500
June’07 Curbs 30 000
July’07 Curbs 27 500
Aug ‘07 Curbs 85 000
Sept’07 Curbs 85 000
Oct ‘07 Curbs 65 000
Nov ‘07 Curbs 80 000
Dec ‘07 Curbs 30 000
Jan ‘08 Curbs 30 000
Feb ‘08 Curbs 65 000
Mar ‘08 Curbs 100 000
Apr ‘08 Curbs 100 000
Table 112 - Curb Monthly Production Figures
Business Optimisation of Ya Rena Precast Plant
58
References
Bentley, L.D. & Whitten, J.L., 2007. Systems Analysis & Design for the Global Enterprise.
7th
ed. Mcgraw-Hill: Purdue University, West Lafayette, IN
Dawood, N.N. & Neale, R.H., 1990. A Survey of Current Production Planning Practices in
the Precast Industry. Construction Management and Economics [Online] 8, p365-383
Available at: http://www.scholar.google.co.za/ [accessed 13th
May 2008]
Dawood, N.N., 1994. Developing a Production Management Modeling Approach for
Precast Concrete Building Products. Construction Management and Economics [Online] 12,
p 343 – 383
Available at: http://www.scholar.google.co.za/ [accessed 13th
May 2008]
Babontin-Bravo, E., 1990. Simulation of Large Precast Operations. Proceedings of the 1998
Winter Simulation Conference. D.J. Medeiros, E.F. Watson, J.S. Carson and M.S.
Manivannan, eds. [Online] p1311 – 1317
Available at: http://www.scholar.google.co.za/ [accessed 13th
May 2008]
Tiong, R.L.K., et al. 2007. Simulation Based Planning for Precast Production with Two
Critical Resources. Proceedings of the 2007 Winter Simulation Conference S. G. Henderson,
B. Biller, M.-H. Hsieh, J. Shortle, J. D. Tew, and R. R. Barton, eds. [Online] p 2104 - 2111
Available at: http://www.scholar.google.co.za/ [accessed 15th
May 2008]
Branton, P. 1969. A Field Study of Repetitive Manual Work in Relation to Accidents at the
Work Place. The International Journal of Production Research 197, Vol 8 No 2 [Online] p
93 -107
Available at: http://www.scholar.google.co.za/ [accessed 15th
May 2008]
Donald, F.R., 1953. Work Satisfaction and Social Reward Quota. American Sociological
Review, Vol. 18, No. 5, (Oct., 1953), [Online] pp. 507-514

Business Optimisation of Ya Rena Precast Plant
59
Available at: http://www.jstor.org/stable/2087434
Bao, S., 2004. Hand-Intensive Jobs. Professional Safety. 49, 1; ABI/INFORM Global
[Online] p 28 – 34
Available at: http://www.scholar.google.co.za/ [accessed 15th
May 2008]
Copeland, J., 2003 Ergonomic Aids for Industrial Workers. Occupational Hazards. 65, 12;
ABI/INFORM Global [Online] p 50 - 52
Available at: http://www.scholar.google.co.za/ [accessed 15th
May 2008]
Microsoft Office - Word 2007
Microsoft Office - Visio 2000
Rockwell Simulation – ARENA 10.0