Embed Size (px)
Citation preview

Business Performance & Strategy
Separate Financial Result
as of June 2020
Korean Reinsurance Company

AGENDA
1 >> Korean Re Profile
2 >> Financial Highlights
3 >> Insurance Operation Performance
4 >> Investment Operation Performance
5 >> Dividend Performance

1.1 Korean Re Key Facts
3
■ 1963 : Established as Korean non-life reinsurance corporation (state run company)
■ 1978 : Privatized & listed in the Korean stock market
■ 2011 : Credit rating upgraded from A.M. Best「A-」to「A (Stable)」in Feb. 2011
■ 2014 : Credit rating upgraded from Standard & Poor′s「A-」to「A (Stable)」in Oct. 2014
■ 2018 : Top 10th reinsurer(FY2017) in the global reinsurance market
■ Total employee : 350+
■ Headquarter : Total 25 teams
(8 underwriting teams / 1 investment team / 16 administrative teams)
■ International : 4 branches (Singapore, Labuan, Dubai, Shanghai)
3 subsidiaries (Hong Kong, London, Zurich)
5 liaison offices (Beijing, Tokyo, New York, London, Bogota)
History
Organization
Employee

1.2 Global Network Channel at a glance
4
HEAD OFFICE NEW YORKLIAISON OFFICETOKYO
LIAISON OFFICE
WORLDWIDE INSURANCE SERVICES, LTD.
KOREAN RE UNDERWRITING LTD.LONDON LIAISON OFFICE
SINGAPOREBRANCH
BEIJINGLIAISON OFFICE
DUBAIBRANCH
LABUANBRANCH
Korean ReinsuranceSwitzerland AG SHANGHAI
BRANCH
BOGOTALIAISON OFFICE
■ Continuous expansion of global network to explore new market opportunities- Newly set up the “Global Project Team” in July 2017, which is exclusively responsible for overseasoffice establishment plans
■ Launching overseas operation : Korean Re Switzerland subsidiary(June 2019), Shanghai branch office(Jan. 2020), Bogota liaison office(Feb. 2020)
- Bogota liaison office in Colombia recently has been established in Feb. 2020, which will supportunderwriting in the Central and South America region

1.3 Global Reinsurers [FY 2018 Gross Premiums]
5
Ranking Name Gross Premiums
A.M. Best Rating
S&P Rating
1 Swiss Re (Switzerland) 36.4 A+ AA-
2 Munich Re (Germany) 35.8 A+ AA-
3 Hannover Re (Germany) 22.0 A+ AA-
4 SCOR SE (France) 17.5 A+ AA-
5 Berkshire Hathaway (USA) 15.4 A+ AA+
6 Lloyd‘s (UK) 14.1 A A+
7 China Reinsurance Group (China) 11.6 A A
8 RGA Inc. (USA) 11.3 A+ AA-
9 Great West Lifeco (Canada) 7.7 - A+
10 Korean Re (South Korea) 6.8 A A
(Unit : USD Bil.)
■ A.M. Best credit rating upgraded from 「A-」to 「A (stable)」in February 2011
■ S&P credit rating upgraded from 「A-」to 「A (stable)」in October 2014
■ Ranking development: ’98 : 32nd → ’05 : 15th → ’08 : 13th → ’14 : 11th → ’16 : 10th
※ Source : A.M. Best (Aug. 2019), S&P (Sep. 2019)

1.4 Comparison of Korean Corporate Ratings
6
Corporate Name S&P Rating Corporate Name S&P
Rating
Korea Electric Power AA SK Innovation BBB
Samsung Electronics AA- SK Global Chemical BBB
SK Telecom A- LG Electronics BBB
KT A- S-Oil BBB
LG Chemical BBB+ Hyundai Steel BBB
Hyundai / Kia Motors BBB+ SK E&S BBB
Hyundai Mobis BBB+ SK Hynix BBB-
POSCO BBB+ E-MART BBB-
Hyundai Glovis BBB+ KCC BB+
GS Caltex BBB Doosan Bobcat Inc. BB
■ Companies focusing on global business require global credit ratings
■ Only a few corporations* have a higher credit rating than Korean Re
* Samsung Group and Public/State-owned companies
※ Source : S&P (Aug. 4, 2020)
■ Manufacturing and others
Corporate Name S&P Rating
Samsung F&M AA-
Seoul Guarantee Ins. A+
Korean Re A
Hanwha General Ins. A
DB Insurance A
Hyundai M&F A-
KB Insurance NR
Samsung Life NR
Hanwha Life NR
Kyobo Life NR
■ Insurance

1.5 Growth Trend & Prospect
7
■ Consistently maintained growth momentum amid a low GDP growth trend
- Industry property of less sensitive to economic fluctuations and new opportunities from overseas
and personal lines of business
■ Main growth engines
- Exploring new markets of cooperatives, casualty and government insurance, etc.
- Strengthening technical services by co-development of new products responding to market needs
-5.1%
11.5%
9.1%
4.9%
7.7%
3.1%5.2% 4.3% 5.3% 5.8%
3.0%0.8%
6.8%
3.7%2.4% 3.2%
3.2%
2.8% 2.9% 3.2% 2.7% 2.0%
11.0%
8.0%
20.5%
14.4%
23.6%
10.8%
6.8%
12.1%11.1%
15.7%
10.1%
5.4%
6.5%
14.1%
9.0%
6.2%
1.3%
6.3%4.7%
7.9%
5.1%6.5%
GDP Growth Rate Korean Re Growth Rate of GPW
1998 2001 2003 2005 2007 2009 2011
Domestic Depression from Card Corp. Crisis
IMF Crisis
World-WideDepression
2014 2019※ Source : BOK, ECOS (May 2020)

1.6 Dominant Domestic Market Position- Reduction of Personal Lines On Purpose
8
Item 2015 2016 2017 2018 2019
Korean Reins. Mkt. 6,966 7,070 7,637 7,980 8,892
Korean Re’s GPW 4,266 4,397 4,675 4,769 5,110
Korean Re M/S 61.2% 62.2% 61.2% 59.8% 57.5%
Commercial 49.0% 52.1% 50.8% 49.3% 48.8%
Personal 80.1% 75.9% 74.4% 71.7% 66.6%
(Unit : KRW Bil.)
4,266 4,397 4,675 4,769 5,110
61.2% 62.2% 61.2% 59.8%57.5%
49.0%52.1% 50.8% 49.3% 48.8%
80.1%75.9% 74.4%
71.7%66.6%
0
5,000
10,000
2015 2016 2017 2018 2019
0%
20%
40%
60%
80%
KR Domestic GPW KR's Total M/S
Commercial M/S Personal M/S(Unit : KRW Bil.)
■ Dominant position in Korean non-life reinsurance market
- Korean Re’s domestic GPW shows a stable growth (5 year average : 4.8%)
- Expect to maintain a dominant position M/S larger than 50%
- Reduction of Personal M/S for the recent years
∙ Set a limit of growth in personal lines to improve profitability based on portfolio modification
∙ Thoroughly selective underwriting of high-risk products (ex. dementia, dental and pets)
∙ Some of underperforming businesses in commercial lines are reduced for quality control

1.7 Underwriting Portfolio Distribution
9
■ The commercial and overseas comprises 52.5% of the total portfolio
- More volatile underwriting result but with thick profit margin than primary insurers
■ Further diversification has been brought into the business portfolio by the expansion of the overseas portion
⇒ Overseas : [FY’10] 18.2% (KRW 827 Bil.) → [FY’19] 24.9% (KRW 2,001 Bil.)
■ The portfolio of personal lines, which has a low possibility of major loss,
comprises 47.5% of the total portfolio
Commercial : 27.6%
Overseas : 24.9% Personal : 47.5%
- Long Term : 28.5%
- Life : 11.6%
- Motor : 7.4%
Motor : 21.0%
Commercial : 11.8%
Long Term : 67.3%
[ Korean Re ] [ Korean non-life market ]
■ GPW Portion by Line of Business
* As at FY 2019 * As at FY 2019

AGENDA
1 >> Korean Re Profile
2 >> Financial Highlights
3 >> Insurance Operation Performance
4 >> Investment Operation Performance
5 >> Dividend Performance
2.1 Business Results
11
1,500
3,000
4,500
6,000
7,500
9,000
0
50
100
150
200
250
300
'09 '11 '13 '15 '17 '19
Net Profit Gross Premium
(Unit : KRW Bil.)
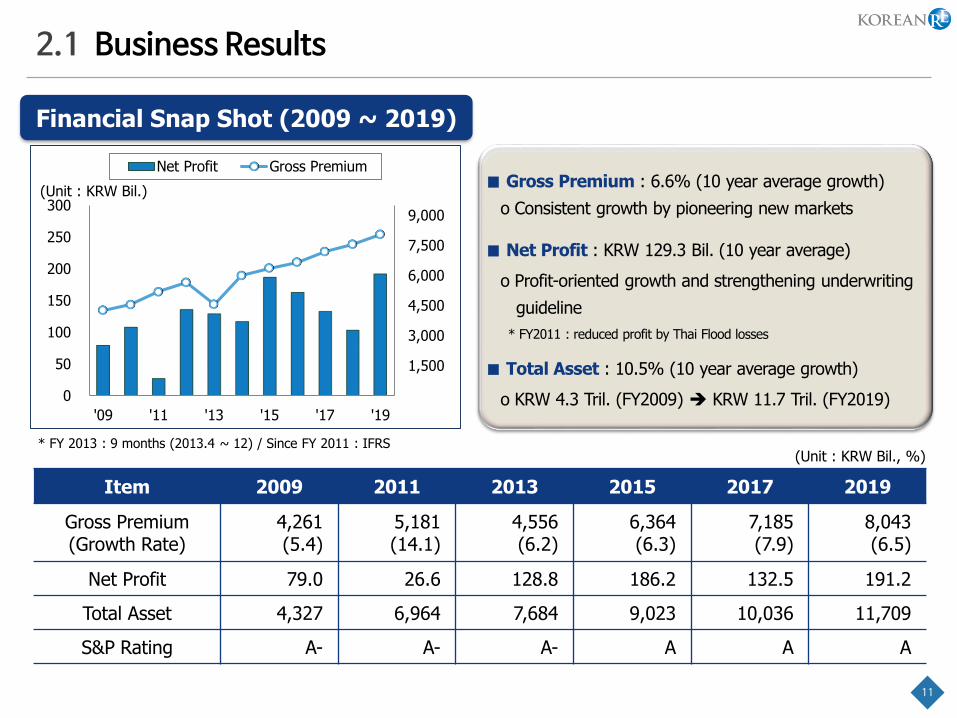
Item 2009 2011 2013 2015 2017 2019
Gross Premium(Growth Rate)
4,261(5.4)
5,181(14.1)
4,556(6.2)
6,364(6.3)
7,185(7.9)
8,043(6.5)
Net Profit 79.0 26.6 128.8 186.2 132.5 191.2
Total Asset 4,327 6,964 7,684 9,023 10,036 11,709
S&P Rating A- A- A- A A A
Financial Snap Shot (2009 ~ 2019)
(Unit : KRW Bil., %)* FY 2013 : 9 months (2013.4 ~ 12) / Since FY 2011 : IFRS
■ Gross Premium : 6.6% (10 year average growth)
o Consistent growth by pioneering new markets
■ Net Profit : KRW 129.3 Bil. (10 year average)
o Profit-oriented growth and strengthening underwriting
guideline
* FY2011 : reduced profit by Thai Flood losses
■ Total Asset : 10.5% (10 year average growth)
o KRW 4.3 Tril. (FY2009) KRW 11.7 Tril. (FY2019)

2.2 Financial Highlights as of June 2020
12
(Unit : KRW Bil., %, %p)
※ Excluding foreign currency evaluation effect : underwriting income, investment income, combined ratio, loss ratio
※ 5.2% increase YoY for net income as if basis excluding one-off effect of profit gains from ‘Koramco Reits and Trust’ last year
Classification FY 2019 2019.6 2020.6YoY change
Amount Rate
Gross Premiums 8,043.4 3,998.5 4,180.5 182.1 4.6
Net Premiums 5,527.0 2,725.2 2,829.4 104.2 3.8
Underwriting Income -4.2 39.7 22.6 -17.1 -
Combined Ratio 100.0 98.2 98.8 - 0.6
- Loss Ratio 85.6 84.7 86.0 - 1.3
- Expense Ratio 14.4 13.5 12.8 - -0.7
Investment Income 235.8 122.7 125.0 2.3 1.9
Operating Income 238.7 161.2 150.6 -10.6 -6.6
Net Income 191.2 132.6 1,182 -14.5 -10.8
Operating Assets 6,220.7 6,003.7 6,307.4 303.7 5.1
Total Assets 11,708.7 11,113.8 12,429.8 1,316.0 11.8
Shareholder’s Equity 2,461.1 2,357.2 2,466.1 108.8 4.6
Return on Equity(ROE) 8.1 11.5 9.6 - -1.9

2.3 Financial Highlights by business lines
13
Overseas
5 year averageCombined Ratio
Commercial Personal
93.1%
100.1% 100.5%
5 year CAGR Gross Premiums
Commercial Personal Overseas
1.7%
7.4%
9.5%
■ Gross Premiums : +4.6%
92.9% 100.0% 96.8%90.4% 99.4% 98.4%91.0%
101.0%95.3%98.8% 100.5%
94.8%
Commercial Personal Overseas
1,202
1,879
917
1,269
1,905
1,006
Commercial Personal Overseas
2019.6 2020.6
9.7%1.4%
■ Combined Ratio : 98.2% → 98.8% (0.6%p↑)
(Unit : KRW Bil.)
※ Personal : Lower growth aiming at profitable P/F mix by reduction of unfavorable business lines
5.6%
0.5%p7.8%p
※ Commercial : Higher C/R due to a increase of large losses in property and hull insurance
0.5%p

2.4 Stable RBC Ratio
14
■ Strong local solvency ratio
- Despite continuously tightened regulations, we have maintained our RBC ratio well above 200%
236.9%
222.2% 221.1%211.5%
217.8%211.7%
150%
170%
190%
210%
230%
250%
2015 2016 2017 2018 2019 2020.6
RBC Ratio
Item 2015 2016 2017 2018 2019 2020.6
Solvency Capital
Risk Based Capital
2,158.8
911.3
2,283.4
1,027.5
2,375.9
1,074.8
2,480.2
1,172.9
2,695.8
1,238.0
2,757.6
1,302.5
RBC ratio 236.9 222.2 221.1 211.5 217.8 211.7
(Unit : KRW Bil., %)
※ RBC ratio in 2016 decreased mainly due to ① unrealized loss on available for sale assets (the rise of interest rates),
② tightened RBC regulation regarding credit risk, and ③ change from separate to consolidated financial results basis
(Government Minimum Requirement : 100% / Recommendation : 150%)

AGENDA
1 >> Korean Re Profile
2 >> Financial Highlights
3 >> Insurance Operation Performance
4 >> Investment Operation Performance
5 >> Dividend Performance

3.1 Overall Results
16
91.8 93.1
90.9
96.4
93.2
98.8 99.1
99.9 99.6
99.5
102.0
100.5
97.0
100.7 100.3
104.6
99.1
94.8
97.3 98.8 98.3
100.5 100.0
98.8
85.0
90.0
95.0
100.0
105.0
110.0
'15 '16 '17 '18 '19 '20.6
Commerical Personal Overseas Total
Item 2015 2016 2017 2018 2019 2020.6
Commercial
Personal
Overseas
91.8
99.1
97.0
93.1
99.9
100.7
90.9
99.6
100.3
96.4
99.5
104.6
93.2
102.0
99.1
98.8
100.5
94.8
Combined Ratio 97.3 98.8 98.3 100.5 100.0 98.8
- Loss Ratio
- Expense Ratio
80.3
17.0
81.4
17.4
80.0
18.3
83.4
17.1
85.6
14.4
86.0
12.8
※ Excluding foreign currency evaluation effect
■ Treaty structure mitigating volatility : Effective sliding scale, profit commission & loss sensitive T&C
■ Diversified portfolio (FY2019) : Commercial 28%; Long-term 28%; Overseas 25%; Life 12% and Motor 7%
■ Effective risk optimization per risk & event : Adequate retention with XOL cover by LOB
※ Overseas Major Loss Events- FY2016 : Increase of O/S loss and IBNR regarding Korean Insurance Companies’ US Branch Treaties- FY2017 : US Hurricanes (Harvey, Irma, Maria), Hongkong Typhoon, Vietnam Typhoon, China Flood - FY2018 : Typhoons in Asia (Jebi, Trami, Mangkhut), Increase of a number of sizable losses from engineering side- FY2019 : Typhoons in Asia (Faxai, Hagibis)
(%)(Unit : %)
[Combined Ratio]

3.2 Post Thai Flood Measures
17
Reduction of Aggregate Risk
Increase of Main Excess of Loss Limit
China : USD 100m (UY2011) → USD 240m (UY2020)
4 Countries : USD 50m ~ 90m (UY2011) → USD 200m ~ 240m (UY2020)
Worldwide : USD 50m (UY2011) → USD 140m (UY2020)
Mitigation of retained losses with Aggregate XOL effectively as protection against frequent severe CAT events
Heightened Awareness of Possible CAT Regions Worldwide
Meticulous assessment and control of risk accumulation for each and every country
Continuous risk survey on potential CAT risk countries
Q/S treaties on North America (30.5%), Latin America (13.0%), Middle East (5.0%) accounts
Q/S treaty on facultative accounts (25.0%)
Reduction of P/F which cover high CAT risk-prone countries
-Selective renewal in high risk regions (China, Australia, Middle east, etc.)

3.3 Overseas Portfolio by Business Line
18
■ Establishing well-balanced and profit-oriented overseas portfolio
- Further diversification of P/F by lines of business for securing stable foundation of earnings
- Reduction of underperforming accounts and improvement of reinsurance condition
- Increase the volume of the profitable lines such as life, casualty & motorwith a decrease of dependency on unprofitable marine line
- Expanding more profitable non-proportional treaty accounts in property line
Line of biz 2014 2015 2016 2017 2018 2019
Fire & Engineering 49.5% 44.9% 44.8% 44.0% 45.2% 43.7%
Marine 16.0% 15.7% 14.1% 12.5% 9.4% 8.1%
Life 19.8% 19.3% 19.2% 20.4% 21.8% 23.0%
Casualty 11.1% 13.5% 14.8% 12.8% 12.1% 13.8%
Motor 2.7% 4.4% 3.5% 4.5% 5.5% 5.7%
Others* 0.8% 2.2% 3.6% 5.8% 6.0% 5.7%
Total 100.0% 100.0% 100.0% 100.0% 100.0% 100.0%
(Unit : %)
* Others : Crop, Livestock etc.
■ Overseas P/F Change

3.4 Overseas Portfolio by Region
19
■ Overseas P/F Change
■ Mainly based on Asian business in which Korean Re has know-how and expertise,
but pursuing to diversify the P/F through exploring new markets outside of Asia
- Focusing on new market opportunities from profitable lines and regions
- Reducing concentration of exposure to Asia : 59.3% (2014) → 55.0% (2019)
- Continuous growth on America : 19.4% (2014) → 27.3% (2019)
Region 2014 2015 2016 2017 2018 2019
Far East Asia 37.6 36.1 31.5 30.0 33.0 30.5
Middle East Asia 15.1 12.2 11.2 12.3 11.7 13.1
South East Asia 6.6 11.2 13.9 11.7 11.2 11.4
Asia Total 59.3 59.5 56.6 54.0 55.9 55.0
North America 16.4 18.9 21.8 19.6 17.5 17.4
Latin America 3.0 2.9 3.3 6.6 7.9 9.9
America Total 19.4 21.8 25.1 26.2 25.4 27.3
Europe 15.1 13.6 14.8 15.9 15.4 14.9
Africa 1.1 0.9 0.7 0.7 0.7 0.9
Others* 5.1 4.2 2.8 3.2 2.6 1.9
Total 100.0 100.0 100.0 100.0 100.0 100.0
* Others : Retrocession & multi-territory accounts
(Unit : %)

AGENDA
1 >> Korean Re Profile
2 >> Financial Highlights
3 >> Insurance Operation Performance
4 >> Investment Operation Performance
5 >> Dividend Performance

4.1 Overall Results
21
■ The Maintenance of Stable Investment Strategy
* Excluding foreign currency evaluation effect* Investment profit in FY2017 : asset impairment loss(KRW 20.3 Bil.) was booked regarding KDB Life Ins. equity invested in FY2009
→ ROI as-if excluding the above loss : 2.8%Investment profit in FY2019 : gains from selling of Koramco Reits and Trust (KRW 26.7 Bil.)
Item 2015 2016 2017 2018 2019 2020.2Q
Investment Profit 128.9 155.5 132.9 173.4 235.8 125.0
Investment Yield 2.8% 3.1% 2.5% 3.1% 4.0% 4.0%
(Unit : KRW Bil.)
128.9 155.5
132.9 173.4
235.8
125.0
4,915 5,314
5,626 5,879
6,221 6,307
-
1,000
2,000
3,000
4,000
5,000
6,000
7,000
0
50
100
150
200
250
300
350
2015 2016 2017 2018 2019 2020.2Q
Investment Profit Operating Asset (Unit : KRW Bil.)

4.2 Investment Portfolio Result
22
(Unit : KRW Bil.)
■ Investment Profit
Classification2018 2019 2020.6
Amount Portion Amount Portion Amount Portion
Stock* 122.7 2.1% 147.1 2.4% 141.5 2.2%
Domestic Bond 1,882.4 32.0% 1,929.4 31.0% 1,629.0 25.8%
Overseas Bond 1,631.3 27.8% 1,507.0 24.2% 1,600.8 25.4%
Short Term 691.6 11.8% 800.1 12.9% 1,060.4 16.8%
Loan 902.1 15.3% 993.1 16.0% 994.6 15.8%
Alternatives* 461.3 7.8% 657.3 10.6% 695.0 11.0%
Others* 187.1 3.2% 186.4 2.9% 186.1 3.0%
Total 5,878.5 100.0% 6,220.7 100.0% 6,307.4 100.0%
Classification2018 2019 2020.6
Amount Yield Amount Yield Amount Yield
Stock 2.2 1.9% 29.2 24.2% 2.3 1.8%
Domestic Bond 57.3 3.0% 51.0 2.7% 37.2 4.3%
Overseas Bond 51.1 3.5% 78.2 5.1% 47.8 6.0%
Short Term 10.6 1.3% 8.8 1.2% 5.7 1.3%
Loan 34.4 4.6% 43.7 4.7% 22.3 4.8%
Alternatives 16.9 4.6% 26.4 4.8% 10.3 3.6%
Others 0.9 0.5% -1.5 -0.8% -0.6 -0.6%
Total 173.4 3.1% 235.8 4.0%* 125.0 4.0%
(Unit : KRW Bil.)
■ Investment Portfolio
* 2019 total yield : Record high yield of 4.0% due to profit gains of KRW 26.7Bil from selling of ‘Koramco Reits and Trust'.
* Stock : most of stock investments are related with subsidiaries and associates* Alternatives : PEF, Infra etc. / Others : Real Estate etc.
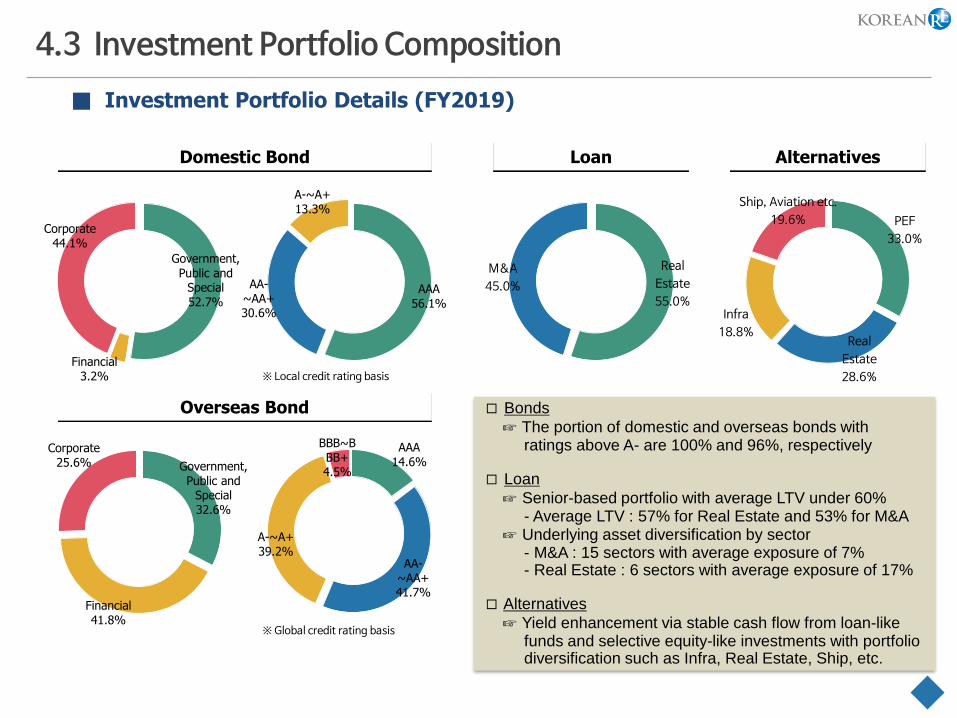
4.3 Investment Portfolio Composition
■ Investment Portfolio Details (FY2019)
Government, Public and
Special52.7%
Financial3.2%
Corporate44.1%
Domestic Bond
AAA56.1%
AA-~AA+30.6%
A-~A+13.3%
Government, Public and
Special32.6%
Financial
41.8%
Corporate25.6%
Overseas Bond
AAA14.6%
AA-~AA+41.7%
A-~A+39.2%
BBB~BBB+4.5%
Real
Estate
55.0%
M&A
45.0%
Loan
PEF
33.0%
Real
Estate
28.6%
Infra
18.8%
Ship, Aviation etc.
19.6%
Alternatives
※ Local credit rating basis
※ Global credit rating basis
□ Bonds
☞ The portion of domestic and overseas bonds withratings above A- are 100% and 96%, respectively
□ Loan
☞ Senior-based portfolio with average LTV under 60%- Average LTV : 57% for Real Estate and 53% for M&A
☞ Underlying asset diversification by sector- M&A : 15 sectors with average exposure of 7%- Real Estate : 6 sectors with average exposure of 17%
□ Alternatives
☞ Yield enhancement via stable cash flow from loan-likefunds and selective equity-like investments with portfoliodiversification such as Infra, Real Estate, Ship, etc.

AGENDA
1 >> Korean Re Profile
2 >> Financial Highlights
3 >> Insurance Operation Performance
4 >> Investment Operation Performance
5 >> Dividend Performance

5 Dividend Performance
25
■ Supporting a favorable dividend policy toward shareholders
Classification 2015 2016 2017 2018 2019
Net Income 186.2 162.5 132.5 102.7 191.2
Total Dividend Amount 40.2 37.3 34.5 31.6 57.4
Payout Ratio(%) 21.6 23.0 26.0 30.8 30.0
Dividend Per Share(KRW) 350 325 300 275 500
Dividend Yield(%) 2.5 2.8 2.7 3.1 5.3
■ In FY 2019, total dividend amount was a record high based onsignificantly increased net income with high payout ratio, which has beenlifted up to thirties percent with a gradual increase to raise shareholder value
(Unit : KRW Bil.)
Clssification 2019.122019.12~2020.2
2020.2~2020.4
2020.4~2020.5
2020.6~2020.7
2020.8~
TreasuryStock
# of Purchased - 2.5M 5.0M 2.0M 1.5M 1.6M
# of Retained 5.5M 8.0M 13.0M 15.0M 16.5M 18.1M
% of Retained 4.6% 6.6% 10.8% 12.5% 13.7% 15.0%
■ Implemented continuous share buybacks since end of 2019 up to 15.0%
Those materials and data presented here are a
mere reflection of Korean Re’s current business policy,
based upon past business experiences and market
environment research, including outside sources.
Due to this reason, accurate forecast of market movements or
tendencies is not possible, and may not bear any resemblance
to the actual statistic figures, as predicted by Korean Re.