Embed Size (px)
Citation preview
Busi
ness
Pla
n on
Coc
a-Co
la L
td. |
8/8
/201
0
Business Plan
Busi
ness
Pla
n on
Coc
a-Co
la L
td. |
8/8
/201
0
Business plan
On
Course: Introduction to Business (BUS-101)
Semester: Summer, 2010
Prepared for:
ASHRAF U BHUYAN
Lecturer
Department of Business Administration
Prepared by:
Md. Ansarul Haque 2006-1-10-150
Md. Ashiqul Ishlam 2010-2-10-105
Ms. Shumya Ahmed 2010-2-10-176
Md. Nahyan Alvi 2010-2-10-012
BUSINESS ADMINISTRATION DEPARTMENT
EAST WEST UNIVERSITY
43, Mohakhali C/A, Dhaka-1212
Submission date:
Busi
ness
Pla
n on
Coc
a-Co
la L
td. |
8/8
/201
0
08th August, 2010
DEDICATIONThis Business Plan is dedicated to our beloved parents,
Who educated me and enabled us
to reach this level.
Busi
ness
Pla
n on
Coc
a-Co
la L
td. |
8/8
/201
0
Acknowledgements
First of all we would like to thank the almighty god that we are enabling enough to do this term paper. We are very much thankful to our respective course instructor Ashraf U Bhuyan for giving us such an interesting project and proving the necessary suggestion and guidelines. This has provided us the chance of working with real life data, which helped us to acquire clear insight about the course. It was a thoroughly enjoyable experience. This Business Plan will definitely add to our practical experience and will help us in professional life.
We are grateful to our administration as they provide us with the facility to use computer lab. May be, it would have been impossible to finish the Business Plan in time if we didn’t get facility to use computer lab for our own purpose. We are acknowledging to all of those web sites from which we have taken necessary helps.
Last but not least, we are proud and feeling lucky enough to have such nice members in our group. We have a strong bonding of understanding which has made our effort successful and memorable.
Busi
ness
Pla
n on
Coc
a-Co
la L
td. |
8/8
/201
0
Executive SummaryThe Coca-Cola Company is the world's largest beverage company, largest
manufacturer, distributor and marketer of non-alcoholic beverage concentrates and syrups in the world and is one of the largest corporations in the United States. The company is best known for its flagship product Coca-Cola, invented by pharmacist John Stith Pemberton in 1886. The Coca-Cola formula and brand was bought in 1889 by Asa Candler who incorporated The Coca-Cola Company in 1892. Besides its namesake Coca-Cola beverage, Coca-Cola currently offers nearly 400 brands in over 200 countries or territories and serves 1.5 billion servings each day.
The company operates a franchised distribution system dating from 1889 where The Coca-Cola Company only produces syrup concentrate which is then sold to various bottlers throughout the world who hold an exclusive territory.
The Coca-Cola Company is headquartered in Atlanta, Georgia. Its stock is listed on the NYSE and is part of DJIA and S&P 500. Its current chairman and CEO is Muhtar Kent.
Busi
ness
Pla
n on
Coc
a-Co
la L
td. |
8/8
/201
0
Table of Contents
Content:
01. Coca Cola International
A. Summary
B. Vision
02. Management
03. Marketing
A. Market Analysis.
B. Competitive Analysis
C. SWOT Analysis
D. Strategy Planning
E. Product & Services
F. Market & Sales
04. Operation
A. Key Professionals
B. Organizational Structure
C. Human Resource Management
D. Product & Service Delivery
E. Customer & Service Support
F. Facilities
05. Financial Data
A. Company Statement
B. Profit & Loss Statement
C. Balance Sheet
D. Break Eve Analysis
Busi
ness
Pla
n on
Coc
a-Co
la L
td. |
8/8
/201
0
06. Conclusion.
01. COCA COLA INTERNATIONAL
A. SUMMARY :
Coca-Cola Enterprises, established in 1986, is a young company by the standards of the Coca-Cola system. Yet each of its franchises has a strong heritage in the traditions of Coca-Cola that is the foundation for this Company.
The Coca-Cola Company traces it’s beginning to 1886, when an Atlanta pharmacist, Dr. John Pemberton , began to produce Coca-Cola syrup for sale in fountain drinks. However the bottling business began in 1899 when two Chattanooga businessmen, Benjamin F. Thomas and Joseph B. Whitehead , secured the exclusive rights to bottle and sell Coca-Cola for most of the United States from The Coca-Cola Company.
Coca-Cola bottling system continued to operate as independent, local businesses until the early 1980s when bottling franchises began to consolidate. In 1986, The Coca-Cola Company merged some of its company-owned operations with two large ownership groups that were for sale, the John T. Lupton franchises and BCI Holding Corporation's bottling holdings, to form Coca-Cola Enterprises Inc. The Company offered its stock to the public on November 21, 1986, at a split-adjusted price of $5.50 a share. On an annual basis, total unit case sales were 880,000 in 1986.
In December 1991, a merger between Coca-Cola Enterprises and the Johnston Coca-Cola Bottling Group, Inc. (Johnston) created a larger, stronger Company, again helping accelerate bottler consolidation. As part of the merger, the senior management team of Johnston assumed responsibility for managing the Company, and began a dramatic, successful restructuring in 1992.Unit case sales had climbed to 1.4 billion, and total revenues were $5 billion
Busi
ness
Pla
n on
Coc
a-Co
la L
td. |
8/8
/201
0
B. THE VISION STATEMENT OF COCA-COLA COMPANY
Our vision statement is to maximize shareowner value over time.
In order to achieve this vision, we must create value for all the constraints we serve, including our consumers, our customers, our bottlers, and our communities. The Coca Cola Company creates value by executing comprehensive business strategy guided by six key beliefs:
1. Consumer demand drives everything we do.
2. Brand Coca Cola is the core of our business
3. We will serve consumers a broad selection of the nonalcoholic ready-to–drink beverages they want to drink through out the day.
4. We will be the best marketers in the world.
5. We will think and act locally.
6. We will lead as a model corporate citizen.
The ultimate objectives of our business strategy are to increase volume, expand our share of worldwide nonalcoholic ready to drink beverages sales, maximize our long-term cash flows, and create economic value added by improving economic profit.
The Coca Cola system has more than 16 million customers around the world that sells or serves our products directly to consumers. We keenly focus on enhancing value for these customers and helping them grow their beverage businesses. We strive to understand each customer’s business and needs, whether that customer is a sophisticated retailer in a developed market a kiosk owner in an emerging market.
There are nearly 6 million people in the world who are potential consumers of our company’s product. Ultimately, our success in achieving our vision depends on our ability to satisfy more of their beverage consumption demands and our ability to add value for customers. We achieve this when we place the right products in the right markets at the right time.
Busi
ness
Pla
n on
Coc
a-Co
la L
td. |
8/8
/201
0
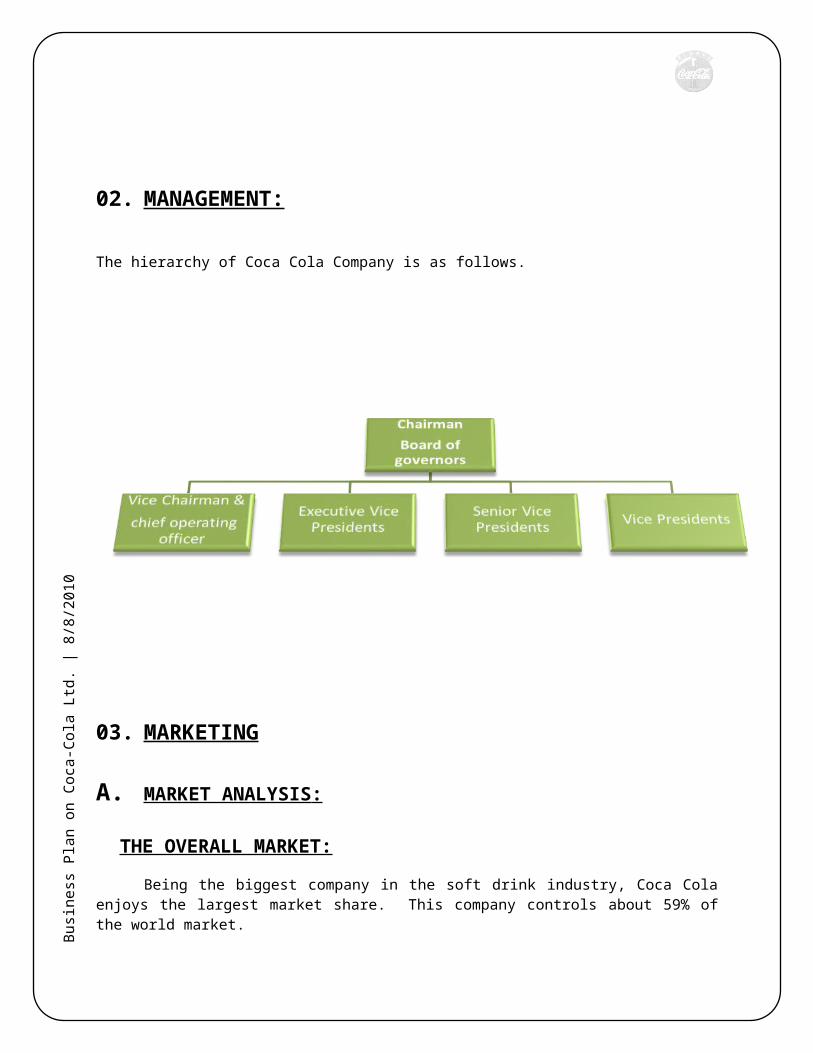
02. MANAGEMENT:
The hierarchy of Coca Cola Company is as follows.
03. MARKETING
A.MARKET ANALYSIS :
THE OVERALL MARKET:
Being the biggest company in the soft drink industry, Coca Cola enjoys the largest market share. This company controls about 59% of the world market.
Busi
ness
Pla
n on
Coc
a-Co
la L
td. |
8/8
/201
0
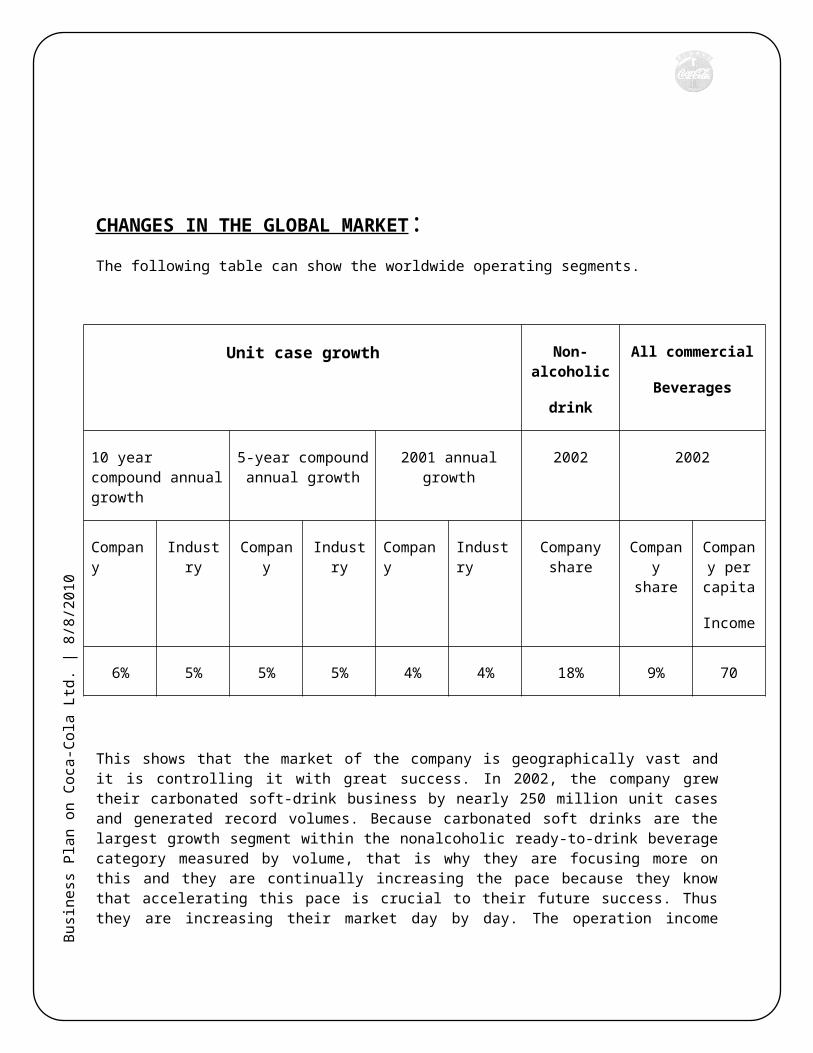
CHANGES IN THE GLOBAL MARKET:The following table can show the worldwide operating segments.
Unit case growth Non-alcoholic
drink
All commercial
Beverages
10 year compound annual growth
5-year compound annual growth
2001 annual growth 2002 2002
Company Industry Company Industry Company Industry Company share
Company share
Company per capita
Income
6% 5% 5% 5% 4% 4% 18% 9% 70
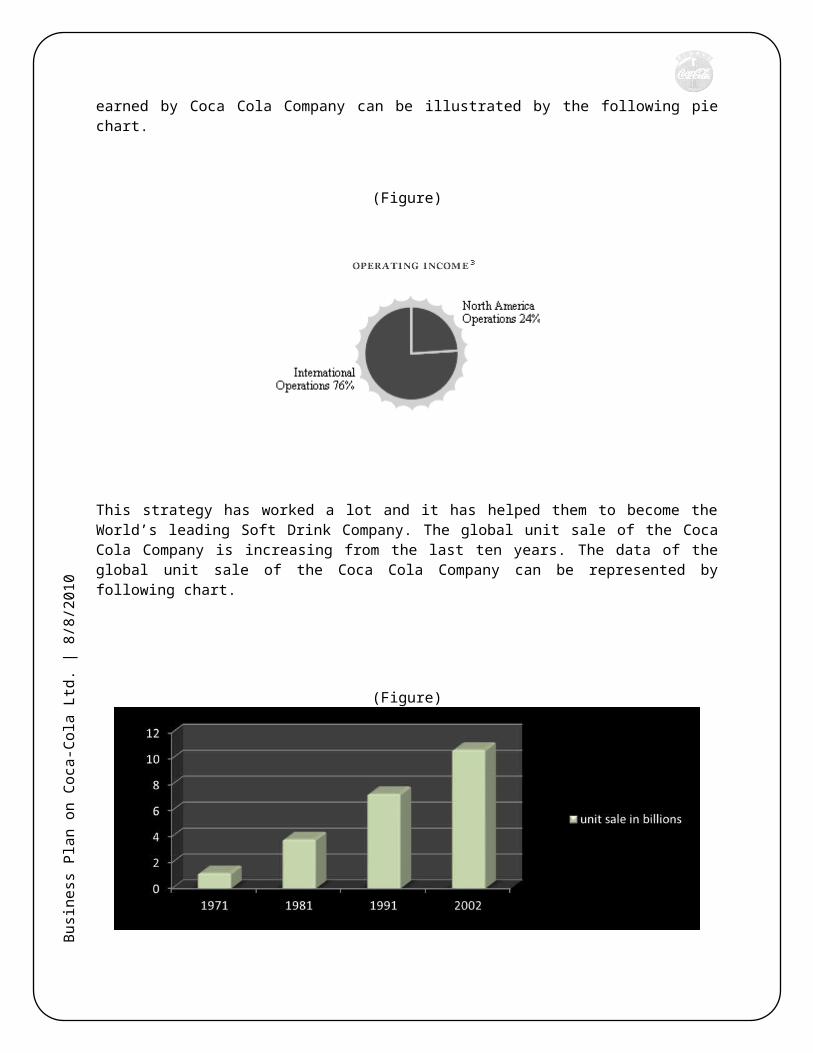
This shows that the market of the company is geographically vast and it is controlling it with great success. In 2002, the company grew their carbonated soft-drink business by nearly 250 million unit cases and generated record volumes. Because carbonated soft drinks are the largest growth segment within the nonalcoholic ready-to-drink beverage category measured by volume, that is why they are focusing more on this and they are continually increasing the pace because they know that accelerating this pace is crucial to their future success. Thus they are increasing their market day by day. The operation income earned by Coca Cola Company can be illustrated by the following pie chart.
(Figure)
Busi
ness
Pla
n on
Coc
a-Co
la L
td. |
8/8
/201
0
This strategy has worked a lot and it has helped them to become the World’s leading Soft Drink Company. The global unit sale of the Coca Cola Company is increasing from the last ten years. The data of the global unit sale of the Coca Cola Company can be represented by following chart.
(Figure)
So there is positive growth in the market of the Coca Cola Company. There is a worldwide volume increase by 4% with strong international growth of 5%. This is only due to the innovative marketing programmers, which has deepened the relationship of the customers and Coca Cola. The financial health and success of their bottling partners is a critical component of The Coca-Cola Company's ability to build and deliver leading brands.
In 2002, the company had worked with their bottlers to turn good intentions into reality by improving the system economics. The results in 2002 reflect this steadily improving and mutually constructive relationship between the Company and their bottling partners. The main reason behind this
Busi
ness
Pla
n on
Coc
a-Co
la L
td. |
8/8
/201
0
relationship is to continue realizing shared opportunities for growth, with closer coordination of operations including customer relationships, logistics and production.
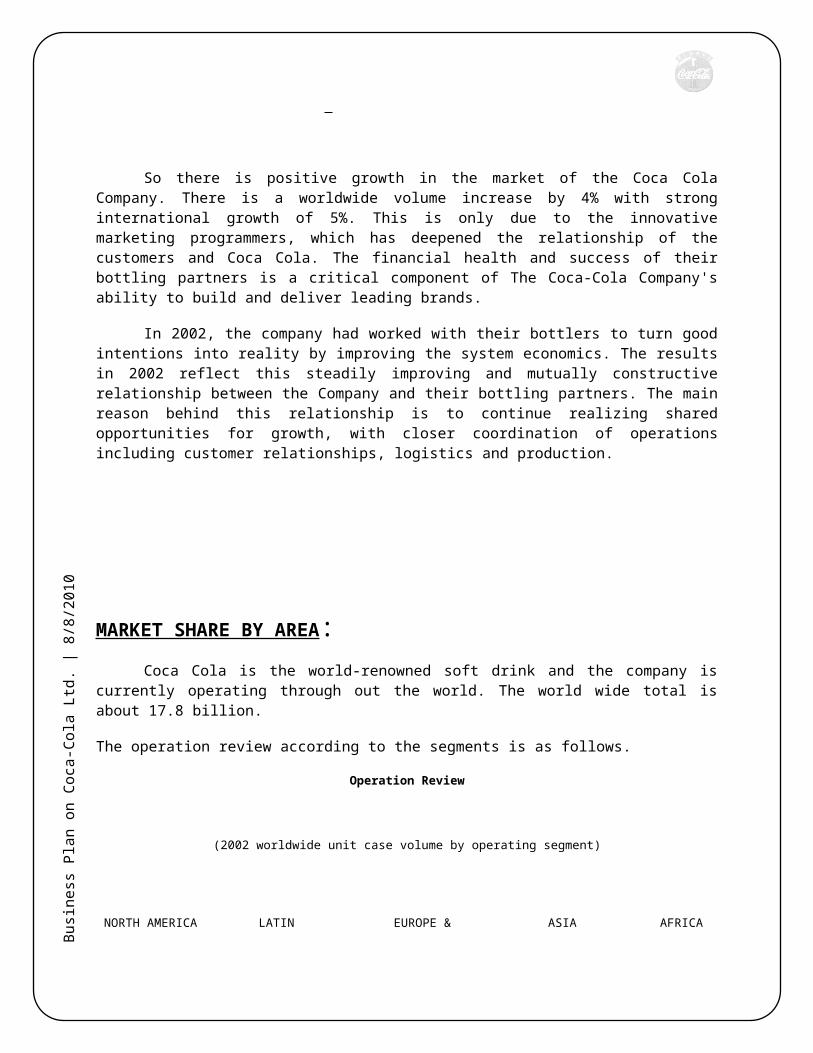
MARKET SHARE BY AREA:Coca Cola is the world-renowned soft drink and the company is currently operating through out
the world. The world wide total is about 17.8 billion.
The operation review according to the segments is as follows.
Operation Review
(2002 worldwide unit case volume by operating segment)
NORTH AMERICA LATIN
AMERICA
EUROPE &
MIDDLE EAST
ASIA AFRICA
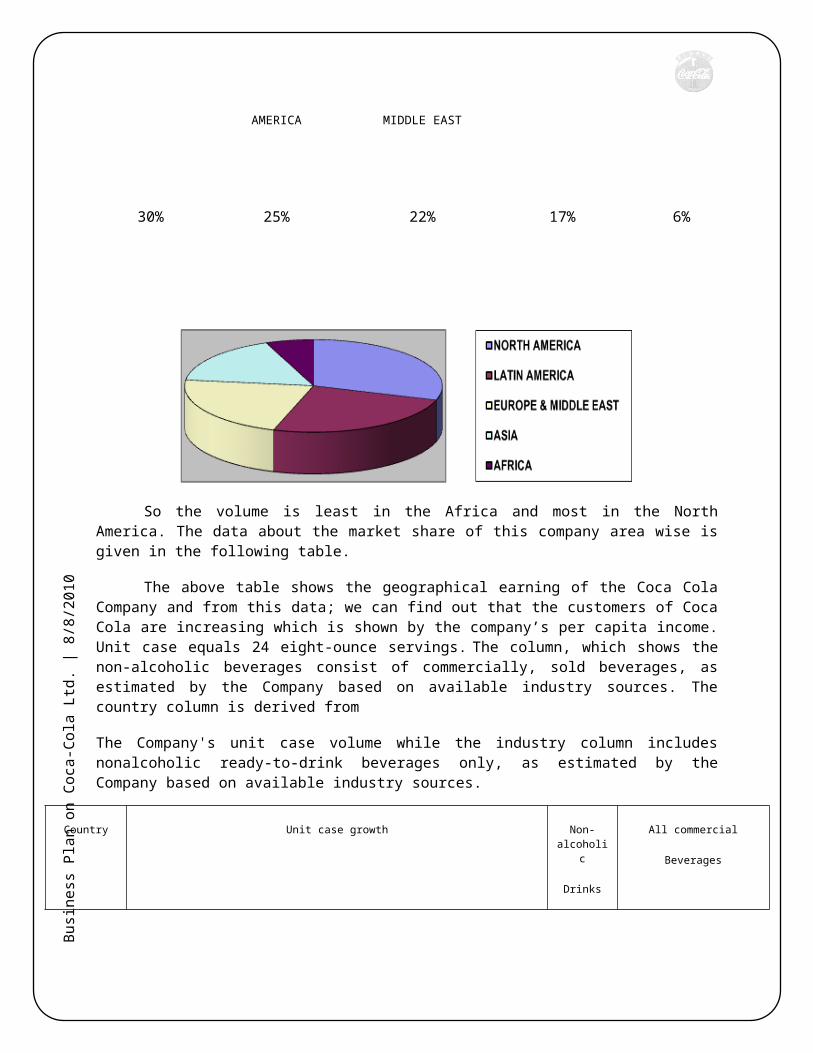
30% 25% 22% 17% 6%
Busi
ness
Pla
n on
Coc
a-Co
la L
td. |
8/8
/201
0
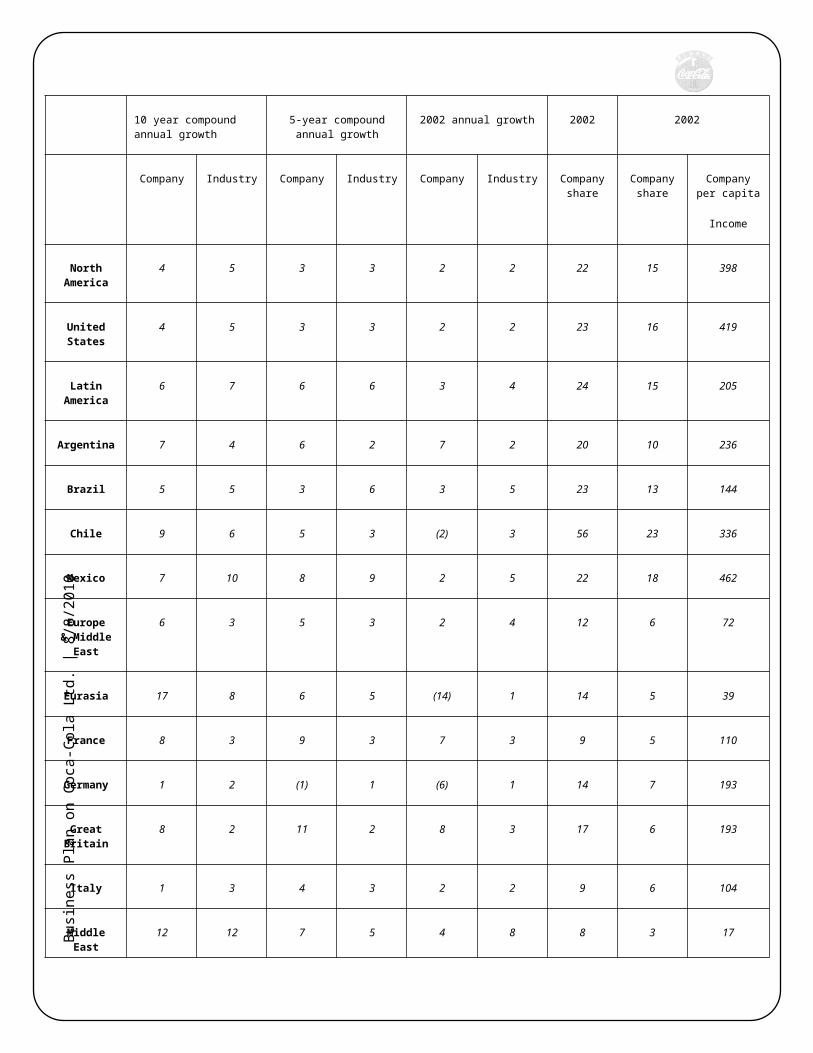
So the volume is least in the Africa and most in the North America. The data about the market share of this company area wise is given in the following table.
The above table shows the geographical earning of the Coca Cola Company and from this data; we can find out that the customers of Coca Cola are increasing which is shown by the company’s per capita income. Unit case equals 24 eight-ounce servings. The column, which shows the non-alcoholic beverages consist of commercially, sold beverages, as estimated by the Company based on available industry sources. The country column is derived from
The Company's unit case volume while the industry column includes nonalcoholic ready-to-drink beverages only, as estimated by the Company based on available industry sources.
Country Unit case growth Non-alcoholic
Drinks
All commercial
Beverages
10 year compound annual growth
5-year compound annual growth
2002 annual growth 2002 2002
Company Industry Company Industry Company Industry Company share
Company share
Company per capita
Income
North America
4 5 3 3 2 2 22 15 398
United States 4 5 3 3 2 2 23 16 419
Latin America 6 7 6 6 3 4 24 15 205
Argentina 7 4 6 2 7 2 20 10 236
Brazil 5 5 3 6 3 5 23 13 144
Chile 9 6 5 3 (2) 3 56 23 336
Mexico 7 10 8 9 2 5 22 18 462
Europe & Middle East
6 3 5 3 2 4 12 6 72
Eurasia 17 8 6 5 (14) 1 14 5 39
France 8 3 9 3 7 3 9 5 110
Busi
ness
Pla
n on
Coc
a-Co
la L
td. |
8/8
/201
0
Germany 1 2 (1) 1 (6) 1 14 7 193
Great Britain 8 2 11 2 8 3 17 6 193
Italy 1 3 4 3 2 2 9 6 104
Middle East 12 12 7 5 4 8 8 3 17
Spain 6 4 8 5 4 4 17 12 264
Asia 7 6 6 7 10 7 14 5 23
Africa 7 6 8 3 10 6 34 11 34
(Table)
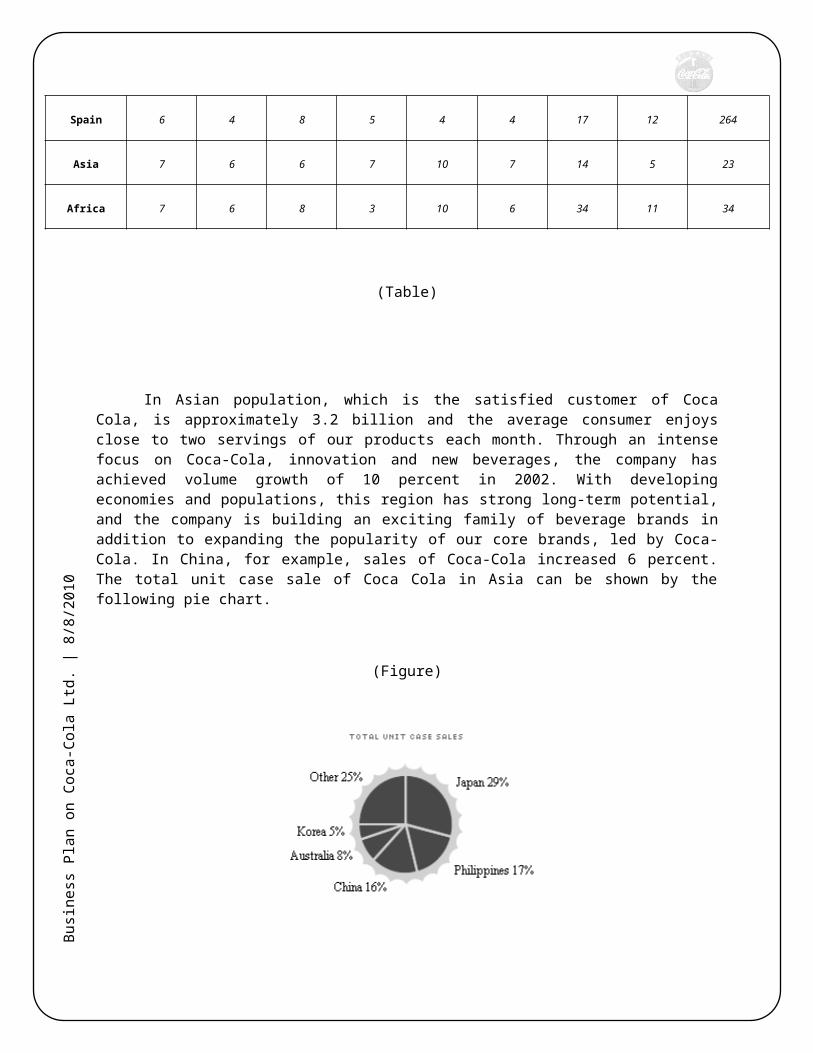
In Asian population, which is the satisfied customer of Coca Cola, is approximately 3.2 billion and the average consumer enjoys close to two servings of our products each month. Through an intense focus on Coca-Cola, innovation and new beverages, the company has achieved volume growth of 10 percent in 2002. With developing economies and populations, this region has strong long-term potential, and the company is building an exciting family of beverage brands in addition to expanding the popularity of our core brands, led by Coca-Cola. In China, for example, sales of Coca-Cola increased 6 percent. The total unit case sale of Coca Cola in Asia can be shown by the following pie chart.
(Figure)
Busi
ness
Pla
n on
Coc
a-Co
la L
td. |
8/8
/201
0
So the company is emphasizing more in this area and is trying to develop a strategy, which can increase the growth of the consumption of Coca Cola by the people of Asia. Among the countries of Asia, Japan has the highest percentage, which is about 29%. Among others, Pakistan, India and Bangladesh are those countries where the average consumption is increasing day by day.
Busi
ness
Pla
n on
Coc
a-Co
la L
td. |
8/8
/201
0
MARKET SEGMENTS:
Market segments are basically those people who take this drink daily and those areas where the demands is higher then the other areas. There are so many people who take this drink daily and those people who take weekly and those who take less often are always there as well. So, their basic segments are those people who take this drink regularly.
TARGET MARKET & CUSTOMER:
Coke’s commercials basically based on young generations, so, the young generation is the target market of Coke because they want to represent Coke with the youth and energy but they also consider about the old people they take then as a co-target market.
a) Customer Characteristics:
First of all the majority don’t care that what they are going to have. In other words, they don’t care before drinking that whether it is “Pepsi” or “coke”. They don’t actually differentiate between these two brands in order to their tastes.
b) Customer Needs:
Consumers basically drink what they get.
They believe on “WHAT COULD THEY SOLD”
Consumer’s availability in brands is basically works like
Push availability
Pull consumer’s demand.
c) Customer Buying Decision:
Majority of the customer buys what’s price is low. If Coca-Cola increase their price even 0.10 cents then their sales will decrease. Customer must go for another brand like Pepsi or else
For this reason Coca-Cola have provided their coolers and freezers in the market. They have maximum number of coolers and freezers in the market. They provide this infrastructure free of cost just to provide child coke to their customer, which they want to be purchase.
Their salesman and mechanics regularly visit all the shops where coke has its infrastructure to check that either it is in proper condition or not, if not then they immediately change or repair it.
Busi
ness
Pla
n on
Coc
a-Co
la L
td. |
8/8
/201
0
B.COMPETITIVE ANALYSIS
C OMPETITORS
Coke’s major competitor is “PEPSI” and there is no hesitation to say this because every one knows that and all the other cold drinks and water, coffee, tea is the competitors.
MAJOR COMPETITORS
Consumers firstly decide that they are going to have a soft drink. Then they compete brands with each other. Like they compete Coke with Pepsi and Sprite with 7up and team. So the major competitor of Coke is Pepsi.
When they motivate to any other brand or on Coke it’s in instinct basically that based on messages derive certain feelings.
But Coca Cola thinks in a different way, they believe that RC Cola, new coming Beverages, and all juices, even they take water and tea as their competitors.
MAJOR COMPETITOR
PEPSI INTERNATIONAL
HISTORY
PepsiCo is a world leader in convenient foods and beverages, with revenues of about $27 billion and over 143,000 employees. The company consists of the snack businesses of Frito-Lay North America and Frito-Lay International; the beverage businesses of Pepsi-Cola North America, Gatorade/Tropicana North America and PepsiCo Beverages International; and Quaker Foods North America, manufacturer and marketer of ready-to-eat cereals and other food products. PepsiCo brands are available in nearly 200 countries and territories.
Many of PepsiCo's brand names are over 100-years-old, but the corporation is relatively young. PepsiCo was founded in 1965 through the merger of Pepsi-Cola and Frito-Lay. Tropicana was acquired in 1998 and PepsiCo merged with The Quaker Oats Company, including Gatorade, in 2001.would entertain the listener with the latest musical selections rendered by violin or piano or both. The new name, “Pepsi Cola”, is derived from the two of the principle ingredients, Pepsin
Busi
ness
Pla
n on
Coc
a-Co
la L
td. |
8/8
/201
0
and Kola Nuts. It was first used on the August 28. At that time, Braham’s advertising praises his drink as “Exhilarating, invigorating, aids digestion”.
1990-2002
The advertisement of the Pepsi changes to, “You got the right one baby, Uh-Huh!” With the extensive usage of the stars in the ads, the popularity of Pepsi increase. In 1992 Pepsi-Cola formed a partnership with Thomas J. Lipton Co. Today Lipton is the biggest selling ready-to-drink tea brand in the United States. Outside the United States, Pepsi-Cola Company's soft drink operations include the business of Seven-Up International. Pepsi-Cola beverages are available in more than 190 countries and territories.
PEPSI’S PRODUCTS
Pepsi
Teem
Miranda
Pepsi Max
Pepsi Lemon
Pepsi Blue
Mountain Dew
7up
Busi
ness
Pla
n on
Coc
a-Co
la L
td. |
8/8
/201
0
SWOT Analysis:
STRENGTH
WORLD’S LEADING BRAND
Coca-Cola has strong brand recognition across the globe. The company has a leading brandvalue and a strong brand portfolio. Business-Week and Interbred, a branding consultancy, recognize. Coca-Cola as one of the leading brands in their top 100 global brands ranking in2006.The Business Week-Interbred valued Coca-Cola at $67,000 million in 2006. Coca-Colaranks well ahead of its close competitor Pepsi which has a ranking of 22 having a brand value of$12,690 million Furthermore; Coca-Cola owns a large portfolio of product brands. The companyowns four of the top five soft drink brands in the world: Coca-Cola, Diet Coke, Sprite and Fanta.Strong brands allow the company to introduce brand extensions such as Vanilla Coke, CherryCoke and Coke with Lemon. Over the years, the company has made large investments in brandpromotions. Consequently, Coca-Cola is one of the best recognized global brands. Thecompany’s strong brand value facilitates customer recall and allows Coca-Cola to penetrate newmarkets and consolidate existing ones.
LARGE SCALE OF OPERATIONS
With revenues in excess of $24 billion Coca-Cola has a large scale of operation. Coca-Cola is the largest manufacturer, distributor and marketer of nonalcoholic beverage concentrates and syrups in the world. Coco-Cola is selling trademarked beverage products since the year 1886 in the US. The company currently sells its products in more than 200 countries. Of the approximately 52 billion beverage servings of all types consumed worldwide every day, beverages bearing trademarks owned by or licensed to Coca-Cola account for more than 1.4 billion.
The company’s operations are supported by a strong infrastructure across the world. Coca-Cola owns and operates 32 principal beverage concentrates and/or syrup manufacturing plants located throughout the world. In addition, it owns or has interest in 37 operations with 95 principal beverage bottling and canning plants located outside the US. The company also owns bottled water production and still beverage facilities as well as a facility that manufactures juice concentrates. The company’s large scale of operation allows it to feed upcoming markets with relative ease and enhances its revenue generation capacity.
Busi
ness
Pla
n on
Coc
a-Co
la L
td. |
8/8
/201
0
ROBUST REVENUE GROWTH IN THREE SEGMENTS
Coca-Cola’s revenues recorded a double digit growth, in three operating segments. These three segments are Latin America, ‘East, South Asia, and Pacific Rim’ and Bottling investments.Revenues from Latin America grew by 20.4% during fiscal 2006, over 2005. During the sameperiod, revenues from ‘East, South Asia, and Pacific Rim’ grew by 10.6% while revenues from the bottling investments segment by 19.9%. Together, the three segments of Latin America, ‘East, South Asia, and Pacific Rim’ and bottling investments, accounted for 34.8% of total revenues during fiscal 2006. Robust revenues growth rates in these segments contributed to top-line growth for Coca-Cola during 2006.
WEAKNESSES
NEGATIVE PUBLICITY
The company received negative publicity in India during September 2006.The Company was accused by the Center for Science and Environment (CSE) of selling products containing pesticide residues. Coca-Cola products sold in and around the Indian national capital region contained a hazardous pesticide residue. These pesticides included chemicals which could cause cancers, damage the nervous and reproductive systems and reduce bone mineral density. Such negative publicity could adversely impact the company’s brand image and the demand for Coca-Cola products. This could also have an adverse impact on the company’s growth prospects in the international markets.
SLUGGISH PERFORMANCE IN NORTH AMERICA
Coca-Cola’s performance in North America was far from robust. North America is Coca-Cola’s core market generating about 30% of total revenues during fiscal 2006. Therefore, a strong performance in North America is important for the company.
In North America the sale of unit cases did not record any growth. Unit case retail volume in North America decreased 1% primarily due to weak sparkling beverage trends in the second half of 2006 and decline in the warehouse-delivered water and juice businesses. Moreover, the company also expects performance in North America to be weak during 2007.
Sluggish performance in North America could impact the company’s future growth prospects and prevent Coca-Cola from recording a more robust top-line growth.
Busi
ness
Pla
n on
Coc
a-Co
la L
td. |
8/8
/201
0
DECLINE IN CASH FROM OPERATING ACTIVITIES
The company’s cash flow from operating activities declined during fiscal 2006. Cash flows from operating activities decreased 7% in 2006 compared to 2005. Net cash provided by operating activities reached $5,957 million in 2006, from $6,423 million in 2005. Coca-Cola’s cash flows from operating activities in 2006 also decreased compared with 2005 as a result of a contribution of approximately $216 million to a tax-qualified trust to fund retiree medical benefits. The decrease was also the result of certain marketing accruals recorded in 2005.
Decline in cash from operating activities reduces availability of funds for the company’s investing and financing activities, which, in turn, increases the company’s exposure to debt markets and fluctuating interest rates.
OPPORTUNITIES
If Coke is considered a luxury product. Then there is the tax rate system
15% - sales tax
20% - excise duty
27% - goes to government
03% - In making Budget
After paying all these taxes coke has to pay electricity charges. We have to spend on distributions. After paying all these expenses Coke’s margin squeezed and consumers have to pay for increasing tariffs.
These are the opportunities through which we can increase the price and can get profits.
THREATS & RISKS
There are much more threats in increasing prices. Because same problem of substitute. If Coke increase the price lets say 1 rupee. Then people definitely won’t go for coke. They have the best substitute of Coke that is Pepsi. So these are the threats in increasing prices. Coke will lose the margin of its profit and can face loss.
Busi
ness
Pla
n on
Coc
a-Co
la L
td. |
8/8
/201
0
STRATEGIC PLANNING
In the year 2002, the company had a great success, as the strategy worked which resulted in making Coca Cola Company the world’s leading company. In 2001, company accomplished the crust of its strategy as
Worldwide volume increased by 4 percent with strong international growth of 5 percent and clear signs that our North American business is growing solidly and predictable.
Earnings per share grew by 82 percent, as we delivered on our commitment to create volume growth while aggressively
Return on common equity grew from 23 percent in 2000 to 38 percent this year.
Return on capital increased from 16 percent in 2000 to 27 percent in 2001.
The company has generated free cash flow of $3.1 billion, up from $2.8 billion in 2000, a clear indication of its underlying financial strength.
The strategy for the future of the company is very straightforward. The marketing strategy for the year 2002 is as follows,
Accelerate carbonated soft-drink growth, led by Coca-Cola.
Selectively broaden the family of beverage brands to drive profitable growth.
Grow system profitability and capability together with our bottling partners.
Serve customers with creativity and consistency to generate growth across all channels.
Direct investments to highest potential areas across markets.
Drive efficiency and cost-effectiveness everywhere.
Busi
ness
Pla
n on
Coc
a-Co
la L
td. |
8/8
/201
0
C.PRODUCTS:
There are different brands of the Coca Cola Company, which are currently in use through out the world. This company not only deals in the carbonated drinks but also other drinks. While launching its product, the marketing team considers the culture of the country.
MAJOR BRANDS OF COCA COLA
Coke
Sprite
Fanta
Diet coke
Coke classic
MARKET POSITIONING
PRODUCT RANGE
The total range of Coca Cola Company in Worldincludes:
Coke.
Sprite.
Fanta.
Diet Coke.
And company offers their products in different bottle sizes these include:
SSRB (standers size returnable bottle)
LRB (litter returnable bottle)
NRB (no return bottle or disposable bottle)
PET 1.5 (1.5 litter plastic bottle)
PET 2.0 (2.0 litter plastic bottle)
CAN (tin pack 330 ml)
PACKING
Busi
ness
Pla
n on
Coc
a-Co
la L
td. |
8/8
/201
0
Coca cola products are available in different packing
24 regular bottle shell
6 bottle pack for 1.5 pets
12 bottles in a pack for disposable bottle
24 cans in one pack.
EXPECTATIONS FOR THE COMING YEAR
Every thing starts from the attitude of consumer’s behavior. And the basic key to attract the consumers is to throw the “money away”.
And positive feeling felling with the brand, which they used to have Coke wants to advertise their products heavily in the coming year. And it will take the 10% of their profits. And when we take it as a global level it is $ I billion.
Coming year is the challenging year for the industry of Coke. They have to take lots of decisions that how to increase the production and where they have to spend money.
For gaining success in coming year they have to have some important things like:
1. Loyal consumers are important for company’s success.
2. Workers should be the brand centric not the promotion centric.
3. They should know how much to for the brand activities.
4. They should also know that how much to do with the promotion activities for brand...\
D. MARKETING & SALES
Busi
ness
Pla
n on
Coc
a-Co
la L
td. |
8/8
/201
0
MARKETING STRATEGY
Our local marketing strategy enables Coke to listen to all the voices around the world asking for beverages that span the entire spectrum of tastes and occasions. What people want in a beverage is a reflection of who they are, where they live, how they work and play, and how they relax and recharge. Whether you're a student in the United States enjoying a refreshing Coca-Cola, a woman in Italy taking a tea break, a child in Peru asking for a juice drink, or a couple in Korea buying bottled water after a run together, we're there for you. We are determined not only to make great drinks, but also to contribute to communities around the world through our commitments to education, health, wellness, and diversity. Coke strives to be a good neighbor, consistently shaping our business decisions to improve the quality of life in the communities in which we do business. It's a special thing to have billions of friends around the world, and we never forget it.
SALES PROMOTION ACTIVITIES
COCA-COLA CRICKET
Cricket the most sought after; watched & played game in World.the game of cricket has been owned by various brands in the industry for the promotion of their products over a period of time. It has ranged from tobacco to lubricants to communication companies to banks to airlines & lately to the beverage industry. The competition has become tougher & tougher as the time has progressed.
Coca-Cola signed a sponsorship agreement with eight of Pakistan’s National cricket players. Coca-Cola realizing the fact that cricket is a very strong element by which it can reach it consumers & masses invested in the opportunity and launched a massive campaign on mass media showing all these cricket stars endorsing & complimenting Coca-Cola brand. The Coca-Cola Company developed three TV commercials & four testimonial ads with the player & ran them on the national net work during various cricket matches. These bold steps taken by the Coca-Cola marketing unit acclaimed them many acknowledgements across the board. This campaign helped Coca-Cola to establish its association with the game & the player.
COCA-COLA CONCERTS
The TVC campaign focused on the hectic lifestyle of a pop star who found respite & relief through Coca-Cola in short moments that he had to himself during a concert. Coca-Cola’s brand
Busi
ness
Pla
n on
Coc
a-Co
la L
td. |
8/8
/201
0
positioning of providing deep down refreshment for the body, soul & mind were captured accurately in the TVC & depicted aptly how the drink completes the moment for Aurar.
COCA-COLA GO-RED
Quenching the thirst of motorist, pedestrians & passerby’s during hottest summer season, Coca-
Cola’s “GO-RED” teams went out into the cities main quadrants to “serve & refresh” on the spot with ice-cold Coca-Colas at discounted prices backed by a heavy FM announcement campaign the “GO-RED”
stall, served well to promote the Coca-Cola industry. .
COCA-COLA SHOPPING FESTIVAL
Coca-Cola hosted “The Coca-Cola Shopping Festival” Lahore’s first shopping festival, a resounding success with tempting discounts, live music, great prizes & fire works. Liberty marketing Gulberg was a hive of activity during the weeklong shopping extravaganza. The in augural event proved so popular that it is now set to become an annual fixture.
COCA-COLA PET PROMOTION
In 1996, Coca-Cola launched 1.5 liter Pet contour bottle for the first time in World. Targeting house wives & family home, Coca-Cola’s 1.5 liter Pet bottle, took the limelight & gained momentum with a campaign promoting the unique packaging and its numerous consumer benefits .A treat for the family, Coca-Cola’s PET was offered through a “price-off” promotion that said……….Go out & get some
COCA-COLA RAMZAN CAMPAIGN
A very special occasion for the people of World Ramzan saw another very special Coca-Cola’s promotion, marketing the popular 1.5 liter PET bottle & the 1 liter bottle with a super price-off promotion. The emphasis on enjoying Coca-Cola at “Iftar” with friends & family.
COCA-COLA WONDER OF THE WORLD PROMOTION
In July 2000, Coca-Cola set the stage of the grand UTC promotion. Coca-Cola went ahead with the idea of giving consumer chances to win fabulous, magical “dream vacation” to numerous “wonder destination” throughout the world on every purchase of a 250 ml RGB bottle of Coca-Cola, Sprite, & Fanta.The promotion gave consumers a chance to win free drink, a trip to PARIS, HOLLYWOOD, NEWYORK, SINGAPORE & CAIRO along with airfare & four nights free stay in these dream lands. The promotion saw avid consumer collecting Coca-Cola ‘Crown caps’ & sparked a keen response from the public , rendering an outstanding testimonial campaign in the second phase, highlighting the winners over whelmed in the magical delight of their favorite beverage Coca-Cola.
COCA-COLA & NOKIA
Busi
ness
Pla
n on
Coc
a-Co
la L
td. |
8/8
/201
0
In August 2001, the new under-the-crown promotion “Nikla Kiya?”(What have u won) was launched in collaboration with Chimera Nokia.The promotion gave consumer a chance to win thousand’s of Coca-Cola branded Nokia 3310 cellular phones on every purchase of 750ml RGB bottle of Coca-Cola ,Sprite, & Fanta.The other highlight of promotion was the “Caught Red Handed” campaign. Branded Coca-Cola with ‘caught red handed’ team in them went to Lahore & Karachi for three days, with target that anyone being caught drinking Coca-Cola will be awarded a nokia 3310 mobile phone & if someone is caught talking on a nokia mobile will win free supply of Coca-Cola. Caught red handed become a huge success among the masses as it was one to one interaction between the Coca-Cola brand & the consumers. This activity helped billed confidence and brand loyalty among core consumers.
COCA COLA TV MAZZA
The coca cola new campaign is coca cola tv mazza, it is a utc scheme in which people are getting television sets of different sizes. These days this scheme is very popular among the people.
COCA-COLA & MAC DONALD’S
Coca-Cola & key account of MC Donald’s launched the “we go together” joint promotion to reinstate amongst consumers a real sense of the affinity that, both shares globally. The promotion kicked off with pos material (Danglers, Bunting etc) displayed at all MC Donald’s restaurants along with a special offer for coke & fries.
FANTA & SPRITE LAUNCHED
In November 2000moving on to the Sprite & Fanta brands, the consumers in Worldwitnessed a soft launch in essence. The Coca-Cola Company declared the new “Non-Returnable” bottles of Sprite & Fanta as the “New, On the Go Packs” flaunting the innovative packaging convenience. Fanta & Sprite are sure to enjoy considerable success in World
DIET COKE
After the acquisition of the individual local franchise bottling facilities in 1996, the company has successfully launched its first new product, diet coke, for the first time in almost 3 years. The was linked with three fashion shows as Diet Coke is related to fashion & fitness, but the major hit was thematic fashion shows in restaurants, which are the key accounts of the company as this has been never done before in Pakistan.
Busi
ness
Pla
n on
Coc
a-Co
la L
td. |
8/8
/201
0
ADVERTISEMENT
Coca cola company use different mediums
Print media
Pos material
Tv commercial
Billboards and holdings
PRINT MEDIA
They often use print media for advertisement. They have a separate department for print media.
POS MATERIAL
Pos material mean point of sale material this includes: posters and stickers display in the stores and in different areas.
TV COMMERCIALS
As everybody know that TV is a most common entertaining medium so TV commercials is one of the most attractive way of doing advertisement. So Coca Cola Company does regular TV commercials on different channels.
BILLBOARDS AND HOLDINGS
Coca cola is very much conscious about their billboards and holdings. They have so many sites in different locations for their billboards.
DISTRIBUTION CHANNELS
Coca Cola Company makes two types of selling
Direct selling
Indirect selling
DIRECT SELLING
Busi
ness
Pla
n on
Coc
a-Co
la L
td. |
8/8
/201
0
In direct selling they supply their products in shops by using their own transports. They have almost 450 vehicles to supply their bottles. In this type of selling company have more profit margin.
INDIRECT SELLING
They have their whole sellers and agencies to cover all area. Because it is very difficult for them to cover all area of Worldby their own so they have so many whole sellers and agencies to assure their customers for availability of coca cola products.
PROMOTION STRATEGIES
GETTING SHELVES
They gets or purchase shelves in big departmental stores and display their products in that shelves in that style which show their product more clear and more attractive for the consumers.
EYE CATCHING POSITION
Salesman of the coca cola company positions their freezers and their products in eye-catching positions. Normally they keep their freezers near the entrance of the stores.
SALE PROMOTION
Company also do sponsorships with different college and school’s cafes and sponsors their sports events and other extra curriculum activities for getting market share.
UTC SCHEME
UTC mean under the crown scheme, coca cola often do this type of scheme and they offer very handy prizes in it. Like once they offer bicycles, caps, tv sets, cash prizes etc. This scheme is very much popular among children
4. Operations:
A . KEY PERSONNEL :
* E. Neville Isdell, Chairman and Chief Executive Officer
* Gary P. Fayard, Chief Financial Officer
* Jose Octavio Reyes, President of Latin America
B. ORGANIZATIONAL STRUCTURE:
Busi
ness
Pla
n on
Coc
a-Co
la L
td. |
8/8
/201
0
AVIATION – It's creating the best of the best.
The Coca-Cola Company is a truly global company, and we operate in over 200 countries around the world. From Atlanta to London to Bangkok to Santiago, our people make a difference everywhere we work. Here we have the opportunity to make a difference and create ways to connect our executives, guests and others around the world in an expeditious, safe and comfortable manner. We never stop looking for the best and the brightest.
BUSINESS/ADMINISTRATIVE SERVICES – It’s the business of running our business.
It takes thousands of people working together to keep our multi-billion dollar operation running smoothly. At The Coca-Cola Company, we know just how valuable your efforts are to our continued success. That’s why we offer opportunities that recognize your contributions and reward your efforts. Opportunities are available in Administration, Facilities Management, Presentation Graphics and Archives/Records Maintenance. If you want a career that can take you places, you’ll like what you find at The Coca-Cola Company.
BUSINESS MANAGEMENT – It’s the strategy that drives our future.
Where is the next big opportunity for The Coca-Cola Company? What will our competitors be doing next week…next year…in the next decade? Your insights and analysis will help find the answers. Here we take on big challenges and make bold plans for the future. Are you ready to share your ideas with some of the best thinkers in business? Opportunities are available in Strategic Planning and Business Development.
FINANCE - It’s a multi-billion dollar challenge.
The Finance function at The Coca-Cola Company offers challenges and opportunities that are simply world-class. We have opportunities available in Accounting, Financial Analysis, Audit, Business Development, Tax and Treasury. Regardless of your background or level of experience, this may be the perfect place to share your talent with the world.
C. HUMAN RESOURCES:
Busi
ness
Pla
n on
Coc
a-Co
la L
td. |
8/8
/201
0
The key to our success is our people. It’s been the same story from day one. At The Coca-Cola Company, we understand the importance of Human Resources, which is why we have one of the most robust departments you’ll find just about anywhere. Opportunities include Generalist, Staffing, Training, Compensation and Benefits, Organizational Development, Employee Relations and Compliance and Occupational Health. If you can keep our people out in front, we can offer you a career with endless potential.
D. PRODUCTS & DELIVERY SERVICE:
FACILITATING THE PRODUCT BY INFRASTRUCTURE:
For providing their product in good manner company has provided infrastructure these includes:
Vizi cooler
Freezers
Display racks
Free empty bottles and shells for bottles
INFORMATION TECHNOLOGY – It’s keeping The Coca-Cola Company a few steps beyond the cutting-edge.
As one of the best known brands on the planet, we know the importance of technology. That’s why we’re always thinking about what’s now and what’s next and investing in the people and the technologies that will power our company for years to come. We have opportunities in Application Development and Support, Operations, IT Architecture, Infrastructure Systems Support, Network Management, Business Systems Planning, SAP, Database Management and Technical Training. If you want your talent to make a global impact, this may be your opportunity.
INNOVATION – It’s about the next big idea.
What will be our next success story? A new product? A new packaging system? Something so new the world has never seen anything like it? At The Coca-Cola Company, your ideas will make the difference. We’re always searching for what’s next. That’s why we’re almost always ready to talk to someone like you. We have opportunities available in New Products/Services Development, Laboratory Analysis, Research & Development and
Busi
ness
Pla
n on
Coc
a-Co
la L
td. |
8/8
/201
0
SRA/Environmental. If you’re ready to make a breakthrough, this could be the break you’ve been seeking.
MANUFACTURING – It’s helping to quench the thirst of the world.
Creating some of the best selling beverages in the world takes some of the best technology around and some of the very best people in the business. At The Coca-Cola Company, our Manufacturing and Maintenance teams are beyond compare. That’s why, year after year, our beverages are enjoyed by billions of people…billions of times.
MARKETING – It’s driving the success of the one of the world’s best known brands.
The strength of our brands is tied directly to the people behind them. It’s your ideas and innovative thinking that make The Coca-Cola Company a global powerhouse. Are you ready to make your mark? We have opportunities available in Brand Management, Creative Services, Marketing Research, Advertising, Media, Category Management, Channel and Customer Marketing, Marketing Asset Management, Promotions and Merchandising/Licensing. If you have the ability, this may be your opportunity to put your talent in a multi-billion dollar spotlight.
SALES AND ACCOUNT MANAGEMENT – It’s representing The Coca-Cola Company to the world.
Millions of servings a day, billions of dollars a year. And behind every sale is someone like you. At The Coca-Cola Company, we give our people the resources they need to build long-term relationships with customers. And after more than a century of success, we have even bigger plans for the future. That’s where you come in. We have opportunities available in Account Management, Operations Management, Network Account Management and Sales Analysis/Decision Support.
SUPPLY CHAIN FUNCTION – its ensuring customers everywhere stay refreshed.
Operating a global business places tremendous demands on the supply chain. That’s why at The Coca-Cola Company, you’ll find the very best people answering the call everywhere we do business. We have opportunities available in Distribution and Logistics, Procurement, Equipment Services and Customer Service. It’s an amazing challenge, with equally amazing opportunities for top performers
TECHNICAL FUNCTION – It’s making the best even better.
Just because you’re the very best, you can’t simply stand still. At The Coca-Cola Company, we continuously strive for better ways to create our products. How can we improve our manufacturing, raw materials, packaging and more? It’s up to you. Are you up to the challenge? We have opportunities available in Engineering and Quality Assurance. Bring us your ideas and watch how far they can take you.
Busi
ness
Pla
n on
Coc
a-Co
la L
td. |
8/8
/201
0
E.Customer service : The second key element of our business imperatives is to develop each of our markets by
providing superior customer service and quality products.
In Coca-Cola Hellenic we work hard to adapt our business to the changing needs of our customers. We initiate a number of customer-specific programmed. This aims to facilitate a cross-functional approach to planning for the purpose of better aligning our organization with the way our customers do business.
The goal of this approach is to create value for our customers. Improved preparation of joint annual plans encompassing promotional planning and revenue growth initiatives, inventory management and customer-specific cooler placement strategies, are examples of what we believe will bring additional value to our customer relationships.
In serving consumers our blueprint can be summarized in four words: availability, affordability, acceptability and activation.
AVAILABILITY
We place our range of products within easy reach of consumers in the right package, in the right location, at the right time.
We focus on developing strong relationships with our customers to ensure that the right products are in stock, highly visible and readily accessible wherever and whenever consumers may desire a non-alcoholic beverage.
AFFORDABILITY
We offer a wide variety of desirable, premium quality products, in packages appropriate for the occasion, at the right price.
In doing so, we aim to reach as many consumers as possible while taking into account the differing levels of purchasing power in the countries in which we operate.
ACCEPTABILITY
We supply an extensive and growing range of products that meet the highest quality standards in each country, increasing their acceptability to consumers.
We have a detailed understanding of consumer needs and access to the most effective communications channels. Combined with our experience in quality control, customer service and efficient distribution, we are able to reach out to customers and consumers in each of our markets and meet their demands.
ACTIVATION
Busi
ness
Pla
n on
Coc
a-Co
la L
td. |
8/8
/201
0
We motivate consumers to choose our products by improving product availability and attractiveness at the point of purchase and by building brand strength in our local markets.
We achieve this in close cooperation with our customers through:
* the placement of cold drink equipment, such as coolers and vending machines
* the provision of signage and other point-of-sale materials
* the implementation of local marketing and promotional initiatives
5. FINANCIAL DATA
COMPANY STATISTICS:
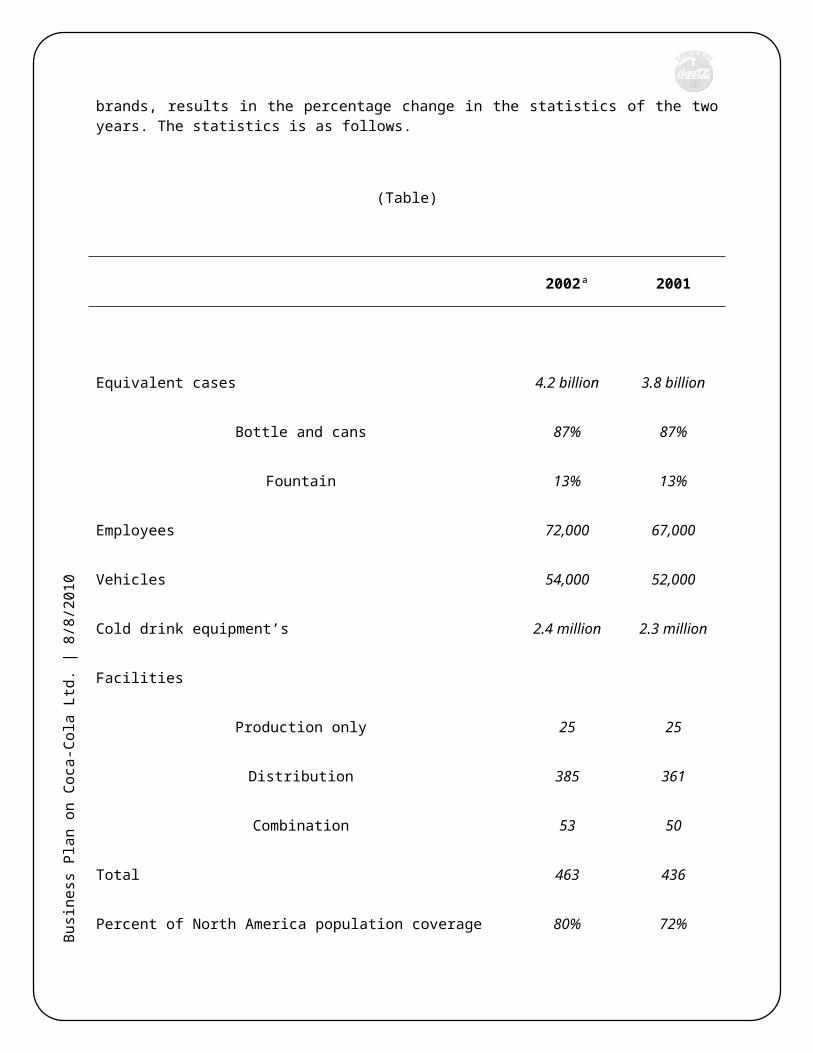
The statistics of this company is impressive. Since it is operating through out the world that is why the number of employees and the bottling equipment’s is highest among the other bottling companies. There is a constant increase in every aspect when we compare the statistics of 2001 and the statistics of 2002. This is because; Coca Cola Company is increasing its volume day by day. The expansion of this company, which shows the success of Coca Cola brands, results in the percentage change in the statistics of the two years. The statistics is as follows.
(Table)
2002ª 2001
Equivalent cases 4.2 billion 3.8 billion
Bottle and cans 87% 87%
Fountain 13% 13%
Employees 72,000 67,000
Vehicles 54,000 52,000
Busi
ness
Pla
n on
Coc
a-Co
la L
td. |
8/8
/201
0
Cold drink equipment’s 2.4 million 2.3 million
Facilities
Production only 25 25
Distribution 385 361
Combination 53 50
Total 463 436
Percent of North America population coverage 80% 72%
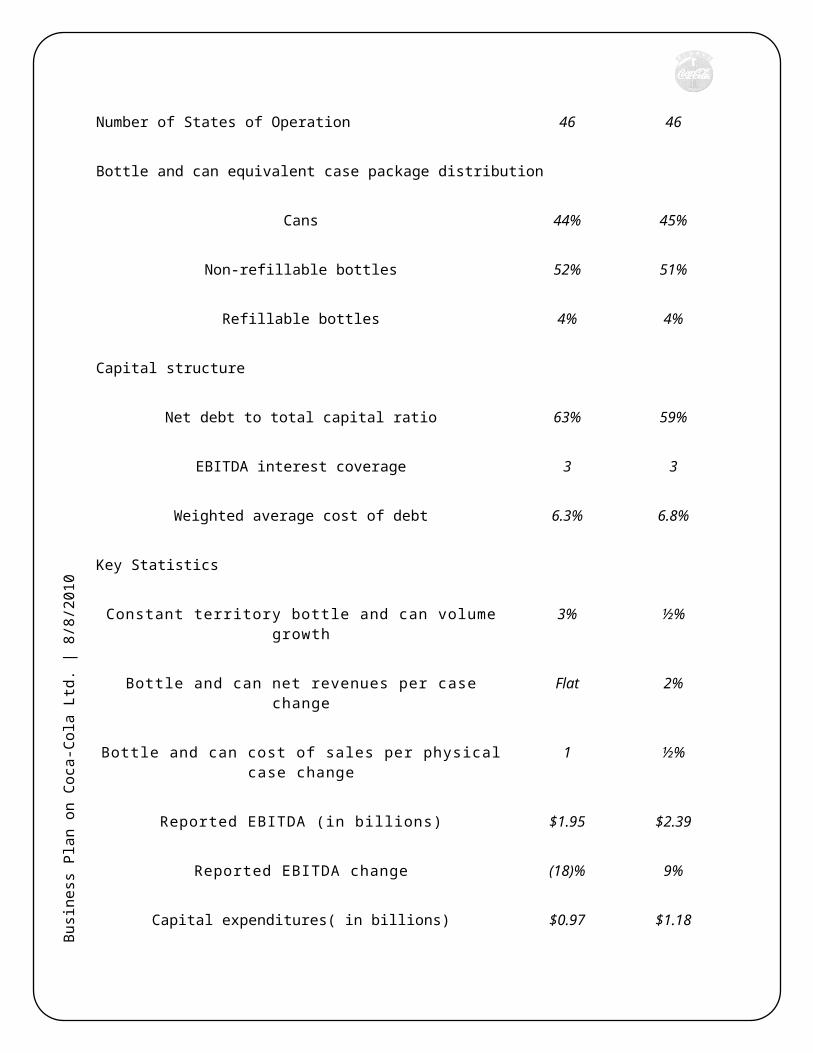
Number of States of Operation 46 46
Bottle and can equivalent case package distribution
Cans 44% 45%
Non-refillable bottles 52% 51%
Refillable bottles 4% 4%
Capital structure
Net debt to total capital ratio 63% 59%
EBITDA interest coverage 3 3
Weighted average cost of debt 6.3% 6.8%
Key Statistics
Constant territory bottle and can volume growth 3% ½%
Busi
ness
Pla
n on
Coc
a-Co
la L
td. |
8/8
/201
0
Bottle and can net revenues per case change Flat 2%
Bottle and can cost of sales per physical case change 1 ½%
Reported EBITDA (in billions) $1.95 $2.39
Reported EBITDA change (18)% 9%
Capital expenditures( in billions) $0.97 $1.18
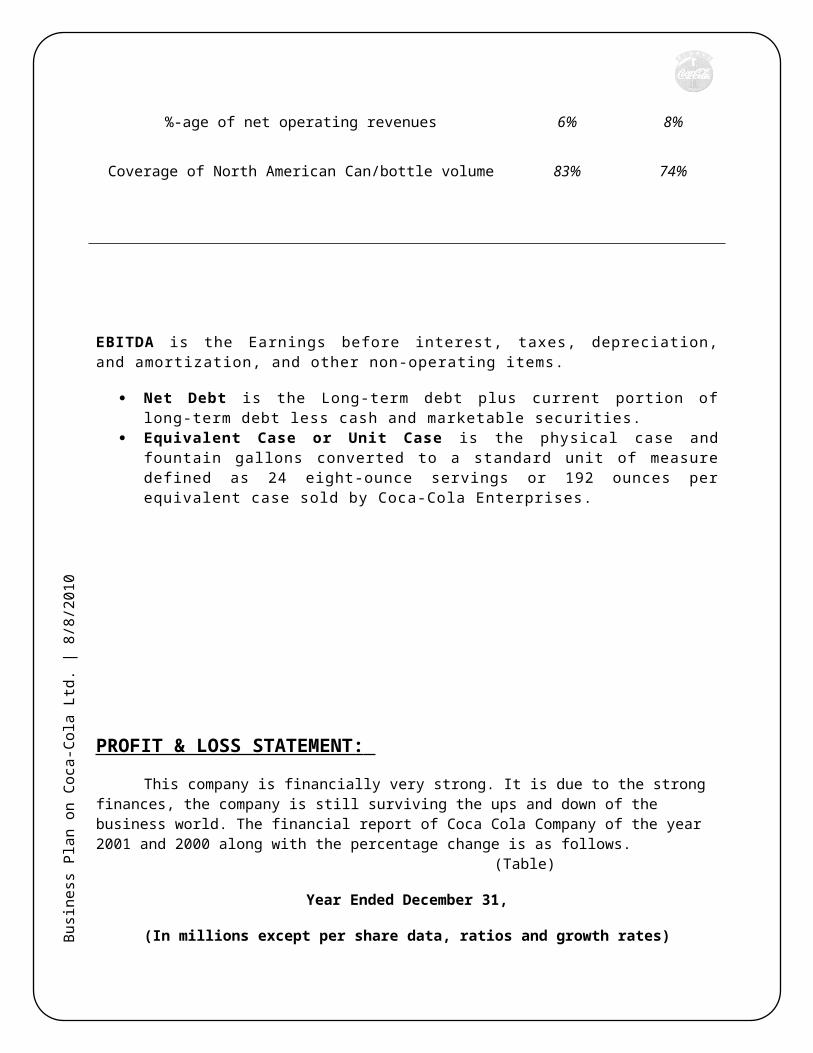
%-age of net operating revenues 6% 8%
Coverage of North American Can/bottle volume 83% 74%
EBITDA is the Earnings before interest, taxes, depreciation, and amortization, and other non-operating items.
Net Debt is the Long-term debt plus current portion of long-term debt less cash and marketable securities.
Equivalent Case or Unit Case is the physical case and fountain gallons converted to a standard unit of measure defined as 24 eight-ounce servings or 192 ounces per equivalent case sold by Coca-Cola Enterprises.
PROFIT & LOSS STATEMENT:
This company is financially very strong. It is due to the strong finances, the company is still surviving the ups and down of the business world. The financial report of Coca Cola Company of the year
Busi
ness
Pla
n on
Coc
a-Co
la L
td. |
8/8
/201
0
2001 and 2000 along with the percentage change is as follows. (Table)
Year Ended December 31,
(In millions except per share data, ratios and growth rates)
2002 2001 Percentage change
Net operating revenues 20,092 19,889 1%
Operating income 5,352 3,691 45%
Net income 3,969 2,177 82%
Net income per share (basic) 1.601 0.882 82%
Net income per share (diluted) 1.601 0.882 82%
Net cash provided by operating activities 4,110 3,585 15%
Business reinvestment (963) (779) 24%
Dividends paid (1,791) (1,685) 6%
Share repurchase activity (277) (133) 108%
Free cash flow 3,147 2,806 12%
Return on capital 26.6% 16.2% -
Return on common equity 38.5% 23.1% -
Unit case sales (in billions)
International operations 12.5 11.9 5%
Busi
ness
Pla
n on
Coc
a-Co
la L
td. |
8/8
/201
0
North America operations 5.3 5.2 2%
Worldwide 17.8 17.1 4%
2002 basic and diluted net income per share includes a non-cash gain of $.02 per share after taxes, which was recognized on the issuance of stock by Coca-Cola Enterprises Inc., one of the equity investors of this company.
2002 basic and diluted net income per share includes the following charges:
$.24 per share after income taxes related to an organizational Realignment.
$.19 per share after income taxes related to the Company's portion of charges recorded by the investors of the company.
$.16 per share after income taxes related to the impairment of certain bottling, manufacturing and intangible assets.
$.05 per share after income taxes related to the settlement terms of a discrimination lawsuit.
$.01 per share after income taxes related to incremental marketing expenses in Central Europe.
These charges are partially offset by a gain of $.05 per share after income taxes related to the merger of Coca-Cola Beverages plc. and Hellenic Bottling Company S.A. and $.04 per share after income taxes related to benefits from a tax rate reduction in Germany and from favorable tax planning strategies.
DIVIDEND AND CASH INVESTMENT PLAN:
Busi
ness
Pla
n on
Coc
a-Co
la L
td. |
8/8
/201
0
The Dividend and Cash Investment Plan permits shareowners of record to reinvest dividends from Company stock in shares of The Coca-Cola Company. The Plan provides a convenient, economical and systematic method of acquiring additional shares of our common stock. All shareowners of record are eligible to participate. Shareowners also may purchase Company stock through voluntary cash investments of up to $125,000 per year. At year-end, 76 percent of the Company's shareowners of record were participants in the Plan. In 2002, shareowners invested $36 million in dividends and $31 million in cash in the Plan
BALANCE SHEET
The Coca-Cola Company and Subsidiaries
Condensed Consolidated Balance Sheets 2009
(In millions except par value)
April 3, 2009
ASSETS
CURRENT ASSETS
Cash and cash equivalents $ 6,816
Marketable securities 263
Trade accounts receivable, less allowances 3,139
Inventories 2,298
Prepaid expenses and other assets 2,198
TOTAL CURRENT ASSETS 14,714
INVESTMENTS
Equity method investments:
Coca-Cola Hellenic Bottling Company S.A. 1,386
Coca-Cola FEMSA, S.A.B. de C.V. 840
Busi
ness
Pla
n on
Coc
a-Co
la L
td. |
8/8
/201
0
Coca-Cola Amatol Limited 680
Coca-Cola Enterprises Inc. -
Other, principally bottling companies and joint ventures 2,410
Other investments, principally bottling companies 441
TOTAL INVESTMENTS 5,757
OTHER ASSETS 1,793
PROPERTY, PLANT AND EQUIPMENT — net 8,425
TRADEMARKS WITH INDEFINITE LIVES 6,042
GOODWILL 3,988
OTHER INTANGIBLE ASSETS 2,384
TOTAL ASSETS $ 43,103
LIABILITIES AND EQUITY
CURRENT LIABILITIES
Accounts payable and accrued expenses $ 5,651
Loans and notes payable 6,701
Current maturities of long-term debt 461
Accrued income taxes 356
TOTAL CURRENT LIABILITIES 13,169
LONG-TERM DEBT 5,017
OTHER LIABILITIES 2,944
DEFERRED INCOME TAXES 865
THE COCA-COLA COMPANY SHAREOWNERS' EQUITY
Common stock, $0.25 par value; Authorized — 5,600 shares 880
Busi
ness
Pla
n on
Coc
a-Co
la L
td. |
8/8
/201
0
Capital surplus 8,021
Reinvested earnings 38,911
Accumulated other comprehensive income (loss) (2,893)
Treasury stock, at cost (24,207)
EQUITY ATTRIBUTABLE TO SHAREOWNERS OF THE COCA-COLA COMPANY 20,712
EQUITY ATTRIBUTABLE TO NONCONTROLLING INTERESTS 396
TOTAL EQUITY 21,108
TOTAL LIABILITIES AND EQUITY $ 43,103
Note:
The financial information included in this section should be read in conjunction with Management's Discussion
and Analysis of Financial Condition and Results of Operations and Notes to Consolidated Financial Statements
contained in our Company's 2009 Quarterly Report on Form 10-Q and 2008 Annual Report on Form 10-K.
BREAKEVEN ANALYSIS AT COCA-COLA COMPANY
I. THE ORGANIZATION: COCA-COLA COMPANY
Who does not know this leading beverage company? In terms of market share and brand exposure, Coca-Cola (hereinafter referred to as the Company or the Organization) has the “say”. It is a very successful organization that almost everyone knows with an asset in the preceding year reaching at least $43 billion in its 2007 consolidated financial statements. Moreover, the net worth of this company is accounted at $27 billion.
As stated in its 2007 Financial report, this beverage organization is the leading name in its line of business that manufactures, distributes and markets non-alcoholic drinks, syrups as well as concentrates. Its products bearing the Coca-Cola brand and other brand names under the organization's trademarks have
Busi
ness
Pla
n on
Coc
a-Co
la L
td. |
8/8
/201
0
been sold in the United states since 1886 and with great success, are currently being sold in more than 200 countries worldwide.
The organization was incorporated as early as 1919 under the guiding laws of the United States of America, specifically in the state of Delaware. Daily, Coca-Cola is serving 1.5 billion of non-alcoholic drinks to its thirsty customers.
The annual Financial information of the organization is available at its website, http://www.thecoca-colacompany.com. It can be specifically found at the following url: http://www.thecoca-colacompany.com/investors/pdfs/form_10K_2007.pdf)
II. ACTIVITIES OF THE ORGANIZATION:
Generally, a multi-billion dollar company such as Coca-Cola has a long list of activities. In each of its activity, no matter how small it can be in a unit basis, but since there are more than 200 countries to consider, a proper analysis must be taken into account in pursuing an activity or not. Any planned activity must be properly analyzed as to its cost versus its benefit.
One of the notable and fresh acts that the organization has decided is in its promotional activities. Last November 11, 2008 Coca-Cola has issued a press release on its partnership with the soccer superstar Memo, also known by his complete name as Francisco Guillermo Ochoa. Certainly, this move of the Organization is not a decision that took over for a single night but a long process of research and analysis if this would be of good returns to the Company. A company or an organization like Coca-Cola will not succeed to its current status if its decisions are not based on solid profitable grounds. This means that Coca-Cola realized that with Memo, it can increase its sales and turn it into profit. This is where break-even analysis comes in.
To give detail to the said decision, and to identify some needed information in making the breakeven analysis a usable tool, the following are identified:
1. Unit of measurement used for the partnership with Memo: This is the length of time the partnership lasts and the extent of activities Memo has to do such services for the Company such as autograph signing, promotions to customers and other promotional procedures in favor of the Organization and its products:
2. Revenue gained through the partnership: Estimated $48 million in sales of memorabilia and more sales of Coca-Cola branded products in Latin America are. Each promotional month is estimated to gain $4 million.
3. Variable cost of the partnership: Incremental costs for the following:
(a) customer appearance
(b) Autograph signing
Busi
ness
Pla
n on
Coc
a-Co
la L
td. |
8/8
/201
0
(c) Printed and media promotions (i.e.) $5,000 per hour of any of these activities.
(d) Production cost of the memorabilia related to Memo that are sold
(e) Production cost of the additional sales or Coca-Cola branded products resulted by the partnership with memo
4. Fixed cost for the period of partnership: the Contract of partnership for a year amounting to $15 million.
Although these are estimations, once the company recovers the $15 million fixed cost, which is the contract price with Memo and the variables costs that it would incur, Coca-Cola will be breaking even with its expense already. That means after breaking even it has to pay only per activity that it must require Memo to perform and the variable cost of the memorabilia and additional product sales. No activity, no cost to incur. Still, at the end of the year, the contract of partnership between memo and Coca-Cola proves profitable.
III. FUTURE ACTIVITIES:
Coca-Cola surely has lots of plans. One of the possible decisions that it might make, and their respective relevant and irrelevant costs are shown in the following matrix:
Possible Decisions -->
Type of Activities
Contracting every bottling activities out of the company or outsourcing them instead of bottling the products
themselves; and
Relevant activities and their costs 1. The current cost of workers' salaries and wages within the
bottling division in the Coca-Cola company's premises (estimated annual cost, $130 million)
2. The cost of direct materials in making bottles such as glasses, water, chemicals, etc. ( estimated annual cost, $63 million)
Irrelevant activities and their costs 1. Corporate main office lighting and other minor utilities
(estimated annual cost, $120 thousand)
2. Salary of the janitors who cleans the main office building (estimated annual cost, $360 thousand)
Busi
ness
Pla
n on
Coc
a-Co
la L
td. |
8/8
/201
0
The above matrix indicates the kind of costs that Coca-Cola have. The relevant costs, these will be the direct bases of decisions the Company may make and these costs will be the determining factor if the organization would go on with the plan to outsource or maintain its current activity of having the bottling department in-house.
On the other hand, the irrelevant costs are the ones that are committed by the entire organization but these costs are not in any way directly related to the issue at hand: the plan to outsource the bottling plants. However, in some cases, these irrelevant costs might be allocated in some way or another in other earning departments. Irrelevant costs are not used in the cost-volume-profit analysis or break-even analysis and eventually, not used in decision making as the name suggests, it is “irrelevant”.
IV. ALLOCATION OF INDIRECT COSTS
SFAS 151 is adopted by the Coca-Cola company in treating the costs to be allocated. Its idle capacity, freight and handling costs together with other allocable costs such as spoilage and loss from wastage in production/raw materials are deducted as period costs, which means, they are expensed outright without getting through the inventory stage.
However, in terms of production overhead, such as light, utility and other allocable overhead costs, it is allocated as part of the inventory under “normal capacity” (The Coca-Cola, 2008) of production facilities
The company has a cost of goods sold amounting to $2 billion and allocable total allocable cost is estimated at 10% of the goods sold which means it would reach up to $200 million. What is the implication of this? This means that if the cost is not allocated to the production, they would be expensed outright and would not wait until the goods are sold before they can be accounted for. But in the long run, the same amount will be generated for the bottom amount which is operating income.
Just like most of the companies, Coca-Cola uses a peanut-butter costing spreading the costs that are not directly identifiable to those products that could take these costs. It is then a production cost rather than a period cost that is outright expensed.
In a certain organization, just like Coca-Cola, there are non-earning departments and these departments are only supporting the main function of the organization. The main function is the department “working for the money” but obviously without the support, the money cannot be generated as well. Say, the finance and marketing departments are only supporting the production department. It is the production that “creates” money for the organization. But as mentioned, without the help of finance to properly manage the assets and without the marketing department making the products interesting and salable, the production department cannot do anything to earn that money. Thus, it may as well be fair to allocate the costs incurred by these support departments to the main department. In this case, allocating the cost of non-revenue generating finance and marketing to the production department that mainly generates the sales is viewed as a fair policy. However many propose the activity-based costing to be more effective because every department has a cost driver that can be considered a fairer valuation of cost for a certain cost center.
Busi
ness
Pla
n on
Coc
a-Co
la L
td. |
8/8
/201
0
V- The Use of ABC- the Activity Based Costing
As mentioned, proponents of ABC argue that this costing system is more useful. As for Coca-Cola company, many, if not all of its activities has cost drivers if they need to have a cost.
Talking back about the real situation presented in the firth part (I), the Organization partnering with Memo has many costs and cost drivers. These are the two good examples:
1. Autograph signing: the very obvious cost driver for this would be the time spent by Memo in signing the autographs of his fans while promoting the Coca-Cola products at the same time. Estimated cost of autograph signing in a year can total to 60 hours paying Memo $5,000 per hour and that would be $300,000 and this is only for autograph signing.
2. Another cost that Memo can cause the organization would be on memorabilia sales. Say, a T-shirt with his various poses endorsing Coca-Cola branded products, memo can bill Coca-Cola for it based on the volume of T-shirts printed and sold/given by the company. This means that the cost driver for this “T-Shirt with Memo's image” activity would be the number of T-shirts printed. Estimates number of T-shirts is 5 Million and Memo charges $1.50 per shirt in using his name and image and thus he is entitled 7.5 million payments from Coca-Cola.
The above situations, activities and their costs simply indicate the use of ABC depicts a more accurate result than simply spreading the costs arbitrarily on the products.
Costing a product requires a thorough examination, analysis and understanding of the company's activities. As presented, one might use cost allocation technique or activity based costing.
Busi
ness
Pla
n on
Coc
a-Co
la L
td. |
8/8
/201
0
CONCLUSION:
Coca-Cola no doubt come the heart beat of Pakistanis. Coca-Cola is one of the leaders in sponsoring the most important, thrilling events. E.g. Cricket matches concerts and many other social occasions. Event at the present they are organizing a Basant festival for which they busily organizing stuff.
END