Embed Size (px)
Citation preview

BUSINESS PLAN FOR LEMON PRODUCTION IN CALIFORNIA
by
Henry Sinanta
Agricultural Systems Management
California Polytechnic State University
San Luis Obispo, CA
2013
i
SIGNATURE PAGE
TITLE : Business Plan for Lemon Production in California
AUTHOR : Henry Sinanta
DATE SUBMITTED : June 6, 2013
Dr. Andrew Holtz
Senior Project Advisor Signature
Date
Dr. Ken Solomon
Department Head Signature
Date
ii
ACKNOWLEDGEMENTS
First, I would like to express my appreciation to my parents who have given me the
opportunity to study abroad in the United States of America.
Second, I would like to give my special thanks to my advisor, Dr. Andrew Holtz, for all
of his guidance and help in the process of completing this project.
Third, I would also like to thank Dr. Lauren Garner and Thomas Marderosian for
providing important information that helped me finish this project.
Last but not least, I would like to thank all of my friends in the BRAE department for
supporting me with my studies at Cal Poly, as well as motivating me to complete this
project on time.

iii
ABSTRACT
This project encompasses the production method for a Lemon plantation in California.
Establishing a new lemon plantation will be based on an existing Lemon plantation in
California. The main objective of this report is to serve as a guide to help make decisions
in farming operations and prepare all the factors in the production practices. The analysis
includes all of the processes necessary to implement a new lemon plantation. Even
though farm operations, production practices, cost analysis and calculations are all based
on assumptions, all of the procedures, suggestions and methods must be based on
accurate data to provide reliable information to the reader. Evaluating each process in the
plantation will require proper steps and identification of different aspects in the farming
system. In this report, each aspect will be discussed step-by-step in detail to provide
essential information in how to run a successful lemon plantation.

iv
DISCLAIMER STATEMENT
The university makes it clear that the information forwarded herewith is a project
resulting from a class assignment and has been graded and accepted only as a fulfillment
of a course requirement. Acceptance by the university does not imply technical accuracy
or reliability. Any use of the information in the report is made by the user(s) at his/her
own risk, which may include catastrophic failure of the device or infringement of patent
or copyright laws.
Therefore, the recipient and/or user of the information contained in this report agrees to
indemnify, defend and save the state its officers, agents and employees from any and all
claims and losses accruing or resulting to any person, firm, or corporation who may be
injured or damaged as a result of the use of this report.

v
TABLE OF CONTENTS
Page
SIGNATURE PAGE ........................................................................................................... i
ACKNOWLEDGEMENTS ................................................................................................ ii
ABSTRACT ....................................................................................................................... iii
DISCLAIMER STATEMENT .......................................................................................... iv
LIST OF FIGURES ......................................................................................................... viii
LIST OF TABLES .............................................................................................................. x
INTRODUCTION .............................................................................................................. 1
LITERATURE REVIEW ................................................................................................... 2
Description ...................................................................................................................... 2
Varieties .......................................................................................................................... 2
Land Preparation ............................................................................................................. 3
Planting............................................................................................................................ 3
Trees ................................................................................................................................ 4
Suckering and Pruning .................................................................................................... 4
Irrigation .......................................................................................................................... 5
Soil .................................................................................................................................. 5
Propagation...................................................................................................................... 6
Harvesting and Handling ................................................................................................. 6
Yield ................................................................................................................................ 7
Storage ............................................................................................................................. 7
Pests and Diseases ........................................................................................................... 7
Food Uses ........................................................................................................................ 8
Market Trend Analysis .................................................................................................... 8
PROCEDURE AND METHODS ..................................................................................... 10
Land and Area Selection ............................................................................................... 10
Sales Comparison Approach ......................................................................................... 10
Land Valuation .............................................................................................................. 10
Location ......................................................................................................................... 12

vi
Physical Consideration .................................................................................................. 12
Soil Type ....................................................................................................................... 13
Soil Particles .................................................................................................................. 13
Soil Texture Method...................................................................................................... 14
Soil Textures ................................................................................................................. 15
Soil pH Level ................................................................................................................ 16
pH Measuring Method .................................................................................................. 17
Orchard Layout and Design .......................................................................................... 19
1-Acre Lemon Grove Layout ........................................................................................ 20
Infrastructures and Investments .................................................................................... 21
Vehicles and Machinery ................................................................................................ 21
Land Establishment ....................................................................................................... 24
Scraping and Plowing the Soil ...................................................................................... 24
Compacting the Dirt Road............................................................................................. 27
Installing Irrigation System ........................................................................................... 27
Irrigation System Management ..................................................................................... 29
Water Application and Management............................................................................. 30
Irrigation Capital Investment and Water Cost............................................................... 31
Lemon Tree Planting ..................................................................................................... 32
Fertilizer Application .................................................................................................... 33
Frost Protection ............................................................................................................. 33
Pest Control and Management ...................................................................................... 34
Annual Pesticide Costs .................................................................................................. 34
Harvesting and Yield ..................................................................................................... 35
Processing Plants ........................................................................................................... 36
Capital Investment for Lemons Processing Line .......................................................... 39
Establishment Cost ........................................................................................................ 39
Operational Cost ............................................................................................................ 40
Overhead Cost ............................................................................................................... 41
Expected Revenue ......................................................................................................... 42
Total Revenue ............................................................................................................... 43

vii
Break-even Point ........................................................................................................... 43
Expected Profit .............................................................................................................. 44
Cash Flow for Business Operation ................................................................................ 45
Rate of Return on Business Plan ................................................................................... 48
RESULTS ......................................................................................................................... 50
DISCUSSION ................................................................................................................... 51
RECOMMENDATIONS .................................................................................................. 52
Minimize Investment Cost ............................................................................................ 52
Eliminating any Potential Threat................................................................................... 52
Processing Lemons from Other Growers ...................................................................... 52
REFERENCES ................................................................................................................. 53
APPENDICES .................................................................................................................. 54
Appendix A: Lemon Nutritional Value - Food Value per 100 g. of Edible Portion ..... 55
Appendix B: Soil Sample Test Equipment ................................................................... 56
Appendix C: Information and Location of Subject Property ........................................ 57
Appendix D: Ag. Support Building - Layout ................................................................ 59
Appendix E: Forklift HB20E ........................................................................................ 60
Appendix F: Used Pickup Truck – 2005 Ford Ranger 2WD Regular .......................... 62
Appendix G: Specification of Trail Rover 250cx ......................................................... 63
Appendix H: Irrigation System Components ................................................................ 64
Appendix I: Lemon Market Prices ................................................................................ 68
Appendix J: Senior Project Contract ............................................................................. 69

viii
LIST OF FIGURES
Page
Figure 1. Lisbon Lemon. ..................................................................................................... 2
Figure 2. Meyer Lemon. ..................................................................................................... 3
Figure 3: Lisbon Lemon Tree ............................................................................................. 4
Figure 4. U.S Lemon Production, 1990 – 2005 .................................................................. 9
Figure 5. U.S Per-capita Consumption of Lemons. ............................................................ 9
Figure 6. Location of the Subject Property. ...................................................................... 12
Figure 7. Soil Composition ............................................................................................... 13
Figure 8. Water Holding Capacity by Soil Texture. ......................................................... 13
Figure 9. Soil Texture Method. ......................................................................................... 14
Figure 10. Soil Triangle. ................................................................................................... 15
Figure 11. pH level in soil................................................................................................. 16
Figure 12. pH Paper Strips. ............................................................................................... 17
Figure 13. Dipped pH Paper Strip..................................................................................... 17
Figure 14. Nutrients Content Based on pH value. ............................................................ 18
Figure 15. Total Area of the Subject Location. ................................................................ 19
Figure 16. Orchard Layout Per-acre Basis. ....................................................................... 20
Figure 17. Mini-Forklift – 2000 Kg Rated Capacity. ....................................................... 22
Figure 18. Pickup Truck. .................................................................................................. 22
Figure 19. 230cc ATV – All Terrain Vehicles. ................................................................ 23
Figure 20. Earth Scraper. .................................................................................................. 24
Figure 21. Mini Scraper. ................................................................................................... 25
Figure 22. Detachable Scraper. ......................................................................................... 25
Figure 23. A Tractor with Detachable Scraper. ................................................................ 26
Figure 24. Detachable Hydraulic Plow for Plowing Process. ........................................... 26
Figure 25. Steamroller. ..................................................................................................... 27
Figure 26. Micro-Sprinkler. .............................................................................................. 28
Figure 27. Fertilizer Injector. ............................................................................................ 28
Figure 28. Irrigation System for Micro Sprinklers. .......................................................... 29
Figure 29. 10-HP Water Pump.......................................................................................... 29
Figure 30. Field Timer and Irrigation Controller. ............................................................. 30
Figure 31. Wind Machine – Frost Protection.................................................................... 33
Figure 32. Lemon Fruit – Phytophthora. .......................................................................... 34
Figure 33. Automated Scale. ............................................................................................. 36
Figure 34. Conveyor Line. ................................................................................................ 36
Figure 35. Dark Room. ..................................................................................................... 37
Figure 36. Dump Tank. ..................................................................................................... 37
Figure 37. Brush Bed. ....................................................................................................... 37

ix
Figure 38. Drier Conveyor. ............................................................................................... 38
Figure 39. Aweta Fruit Sorter. .......................................................................................... 38
Figure 40. Packaging Line. ............................................................................................... 38
Figure 41. Profit from Business Operation over the Years ............................................... 44
Figure 42. Investment/Operational Cost - Cash Flow Diagram ...... Error! Bookmark not
defined.
Figure 43. Overhead Cost – Cash Flow Diagram ............................................................. 45
Figure 44. Revenue – Cash Flow Diagram ....................................................................... 46
Figure 45. Cash Flow Diagram .......................................... Error! Bookmark not defined.
Figure 46. Profit – Cash Flow Diagram ............................. Error! Bookmark not defined.
Figure 47. Break-even Point on Initial Investment. ........... Error! Bookmark not defined.

x
LIST OF TABLES
Table 1. Macronutrients. ..................................................................................................... 5
Table 2. Micronutrients. ...................................................................................................... 5
Table 3. U.S Lemon Production 1990 – 2005. (USDA ERS,2007) ................................... 8
Table 4. U.S. Per-capita Consumption of Fresh Lemons. .................................................. 9
Table 5. Comparison Approach Table. ............................................................................. 11
Table 6. Soil Particles Sizes. ............................................................................................. 13
Table 7. Identifying Soil Particles Formula. ..................................................................... 15
Table 8. Total Investment on Vehicles and Machinery. ................................................... 23
Table 9. Water Application. .............................................................................................. 30
Table 10. Capital Investment for Irrigation Station. ......................................................... 31
Table 11. Total Water Cost. .............................................................................................. 31
Table 12. Lemon Trees Capital Investment. ..................................................................... 32
Table 13. Fertilizer Cost. .................................................................................................. 33
Table 14. Pesticides Total Cost per Acre / Year. .............................................................. 34
Table 15. Expected Annual Yield Per-Acre Basis. ........................................................... 35
Table 16. Total Annual Yields. ......................................................................................... 35
Table 17. Capital Investment for Lemon Processing Line. .............................................. 39
Table 18. Establishment Cost. .......................................................................................... 40
Table 19. Labor Cost per Acre. .......................................... Error! Bookmark not defined.
Table 20. Total Operational Cost per Acre (Year 1-4). ..... Error! Bookmark not defined.
Table 21. Total Operational Cost (Year 5-7). .................... Error! Bookmark not defined.
Table 22. Total Overhead Cost per Year. ......................................................................... 42
Table 23. Lemon Price for 2011-2012. ............................................................................. 42
Table 24. Total Revenue Each Year Based on FOB price. ............................................... 43
Table 25. Break-even Point Table ..................................... Error! Bookmark not defined.
Table 26. Total Profit Each Year Based on FOB price...... Error! Bookmark not defined.
Table 27. Return on Investment Over the Years................ Error! Bookmark not defined.
Table 28. Overall ROR for Business Operation ................ Error! Bookmark not defined.

1
1

1
INTRODUCTION
Over the years, the farming industry in California has been growing at unpredictable
measures and there is plenty of room for increase growth. In fact, California has been
known as the number one state in production and distribution of the food supplies in the
U.S. California has compatible weather for certain crops that allow farmers to get the
most efficient yield and productivity. Many agricultural companies are centralized in
California and will continue expanding to produce more food for the greatly increasing
population. The market prices for certain crops remain unstable depending the time of
year, as well as supply and demand. However, the fundamentals of the farming system
remain the same, and farmers are choosing the most economical crops to produce to
make the most profit. Lemons are one type of citrus crops that have fairly stable prices
along with high economic value. They can be grown efficiently and profitably in
California’s climates.
This project will show growth of the Lemon Industry in California through an economic
point of view, and all the system requirements to implement a lemon plantation. When
grown efficiently in California, a productive lemon plantation can be harvested 3 to 4
times a year. For this business plan, the production will be focused on the central coast
area of California. Based on NASS data, California is still the largest lemon producer in
the U.S; consisting of 87% of the total U.S.A. lemon production. In 2012, California
produced approximately 19.5 million bins of lemons. Total production has decreased a
little since 2008, when California produced 21 million bins of lemons.

2
LITERATURE REVIEW
Description
A mature lemon tree can grow from 10 to 20 ft. in height and usually has sharp thorns on
the end of the twigs. A healthy lemon tree will have alternate leaves, with reddish
coloring when it’s young and dark-green coloring when it is mature. Usually lemon tree
leaves have a finely toothed, long, oval shape and range in length of about .5 to 2.5
inches. The buds of the tree are reddish with white flowers and yellow antlers. The shape
of the tree and leaves might be slightly different depending on the variety of the lemons.
Nevertheless, the amazing scent of lemons can be traced on the leaves of the lemon tree.
Both fruits and leaves contain acid and oil and transmit an aromatic scent.
Varieties
There are many varieties of lemons but the most popular ones in the market today are the
Lisbon and Meyer lemons. Lisbon lemons originally came from Portugal, while Meyer
lemons are a hybrid type of lemon. Lisbon lemons have potential for more productive
growth in California, compared to the Meyer lemon. Meyer lemons are a hybrid type of
lemon that are generally harder to maintain compared to the Lisbon lemons. Also, since
Lisbon lemons cost less to grow, they are economically more efficient than Meyer
lemons. In general, people are not able to identify the differences between Lisbon and
Meyer lemons so they have the tendency to buy the cheapest ones, which are the Lisbon
lemons. The taste of Lisbon and Meyer lemons are pretty identical, however, these two
varieties can be differentiated based on their appearance. Generally, Lisbon lemons have
a smooth skin while Meyer lemons have a rough skin. Since the lemon orchard will be
located in California, Lisbon lemons will be a better subject specimen as compared to the
Meyer lemons.
Figure 1. Lisbon Lemon. (Harvesttotable, 2013)

3
ESTABLISHMENT OF CULTURAL PRACTICES AND MATERIAL INPUTS
Land Preparation
Land preparation begins by starting with new land or starting over from an existing
orchard. There will be different costs for either option. In starting over from an existing
orchard, there will be costs for pushing, stacking, burning or shredding the trees and a
hand cleanup of the area as well. After the removal process, the ground should be disked
to break up the field before it is leveled. Heavy equipment such as tractors and dozers
will be required for orchard preparation. All of the land preparation operations should be
done during the year prior to planting. This will give the soil time to renew the nutrients
that the orchard will need to survive.
Planting
Planting the orchard starts by marking tree sites before the trees are planted. To give the
trees the best chance for adaptation, they are usually planted anytime from February to
spring. Wrapping the tree can sometimes be necessary in order to protect a newly planted
tree from sunburn and sucker development. About 2% of the planted trees will not adapt
fast enough and are eventually removed from the field. If this happens, the tree will be
replaced with a new tree to maintain constant productivity per acreage.
Figure 2. Meyer Lemon. (Pleasanthouse, 2013)

4
Trees
The most common variety of lemons grown in the California is Lisbon. For a normal
operation, 110 lemon trees can be planted in one acre of land. Although the standard tree
spacing for lemon trees is 12 x 20 ft., the spacing between trees can vary depending on
the shape of the land, irrigation methods and accessibility. The typical spacing between
lemon trees is 8 to 12 ft., depending on the size of the lemon tree. If maintained well,
lemon trees can have a long production life up to about 40 years. An average lemon tree
can produce efficiently for 20 to 30 years. At that time, production yield will start to
decrease by about 5 to 10 lbs. of fruit per-acre per year.
Suckering and Pruning
Pruning is often required to maintain the tree’s growth because lemon trees can grow to
heights of about 15 feet. Suckering is also very common and necessary as it allows the
lemon tree to reach its maximum growth potential. Suckering refers to the vegetative
formation of a new stem and root system that allows the plant to regenerate tissues and
parts, either naturally or by human actions. Suckering is usually done twice during the
first year of the orchard’s existence. The suckering process is intended to increase growth
of the lemon trees and allow regeneration of certain parts of the tree. Regular light
pruning should be done from after the third year’s harvest until the tree is mature. In the
third year, some suckering could also be done during the pruning process. The pruning
process is intended to distribute the nutrients to the fruits rather than to other parts of the
tree.
Figure 3: Lisbon Lemon Tree. (Thenibble, 2013)

5
Irrigation
There are a few different types of irrigation systems that could be applied in a lemon
plantation. District water is usually delivered from a canal to the farm at a cost of $129.00
per Acre-foot, or $10.75 per acre-inch of water. The prices of water are highly variable
among districts, depending on water availability and market prices. In California, the
supply of water is very limited; therefore it might cost more than other areas in the U.S.
The irrigation costs include the water and the labor for system operation and monitoring.
Soil
Most of the soil on the central coast of California is a silt-clay soil. Lemon trees can
tolerate an infertile soil, but can be more efficiently grown in a silty-clay loam because of
its’ high water-holding capacity. To grow lemons trees, the soil pH should be between
5.5 to 6.5. If the soil is too acidic, lime must be applied to increase the pH level. The pH
itself represents the acidity of the soil. The nutrient levels in the soil vary depending on
the micro and macronutrients in the soil. The micro and macronutrients will vary
depending on the area where the trees are planted. Macronutrients are required in
relatively large amounts while micronutrients are required in relatively smaller quantities.
Micronutrient and macronutrient levels include the following:
Table 1. Macronutrients. (NCAGR, 2013)
Table 2. Micronutrients. (NCAGR, 2013)
Macronutrients mg/kg of soil
Nitrogen 15,000
Potassium 10,000
Calcium 5,000
magnesium 2,000
Phosphorus 2,000
Sulfur 1,000
Micronutrients mg/kg of soil
Chlorine 100
Iron 100
Manganese 50
Boron 20
Zinc 20
Copper 6
Molybdenum 0.1
Nickel 0.1

6
These macro and micronutrients have a crucial role in determining the fertility of the soil.
Typically soil does not possess all of these macro and micronutrients and therefore
fertilizer applications are necessary. The different types of fertilizers contain different
amounts of macro and micronutrients listed in the table above. The application of the
fertilizers will be based on the nutrients that are needed by the soil.
Propagation
Most varieties of lemons are widely grown from seed except for the Meyer lemon, which
can be easily reproduced in the nursery or by planting them directly in the grove. They
will be ready to produce fruit after 2 to 3 years. Meyer lemons also have a longer life and
will still be able to produce efficiently for over 30 years. Since they are genetically
engineered, Meyer lemon trees are generally more expensive to grow, but the sale value
is not significantly different than other varieties of lemons.
Harvesting and Handling
The marketable quality of the lemons depends on the stage at which they are picked. In
California, lemons are harvested, cured and then sold because most of the lemons will be
marketed domestically throughout the U.S. However, if the lemons are produced for the
export market, they have to be harvested as early as possible and be naturally cured
during the shipment process. In California and Florida, lemons are allowed to be left on
the tree until it reaches the maximum size before they go bad. Typically in California, the
lemons will be harvested when the fruit reaches a marketable size with at least 25% of its
juice content. During the harvesting process, the tip of the lemon must be clipped in order
to prevent fruits from damaging other fruit in the storage process.
Currently, mechanical harvesting for lemons is impossible because there is no existing
technology or machines that can harvest lemons efficiently. The lemons will damage
easily due to their thin protective skins. They are also highly prone to oil spotting, which
means they cannot be handled roughly nor picked wet. In order to get maximum yield
and life, lemons are most commonly picked during the summer from mid-July to
October.

7
Yield
Lemon yields can vary depending on the lemon tree production, location, weather
conditions, soil fertility and any other factors that can affect the fruits production.
However, typical yields of lemons in the first year average around 164 boxes of lemons
per acre. On average, each box contains 56 lbs. of lemons, which is equivalent to around
9000 lbs/acre annually, assuming the orchard is harvested 4 times in a year. The lemon
yield per acre really depends on the number of trees per acre of land and the productivity
rate of each lemon tree. It is important to note that each tree has its own productivity rate
and the amount of fruit produced will vary. Not all of the harvested lemons are
marketable because some are damaged during the washing and treatment processes and
some do not pass quality control tests.
Storage
California’s climates provide very favorable storage conditions for the newly harvested
lemon. For the curing process, most producers will usually store their lemons for 10 days.
During the first 48 hours after harvest, lemons should be stored at 60º F (15.56º C) and
95% humidity. Then they can be passed through the pre-grading process, which will
dispose the unusable fruits based on size, freshness, deformities and scarring. Storage is a
crucial step before the fruit is sent to the quality control process. Due to fact that the
lemons go through a washing process before they are stored, it is very crucial to store
them in dry conditions with low humidity to prevent molding and perishing.
Pests and Diseases
Pests and diseases can and will affect the quality of lemons and the productiveness of the
trees. Pests and diseases can slow down growth and productivity, and with poor
management, they can cause an entire tree to become unmarketable. There are many
different forms of pests and diseases that can cause serious issues in California. The most
serious arthropod in lemons in California is red scale, which is also known as Aonidiella
aurantii. Biological control and the application of pesticides is required to help prevent
these types of diseases. Another type of pest on lemon trees is rust mites, which can
seriously affect the quality of fruits. There are different types of rust mites and the most
serious one is purple rust mites. This problem can be prevented with appropriate
application of pesticide sprays. Lemons with rust mites will not have any value in the
market. Along with diseases, certain animals and rodents can cause serious issues to the
young lemon tree. Rabbits and deer often have a tendency to damage the young tree and
the surrounding irrigation system, which will affect the production efficiency of the tree.

8
Food Uses
Lisbon lemons have different uses and advantages in the food and medical industries. In
the food industries, Lisbon lemons are mainly used as ingredients for cooking. However,
slices of lemon are often served as a garnish on fish or beverages. Not only as an additive
for home cooking, lemons are also used as main ingredients in food and beverages such
as lemonade and lemon bars. Therefore, the value of lemons in the market is really stable.
The demand of lemons is also pretty stable since the lemons can be considered as a
commodity. The nutrition value on lemons can be seen in Appendix A.
Market Trend Analysis
The market for lemons in America is very stable compared to other fruit crops.
Throughout the years, the supply and price of lemons have remained constant. According
to Hayley Boriss (2011), consumption of fresh lemon per person in America in 2009 was
around 3.1 lbs. annually. Usually the demand for lemons reaches its peak during the
summer time. California is still known as the largest lemon producer in United States.
Annually, the State of California produces around 950,000 tons of lemons, which
amounted to about $400 million USD. The stable price of lemons mainly in California is
caused by the fact that lemons can be harvested 3 to 4 times a year in California, which
classifies lemons as unseasonal fruits. Lemons should be easily found in all grocery
stores, anytime throughout the year, especially in California.
Table 3. U.S Lemon Production 1990 – 2005. (USDA ERS,2007)
Year
Production
(Million
Tons)
1990 705.80
1991 710.30
1992 758.40
1993 894.50
1994 900.80
1995 822.80
1996 912.60
1997 885.40
1998 831.00
1999 677.67
2000 762.04
2001 913.53
2002 733.00
2003 930.77
2004 723.93
2005 789.25

9
0.00
1.00
2.00
3.00
4.00
5.00
1965 1970 1975 1980 1985 1990 1995 2000 2005 2010
Lbs/person
Year
U.S Per-capita Consumption of Lemons
Figure 4. U.S Lemon Production, 1990 – 2005
California produces 87% of the total lemon production shown in Figure 4. The graph
shows how stable the lemon industries have been in California, which leads to the fact
that it will keep growing throughout the years because people will not stop consuming
lemons. In fact, the consumption of lemons per-individual in America has been
increasing over the years. This increase in consumption can be seen in Table 4 below:
Table 4. U.S. Per-capita Consumption of Fresh Lemons. (USDA ERS, 2007)
Year Consumption
(lbs/person)
1970s 2.04
1980s 2.28
1990s 2.64
2000/01 3.05
2001/02 3.10
2002/03 3.30
2003/04 3.27
2004/05 3.25
2005/06 3.96
Figure 5. U.S Per-capita Consumption of Lemons.

10
PROCEDURE AND METHODS
Land and Area Selection
The very first step to begin setting up a lemon plantation is to find the right location for
the lemon orchard. Property is difficult to find in California, especially in the Central
Coast area. There are several factors that need to be considered during the process of land
selection including:
- Zoning: The main function of the selected subject location, including different
types of rights, such as water rights.
- Utilities: Access to utilities, including access to electricity and water.
- Weather and Environment: Different locations have different climates and
environmental conditions that will greatly affect the yield of the orchard.
- Cost: Different areas will have different land values, which should be taken as
a consideration before starting a plantation.
- Building Orientation: Selecting the right location and orientation based on the
building and its usage.
In order to maximize the orchard’s productivity, all of these factors need to be considered
before selecting a location for the plantation. There are several ways to determine the
value of the property. One of the most efficient ways is through the sales comparison
approach.
Sales Comparison Approach
The sales comparison approach uses a method to estimate the market value by comparing
the subject property’s characteristics to other recently sold properties. The sales
comparison approach is based on the principal of substitution, which assumes that an
informed buyer would pay no more for a property than it would cost to purchase a
property that provides equal utility.
Land Valuation
This section will conclude the process of evaluation of a potential subject of land on the
Central Coast. Four types of land sales are used to estimate the value of the subject
property’s cropland. The primary elements of comparison are date, location, size, and
productivity. Table 4 displays an excellent comparison approach, which represents the
average value of potential for the subject land as compared to properties with identical
functions and values.

11
Table 5. Comparison Approach Table.
Comparison Grid – Land Sales
Sale Number Subject 1 2 3 4
Buyer NA Martinez Hall Family Esajian J.H. Thacher
Seller NA - Warden - Ebelherr
Sale Date - 12/3/2004 8/21/2003 8/20/2004 6/17/2004
Document No. - 04-105816 03-94852 04-74050 04-52827
Location Monte Rd. O’Connor LOVR LOVR Hwy 46
County SLO SLO SLO SLO SLO
Parcel # 076-251-21 067-051-22 - - 014-101-050
Gross Acreage 27.00 143.00 200.00 117.00 52.13
Farmable Ac. 23.00 57.00 65.00 74.00 45.00
Grazing Ac. 4.00 86.00 134.00 43.00 7.13
Sale Price $1,047,000 $960,000 $1,325,000 $1,600,00 $1,326,000
Adjusted Sale
Price $1,046,000 $960,000 $1,325,000 $1,600,00 $1,326,000
Improvement
Allocation - $0 $0 $0 $178,000
Land
Farm $/Acre
Grazing $/Acre
$1,046,000
$43,584
$10,896
$960,000
$12,000
$3,210
$1,325,000
$14,000
$3,097
$1,600,00
$20,000
$2,791
$1,148,000
$25,000
$3,225
The marketable area of the subject property includes the residential and seasonal
agricultural areas of rural San Luis Bay in the County of San Luis Obispo. The property
is located seven miles from the city of San Luis Obispo and one mile from Avila Beach.
The main route for transportation from the property to the market areas is from Monte
Road straight to Highway 101.
The subject property is situated in the southern half of the County of San Luis Obispo.
This is primarily a rural and residential area that consists of both residencies and part-
time farming operations. Highway 101 is the main North-South transportation route and
serves as the most efficient way to reach the main East-West transportation routes, which
are some distance North or South of the property. The main East-West transportation
routes would be Highways 58 and 46 to the North, and Highway 166 to the South.

12
Location
Subject Location: 8630 Monte Road, San Luis Obispo, CA 93401 – San Luis Obispo
County
Figure 6. Location of the Subject Property.
Physical Consideration
The property is located near Highway 101, offering easy access to the main route of
transportation. Monte Road runs through the eastern half of the parcel and acts as a
hindrance in full utilization of the property. The eastern half of the property is on a
hillside. The western half of the property has a creek that runs through the parcel, almost
parallel to the path of Monte Road. The land is relatively flat from the West side of the
orchard to the creek.
This land has been primarily used for farming, but growing is limited due to the soil and
climatic factors of the region. The soil is moderately fertile which allows for a restricted
range of crop growth. The available section of land for crop growth is split almost
perfectly down the middle by the creek. The utilities for the property include single-phase
power from a nearby line, available water from two wells on the property, and natural
gas.

13
Soil Type
There are different types of soil including sand, silt and clay. The type of soil is
determined depending on its size of particles and its compositions. In general, soil
contains four basic components consisting of mineral particles, air, water and organic
matter. Mineral particles consist of macro and micronutrients. Organic matter can be
classified into three classes know as organisms, roots and humus. The silt clay loam is
one of the most common soils in California, and its composition is displayed in the figure
below:
Soil Particles
Aside from soil composition, each type of mineral has different particle sizes and water
holding capacity. Water holding capacity is the amount of water that can be held by a
particular soil texture, depending on its particles composition.
Table 6. Soil Particles Sizes.
Type of Mineral
Particle
Size Range
(mm)
Sand 2.0 - 0.06
Silt 0.06 - 0.002
Clay < 0.002
Figure 7. Soil Composition (Eoearth, 2010)
Figure 8. Water Holding Capacity by Soil Texture. (Soilsensor, 2011)

14
Based on the sand, silt and clay ratios, the soil can be classified into a specific textural
class. The textural class of the soil will represent the amount of water and fertility
requirements in the soil. Soil texture methods can be used to find out the ratio of sand, silt
and clay in a particular soil using the following simple method:
Soil Texture Method
Equipment
- Clear 20 oz closed container
- 10 oz of soil sample
- Distilled water
Procedure
1. Place the soil sample in the container
2. Fill the rest of the container with water
3. Shake the soil sample and water for 2 minutes until it is well-mixed
4. Let it sit for at least 24 hours to get the best results
5. After 24 hours, observe the soil particle ratios in the container
6. The bottom part will represent the sand layer. The middle will be the silt layer,
and the clay layer will be at the top.
7. Record the height of each particle to find a particle ratio of the soil sample
8. Convert the particle ratio into percentages (the total percentage = 100%)
9. Determine the texture of the soil using the soil triangle
Figure 9. Soil Texture Method. (Atlantis, 2012)

15
Once the accurate ratio of soil particles is determined, one can use the soil triangle in
Figure 10 to determine the soil texture. The ratio of sand, silt and clay should be in
percentages before converting the soil sample into its specific soil texture. The
percentage will be based on the height of each soil particle using the following formula:
Table 7. Identifying Soil Particles Formula.
Time Soil
particle
Height in
ounces (oz)
Difference
in height
(oz)
Portion in percentage
1 Minute Sand 1.5 1.5
1.5/10 oz * 100% =
15%
2 Hours Silt 7.2 5.7
5.7/10 oz * 100% =
57%
24 Hours Clay 10 2.8
2.8/10 oz * 100% =
28%
Total = 10 oz Total = 100%
Soil Textures
The results show that the soil sample has 15% sand, 57% silt, and 28% clay. After
determining the ratio of soil sample particles, the soil triangle can be used to classify the
soil texture of the soil sample. Based on the soil particle ratios and soil triangle, the soil
sample is classified as a silty clay loam texture.
Figure 10. Soil Triangle. (Soilsensor, 2011)

16
The results show that the soil sample from the subject property has a silty clay loam
texture, which is a common soil texture on the Central Coast of California. Lemon trees
can be well grown in silty clay loams due to its high infiltration rate and high water
holding capacity. To maintain this high infiltration rate, soluble gypsum needs to be
applied through the irrigation system. Other macronutrients like nitrogen, calcium and
lime might be necessary to improve the water infiltration on soil. This application should
be based on soil and water tests to improve the soil pH. Soil pH represents acidity of the
soil. The best pH level for lemon trees is between 5.5 and 6.5. The lower the pH number,
more acidic the soil will be.
Soil pH Level
The figure above shows the different pH levels in soil. The pH level of soil can be
assessed easily using the following method. This method requires a pH color table,
testing paper strips and distilled water, which are relatively cheap and can be purchased
online (Appendix B). Distilled water is required because of its distinctive characteristics
and neutral pH equal to 7.
Figure 11. pH level in soil. (Eoearth, 2010)

17
pH Measuring Method
Equipment
- Container
- Distilled Water –Soil Sample
- pH Paper Strips
- pH Color Table
Procedure
1. Pour distilled water and soil sample into container
2. Stir it constantly for a few minutes until it is well-mixed
3. Dip the edge of the pH paper strip into the mixture
4. Let it dry for 2 minutes, then compare the color of paper strip with the color table
5. The color in the paper strip will indicate the pH level of the soil
Figure 13. Dipped pH Paper Strip.
Figure 12. pH Paper Strips. (mpmschoolsupplies, 2013)

18
In the example above, the color of the paper strips indicates the pH of the soil. Based on
the pH paper strips color, the pH of the soil sample is between 5.5 and 5.75, which means
the pH level of the soil is very suitable for lemon trees.
The pH level is also a good indicator in determining the macronutrients and
micronutrients in the soil. Based on the knowledge of the macronutrients and
micronutrients already in the soil, the correct nutrients can be applied to maintain the
fertility of the soil. Typically, the soil pH will indicate the nutrients retained in the soil as
shown in the following figure:
Figure 14. Nutrients Content Based on pH value. (lawncaremastery,2013)
According to the figure above, the sample soil with a pH of around 5.75 should contain
all the macro and micronutrients needed for lemon trees. If necessary, the pH of soil can
be increased through the application of limestone (calcium carbonate). Over a longer
period of time, these nutrients can be leached out by repetitive over-irrigation. Therefore,
to maintain all the nutrients in the soil, proper fertilizer applications need to be applied
regularly.

19
Orchard Layout and Design
The orchard will be designed on the subject location shown in Figure 6. Details about the
subject property can be seen in Appendix C. According to the subject location, only 23 of
27 acres of land are farmable, and the other 4 acres are grazing land. Nevertheless, to
optimize productivity, some of the grazing land will be converted into farmable land as
well.
Figure 15. Total Area of the Subject Location.
The green box on the map represents 1 acre of farmable land. According to the map
above, the total potential farmable area including graze land is about 25 acres. The other
2 acres of grazing land will be used for an Agricultural Support Building. The lay out of
this Agricultural Support Building can be found in Appendix D.

20
1-Acre Lemon Grove Layout
The subject property will be evaluated based on per-acre basis, and therefore, every acre
will be designed like the following figure:
Figure 16. Orchard Layout Per-acre Basis.
By using a per-acre basis, it will be easier to estimate the cost analysis to implement this
lemon plantation. Therefore, the plantation can be allocated into 25 different sectors,
where each sector is equivalent to a 1-acre lemon grove. The lemon grove in the figure
above shows that there are 160 lemon trees and 140 micro-sprinklers in each sector.
The lemon trees are represented by white circles, while the black dots represent the
micro-sprinklers. To prevent overcrowded trees in each sector, there are 20-ft. distances
between rows and 20-ft. gaps between sectors. These 20-ft spaces are intended to provide
enough room for the workers to pick up fruits conveniently during the harvesting process.

21
There are also 12-ft. gaps between trees in each row to make sure that each tree has
enough room to grow. A micro-sprinkler will be placed directly inline and between two
trees to maximize its efficiency. Access roads are also available in each sector to make
sure that the orchard has enough space, allowing heavy equipment to access all areas of
the lemon grove. Paved roads are not necessary since all of the heavy machinery will be
able to handle the terrain.
Infrastructures and Investments
The main investment to start up a plantation is the farmable land itself. According to the
sales comparison approach (Table 6), the subject property is valued for $1,046,000. Aside
from the farming land, there are several infrastructures that need to be built to run a
lemon production. Generally, these infrastructures require high capital investment. The
infrastructures consist of an agriculture support building with different functions such as
processing, storage, loading areas and offices. A typical agricultural support structure will
have rolling doors to allow loading trucks and other vehicles to go in and out easily to the
facilities. An example of an agricultural support building layout can be seen in Appendix
D. The agricultural support structure is relatively large; and based on the example design
in Appendix D, the total area of the support building is approximately 7600 sq-ft.
According to a property broker in Arroyo Grande named David Norwood, the cost to
build an industrial structure from scratch in the Central Coast area is about $35/sq-ft. This
cost includes alarms, site development, labor cost and offices. Therefore, the total
estimated cost to build a 7600 sq-ft industrial structure is approximately around
$266,000.
Vehicles and Machinery
Most large-scale plantations typically consider heavy machinery like tractors and forklifts
as a part of the investment. However, it would not be economically efficient for this
lemon plantation to invest in heavy-duty vehicles or equipment because they are not
going to be operated daily. Instead, it will be more efficient to rent a heavy-duty vehicle
or tractor for a particular event like plowing, disking and making rows. On the other
hand, investing in medium sized outdoor vehicles like a mini-forklift, pickup or ATV
(All-terrain vehicle) would be convenient for the transporting process. Electrical vehicles
are preferred due to their operating cost efficiency. They are relatively cheap compared to
diesel or LPG forklifts because of the consistently increasing price of fuel. Detailed
information to purchase these vehicles is available in Appendix E.

22
Figure 17. Mini-Forklift – 2000 Kg Rated Capacity.
An investment for a mini-forklift ranges from $10,000 to $35,000 depending on its
specifications. For this project, assume the investment cost for one mini-forklift is
$22,500. This value is based on the mid-value of the retail price. ($35,000+$10,000)/2 =
$22,500. The mini-forklift will mainly be used for indoor operations in shops and
processing plant, transporting lemons from the bins to the processing machine and
loading packaged lemons to the truck for delivery.
At least one pickup truck will be necessary to transport bins of lemons from the orchard
to the processing plant. Investing in a used pickup truck should be adequate for
transporting lemons. However, to minimize maintenance cost, the truck should be in
good condition and have less than 50,000 miles.
Figure 18. Pickup Truck.
Assume the investment cost for the used pickup truck is $7,000, which is based on the car
listing in the Appendix F. The pickup truck is in good condition with less than 18,000
miles.

23
For everyday business use, a brand new ATV is expected to have a lifespan of at least of
5,000 miles without any engine problems. Therefore, to avert unnecessary maintenance
costs, a brand new ATV should be preferred and purchased over a low quality ATV. In
the long run, the accumulated repair costs will be higher for a used ATV than purchasing
a new ATV. The ATV will be mainly used to monitor the field, checking for weed
control and checking irrigation systems. For farming operations, a 230cc ATV is the most
suitable choice because most farming operations are relatively intense and require a
vehicle with reliable durability. At least 2 ATV’s should be purchased to control the
entire subject property. Moreover, an extra ATV would be convenient just in case one of
the ATV’s breaks down and needs maintenance. These ATV’s will cost around $3,300
each, which means that the total investment for 2 ATV’s would be $6,600. Detailed
specifications of the recommended ATV can be found in Appendix G.
Figure 19. 230cc ATV – All Terrain Vehicles.
Assuming there is a 10% sales tax on top of the total cost, the total investment costs on
vehicles and machinery are shown below:
Table 8. Total Investment on Vehicles and Machinery.
Vehicle Class Quantity Price($)/Unit Total Price
+10%
Tax
Mini Forklift 1 $22,500 $22,500 $24,750.0
Pickup Truck 1 $7,000 $7,000 $7,700.0
ATV 2 $3,300 $6,600 $7,260.0
Total Investment = $39,710.0

24
Land Establishment
The very first step in establishing an orchard is to make sure to remove all of the existing
obstacles and objects on the subject property. If there is already a crop on the subject
property, it has to be completely removed before starting up the land preparation.
According to the map of the subject property in Appendix C, there is no indication of an
existing crop or orchard on the land. However, there are several obstacles that are visible
on the map, including trees and old houses. Therefore, the area has to be cleaned up
before the lemon orchard can be established in the subject property. Authorization from
the city ordinance might be required prior to tree or vegetative removal.
The tree removal process can be done through burning or shredding the trees. To remove
the old building, heavy equipment might be necessary, and followed by a hand cleanup of
the area. Once the property subject is clear from any objects, the land is ready to be
converted into a farmable land. The next step in converting the land into farmable land is
through the plowing process.
Scraping and Plowing the Soil
Before plowing the field, it is important to determine whether or not the potential
farmland is ground leveled. This can save time and simplify the plowing process. If there
is a significant ground area that is not leveled, the farmer will need to use a heavy-duty
vehicle like an earth scraper to level the field and prepare it for plowing.
Figure 20. Earth Scraper.

25
However, if the unleveled ground area is unsignificant, then a mini scraper could
sufficiently do the job. Both earth and mini scrapers function the same way, transferring
soil from higher ground to the lower ground until the ground is level. If there is an
excessive amount of soil after the ground is leveled, the extra soil should be disposed or
spread out. The leveled ground will help facilitate the harvesting process when the lemon
trees start producing fruits.
Figure 21. Mini Scraper.
Figure 22. Detachable Scraper.

26
Figure 23. A Tractor with Detachable Scraper.
The scraping process can be done using a tractor with a detachable scraper and hydraulic
system. Along with the scraper, the tractor could also be equipped with a detachable
hydraulic plow for plowing process. Figures 22, 23 and 24 show examples of these ideas.
Since the subject property is flat land, the ground is fairly level and it does not need to go
through the scraping process. The next step would be plowing the soil. This process is
intended to break up the soil layers, bring out nutrients from the under layers and bury
weeds and increase the water holding capacity of the soil. The plowing process will
convert the subject property into a farmable land.
Figure 24. Detachable Hydraulic Plow for Plowing Process.

27
Compacting the Dirt Road
Before planting the lemon trees throughout the subject property, access roads need to be
prepared to assure that every part of the farmland is accessible. According to the orchard
design in Figure 16, each acre of farmable land should be surrounded by a dirt road,
which will later on become the path for vehicles to reach all sectors of lemon grove. After
the plowing process, the ground of the potential farmland is expected to be cushioned.
Therefore, compacting the soil would be the only way to set up these dirt roads
surrounding each sector of the lemon grove. The soil can be compacted by a steamroller
in order to form the dirt roads. The weight of the roller should be enough to compact the
soil on the ground and make the surface of the dirt road smooth.
Figure 25. Steamroller.
Installing Irrigation System
After compaction and formation of the dirt roads around the orchard is complete, the next
step is to install the irrigation system. It is crucial to get the irrigation system ready before
planting the trees because once the trees are planted, water will need to be distributed to
all the trees throughout the orchard. Since water is essential for growth, failing to apply
enough water to each tree will decrease the chances for the newly planted trees to adapt
with their new environment. For this subject property, micro-sprinklers will be installed
as the irrigation system for the plantation. Micro-sprinklers are classified in a low volume
irrigation system and very suitable for fruit crops like lemons, oranges and avocados.
Micro-sprinklers have high application efficiency, allowing growers to save water and
only apply water to the plant’s root zone.
Micro-sprinklers can also be used to distribute fertilizers to the trees. Water-soluble
fertilizers can be injected into the system, providing necessary nutrients for the trees. This
method can save time and money for the growers as compared to manual labor fertilizer
applications. According to the lemon grove design in Figure 16, one micro-sprinkler will
be installed in between two lemon trees throughout the orchard. One micro-sprinkler is
sufficient to supply enough water to one side of both trees, with a maximum capacity of
15 GPH (Gallon per-Hour) for each sprinkler.

28
Figure 26. Micro-Sprinkler.
To distribute fertilizers throughout the system, the micro-sprinklers will require a
fertilizer injector. Fertilizer injectors will allow growers to insert nutrients and fertilizer
into the distributed water. However, only liquid fertilizers can be applied through this
injector because solid fertilizers will have high potential to clog the irrigation system.
Figure 27. Fertilizer Injector.

29
Irrigation System Management
Although micro-sprinklers are the main part of the irrigation system, it is important to
note that systems consist of pumps, filters, fertilizer injectors, pressure regulators,
solenoid valves, and most importantly, the controller. The entire irrigation operation can
be controlled electronically through this system, which includes water pressure, nutrient
injections, fertilizer applications and water distribution to the orchard. The water will be
transported from the pumps to the mainline, through the valves to the sub-mainlines, and
then distributed to each micro-sprinkler. Figure 28 below shows the requirements to
efficiently run a fertilizer injected irrigation system.
Figure 28. Irrigation System for Micro Sprinklers.
To improve efficiency, micro-sprinkler irrigation systems can be operated with additional
flow regulating devices. The most common flow-regulating device is a pump, as long as
the pump is capable of maintaining consistent flow throughout the orchard. A stainless
steel pump is preferred due to fact that it will have a longer life expectancy and will not
rust. These pumps should be able to maintain both low and high pressure, from around 10
to 45 PSI, depending on water application. Typically, the pump is powered by a 10 HP
motor that has the capability to run at pressures up to 80 PSI throughout one acre of
orchard. Figure 29 below shows an example of a typical pump that is used in the orchard.
Figure 29. 10-HP Water Pump.
The pressure and flow on the output side can be adjusted with the solenoid control valve.
Furthermore, all of the water application rates will be controlled with the field controller.

30
This controller will serve as the main device that maintains the water output, water
pressure, timing and the amount of fertilizer injected into the water.
Figure 30. Field Timer and Irrigation Controller.
Water Application and Management
Most irrigation systems receive water from different types of water sources including
canals, reservoirs and groundwater wells. This orchard will pump water from a reservoir
and existing groundwater on the property. The amount of water that needs to be applied
for an orchard varies, depending on the crop type. For lemon orchards, each acre will
require a total of 3 acre-inches of water annually, assuming there is no effective rainfall
or runoff on the property. These numbers will increase annually, depending on the
growth and needs of each tree. One acre-inch of water is equivalent to 27,154 gallon of
water. The necessary water application rates will increase from year to year, depending
on the age of lemon trees.
Table 9. Water Application.
Year
Water (Ac-in) /
Acre
1 3
2 7
3 13
4 22
5 27
6 33
7 33
The amount of water that needs to be applied will reach its peak in year 7. During year 7,
they will pump about 33 acre-inches, which is equivalent to 896,000 gallon of water. The
cost of water for the entire orchard can be calculated based on this water application.

31
Irrigation Capital Investment and Water Cost
The capital investment on an irrigation system for an orchard will vary, depending on the
size of the orchard. For the subject property, the capital investment for all of the
equipment is listed in the table 11 below, not including the cost of the water.
Table 10. Capital Investment for Irrigation Station.
Equipment
Quantity
(unit) $/Unit Total Cost
Micro Sprinkler 4000 $ 2.42 $ 9,680.00
10-Hp Water Pump 25 $ 149.99 $ 87,275.00
Fertilizer Injector 25 $ 48.95 $ 1,223.75
Irrigation Controller 25 $ 65.90 $ 1,647.50
Total Capital Investment = $ 98,804.25
The table above shows the cost to set up the irrigation system for a 25-acre lemon grove.
A total of 4000 micro-sprinklers will be required to irrigate 25 acres of farmland, which
amounts to 160 sprinklers per acre of land. The cost does not include the labor cost to
install this irrigation station in each sector of the lemon grove.
The cost of water application needs to be included to allow growers to estimate the total
cost for the irrigation operation on the entire orchard. The price of water for irrigation is
highly variable, depending on the districts. According to Barry Nelson from the
California Farm Bureau, the cost of water on the central coast usually ranges from $400
to $500 per acre-foot, which amounts to about $37.50 per acre-inch. The total water cost
per year for the entire orchard is listed in Table 11 below.
Table 11. Total Water Cost.
Year
Water (Ac-in)
/Acre $/Ac-In
$ / Acre of
Land
# of
Acre Total Cost /Year
1 3 $ 37.50 $ 112.50 25 $ 2,812.50
2 7 $ 37.50 $ 262.50 25 $ 6,562.50
3 13 $ 37.50 $ 487.50 25 $ 12,187.50
4 22 $ 37.50 $ 825.00 25 $ 20,625.00
5 27 $ 37.50 $ 1,012.50 25 $ 25,312.50
6 33 $ 37.50 $ 1,237.50 25 $ 30,937.50
7 33 $ 37.50 $ 1,237.50 25 $ 30,937.50
The cost of water will remain constant in year 7, at about $31,000 annually. All of these
costs will be included in the cost analysis.

32
Lemon Tree Planting
Upon completion of all the above processes, the subject property is ready to be planted
with lemon trees. The trees can be purchased from plant nurseries and will start
producing fruit in the third year. Buying mature trees, which are older than 3 years, is
recommended if the grower desires fruit production in the first year of farming. The very
first step in planting the lemon trees is to mark out the tree sites based on the existing
design. Lemon trees will be placed according to the orchard layout in Figure 16, where
112 lemon trees will be planted in each acre of land. The rows will be spaced 20 feet
apart and the trees will be spaced 12 feet apart down each row. Holes will be dug about 1
foot down at each marked spot, then the trees will be planted into those holes.
The distance between the lemon trees will determine the density of the lemon grove.
Spacing distances between trees are intended to prevent overcrowding in the orchard.
Once the tree is planted, the trunk is covered with a foam wrap to protect it from sunburn,
since newly planted trees are sensitive to the environment. Not all of the lemon trees will
survive when planted in a new environment. Typically about 2% of the lemon trees will
fail to adapt with the new environment and they will need to be replaced in the second
year. However, if the tree is able to survive after one year, it will be expected to have
about 40 years of productive life. The cost for Lisbon lemon trees is about $9/tree.
Assuming each acre will hold 112 lemon trees including the 2% replacement trees, the
total capital investment of the entire orchard will be:
Table 12. Lemon Trees Capital Investment.
# of Tree / Acre $/Tree Cost of Tree / Acre # of Acre Total Investment
160 $9 $1,008 25 $36,000
With 2% tree replacement at the second year, the total investment will be =
$36,000 * 102% = $ 36,720; this does not include the planting costs of each tree.
The planting cost includes land preparation like disking, leveling and planting the tree.
Generally this costs around $500 per-acre and therefore, the total planting cost will be
around 25 Acres * $500/acre = $12,500 for 25 acres of land.
Therefore the total cost for planting operations of 25 acres of land will be:
Cost of Trees + Planting Cost =
$36,720 + $12,500 = $49,220

33
Fertilizer Application
There are several different nutrients that a lemon tree needs in order to produce a
marketable quality of fruit. Among these nutrients, Nitrogen (N) is the most crucial
element for a lemon tree. As a macronutrient, Nitrogen is a major nutrient that will help
tree growth and increase the chances to achieve optimum yield. The most common
fertilizer that is applied for lemon trees is UN32. UN32 can be applied through the micro-
sprinkler system and contains micronutrients like zinc and manganese that are required
by the lemon tree. Gypsum, calcium and lime also need to be applied to the lemon
orchard to maintain the pH level of the soil. When the soil pH is around 5.5 to 5.75, the
soil should possess all nutrients required for lemon trees. In this study, the fertilizer total
cost will be around $7 per tree, which includes UN32, gypsum, zinc and manganese. This
$7 consists of UN 32 for $0.46/lb, Urea for $0.91/lb, Zinc for $0.64/lb, and Manganese
for $0.74/lb. With all that said, the total cost will be:
Table 13. Fertilizer Cost.
# of Tree /
Acre
Fertilizer
$/Tree
Cost of Fertilizer /
Acre
# of
Acre Total Cost
160 $7 $1,120 25 $28,000
Frost Protection
During the winter months, lemon trees are highly vulnerable to frost and/or freezing.
However, in the central coast area, frost damage is rarely a threat due to the relatively
constant temperatures throughout the year. Therefore, in this study, the frost will not be
included as a part of the cost analysis. Frost protection can be prevented by constantly
applying water from a micro-sprinkler system throughout the orchard. Another way to
prevent frost damage is by installing wind machines that distribute warm air above the
trees.
Figure 31. Wind Machine – Frost Protection. (Ausfrost, 2008)

34
Pest Control and Management
The lemon orchards face the problem of pest infestation, which can become a serious
problem if it does not controlled properly. Pests could be categorized into different
classes including weeds, insects, diseases and vertebrate. To control these pests, different
applications are required to handle different types of pest. Spraying the orchard regularly
with Karmex and Princep would be the best way to control weeds in the plantation.
Karmex and Pricep are types of chemical pesticides that are commonly applied in the
lemon industry. Spraying chemicals are the most efficient way to control herbicides and
insects.
To prevent diseases in the lemon orchard, a regular application of copper and lime will be
necessary. The most common diseases on lemon trees are brown root (Phytophthora spp.)
and septoria root (Septoria spp.). These diseases can affect the lemons to a point when
they become unmarketable. It is very important to spray consistently to prevent the
diseases from spreading throughout the orchard.
Figure 32. Lemon Fruit – Phytophthora.(forestphytophthoras,2013)
Annual Pesticide Costs
Table 14. Pesticides Total Cost per Acre / Year.
Pesticide
Type
Unit (lbs) /
Acre $/Unit (lb)
# of
Acre Cost
Princep 0.6 $ 6.07 25 $ 91.05
Karmex DC 4 $ 6.17 25 $ 617.00
Total Cost = $ 708.05

35
Harvesting and Yield
Due to the compatible weather in the central coast area, lemon plantations generally can
be harvested 3 to 4 times a year. The harvesting process is usually done once every three
months, or as soon as the fruit is ripe and ready to be harvested. In this study, all of the
trees are expected to be ready for harvest in the first year. An expected yield is listed in
the table below.
Table 15. Expected Annual Yield Per-Acre Basis.
Year Field Bins (900 lbs) Field Boxes (56 lbs) Total Cartons (37.5 lbs)
1 10.2 164 244
2 17 273 407
3 27 436 651
4 37.3 600 895
5 42.4 681 1017
6+ 47.5 763 1139
The table above shows the expected yield per year. The table below shows the total yields
for the entire orchard.
Table 16. Total Annual Yields.
Year
Field Bins (900
lbs) lbs/ bin/ Acre # of Acre
Total Yield
(lbs)
1 10.2 900 25 229500
2 17 900 25 382500
3 27 900 25 607500
4 37.3 900 25 839250
5 42.4 900 25 954000
6+ 47.5 900 25 1068750
The total yield of lemon production will increase from year to year, and will remain fairly
constant from year 6 to year 40. Total costs for the harvesting process will be placed
under the operational cost, since the harvesting costs include different labor costs. The
labor costs will be different each year, depending on the volume of the yields in that
particular year. However, expected generated income could be based on the total yield of
the lemon production.

36
Processing Plants
After the harvesting process, the lemons will be transported to the processing plant where
they are treated and packaged to be sold in the market. Lemons will be transported from
the orchard to the processing plant with the pickup truck. Each pickup truck can handle 6
to 8 bins of lemons and each bin contains around 56 lbs of lemons. All of lemons will be
pushed through the processing line in the processing plant. The processing line includes a
few different steps as listed below.
1. Weigh the total yield – Using this automated scale, the total yield per batch of
lemons can be calculated.
Figure 33. Automated Scale.
2. Conveyer – Transport lemons with the conveyor to the dark room.
Figure 34. Conveyor Line.

37
3. Dark Room – black lights detect any rotten indication such as molds & fungi.
If there is any indication of mold or fungi, the fruit will be considered as
waste.
Figure 35. Dark Room.
4. Dump Tank – The tank is filled with a mixture of water and bleach to sanitize
the fruits.
Figure 36. Dump Tank.
5. From the dump tank, the fruit will travel on the conveyer to the brush bed.
The brush bed will clean the fruit and apply a waxy coat to each lemon.
Figure 37. Brush Bed.

38
6. From the brush bed, the fruit will be transported to a conveyer that is equipped
with a fan that dries the wax-covered fruit. The waxing process is mainly
intended to prevent the fruit from damage, but it also gives them an appealing
glossy look.
Figure 38. Drier Conveyor.
7. From the drier, the fruit is transported on another conveyer to the Aweta-
Autoline sorter. The Aweta sorter will sort the lemons based on their size,
shape, color and grade.
Figure 39. Aweta Fruit Sorter.
8. The last step of the process is packaging. The fruits will be packaged together
based on size and quality, depending where the Aweta Sorter directed them.
Figure 40. Packaging Line.

39
Capital Investment for Lemons Processing Line
Having their own processing line will allow growers to sell their lemons straight to the
market. However, the capital investment for a processing plant is relatively high. The cost
for the processing plant depends on its size and packaging rate capacity of the line. For
this project, 20 boxes per minute is sufficient enough to process and package all of the
lemons. Each box contains about 55 lbs. of lemons. For this processing line, the capital
investment is listed in the table below.
Table 17. Capital Investment for Lemon Processing Line.
Equipment Estimated Cost ($)
Conveyor $ 100,000.00
Brush Bed $ 35,000.00
Dark Room $ 30,000.00
Aweta Fruit Sorter $ 60,000.00
Packaging Line $ 30,000.00
Automated Scale $ 2,000.00
Total Cost $ 257,000.00
Tim Hutcheson, a capital project director for Roll Global LLC, provided all of the
information for the capital investment estimation above. This estimation is based on pure
assumption of the capacity rate of the processing line. This capital investment includes
transportation and installation fees.
Establishment Cost
The establishment cost includes all of the costs that are needed to establish an orchard.
This cost includes the cost of the land, trees, vehicles, infrastructures, processing plant,
irrigation system, and any other cost that occurred in the beginning of orchard
preparation. The establishment cost does not include any operational costs of the lemon
production. All of the establishment costs are listed below and occurred only once at the
beginning of the establishment process. The total establishment cost is based on the entire
orchard and is listed in the table below.

40
Table 18. Establishment Cost.
Type of Cost Cost in $
Land $ 1,046,000.00
Ag. Structure $ 266,000.00
Vehicles $ 39,710.00
Irrigation System $ 98,804.00
Trees $ 36,720.00
Planting Cost $ 12,500.00
Processing Plant $ 257,000.00
Total Investment $ 1,756,734.00
Operational Cost
The operational cost is the total cost to run the lemon plantation. The operational cost will
include labor cost, irrigation, utilities, fertilizer, and other variable costs depending on the
application. The main operational cost is the labor cost. The California labor rates for
machine operator is $14.50/hour and $11/hour for general labor. However these rates do
not include coverage allowance or facilities provided for labors. Therefore, the rates
would at least double the standard rates and are listed in the table below, depending on
the job.
Table 19. Labor Cost per Acre.
# of Hr / Acre in Year
Type of Labor $ / Hr 1 2 3 4 5
Machine
Operator $30.00 230 259 299 328 347
General Labor $22.00 76 114 178 291 345
Total
Cost $8,572.00 $10,278.00 $12,886.00 $16,242.00 $18,000.00
The operational costs for different years for this orchard are listed in the tables below.

41
Table 20. Total Operational Cost per Acre (Year 1-4).
Year
Type of Cost / Acre 1 2 3 4
Ag Structure Utilities $87.00 $87.00 $87.00 $87.00
Vehicles Expenses $152.00 $152.00 $152.00 $152.00
Labor Cost $8,572.00 $10,278.00 $16,242.00 $18,000.00
Irrigation Cost $112.50 $262.50 $487.50 $825.00
Fertilizer Cost $784.00 $784.00 $784.00 $784.00
Pesticide Cost $708.05 $708.05 $708.05 $708.05
Total Cost/Acre : $10,415.55 $12,271.55 $18,460.55 $20,556.05
Total Cost for 25 Acre : $260,388.75 $306,788.75 $461,513.75 $513,901.25
Table 21. Total Operational Cost (Year 5-7).
Year
Type of Cost / Acre 5 6 7 8
Ag Structure Utilities $87.00 $87.00 $87.00 $87.00
Vehicles Expenses $152.00 $152.00 $152.00 $152.00
Labor Cost $18,000.00 $18,000.00 $18,000.00 $18,000.00
Irrigation Cost $1,012.50 $1,237.50 $1,237.50 $1,237.50
Fertilizer Cost $784.00 $784.00 $784.00 $784.00
Pesticide Cost $708.05 $708.05 $708.05 $708.05
Total Cost/Acre : $20,743.55 $20,968.55 $20,968.55 $20,968.55
Total Cost for 25 Acre : $518,588.75 $524,213.75 $524,213.75 $524,213.75
Overhead Cost
The overhead cost includes property tax, insurance and investment repairs.
- Property tax is 1% of the value of the subject property which is:
$1,046,000 * 1% (0.01) = $10,460 / year
- Insurance is 0.82% of the total asset, which is:
$575,139 * 0.82% (0.0082) = $4716 / year
- Investment repair and maintenance costs are 2% of the vehicle cost annually,
which is:
$39,710 * 2% (0.02) = $795/ year

42
The total overhead cost is listed in the table below:
Table 22. Total Overhead Cost per Year.
Overhead Cost $ Amount
Property Tax $ 10,460.00
Insurance Cost $ 4,716.00
Maintenance Cost $ 795.00
Total Cost/year : $ 15,971.00
The overhead cost can change throughout the year, depending on land value or additional
assets.
Expected Revenue
The expected revenue is based on the total production yield in that particular year. The
lemon yield continues to increase from year to year and can be seen below in Table 17.
The generated revenue is based on the market price. The market price for lemon
industries in 2011 to 2012 is listed in the table below:
Table 23. Lemon Price for 2011-2012.
Month $/Box of Lemons
August $ 42.20
September $ 39.70
October $ 36.70
November $ 36.20
December $ 36.90
January $ 38.40
February $ 35.60
March $ 35.00
April $ 36.00
May $ 38.40
June $ 39.40
July $ 37.70
Average $/Box = $ 37.68

43
Total Revenue
Based on the prices above, the amount of revenue can be estimated, as well as the total
profit.
Table 24. Total Revenue Each Year Based on FOB price.
Year
Total Yield
(lbs) lbs/Box # of Boxes $/Box Expected Revenue
1 229500 37.5 6120 37.68 $ 230,601.60
2 382500 37.5 10200 37.68 $ 384,336.00
3 607500 37.5 16200 37.68 $ 610,416.00
4 839250 37.5 22380 37.68 $ 843,278.40
5 954000 37.5 25440 37.68 $ 958,579.20
6+ 1068750 37.5 28500 37.68 $ 1,073,880.00
As long as the generated revenue can cover the operational costs, then the lemon orchard
will be successful and profitable.
Break-even Point
There are minimum quantity boxes of lemon that need to be sold to cover operational and
salvage cost. When the total revenue could cover total operational cost and overhead cost,
then break-even point will be achieved.
Table 25. Break-even Point Table.
Year Variable Cost
(Opeational Cost)
Fixed Cost
(Overhead
Cost)
Total Cost $ / Box of
Lemon
Break-even Point
(# Boxes of Lemons)
1 $260,388.75 $15,971.00 $276,359.75 $37.68 7334
2 $306,788.75 $15,971.00 $322,759.75 $37.68 5070
3 $461,513.75 $15,971.00 $477,484.75 $37.68 12672
4 $513,901.25 $15,971.00 $529,872.25 $37.68 14062
5 $518,588.75 $15,971.00 $534,559.75 $37.68 14187
6 $524,213.75 $15,971.00 $540,184.75 $37.68 14336
7 $524,213.75 $15,971.00 $540,184.75 $37.68 14336
8 $524,213.75 $15,971.00 $540,184.75 $37.68 14336
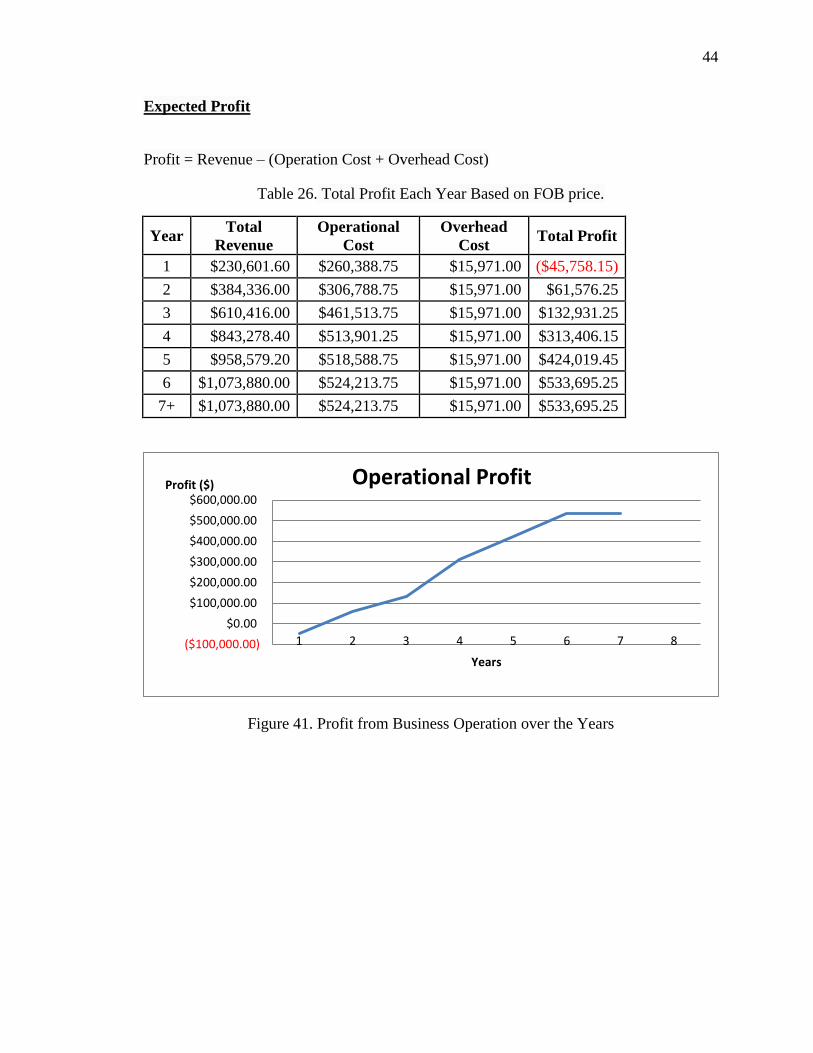
44
Expected Profit
Profit = Revenue – (Operation Cost + Overhead Cost)
Table 26. Total Profit Each Year Based on FOB price.
Year Total
Revenue
Operational
Cost
Overhead
Cost Total Profit
1 $230,601.60 $260,388.75 $15,971.00 ($45,758.15)
2 $384,336.00 $306,788.75 $15,971.00 $61,576.25
3 $610,416.00 $461,513.75 $15,971.00 $132,931.25
4 $843,278.40 $513,901.25 $15,971.00 $313,406.15
5 $958,579.20 $518,588.75 $15,971.00 $424,019.45
6 $1,073,880.00 $524,213.75 $15,971.00 $533,695.25
7+ $1,073,880.00 $524,213.75 $15,971.00 $533,695.25
Figure 41. Profit from Business Operation over the Years
($100,000.00)
$0.00
$100,000.00
$200,000.00
$300,000.00
$400,000.00
$500,000.00
$600,000.00
1 2 3 4 5 6 7 8
Profit ($)
Years
Operational Profit

45
Cash Flow for Business Operation
In a business, cash flow could represent the performance of company over certain period
of time. Cash flow reflects money that goes in and out of the business, notice that cash
flow can be negative or positive and is often used as an indication of company value and
situation. Cash flow can be broke down based on different period of time and measures in
a form of the cash flow diagram. Cash flow for this business plan is reflected through
these figures below:
Figure 42. Investment/Operational Cost - Cash Flow Diagram.
Figure 43. Overhead Cost – Cash Flow Diagram

46
Figure 44. Revenue – Cash Flow Diagram
Figure 45. Cash Flow Diagram.

47
From all of these cash flow diagrams, the total profit could put into another cash flow
diagram, shown in the figure below.
Figure 46. Profit – Cash Flow Diagram.
Cash flow diagram reflects the amount of profit gained in different years. However,
actually the business plan has not starting to make any income yet until it pays the initial
investment for this business plan. To figure the moment that the business plan is starting
to make money could be analyzed with Rate of Return (ROR) or Return on Investment
(ROI) methods.

48
Rate of Return on Business Plan
Rate of return (ROR) or Return on Investment (ROI) is amount of money gained or loss
relative to the amount of the initial investment, expressed in percentage. In business,
ROR usually used to figure out the performance of an operation in paying back initial
investment. ROR would also shows the amount periods of time required to return the
initial investment. The ROR could be based on certain period of time, whether daily,
monthly, annually or any specific period of time. For this business plan, the ROR and
total ROR will be shown in the figure below. The ROR shows different rate of
investment while the overall ROR will represent the total rate of return on initial
investment.
Table 27. Return on Investment Over the Years.
Year
Dollar
Return Initial Investment ROI
1 ($45,758.15) $ 1,756,734.00 -2.6%
2 $61,576.25 $ 1,756,734.00 3.5%
3 $132,931.25 $ 1,756,734.00 7.6%
4 $313,406.15 $ 1,756,734.00 17.8%
5 $424,019.45 $ 1,756,734.00 24.1%
6 $533,695.25 $ 1,756,734.00 30.4%
7 $533,695.25 $ 1,756,734.00 30.4%
Table 28. Overall ROR for Business Operation.
Year Dollar Return Remaining
Investment
Overall
ROR
Initial
Investment N/A
$ (1,756,734.00) 0%
1 ($45,758.15) $ (1,802,492.15) -2.6%
2 $61,576.25 $ (1,740,915.90) 0.9%
3 $132,931.25 $ (1,607,984.65) 8.5%
4 $313,406.15 $ (1,294,578.50) 26.3%
5 $424,019.45 $ (870,559.05) 50.4%
6 $533,695.25 $ (336,863.80) 80.8%
7 $533,695.25 $ 196,831.45 111.2%
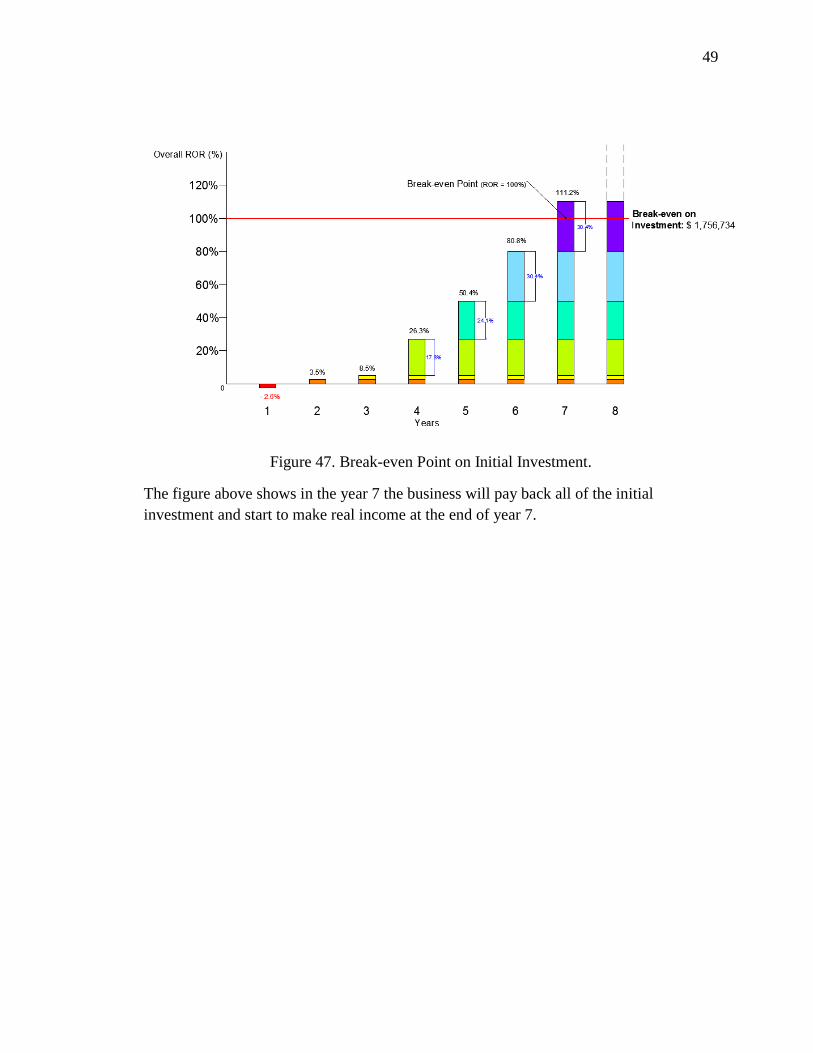
49
Figure 47. Break-even Point on Initial Investment.
The figure above shows in the year 7 the business will pay back all of the initial
investment and start to make real income at the end of year 7.

50
RESULTS
Although all of the calculations above are based on assumptions, it is clear that the lemon
plantation has potential to generate revenue in the first year of operation. However, the
$1.75 million capital investment to start up this project is very high. In the real world, the
grower might need to take out a loan to start up the plantation. The calculations include
interest rate and depreciation for each asset. All the numbers and calculations that are
reflected in this report represent all of the costs for different farming operations to start
up a new lemon plantation in California. This report can still provide ideas to the readers
about different farming operations and their costs. Every cost analysis and farming
operation provided in this report is applicable in the real world. This report specifically
provides information for those who want to start up a lemon plantation in California,
specifically on the central coast. Setting up a lemon plantation in other areas will have
different variables such as weather, soil, water prices and land prices. There would be
many different factors and rates that would have to be accounted for.
Another thing to note is that the resulting generated income is based on the lemon market
prices of 2011-2012. From the ROR calculation, this project will return the initial
investment in year 7 and start to make profit at the end of year 7, assuming that the
grower would be able to sell their lemons with 2011-2012 FOB prices. Throughout the
year, the prices of lemons will fluctuate depending on supply and demand of lemons in
the market. In fact, it is common for growers to sell their products below the market price
because they cannot store lemons for very long. Sometimes growers aren’t able to sell all
of their products to the market and those fruits will become waste. This report does not
account for crop failures and it also assumes that the lemons will achieve the USDA
standard to be marketable. In the industry today, not all lemons produced will qualify
with marketable standards.

51
DISCUSSION
Based on the results, the business plan for lemon production in California is feasible.
According to the calculations above, to reach a break-even point will take the grower at
least 7 years to earn back all of the investments. The grower will make a real profit at the
end of year 7, with the assumption that he did not take any loans from the bank. When
borrowing money from the bank, the grower needs to take the interest rate into account.
In addition, all of the farming operations in this report are assumed to run smoothly.
There is always the potential for unexpected events to occur in real operations. For
example, water scarcity for irrigation operations could lead to lower yields or even crop
failure. These factors cannot be measured based on assumptions, which is why they are
not part of the report. This report only shows an ideal healthy plantation that runs each
aspect of the farming operation efficiently. As a whole, this report has shown that the
lemon industry in California still has a really high potential to grow. In fact, it is not too
late to start one, especially with the slow economy where the price of land is relatively
cheaper than previous years.
52
RECOMMENDATIONS
Minimize Investment Cost
Based on the results above, the capital investment to start up this business plan is
relatively high. Without including the operational cost in the first year, it is close to $1.76
million. However, this investment could be reduced through several ways. First, finding
cheaper land that is fit for lemon production can reduce the capital investment
significantly. In the report, the price of the subject property is relatively high, at about
$45,000/ acre of farmland. Nevertheless, the subject property is fit for a lemon plantation.
Therefore, alternative locations are acceptable as long as they have the similar
characteristics as the subject property.
Another way to reduce the capital investment is by sending the lemons to another
processing plant. However, it would be more efficient to process the lemons at the
planting site rather than sending them to another processing plant, since there are no
citrus processing plants around the central coast area.
Eliminating any Potential Threat
Another important recommendation for running a plantation is eliminating any potential
threat that might affect any kind of farming operation. For example, maintaining the
nutrients and regular application of pesticides will help prevent lemon trees from
producing low quality fruit. It will be better to prevent all of these potential threats rather
than fix them after the problems occur.
Processing Lemons from Other Growers
Since the processing plant is not operated in full capacity on a daily basis, an additional
income can be made by receiving orders to process lemons from other growers. This is
another way to generate more income aside from the lemon production. Generally, the
rate to process one box, or 37.5 lbs. of citrus is about $4/box. If an existing processing
plant on the site could capture all of the citrus processing market on the central coast,
then the plant could expect a significant amount of additional income.

53
REFERENCES
1. Suzanne, T. and Eduardo, R. 2007. Linking Risk and Economic Assessments in the
Analysis of Plant Pest Regulations. <http://www.gii.ncr.vt.edu/docs/GII_WP2007-1.pdf>
referenced May, 2013
2. USDA. 2013. Citrus June forecast. Citrus June forecast Home Page.
<http://www.nass.usda.gov> , referenced May 5, 2013
3. D. Reich, R. Goodin, and I. Broner. 2009. Microirrigation for Orchard and Row Crops.
<http://www.ext.colostate.edu/pubs/crops/04703.html>, referenced March, 2013.
4. Morton, J. 1987. Fruits of warm climates. Horticulture Page
<http://www.hort.purdue.edu> , referenced May 5,2013
5. B. Nelson. July 2011. Price Matters – Water Conservation and the California Farm
Bureau. Berry Nelson Blog. <http://switchboard.nrdc.org/blogs/bnelson/price_matters_-
_water_conserva.html>, referenced March 2013
6. U.C, Riverside. 2013. Citrus variety collection. <http://www.citrusvariety.ucr.edu/>
referenced May, 2013
7. U.C, Davis. 2010. Sample Costs to Establish an Orchard and Produce lemons.
<http://coststudies.ucdavis.edu/files/lemonvs10.pdf>. referenced March, 2013
8. Thomas, M. 2013. Personal communication. Thomas Marderosian, Cal Poly student
Lemon production handling process.
9. Dr. Garner L. 2013. Personal communication, Dr. Lauren Garner, Cal Poly Fruit
Science Professor. General information about lemon orchard at Cal Poly.
10. USDA. 2012. Citrus Fruits 2012 . United States Department of Agriculture
<http://usda01.library.cornell.edu/usda/current/CitrFrui/CitrFrui-09-20-2012.pdf>
11. Hayley B. 2011. Citrus Profile. Hayley Boriss, formerly of the Agricultural Issues
Center, University of California <http://www.agmrc.org/>, referenced May, 2013.
12. Fruit Portal. 2013. Fruit Portal Price List Page.
<http://www.freshfruitportal.com/precios-frutas/precios-usda/>, referenced April 2013
13.David N. 2010. Average Price per sq-ft for a 10,000 sq-ft Industrial Building.
RoblesDavid Norwood, Broker, Arroyo Grande. < http://dnorwood.com>.

54
APPENDICES

55
Appendix A: Lemon Nutritional Value - Food Value per 100 g. of Edible Portion
Fruit
(fresh,
peeled)
Juice
(fresh)
Juice
(canned,
unsweetened)
Juice (frozen,
unsweetened)
Lemonade
(concentrate,
frozen)
Peel
(raw)
Calories 27 25 23 22 195
Moisture 90.1 g 91.0 g 91.6 g 92.0 g 48.5 g 81.6
g
Protein 1.1 g 0.5 g 0.4 g 0.4 g 0.2 g 1.5 g
Fat 0.3 g 0.2 g 0.1 g 0.2 g 0.1 g 0.3 g
Carbohydrates 8.2 g 8.0 g 7.6 g 7.2 g 51.1 g 16.0
g
Fiber 0.4 g trace trace trace 0.1 g
Ash 0.3 g 0.3 g 0.3 g 0.2 g 0.1 g 0.6 g
Calcium 26 mg 7 mg 7 mg 7 mg 4 mg 134
mg
Phosphorus 16 mg 10 mg 10 mg 9 mg 6 mg 12
mg
Iron 0.6 mg 0.2
mg 0.2 mg 0.3 mg 0.2 mg
0.8
mg
Sodium 2 mg 1 mg I mg I mg 0.2 mg 6 mg
Potassium 138
mg
141
mg 141 mg 141 mg 70 mg
160
mg
Vitamin A 20 I.U. 20
I.U. 20 I.U. 20 I.U. 20 I.U.
50
I.U.
Thiamine 0.04
mg
0.03
mg 0.03 mg 0.03 mg 0.02 mg
0.06
mg
Riboflavin 0.02
mg
0.01
mg 0.01 mg 0.01 mg 0.03 mg
0.08
mg
Niacin 0.1 mg 0.1
mg 0.1 mg 0.1 mg 0.3 mg
0.4
mg
Ascorbic Acid 53 mg 46 mg 42 mg 44 mg 30 mg 129
mg
*Analysis of true lemons, as marketed.

56
Appendix B: Soil Sample Test Equipment
pH Paper Strips
Link to purchase:
http://www.google.com/shopping/product/5860118807249909916?q=pH%20paper%20st
rips&client=firefox-a&hs=4BZ&rls=org.mozilla:en-
US:official&psj=1&bav=on.2,or.r_qf.&bvm=bv.46471029,d.cGE&biw=905&bih=965&
sa=X&ei=o4eUUbOBO6jtigLn2YH4Cg&ved=0CJQCEPMCMCM
Distilled Water
Link to purchase:
http://www.myotcstore.com/store/p/16816-Nestle-Distilled-Water-1-Gallon-Bottle-6-
ea.aspx?utm_source=shopping_otc&utm_medium=cpc&utm_campaign=product&gdftrk
=gdfv23047_a_7c861_a_7c2706_a_7ccx732974

57
Appendix C: Information and Location of Subject Property

58

59
Appendix D: Ag. Support Building - Layout

60
Appendix E: Forklift HB20E
Link to purchase:
http://www.alibaba.com/product-
gs/829047978/Hyundai_2ton_mini_electric_forklift_for.html
Product Detail

61
Specification of HB20E

62
Appendix F: Used Pickup Truck – 2005 Ford Ranger 2WD Regular
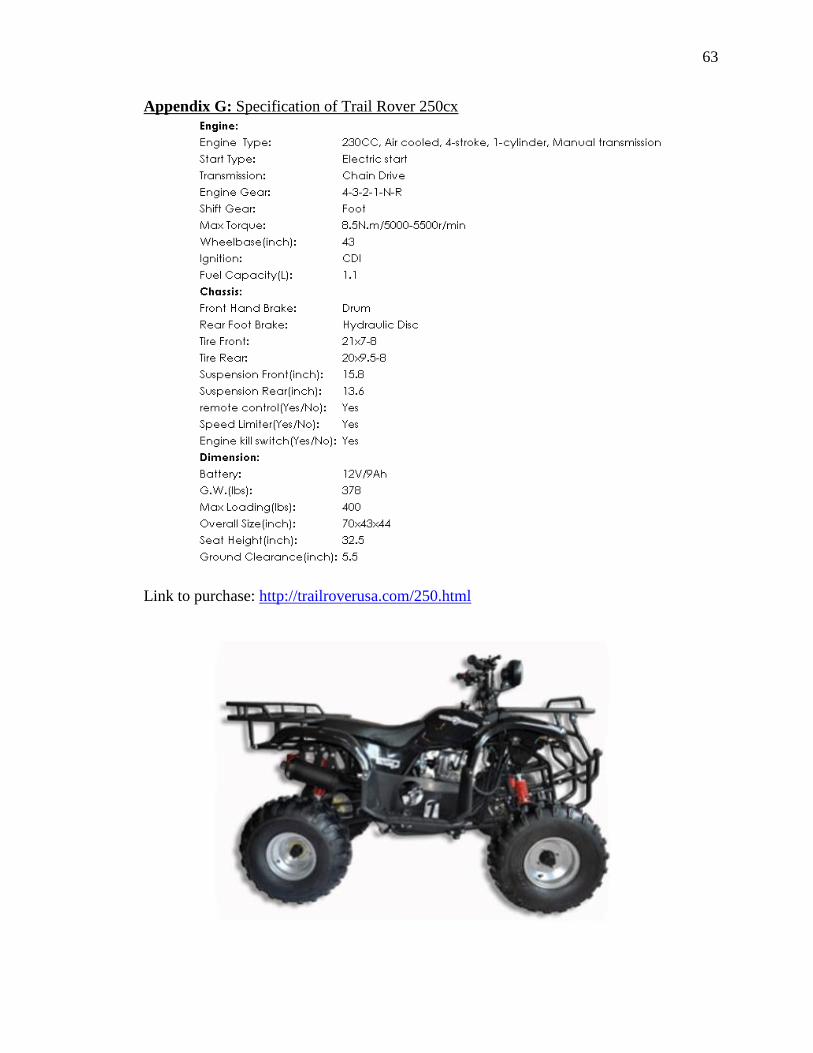
63
Appendix G: Specification of Trail Rover 250cx
Link to purchase: http://trailroverusa.com/250.html

64
Appendix H: Irrigation System Components
Micro Spinklers

65
Pump
Fertilizer Injector

66
Irrigation Controller

67

68
Appendix I: Lemon Market Prices

69
Appendix J: Senior Project Contract
C a l i f o rn i a P o l y t ec h n i c S t a t e U n i ve rs i t y June 3, 2013
BioResource and Agricultural Engineering Department Sinanta Henry
BRAE Senior Project Contract #055705072
ASM
Project Title: Business Plan for Lemon Production in California
Background Information:
Over the years, the farming industry in California has consistently grown, and has potential to expand into
the future. It has been known as a state that produces a majority of food supplies for the US. California
has the optimum weather for certain crops that allow farmers to get the most efficient yield productivity.
Many agricultural companies are located in central California and are expanding to produce more food,
trying to meet the needs of the human population’s exponential growth. Market prices for crops are
always unsteady being based on its supply. However, the fundamentals of initiating a farming system
would remain the same, farmers choose the most economical method to produce crops to maximize their
profit margin. Lemons are an example of a crop that has stable prices as well as the economic value and
growing efficiently in California’s climates.
Statement of Work
The first stage of this project is to find potential farmland in California that can be used for lemon
production. The soil will be analyzed in the lab and deemed possible for lemon growth based off its
qualities. Then the most appropriate type of lemons will be chosen for growth, options include Meyer,
Lisbon or any other type of lemons. Research will then be conducted on all factors necessary to initiate
a Lemon plantation using a per-acre basis. Discover the proper approach to fertilize, irrigate, and chose
pesticides that are compatible with the variety of lemon grown. The second phase will include
developing a cost analysis of both capital and production costs for the operation, to see whether the
project profitable. If this plan is feasible, the third phase is to research any potential problems that may
be encountered during the growing process. Calculations with current and past lemon markets will be
used to decide the possible profitability, as well as to plan for future problems with the market.
How Project Meets Requirements for the BRAE Major
Major Design Experience - The project must incorporate a major design experience. Design is the
process of devising a system, component, or process to meet specific needs. The design process
typically includes the following fundamental elements. Explain how this project will address these issues.
(Insert N/A for any item not applicable to this project.)
Establishment of
objectives and criteria
- This ASM senior project is realistic, and includes accurate data that can be
applied to a real life situation. This business plan has to be able to be

70
applied to actual lemon production.
Synthesis and analysis This project will enable the reader to learn the fundamental’s to initiate a
Lemons grove realistically and efficiently.
Construction, testing and
evaluation
This project will mainly focused on data collection; determining the required
information necessary to set up production. An accurate background of
research and information is crucial to get the expected result.
Incorporation of applicable
engineering standards
Capstone Design Experience - The engineering design project must be based on the knowledge and
skills acquired in earlier coursework (Major, Support and/or GE courses).
Incorporates
knowledge/skills from
earlier coursework
BRAE:
BRAE151 AutoCAD, BRAE 418-419 Agricultural System management,
BRAE 340 Irrigation Water Management, BRAE 237 Engineering Surveying
SUPPORT:
AGB 301 Food and Fiber Marketing, SS 151 Introduction to Soil Science
AGB 310 Credit and Finance, AGB 401 Ag Labor Relationship
Design Parameters and Constraints - The project should address a significant number of the
categories of constraints listed below. (Insert N/A for any area not applicable to this project.)
Physical Find the appropriate land that would fit for this project.
Economic Cost analysis to estimate to overall cost for this business plan, including the
capital cost and operational cost. Speculation of how things will change in
the future in terms of cost, and how to encounter it.
Environmental Help to prevent the global warming process and reduce air pollution by
growing significant numbers of plants.
Sustainability Design a plantation that helps to maintain the lemon supply in America,
specifically California.
Manufacturability Analyze the total estimation cost for this business plan using per acre basis.

71
Health and Safety Produce safe consumable products for society.
Ethical Follow all the laws that might be regulated by the government.
Social N/A
List of Tasks and Time Estimate
TASK
Research in library on establishing a plantation
Visit the subject property used in the project
Consultation with advisors and other sources
Research on materials and equipment requirements
Auto-Cad design for the orchard and other structures
Field testing for soil sample
Research on market trend for lemons
Writing report
Preparation for written report
TOTAL
Hours
10
8
10
28
16
4
8
60
30
_____
176
Financial Responsibility
Preliminary estimate of project costs: $ N/A
Finances approved by (signature of Project Sponsor): N/A
Final Report Due: June 7, 2013 Number of Copies: 2
Approval Signatures
Date
Student:
Project Supervisor:
Department Head:

72