Embed Size (px)
Citation preview
Business Process Comparison:A Methodology and Case Study
Alifah Syamsiyah1, Alfredo Bolt1, Long Cheng1, Bart F.A. Hompes1, R.P.Jagadeesh Chandra Bose2, Boudewijn F. van Dongen1, and Wil M.P. van der
Aalst1
1 Eindhoven University of Technology, The Netherlands{a.syamsiyah, a.bolt, l.cheng, b.f.a.hompes,
b.f.v.dongen, w.m.p.v.d.aalst}@tue.nl2 Xerox, India
Abstract. Business processes often exhibit a high degree of variability.Process variants may manifest due to the differences in the nature ofclients, heterogeneity in the type of cases, etc. Through the use of pro-cess mining techniques, one can benefit from historical event data to ex-tract non-trivial knowledge for improving business process performance.Although some research has been performed on supporting process com-parison within the process mining context, applying process comparisonin practice is far from trivial. Considering all comparable attributes, forexample, leads to an exponential number of possible comparisons. In thispaper we introduce a novel methodology for applying process compari-son in practice. We successfully applied the methodology in a case studywithin Xerox Services, where a forms handling process was analyzed andactionable insights were obtained by comparing different process variantsusing event data.
Keywords: Process Comparison · Process Mining · Business Analytics.
1 Introduction
Modern information systems and devices collect and store large amounts of eventdata. For instance, ERP systems record business transaction events, and high-tech systems such as X-ray machines record an abundance of events [10]. Suchhistorical event data can be used to extract non-trivial knowledge and interestinginsights that can be used for further analysis. Increasingly process mining tech-niques are used to analyze such data [20]. Process mining covers three types ofanalysis [19]: process discovery automatically extracts a process model from anevent log; conformance checking measures how well the behavior recorded in anevent log fits a given process model and vice versa; and process enhancement isconcerned with extending or improving an existing a-priori process model usingevent data.
2 Alifah Syamsiyah et al.
In process mining, process characteristics such as waiting times, through-put times, and utilization rates are typically of interest, and can be obtainedfrom real-life event data. Many processes exhibit a high degree of variability.There may be major differences between processes and their variants, due toan abundance of factors such as temporal changes, the geographical location ofthe process execution, the involved resources and the overall context in which aprocess is executed [1, 6]. In such scenarios, our research question is: how canwe conduct a comparative analysis of different processes and their variants inreal businesses? Based on the results of the analysis, we should be able to findthe differences between multiple processes and also find root causes for ineffi-ciencies such as delays and long waiting times for the interpretation of processbehaviors. Moreover, domain experts should also able to identify the preciseevents that correspond to unusual behavior, and consequently devise concretemeasures to improve their business processes [17].
In this paper, we present a methodology for business process comparison. Wedo so by presenting an overall methodology and an instantiation thereof in thecontext of a large service delivery organization: Xerox Services. This organiza-tion caters similar processes across several clients, hence process variants maymanifest due to the differences in the nature of clients, heterogeneity in the typeof cases, etc. Moreover, the organization’s operational Key Performance Indi-cators (KPIs) across these variants may widely vary. We show that, using ourmethod, we gain insights into the differences between variants and we leveragethese insights on non-performing variants by means of process comparison.
The highlighted contributions of this paper are as follows:
– Present a methodology for process comparison which focuses on the analy-sis of multiple processes. This methodology considers multiple perspectives,such as control flow, organizational, data, performance, etc.
– Validate the methodology in a case study using real-life data.
The remainder of this paper is organized as follows. In Section 2, we discussrelated work in process comparison and process mining methodologies. Then, weexplain the proposed process comparison methodology in Section 3 and applythe methodology in a case study in Section 4. Section 5 concludes the paper.
2 Related Work
In recent years, the value of process mining techniques has been demonstratedin case studies across different domains such as healthcare [11, 21, 25], industry[12, 13, 15], insurance [17], and finance [7, 8]. However, few methodologies havebeen proposed to carry out process mining projects in a structured manner. In[2], the Process Diagnostics Method (PDM) is proposed to quickly obtain a broadoverview of the process at hand, without the need for any domain knowledge.As such, it can be used to steer a process mining project by providing initialinsights and analysis opportunities. For example, the method has been adoptedfor the analysis of healthcare processes in [14]. In [19], the L* life-cycle model is
Business Process Comparison: A Methodology and Case Study 3
proposed as an approach for mining processes. L* covers many techniques, anddescribes the life-cycles of a typical process mining project aiming to improveprocesses. Since PDM focuses on providing a broad overview using a limitedset of process mining techniques and because L* is aimed at the analysis ofstructured processes, the authors of [23] proposed PM2: a Process Mining ProjectMethodology. PM2 is designed to support projects aiming to improve processperformance or compliance, and focuses on iterative analysis. Its applicabilitywas shown by a case study conducted on data provided by IBM. Like L*, PM2
covers a wide array of process mining techniques. Contrary to L*, however, PM2
is suitable for the analysis of both structured and unstructured processes.
A common pitfall of the discussed process mining methodologies is that thefocus is on the analysis of a single process, as mentioned in [23]. As such, pro-cess comparison remains an interesting but insufficiently researched topic. Thecomparison of processes based on event logs has been the focus of several papers[1, 4, 5, 18]. However, most process comparison approaches take into consid-eration only the control-flow aspect (i.e., presence, routing and frequency ofactivities), while ignoring other dimensions.
Given the increased interest in process comparison from perspectives otherthan just control flow, and the lack of methodological support for applying pro-cess comparison in a process mining project in practice, we propose The ProcessComparison Methodology (PCM). In this work, different from existing processmining methodologies, we introduce a novel methodology by considering multi-ple aspects, such as the organizational aspect (i.e. the involved resources, roles,and groups), the data aspect (attribute values), the performance aspect, etc. Wevalidate our methodology in a case study using real-life data provided by XeroxServices. To the best of our knowledge, this is the first work that methodologi-cally considers business process comparison from multiple perspectives.
3 The Process Comparison Methodology (PCM)
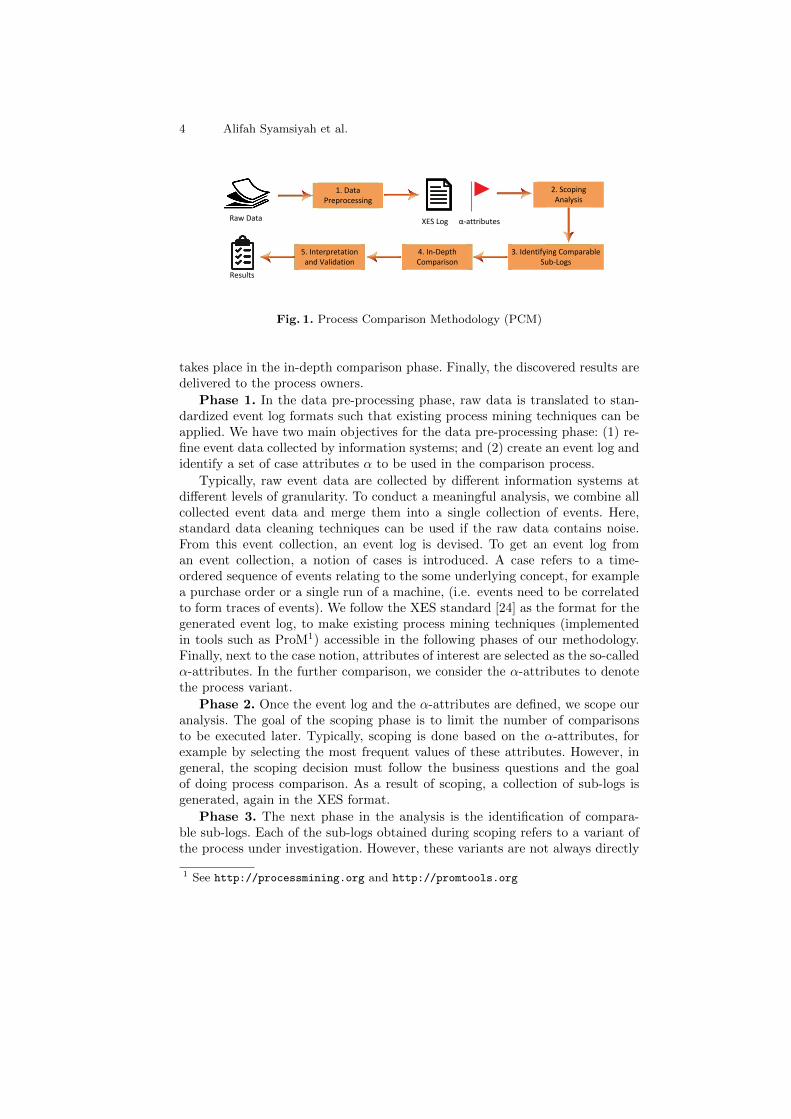
When comparing multiple processes, it is common that those processes have mu-tual attributes for categorization. When process comparison methods are appliedto highlight the differences between similar categorized processes, the results aremore detailed and representative than when comparing dissimilar or unrelatedprocesses. Based on these underlying assumptions, in this section, we introducea methodology for process comparison which considers many perspectives. Ourmethodology comprises of five main phases as depicted in Figure 1.
First, the data pre-processing phase transforms raw data to standardizedevent log formats such that existing process mining techniques can be applied.Next to the event logs, the so-called α-attributes are selected. These attributesare case-level attributes that identify the variants of interest. Next, in the scop-ing analysis phase, the interesting cases to be used for answering the analysisquestions are identified. In the third phase, comparable sub-logs are generatedby aggregating similar cases. Fine-grained analysis of the generated sub-logs
4 Alifah Syamsiyah et al.
1. Data Preprocessing
XES Log
2. Scoping Analysis
α‐attributes Raw Data
4. In‐Depth Comparison
3. Identifying Comparable Sub‐Logs
5. Interpretation and Validation
Results
Fig. 1. Process Comparison Methodology (PCM)
takes place in the in-depth comparison phase. Finally, the discovered results aredelivered to the process owners.
Phase 1. In the data pre-processing phase, raw data is translated to stan-dardized event log formats such that existing process mining techniques can beapplied. We have two main objectives for the data pre-processing phase: (1) re-fine event data collected by information systems; and (2) create an event log andidentify a set of case attributes α to be used in the comparison process.
Typically, raw event data are collected by different information systems atdifferent levels of granularity. To conduct a meaningful analysis, we combine allcollected event data and merge them into a single collection of events. Here,standard data cleaning techniques can be used if the raw data contains noise.From this event collection, an event log is devised. To get an event log froman event collection, a notion of cases is introduced. A case refers to a time-ordered sequence of events relating to the some underlying concept, for examplea purchase order or a single run of a machine, (i.e. events need to be correlatedto form traces of events). We follow the XES standard [24] as the format for thegenerated event log, to make existing process mining techniques (implementedin tools such as ProM1) accessible in the following phases of our methodology.Finally, next to the case notion, attributes of interest are selected as the so-calledα-attributes. In the further comparison, we consider the α-attributes to denotethe process variant.
Phase 2. Once the event log and the α-attributes are defined, we scope ouranalysis. The goal of the scoping phase is to limit the number of comparisonsto be executed later. Typically, scoping is done based on the α-attributes, forexample by selecting the most frequent values of these attributes. However, ingeneral, the scoping decision must follow the business questions and the goalof doing process comparison. As a result of scoping, a collection of sub-logs isgenerated, again in the XES format.
Phase 3. The next phase in the analysis is the identification of compara-ble sub-logs. Each of the sub-logs obtained during scoping refers to a variant ofthe process under investigation. However, these variants are not always directly
1 See http://processmining.org and http://promtools.org
Business Process Comparison: A Methodology and Case Study 5
comparable. They may, for example, consist of disjoint sets of activities. There-fore, in this phase, we select comparable variants (i.e. variants that have enoughcommonalities).
The identification of comparable sub-logs can be done in several ways. Forexample, we can use domain knowledge to manually select sub-logs to be com-pared. Alternatively, if domain knowledge is not available, clustering techniquescan be used to group sub-logs based on a quantifiable similarity notion [16].
Phase 4. After sets of comparable sub-logs are identified, we treat each setas the starting point for the in-depth comparison phase. In this process, the sub-logs in each set will be pairwise compared and the output of this phase will bea collection of observed and interesting differences between the input sub-logs.
For the in-depth comparison, the pairwise analysis of the sub-logs shouldoften not be limited to control flow only. Instead, other aspects of processes,such as performance characteristics, resource utilization and compliance aspectsshould be considered. Most importantly, the influence of these aspects on eachother should be investigated. For example, cases in which different resourceswere involved could have significantly different durations, which might be anactionable insight.
It should be noted that only the relevant and impactful differences are ofinterest to the process owner. For example, a difference in case duration of severalseconds may be irrelevant in processes where the average case duration is in theorder of days, while in processes that generally last minutes this difference canbe significant.
Phase 5. After completing the in-depth comparison for each cluster andhaving identified relevant and impactful differences, the relevant results will bebe reported to the process owner. We identify two activities for this phase:
1. Presentation and Interpretation. After the process mining analysis has beenperformed, we obtain facts about the process. Most of the time, these factsare raw and disconnected with each other. Therefore, to provide meaningfulinformation at the business level, an additional presentation and interpreta-tion step is needed. The significance of the results depends on how well theanalysis and interpretation step is executed.
2. Validation. The results from the in-depth comparison have to be validatedwith the process owner and participants in the process.
In the remainder of this paper, we show how this high-level methodology canbe executed in a concrete case study within Xerox. We use publicly availabletools and techniques on proprietary data and we closely involved the Xeroxstakeholders in the analysis.
4 Xerox Case Study
This section discusses the application of PCM on a case study conducted withinXerox Services. The study involved a real-life data set with millions of events.First, we explain the data set in terms of its structure and its origin, and give a
6 Alifah Syamsiyah et al.
1. Data Preprocessing
XES Log
2. Scoping Analysis
α-attributes
Log α1
Log αn
:
Cases in top n of attribute α
3a. Discovery
Log α1
Log αn
:
Raw Data
Model α1
Model αn
3b. Cross Comparison
:
Comparison Matrix
Log αz
Log αy
Log αx
4. In-Depth Comparison
3c. Clustering5. Interpretation and Validation
Process Mining Tool Results
Fig. 2. Process Comparison Methodology applied to a Xerox Dataset
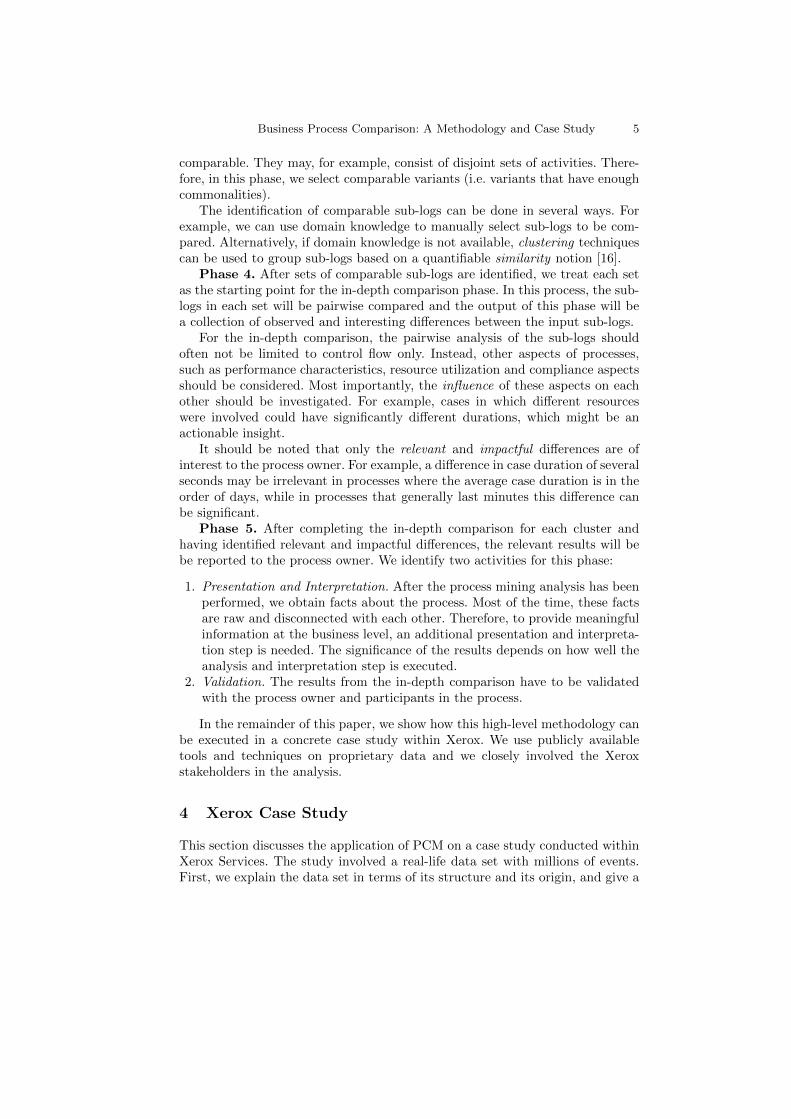
description of the process contained in it. Then, we present the application of ourproposed methodology in detail. As demonstrated in Figure 2, the instantiationof each phase in our application corresponds to the five phases in Figure 1,respectively. However, for the case study, the phase Identifying Comparable Sub-Logs is refined into three smaller phases here: Discovery, Cross Comparison, andClustering. This refinement choice is one of many ways to identify comparablesub-logs.
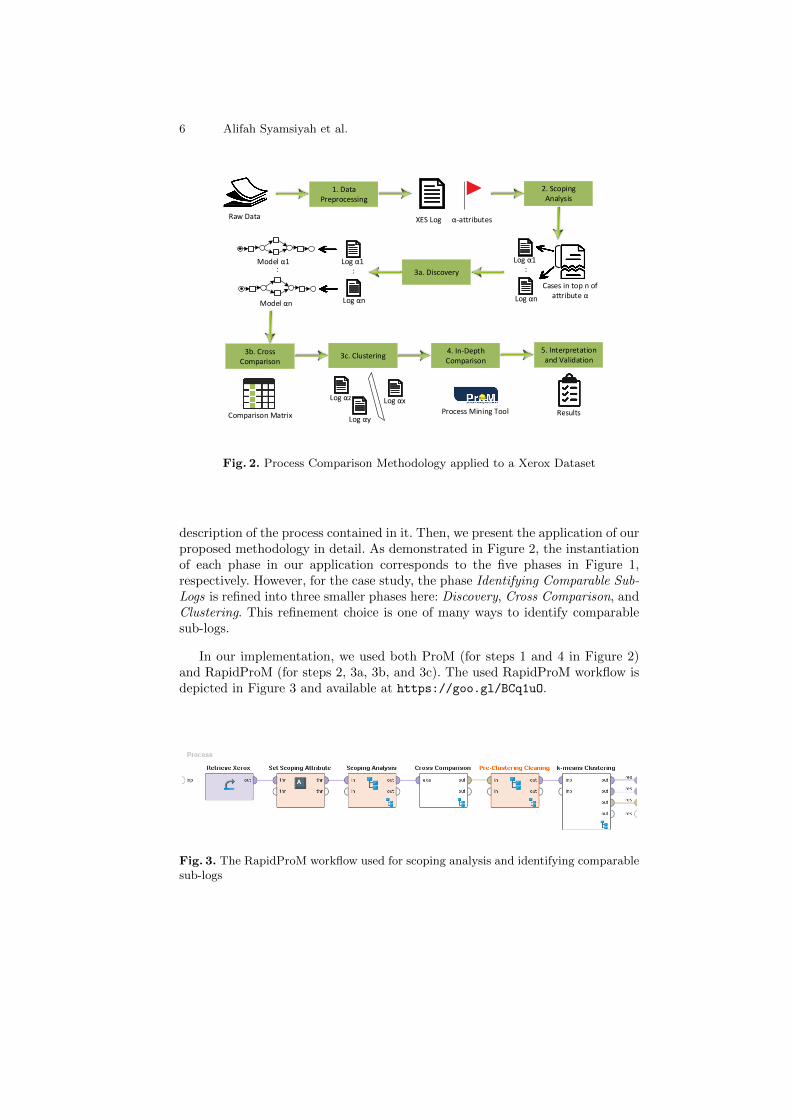
In our implementation, we used both ProM (for steps 1 and 4 in Figure 2)and RapidProM (for steps 2, 3a, 3b, and 3c). The used RapidProM workflow isdepicted in Figure 3 and available at https://goo.gl/BCq1uO.
Fig. 3. The RapidProM workflow used for scoping analysis and identifying comparablesub-logs
Business Process Comparison: A Methodology and Case Study 7
4.1 Data Set
We analyzed event logs pertaining to the transaction processing business unitwithin Xerox Services. More specifically, we analyzed the process pertaining tothe data entry back-office operations of insurance claim forms. Forms submittedto the insurance providers need to be digitized before the claims can be pro-cessed. Business Process Outsourcing (BPO) organizations assist the insuranceproviders in this process. Forms received by the BPO organization are classifiedand sorted depending on the type of form (e.g. HCFA, UB04, Dental, etc.). Morefine-grained classifications further refining each type are possible (e.g. HCFAstandard, HCFA careplus, etc.), thereby defining a taxonomy. Different classesin the taxonomy are divided into so-called batches, where each batch caters toone type of insurance claim form (e.g. HCFA standard).
A transaction refers to the data entry operations of one instance of an in-surance claim form. The organization handles data entry operations of millionsof such instances of insurance claim forms. In this paper, we only consider thetransactions of one month pertaining to one client, but the approach can beapplied to even larger data sets. Furthermore, different attributes concerningthe execution of events such as involved resourced and properties of the formsare recorded as well. The complete dataset used here contains information onhundred transactions comprising 20 million events divided across 94 batches.The organization is interested in analyzing the processes followed across differ-ent batches and wants to obtain insights on their executions. In this paper, wefocus on the analysis of three batches, where two are similar but not identicaland the third batch is different from the other two.
4.2 Data Preprocessing
We transformed the raw event data obtained as CSV file to a standard XESlog with the Convert CSV to XES plugin in ProM. To make this transformationmeaningful and successful, we have done the following three main pre-processingsteps. (1) We enriched the set of attributes based on anticipated questions. Sincewe are interested in analyzing different batches (see subsection 4.1), we set theattribute BATCHNAME as the α attribute to be used in comparison process. (2)We refined data into event level. Each activity in the input log includes twotimestamps, indicating its start and end point, therefore we divide each activityinto two events based on that. (3) We removed uninteresting/uncompleted casesfrom the log. Based on statistics on the start and end activities for all cases,we removed those case that have a start or end activity that does not appearfrequently enough. Through this process, we removed 318,002 cases, and theoutput XES log contains 936,720 cases and 31,660,750 events.
4.3 Scoping Analysis
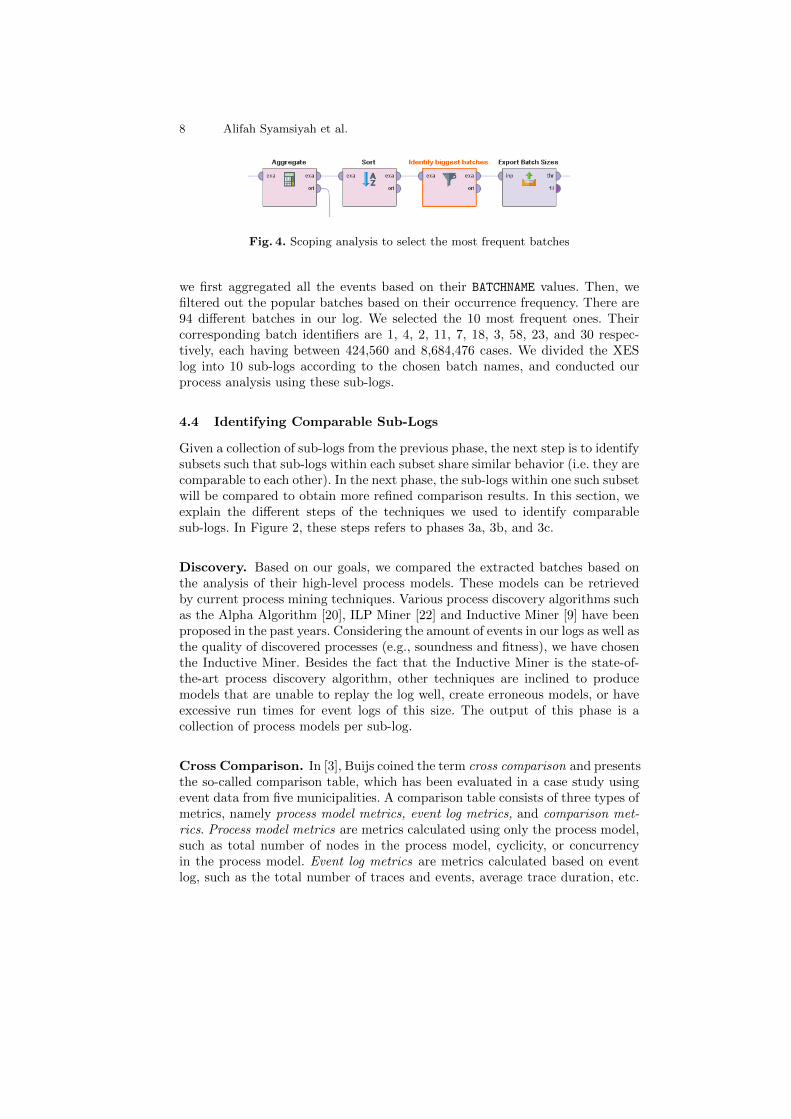
We implemented our scoping analysis using RapidProM (as depicted in Figure4) to select the interesting batches (batches that are infrequent will not be con-sidered in our analysis). For the generated XES log in the preprocessing phase,
8 Alifah Syamsiyah et al.
Fig. 4. Scoping analysis to select the most frequent batches
we first aggregated all the events based on their BATCHNAME values. Then, wefiltered out the popular batches based on their occurrence frequency. There are94 different batches in our log. We selected the 10 most frequent ones. Theircorresponding batch identifiers are 1, 4, 2, 11, 7, 18, 3, 58, 23, and 30 respec-tively, each having between 424,560 and 8,684,476 cases. We divided the XESlog into 10 sub-logs according to the chosen batch names, and conducted ourprocess analysis using these sub-logs.
4.4 Identifying Comparable Sub-Logs
Given a collection of sub-logs from the previous phase, the next step is to identifysubsets such that sub-logs within each subset share similar behavior (i.e. they arecomparable to each other). In the next phase, the sub-logs within one such subsetwill be compared to obtain more refined comparison results. In this section, weexplain the different steps of the techniques we used to identify comparablesub-logs. In Figure 2, these steps refers to phases 3a, 3b, and 3c.
Discovery. Based on our goals, we compared the extracted batches based onthe analysis of their high-level process models. These models can be retrievedby current process mining techniques. Various process discovery algorithms suchas the Alpha Algorithm [20], ILP Miner [22] and Inductive Miner [9] have beenproposed in the past years. Considering the amount of events in our logs as well asthe quality of discovered processes (e.g., soundness and fitness), we have chosenthe Inductive Miner. Besides the fact that the Inductive Miner is the state-of-the-art process discovery algorithm, other techniques are inclined to producemodels that are unable to replay the log well, create erroneous models, or haveexcessive run times for event logs of this size. The output of this phase is acollection of process models per sub-log.
Cross Comparison. In [3], Buijs coined the term cross comparison and presentsthe so-called comparison table, which has been evaluated in a case study usingevent data from five municipalities. A comparison table consists of three types ofmetrics, namely process model metrics, event log metrics, and comparison met-rics. Process model metrics are metrics calculated using only the process model,such as total number of nodes in the process model, cyclicity, or concurrencyin the process model. Event log metrics are metrics calculated based on eventlog, such as the total number of traces and events, average trace duration, etc.
Business Process Comparison: A Methodology and Case Study 9
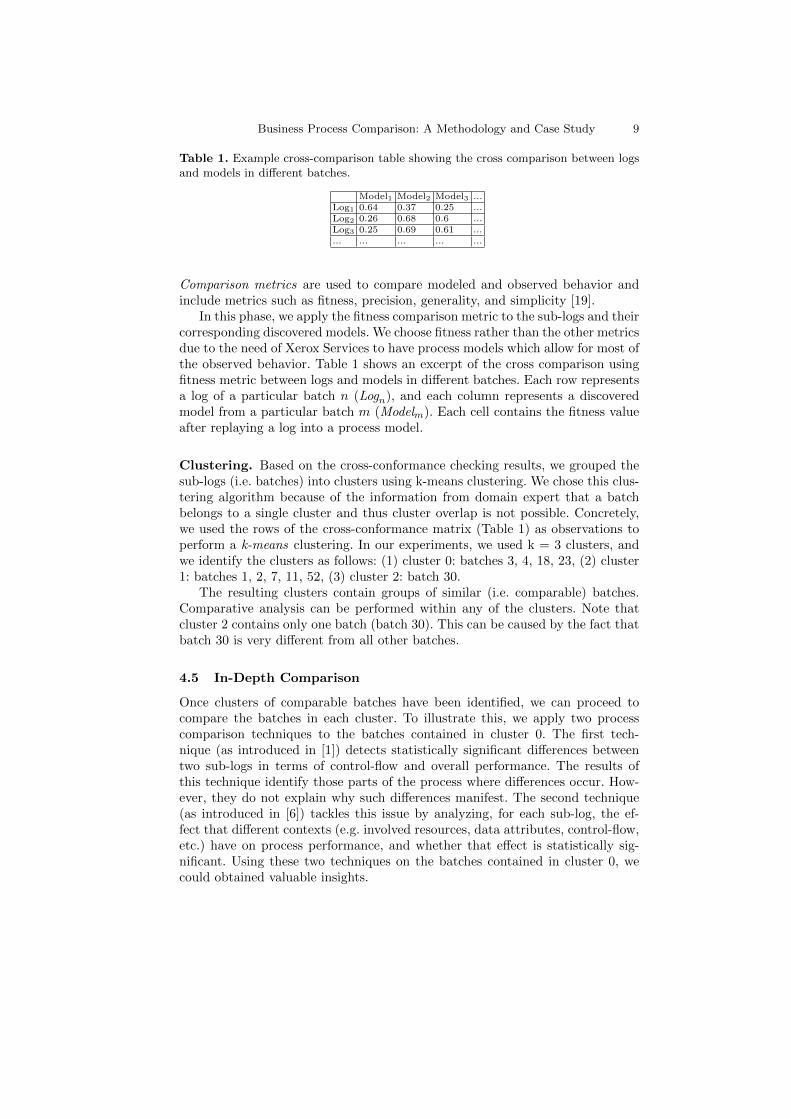
Table 1. Example cross-comparison table showing the cross comparison between logsand models in different batches.
Model1 Model2 Model3 ...Log1 0.64 0.37 0.25 ...Log2 0.26 0.68 0.6 ...Log3 0.25 0.69 0.61 ...... ... ... ... ...
Comparison metrics are used to compare modeled and observed behavior andinclude metrics such as fitness, precision, generality, and simplicity [19].
In this phase, we apply the fitness comparison metric to the sub-logs and theircorresponding discovered models. We choose fitness rather than the other metricsdue to the need of Xerox Services to have process models which allow for most ofthe observed behavior. Table 1 shows an excerpt of the cross comparison usingfitness metric between logs and models in different batches. Each row representsa log of a particular batch n (Logn), and each column represents a discoveredmodel from a particular batch m (Modelm). Each cell contains the fitness valueafter replaying a log into a process model.
Clustering. Based on the cross-conformance checking results, we grouped thesub-logs (i.e. batches) into clusters using k-means clustering. We chose this clus-tering algorithm because of the information from domain expert that a batchbelongs to a single cluster and thus cluster overlap is not possible. Concretely,we used the rows of the cross-conformance matrix (Table 1) as observations toperform a k-means clustering. In our experiments, we used k = 3 clusters, andwe identify the clusters as follows: (1) cluster 0: batches 3, 4, 18, 23, (2) cluster1: batches 1, 2, 7, 11, 52, (3) cluster 2: batch 30.
The resulting clusters contain groups of similar (i.e. comparable) batches.Comparative analysis can be performed within any of the clusters. Note thatcluster 2 contains only one batch (batch 30). This can be caused by the fact thatbatch 30 is very different from all other batches.
4.5 In-Depth Comparison
Once clusters of comparable batches have been identified, we can proceed tocompare the batches in each cluster. To illustrate this, we apply two processcomparison techniques to the batches contained in cluster 0. The first tech-nique (as introduced in [1]) detects statistically significant differences betweentwo sub-logs in terms of control-flow and overall performance. The results ofthis technique identify those parts of the process where differences occur. How-ever, they do not explain why such differences manifest. The second technique(as introduced in [6]) tackles this issue by analyzing, for each sub-log, the ef-fect that different contexts (e.g. involved resources, data attributes, control-flow,etc.) have on process performance, and whether that effect is statistically sig-nificant. Using these two techniques on the batches contained in cluster 0, wecould obtained valuable insights.
10 Alifah Syamsiyah et al.
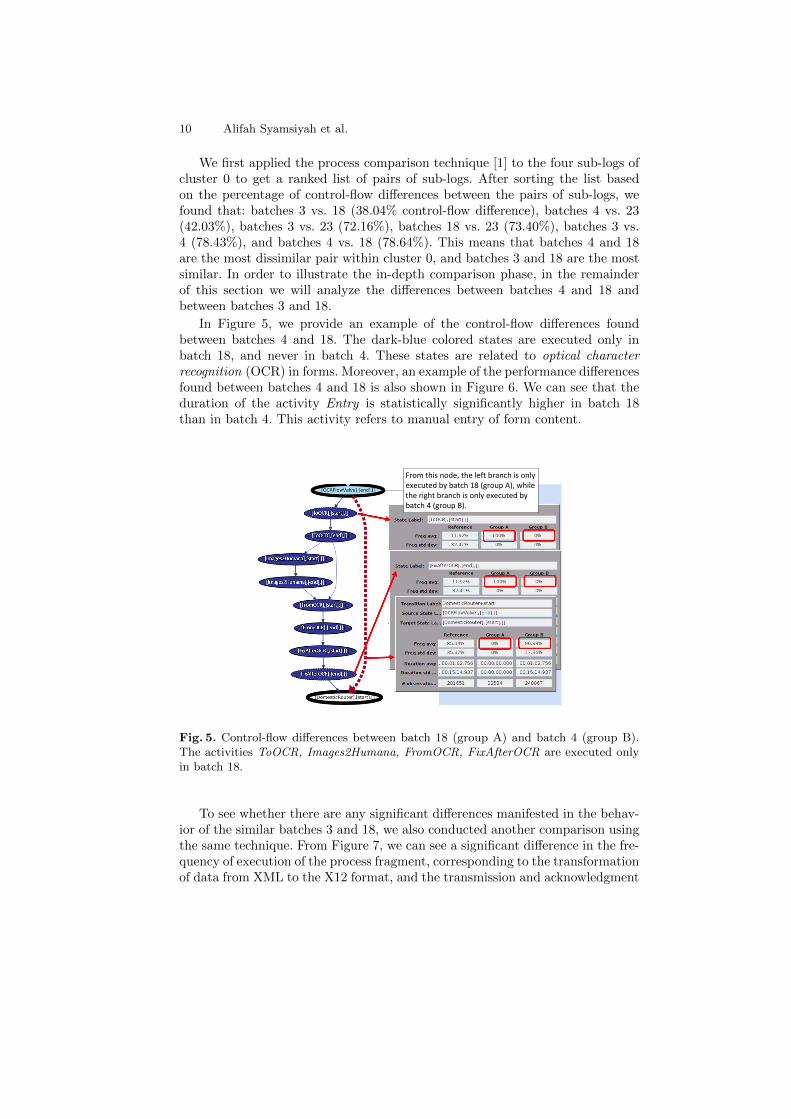
We first applied the process comparison technique [1] to the four sub-logs ofcluster 0 to get a ranked list of pairs of sub-logs. After sorting the list basedon the percentage of control-flow differences between the pairs of sub-logs, wefound that: batches 3 vs. 18 (38.04% control-flow difference), batches 4 vs. 23(42.03%), batches 3 vs. 23 (72.16%), batches 18 vs. 23 (73.40%), batches 3 vs.4 (78.43%), and batches 4 vs. 18 (78.64%). This means that batches 4 and 18are the most dissimilar pair within cluster 0, and batches 3 and 18 are the mostsimilar. In order to illustrate the in-depth comparison phase, in the remainderof this section we will analyze the differences between batches 4 and 18 andbetween batches 3 and 18.
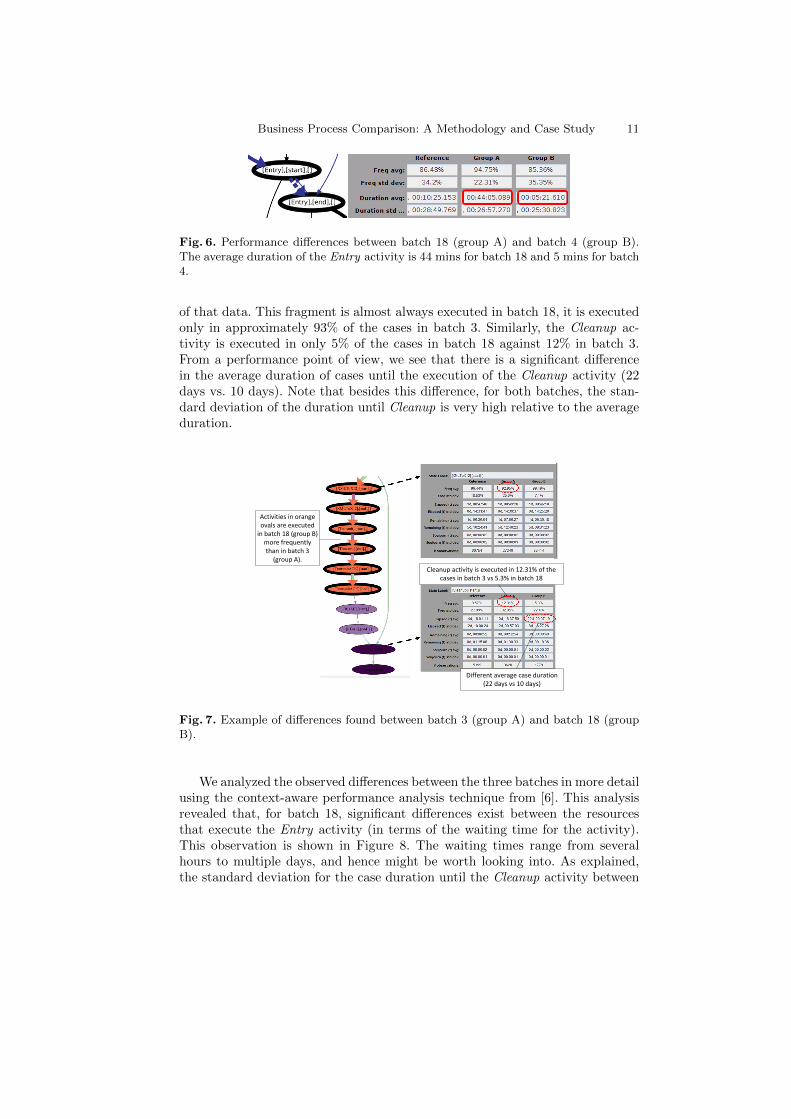
In Figure 5, we provide an example of the control-flow differences foundbetween batches 4 and 18. The dark-blue colored states are executed only inbatch 18, and never in batch 4. These states are related to optical characterrecognition (OCR) in forms. Moreover, an example of the performance differencesfound between batches 4 and 18 is also shown in Figure 6. We can see that theduration of the activity Entry is statistically significantly higher in batch 18than in batch 4. This activity refers to manual entry of form content.
.
From this node, the left branch is only executed by batch 18 (group A), while the right branch is only executed by batch 4 (group B).
Fig. 5. Control-flow differences between batch 18 (group A) and batch 4 (group B).The activities ToOCR, Images2Humana, FromOCR, FixAfterOCR are executed onlyin batch 18.
To see whether there are any significant differences manifested in the behav-ior of the similar batches 3 and 18, we also conducted another comparison usingthe same technique. From Figure 7, we can see a significant difference in the fre-quency of execution of the process fragment, corresponding to the transformationof data from XML to the X12 format, and the transmission and acknowledgment
Business Process Comparison: A Methodology and Case Study 11
Fig. 6. Performance differences between batch 18 (group A) and batch 4 (group B).The average duration of the Entry activity is 44 mins for batch 18 and 5 mins for batch4.
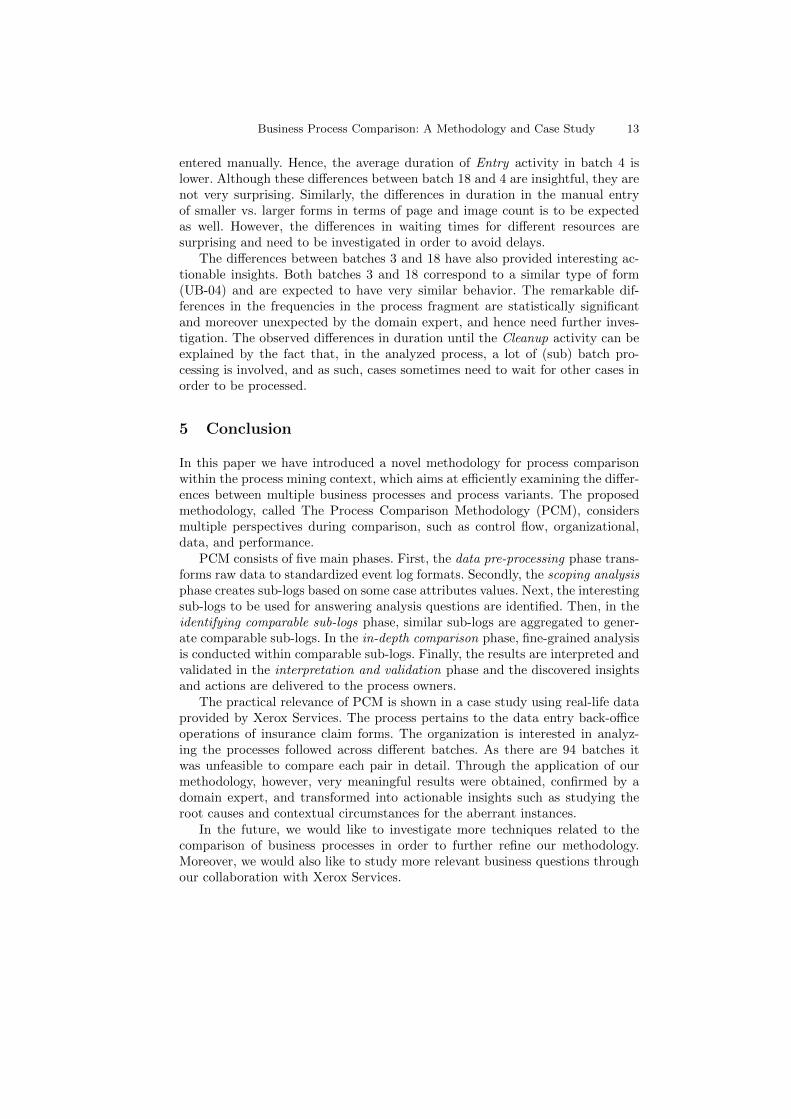
of that data. This fragment is almost always executed in batch 18, it is executedonly in approximately 93% of the cases in batch 3. Similarly, the Cleanup ac-tivity is executed in only 5% of the cases in batch 18 against 12% in batch 3.From a performance point of view, we see that there is a significant differencein the average duration of cases until the execution of the Cleanup activity (22days vs. 10 days). Note that besides this difference, for both batches, the stan-dard deviation of the duration until Cleanup is very high relative to the averageduration.
.
.
.
Activities in orange ovals are executed in batch 18 (group B) more frequently than in batch 3
(group A).
Cleanup activity is executed in 12.31% of the cases in batch 3 vs 5.3% in batch 18
Different average case duration (22 days vs 10 days)
Fig. 7. Example of differences found between batch 3 (group A) and batch 18 (groupB).
We analyzed the observed differences between the three batches in more detailusing the context-aware performance analysis technique from [6]. This analysisrevealed that, for batch 18, significant differences exist between the resourcesthat execute the Entry activity (in terms of the waiting time for the activity).This observation is shown in Figure 8. The waiting times range from severalhours to multiple days, and hence might be worth looking into. As explained,the standard deviation for the case duration until the Cleanup activity between
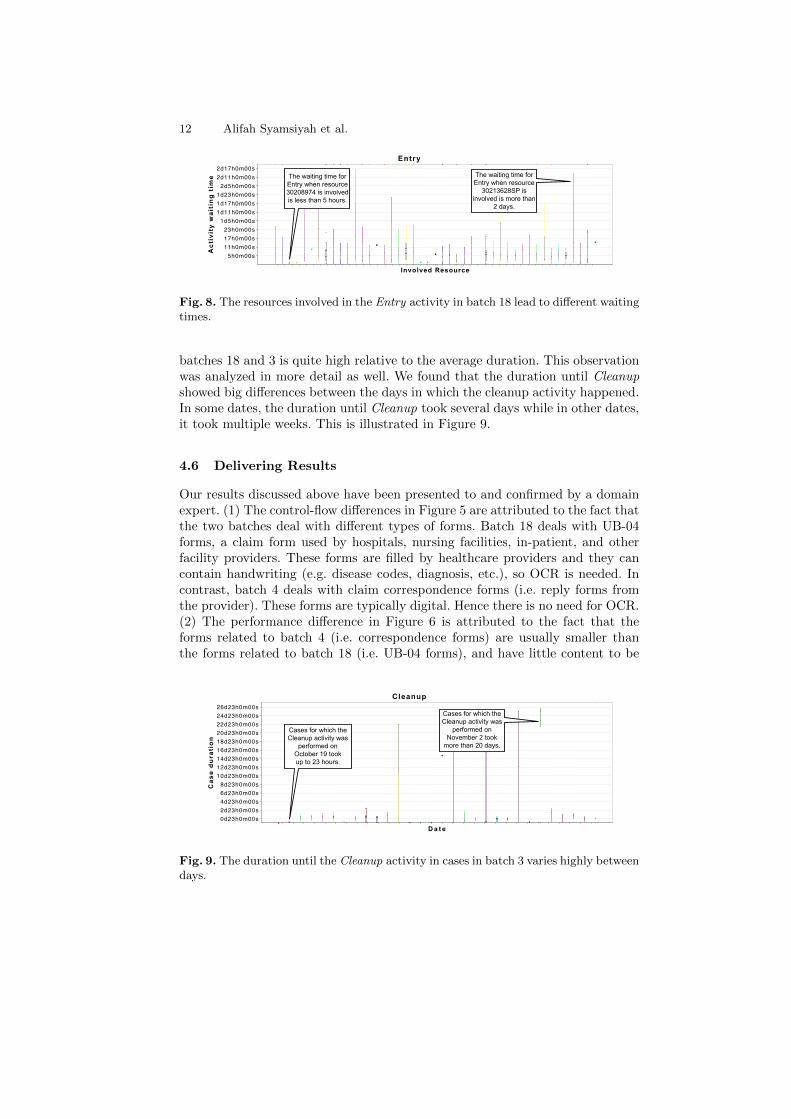
12 Alifah Syamsiyah et al.
Entry
Involved Resource
5h0m00s11h0m00s17h0m00s23h0m00s
1d5h0m00s1d11h0m00s1d17h0m00s1d23h0m00s
2d5h0m00s2d11h0m00s2d17h0m00s
Act
ivit
y w
aiti
ng t
ime The waiting time for
Entry when resource 30208974 is involved is less than 5 hours.
The waiting time for Entry when resource
30213628SP is involved is more than
2 days.
Fig. 8. The resources involved in the Entry activity in batch 18 lead to different waitingtimes.
batches 18 and 3 is quite high relative to the average duration. This observationwas analyzed in more detail as well. We found that the duration until Cleanupshowed big differences between the days in which the cleanup activity happened.In some dates, the duration until Cleanup took several days while in other dates,it took multiple weeks. This is illustrated in Figure 9.
4.6 Delivering Results
Our results discussed above have been presented to and confirmed by a domainexpert. (1) The control-flow differences in Figure 5 are attributed to the fact thatthe two batches deal with different types of forms. Batch 18 deals with UB-04forms, a claim form used by hospitals, nursing facilities, in-patient, and otherfacility providers. These forms are filled by healthcare providers and they cancontain handwriting (e.g. disease codes, diagnosis, etc.), so OCR is needed. Incontrast, batch 4 deals with claim correspondence forms (i.e. reply forms fromthe provider). These forms are typically digital. Hence there is no need for OCR.(2) The performance difference in Figure 6 is attributed to the fact that theforms related to batch 4 (i.e. correspondence forms) are usually smaller thanthe forms related to batch 18 (i.e. UB-04 forms), and have little content to be
Cleanup
D a t e0d23h0m00s2d23h0m00s4d23h0m00s6d23h0m00s8d23h0m00s
10d23h0m00s12d23h0m00s14d23h0m00s16d23h0m00s18d23h0m00s20d23h0m00s22d23h0m00s24d23h0m00s26d23h0m00s
Cas
e du
rati
on
Cases for which the Cleanup activity was
performed on October 19 took up to 23 hours.
Cases for which the Cleanup activity was
performed on November 2 took
more than 20 days.
Fig. 9. The duration until the Cleanup activity in cases in batch 3 varies highly betweendays.
Business Process Comparison: A Methodology and Case Study 13
entered manually. Hence, the average duration of Entry activity in batch 4 islower. Although these differences between batch 18 and 4 are insightful, they arenot very surprising. Similarly, the differences in duration in the manual entryof smaller vs. larger forms in terms of page and image count is to be expectedas well. However, the differences in waiting times for different resources aresurprising and need to be investigated in order to avoid delays.
The differences between batches 3 and 18 have also provided interesting ac-tionable insights. Both batches 3 and 18 correspond to a similar type of form(UB-04) and are expected to have very similar behavior. The remarkable dif-ferences in the frequencies in the process fragment are statistically significantand moreover unexpected by the domain expert, and hence need further inves-tigation. The observed differences in duration until the Cleanup activity can beexplained by the fact that, in the analyzed process, a lot of (sub) batch pro-cessing is involved, and as such, cases sometimes need to wait for other cases inorder to be processed.
5 Conclusion
In this paper we have introduced a novel methodology for process comparisonwithin the process mining context, which aims at efficiently examining the differ-ences between multiple business processes and process variants. The proposedmethodology, called The Process Comparison Methodology (PCM), considersmultiple perspectives during comparison, such as control flow, organizational,data, and performance.
PCM consists of five main phases. First, the data pre-processing phase trans-forms raw data to standardized event log formats. Secondly, the scoping analysisphase creates sub-logs based on some case attributes values. Next, the interestingsub-logs to be used for answering analysis questions are identified. Then, in theidentifying comparable sub-logs phase, similar sub-logs are aggregated to gener-ate comparable sub-logs. In the in-depth comparison phase, fine-grained analysisis conducted within comparable sub-logs. Finally, the results are interpreted andvalidated in the interpretation and validation phase and the discovered insightsand actions are delivered to the process owners.
The practical relevance of PCM is shown in a case study using real-life dataprovided by Xerox Services. The process pertains to the data entry back-officeoperations of insurance claim forms. The organization is interested in analyz-ing the processes followed across different batches. As there are 94 batches itwas unfeasible to compare each pair in detail. Through the application of ourmethodology, however, very meaningful results were obtained, confirmed by adomain expert, and transformed into actionable insights such as studying theroot causes and contextual circumstances for the aberrant instances.
In the future, we would like to investigate more techniques related to thecomparison of business processes in order to further refine our methodology.Moreover, we would also like to study more relevant business questions throughour collaboration with Xerox Services.
14 Alifah Syamsiyah et al.
Bibliography
[1] A. Bolt, M. de Leoni, and W.M.P. van der Aalst. A Visual Approach toSpot Statistically-Significant Differences in Event Logs Based on ProcessMetrics. In CAiSE, volume 9694, pages 151–166. Springer, 2016.
[2] M. Bozkaya, J. Gabriels, and J.M.E.M. van der Werf. Process Diagnostics:A Method Based on Process Mining. In A. Kusiak and S. Lee, editors,eKNOW 2009, pages 22–27. IEEE Computer Society, 2009.
[3] J.C.A.M. Buijs. Flexible Evolutionary Algorithms for Mining StructuredProcess Models. PhD thesis, TU Eindhoven, 2014 (cit. on p. 179), 2014.
[4] J.C.A.M. Buijs and H.A. Reijers. Comparing Business Process VariantsUsing Models and Event Logs. In BMMDS/EMMSAD, pages 154–168,2014.
[5] C. Cordes, T. Vogelgesang, and H. Appelrath. A Generic Approach forCalculating and Visualizing Differences Between Process Models in Multidi-mensional Process Mining. In BPM Workshops, volume 202, pages 383–394.Springer, 2015.
[6] Bart F. A. Hompes, Joos C. A. M. Buijs, and Wil M. P. van der Aalst. Ageneric framework for context-aware process performance analysis. In Onthe Move to Meaningful Internet Systems: OTM 2016 Conferences: Con-federated International Conferences: CoopIS, C&TC, and ODBASE 2016,Rhodes, Greece, October 24-28, 2016, Proceedings, pages 300–317. SpringerInternational Publishing, 2016.
[7] M. Jans, M. Alles, and M.A. Vasarhelyi. Process Mining of Event Logs inInternal Auditing: A Case Study. In ISAIS, 2012.
[8] M.J. Jans, M. Alles, and M.A. Vasarhelyi. Process Mining of Event Logs inAuditing: Opportunities and Challenges. Available at SSRN 2488737, 2010.
[9] S.J.J. Leemans, D. Fahland, and W.M.P van der Aalst. Discovering Block-Structured Process Models from Event Logs Containing Infrequent Be-haviour. In BPM, pages 66–78. Springer, 2013.
[10] S.J.J Leemans, D. Fahland, and W.M.P. van der Aalst. Scalable ProcessDiscovery with Guarantees. In BPMDS/EMMSAD, pages 85–101, 2015.
[11] R.S. Mans, H. Schonenberg, M. Song, W.M.P van der Aalst, and P.J.MBakker. Application of Process Mining in Healthcare - A Case Study in aDutch Hospital. In BIOSTEC, pages 425–438, 2008.
[12] Z. Paszkiewicz. Process Mining Techniques in Conformance Testing of In-ventory Processes: An Industrial Application. In BIS Workshop, pages 302–313, 2013.
[13] M. Puchovsky, C. Di Ciccio, and J. Mendling. A Case Study on the BusinessBenefits of Automated Process Discovery. In SIMPDA, pages 35–49, 2016.
[14] A. Rebuge and D.R. Ferreira. Business Process Analysis in Healthcare En-vironments: A Methodology Based on Process Mining. Inf. Syst., 37(2):99–116, 2012.
[15] A. Rozinat, I.S.M. de Jong, C.W. Gunther, and W.M.P. van der Aalst.Process Mining Applied to the Test Process of Wafer Scanners in ASML.IEEE Trans. Systems, Man, and Cybernetics, Part C, 39(4):474–479, 2009.
Business Process Comparison: A Methodology and Case Study 15
[16] M. Song, C.W. Gunther, and Wil M. P. van der Aalst. Trace Clustering inProcess Mining, pages 109–120. Springer Berlin Heidelberg, Berlin, Heidel-berg, 2009.
[17] S. Suriadi, M.T. Wynn, C. Ouyang, A.H.M. ter Hofstede, and N.J. vanDijk. Understanding Process Behaviours in a Large Insurance Company inAustralia: A Case Study. In CAiSE, pages 449–464. Springer, 2013.
[18] N.R.T.P. van Beest, M. Dumas, L. Garcıa-Banuelos, and M. La Rosa. LogDelta Analysis: Interpretable Differencing of Business Process Event Logs.In BPM, pages 386–405, 2015.
[19] W.M.P. van der Aalst. Process Mining - Data Science in Action. Springer,2016.
[20] W.M.P. van der Aalst, A.J.M.M. Weijters, and L. Maruster. WorkflowMining: Discovering Process Models from Event Logs. IEEE, 16(9):1128–1142, 2004.
[21] S. van der Spoel, M. van Keulen, and C. Amrit. Process Prediction in NoisyData Sets: A Case Study in a Dutch Hospital. In SIMPDA, pages 60–83,2012.
[22] J.M.E.M. van der Werf, B.F. van Dongen, C.A.J. Hurkens, and A. Sere-brenik. Process Discovery using Integer Linear Programming. Fundam.Inform., 94(3-4):387–412, 2009.
[23] M.L. van Eck, X. Lu, S.J.J. Leemans, and W.M.P. van der Aalst. PM2 : AProcess Mining Project Methodology. In CAiSE, pages 297–313. Springer,2015.
[24] H.M.W. Verbeek, J.C.A.M. Buijs, B.F. van Dongen, and W.M.P. vanDer Aalst. Xes, Xesame, and ProM 6. In CAiSE Forum, pages 60–75.Springer, 2010.
[25] Z. Zhou, Y. Wang, and L. Li. Process Mining Based Modeling and Analysisof Workflows in Clinical Care - A Case Study in a Chicago OutpatientClinic. In ICNSC, pages 590–595. IEEE, 2014.