Embed Size (px)
Citation preview

ww.sciencedirect.com
b i om a s s an d b i o e n e r g y 5 6 ( 2 0 1 3 ) 3 7 0e3 8 1
Available online at w
ht tp: / /www.elsevier .com/locate/biombioe
Business process mapping and discrete-eventsimulation of two forest biomass supply chains
Johannes Windisch a,*, Dominik Roser b, Blas Mola-Yudego c,Lauri Sikanen c, Antti Asikainen a
aFinnish Forest Research Institute, Jonesuu Research Unit, P.O. Box 68, FIN-80101 Joensuu, Finlandb FPinnovations, 2665 East Mall, Vancouver, BC V6T 1W5, CanadacUniversity of Eastern Finland, School of Forest Sciences, P.O. Box 111, FIN-80101 Joensuu, Finland
a r t i c l e i n f o
Article history:
Received 1 September 2011
Received in revised form
16 May 2013
Accepted 24 May 2013
Available online 22 June 2013
Keywords:
Supply chain management
Discrete-event simulation
Forest bioenergy
Organisation of work
Forest fuel procurement
* Corresponding author. Tel.: þ358 40 801 51E-mail address: johannes.windisch@metl
0961-9534/$ e see front matter ª 2013 Elsevhttp://dx.doi.org/10.1016/j.biombioe.2013.05.0
a b s t r a c t
Previous research in forest biomass procurement has been focussing on reducing
harvesting costs. However, organisation and management of supply chains as well are
considerable cost factors. The present study applies a methodological framework to
investigate two forest biomass supply chains in different operational environments of two
European countries (Finland and Germany) in order to identify the business processes and
stakeholders making up the supply chains using a business process mapping methodology.
Additionally, the work time expenditure for organisational and managerial tasks for each
of the supply chains is estimated using discrete-event simulations.
The business process mapping revealed that the number of processes in the supply
chains varies considerably involving 213 project objects (activities, information items,
others) in the Finnish supply chain and 268 in Germany. The work time expenditure
on managerial and organisational tasks assessed by discrete-event simulation was
1483 min/100 m3 in the Finnish and 1381 min/100 m3 in the German supply chain. Even
though the results of the study are company specific and cannot be directly generalized, as
each supply chain reflects the characteristics of its operational environment, the proposed
methodology has shown its potential for the in-depth analysis of supply chains in forest
business and it is a step towards holistic cost calculation and business process improve-
ment approaches on supply chain level.
ª 2013 Elsevier Ltd. All rights reserved.
1. Introduction
The essential role of wood-based bioenergy to meet the
ambitious targets of the European Union has been recognized
by European policy makers [1,2]. The existing forest resources
in the EU would allow a considerable increase of wood-based
bioenergy utilization when managed on a sustainable
basis [3e5]. Even though there is a large potential
of technically harvestable wood biomass, the economic
97.a.fi (J. Windisch).ier Ltd. All rights reserve22
availability is still a bottleneck at current market prices as has
been cited by numerous studies [6,7].
Closing the gap between technically harvestable and
economically available potential is the major task of research
on procurement of forest biomass for energy. In recent years
numerous studies have tried to offer solutions for this chal-
lenge using different approaches. For instance, different
alternatives to procure energywood in an economically viable
way to maximise forest owners’ profit and thus increase the
d.

b i om a s s a n d b i o e n e r g y 5 6 ( 2 0 1 3 ) 3 7 0e3 8 1 371
exploitation of energywood [8e10] through improvement
and adaptation of existing procurement systems, e.g. the
harvester-forwarder chain [11,12], and new, innovative tech-
nologies such as accumulating felling heads and the logging
residue bundling system [13,14], in order to lower procure-
ment costs by increasing the productivity of the machines.
Furthermore, transportation is a significant cost factor, com-
pounded by the fact that the transportation of forest biomass
is a major challenge due to the low density of raw material
[15]. Consequently, numerous studies have been published
investigating different transport and logistics chains to reduce
transport costs [16e18]. A further important field of research
in the context of forest technology is the mathematical
modelling and optimisation of supply chains. For instance,
Gunnarsson et al. [19] modelled a supply network to provide a
decision support tool for strategic and tactical planning for the
supply of forest fuel. Philpott and Graeme [20] developed an
optimisation model for solving tactical and strategic decision
problems in a paper supply chain.
However, an important issue concerns the overall organi-
sation of work flows in the supply chains. A quite common
example for this issue is the scheduling of machinery [21],
particularly trucks, which in many cases leaves space for
improvements. For example, a significant part of the delays in
chipper operations are caused by poor operational planning
[22,23] what underlines the crucial role of operational man-
agement and emphasises the role of research that addresses
the study of the whole organisation of the supply chain
instead of focussing on the individual machine. Addressing
the operation as a whole not only involves the improvement
of machine productivity and scheduling of machine opera-
tions, but also the structure of work input in terms of
personnel efforts and supporting technology. Recently
Windisch et al. [24] indicated that a considerable potential lays
in the reduction of work time expenditure in themanagement
and organisation of forest fuel procurement operations.
This necessarily implies to have a detailed knowledge
about the different business processes and stakeholders that
conform the forest fuel supply chain. In fact, the study of
bioenergy supply chains is extremely relevant as there is an
increasing demand for the transfer of technology and know-
how from well-established to emerging bioenergy markets.
In addition, knowledge about time consumption for organ-
isational and managerial tasks that are not part of the actual
production is essential in order to improve the overall effi-
ciency by minimising non-productive workload. However,
the large variability of the supply chains and working
environments in different regions across Europe pose a great
challenge that require the development of appropriate
methodological tools.
In this sense, a method to analyse and compare different
supply chains that can help to gain a more detailed insight is
the method of business process mapping [25]. This method
presents the ability to depict processes and procedures within
and across functional units which makes it a commonly used
tool for identifying starting points for subsequent improve-
ment approaches in many different sectors, for example:
construction [26,27], agriculture [28] and public organisations
[29]. The application of mapping methodologies for system
analyses has been used in different studies. Flow-charting, for
example, was used to describe the behaviour of decision
making processes [30], describe machine interaction [31] and
has been taken as a basis for simulation models. In supply
chain management, schematic supply chain or value stream
mapping methods are used, in most cases, to investigate the
flow of goods or services from raw material suppliers to end
customers without focussing on the particular processes
involved, particularly in large enterprises in the forest product
industry [32,33].
Nonetheless, the number of publications using detailed
business processmapping has been increasing during the past
decade. It is used for optimisation approaches in roundwood
supply chains [34,35], but also to analyse business processes of
the wood processing industry [36]. Although, on a lower level
of detail, Eberhardinger used this methodology to analyse
processes in biomass procurement chains [37]. Therefore, the
application of this method together with discrete-event
simulation is regarded as a progressive approach to investi-
gate forest biomass supply chains and to gain a deeper un-
derstanding of the various processes within.
The aim of this study is to provide a methodological
framework for the in-depth analysis of the structure and
functioning of forest fuel supply chains in different opera-
tional environments. The framework is to be applied to assess
the fuel supply chains in two case studies located in Finland
and Germany and should involve gathering the relevant in-
formation for the construction and analysis of business pro-
cess maps to identify all the processes and stakeholders
involved, the estimation of the times used in each activity
involved and the overall simulation for the assessment of the
supply chain.
2. Materials and methods
2.1. Overview of the supply chains
The investigated supply chain in Finland supplies a 1.2 MW
district heating plant in the city of Eno (ENO) in the region of
North Karelia. The supply chain is managed by a local forest
service company having the procurement of industrial
roundwood and energywood as their core business. The
company organises the whole procurement operation from
purchasing stands to delivering the chips to the plant using
local entrepreneurs. The local forestry centre Metsakeskus, a
public institution supporting private forest owners, assists in
finding suitable stands for energywood exploitation. The
chipping and transportation to the plant is done indepen-
dently by the contractor who is also responsible for plant
maintenance. Forest biomass from pre-commercial thinnings
makes up a major share of the supply. The average removal
per operation is 90 m3.
The supply chain in Germany is located in the southern
part, in the municipality of Feldkirchen-Westerham (FELD). It
supplies a local 1.5 MW district heating plant in the nearby
municipality of Glonn. Similar to the Finnish case, this plant is
run by a local cooperative which is an affiliated company of
the local forest owners association (FOA). The FOA is one of
the main suppliers of raw material to the plant.

Table 2 e Nomenclature of process objects used in thebusiness process maps.
Type Object Description
Activities Payment Transfer of money between
functional units
Communication Exchange of data and paper
documents by means of emails,
phone calls, oral conversations,
postings
Action Action are performed to fulfil sub
tasks in the process such as
creating maps, evaluating stands,
moving between work sites etc.
Information
items
Data Any kind of information produced
by an activity
Paper document Paper document produced by an
activity such as forms, contracts
etc. Can involve data produced
earlier in the process
Digital data
storage
E.g. a database or Excel file
Paper document
storage
Data stored in form of paper
documents
Others Decisions Decide the path the transaction
takes through the process when
different alternatives are given
Start of process Beginning of the process
End of process Endpoints of the process which
can be successful or unsuccessful
e.g. when the forest owner did not
accept the conditions set by the
forest service provider
Actor A company, institution or other
stakeholders in the process. Can
be made up of several functional
units or act as standalone
functional unit.
Functional
unit
E.g. an operations supervisor or
logging contractor. Carries out
activities in the process to fulfil
a specific task in the supply chain.
b i om a s s an d b i o e n e r g y 5 6 ( 2 0 1 3 ) 3 7 0e3 8 1372
In general, forest operations solely for energywood pro-
curement from pre-commercial thinnings are not common in
Germany (unlike in Finland). Therefore, raw materials for
forest fuel mainly are logging residues from integrated har-
vesting operations. The logging residues are procured by the
FOA and sold to the cooperative which takes care of the
chipping and transportation using local entrepreneurs. The
average removal per logging site is 150 m3. The biomass is
regarded as a by-product, and depending on the logging site it
makes up roughly 10% of the overall removal and the average
removal per operation is 150 m3. Concerning the calculations,
there is no distinction between assortments of merchantable
roundwood and logging residues.
2.2. Research material and processing
2.2.1. Process mappingThe data for the business process mapping was gathered
using expert interviews. The interviews followed a detailed
sequence of open questions and involved key actors in the
supply chains (Table 1). The sequence of data gatheringwas as
follows: First the exact tasks of the stakeholder were outlined.
Then the specific activities involved in them were discussed
step by step. Finally, the interactions with other stakeholders
in the supply chain were covered including dependencies and
contact points between stakeholders, points and methods of
communication and data exchange and sources for conflicts
and errors. Time was reserved for open discussion so that the
sequence of activities could be developed and discussed
jointly. After the first round of interviews the maps were
created using Sigmaflow� software.
The resulting business process maps were re-evaluated in
subsequent meetings with the interviewees. After this second
round of interviews, the maps were further developed and
corrections or details were added, when necessary, until there
was agreement that no more improvements could be made.
Finally, the information provided by the different stake-
holders was cross-checked to verify whether the resulting
interactions matched to each other.
As a starting point for the data processing, basic tech-
niques for business processmapping, as described by Damelio
[25], were used. The aim of the study includes the process
sequence itself as well as the communication and data
transfers between the functional units as well as payment
processes. Therefore, process maps presenting the flow of
data and information along the supply chain besides the
sequence of activities (Table 2) were developed. They were
produced with the software Sigmaflow� Mapper, as it
Table 1 e Functional units of which the personal wasinterviewed during the data collection.
FELD ENO
Logging Contractor Forest Authority
FOA Operations Supervisor Forest Service Company
FOA Accounting Office Logging Contractor
Chipping Contractor Chipping Contractor
MWB Sales Manager
MWB Logistics Manager
facilitates drawing and handling even comprehensive process
maps. It is part of the Sigmaflow� Modeller and Workbench
software package (www.sigmaflow.com). Silverstein et al. [38]
described this tool as business process improvement software
which enables the user to draw and analyse business process
maps and build discrete-event simulation models based on
the process maps.
2.2.2. Model buildingNaturally, the sequence of processes is relatively complex and
is influenced by various decisions and events occurring over
time. It constitutes a dynamic discrete system [39]. Therefore,
discrete-event simulation models were chosen in order to
determine the work time expenditure for managerial and
organisational tasks. After the development of the business
process maps, the mean time consumption for every single
activity was estimated by a panel of three experts from the
Finnish Forest Research Institute that have been working in
the field of forest fuel procurement in both countries. In the

Exploratoryinterviews to
determine actorsand functional
units
Collection of keyfigures of thesupply chains
Identification ofkey personnel
Expert interviewsand discussion onbusiness process
Drafting ofprocess maps
Evaluation,validation,
improvement withexperts
Maps valid?
Expert estimationson time
consumption peractivity
Building ofdiscrete-event
simulation models
Validation ofresults with
experts of thesupply chains
yes
no
Fig. 1 e Flowchart of the methodological steps taken during the analysis.
b i om a s s a n d b i o e n e r g y 5 6 ( 2 0 1 3 ) 3 7 0e3 8 1 373
first round, independent estimates were provided by the ex-
perts and the resulting values were analysed. If the deviation
among the estimates provided was higher than 100% (respect
the lowest value), the estimate was then discussed by the
experts and re-evaluated in the second round. Finally, as a
means of validation, all the estimates and the overall time
consumption per stakeholder were verified by the interviewed
experts of the supply chains analysed and corrections were
included if necessary (Fig. 1).
Based on the process object types activities, others and
functional units (Table 2) used in the process maps and the
expert estimates of the time consumption, a number of
object-oriented discrete-event simulation models were built
in order to determine the organisational andmanagerial work
load (OMWL). OMWL includes all activities that are related to
Fig. 2 e Example from the business process map
organisation and management of the supply chain and the
operations. Depending on the activity, random numbers were
generated according to different distributions. Communica-
tion activities, such as phone calls and personal conversa-
tions, were approached by using a left skewed Erlang
distribution with shape parameter k ¼ 3, based on Gans et al.
concerning lengths of phone calls [40]. The other activities
were approached by using normal distribution [39]. Since in
practice the time consumption of the different activities will
vary over a wide range, the standard deviation was set to
�25% of the mean.
For the simulations, 30 different random number streams
were used and for each random number stream 30e35 simu-
lations of an average stand were performed, resulting in over
1000 simulations in total. The software used for the model
of the supply chain studied in Eno (Finland).

b i om a s s an d b i o e n e r g y 5 6 ( 2 0 1 3 ) 3 7 0e3 8 1374
building and running the simulation was SigmaFlow� Mod-
eller. An independent model was constructed for each func-
tional unit of the supply chain, resulting in 21 different
models. Two additional models were constructed in order to
assess the following conditions:
� the overall OMWL of ENO and FELD when the OMWL of the
Forest Owner is left out of the simulation
� the OMWL of the functional units in FELD that are in charge
of managing and organising the supply chain.
The results for the OMWL are presented in min/100 m3.
However, the time consumption of many activities of the
business processes, such as payments and communication,
and also actions like creatingmaps andmoving betweenwork
sites are not affected by the procured volume. Therefore, the
OMWL is also given in min per operation.
3. Results
3.1. Structure of the supply chains
3.1.1. Eno (ENO)The ENO supply chain involves 6 different actors and 7 func-
tional units (Table 3). The local forest authority Metsakeskus
(Forest Authority) supports private forest owners in forest
management activities, supervises operations, and can sug-
gest forest areas to be harvested. The forest owners (Forest
Owner) decide to perform a forest management operation in
their forest, for instance a pre-commercial thinning, and
monitors the operations in this forest. The forest service
company (Forest Service Company) usually buys the assortment
as standing timber and takes care of planning and carrying out
of the procurement operation. Local entrepreneurs are con-
tracted for logging and forwarding (Logging Contractor) as well
as chipping and transportation of chips (Chipping Contractor).
The last actor in this supply chain is the district heating
cooperative which is the customer buying the chips. It is
represented by two functional units: The accounting office
(Accounting office) and the chairman of the cooperative
Table 3 e Grouping of functional units for the two supply chai
Group FELD
Actor Functional unit
FO Forest Owner Forest Owner
FA Forest Authority Forest Authority
FSP Forest Owners Association FOA Operations Superv
FOA Accounting Office
Timber Broker Timber Broker
CON Logging Contractor Logging Contractor
Chipping Contractor Chipping Contractor
Hauling Contractor Hauling Contractor
PLA MW Biomasse MWB Logistics Manage
MWB Sales Manager
MWB Plant Manager
MWB Accounting Offic
(Chairman). These two play an active role in the monitoring of
deliveries and payment of delivered chips. The accounting of
the chips is based on calorific value, like it is common practice
in Finland.
3.1.2. Feldkirchen-Westerham (FELD)The FELD supply chain involves 8 actors and 12 functional
units (Table 3). Like in ENO, the forest owner (Forest Owner) and
the local forest authority (Forest Authority) are involved in the
supply chain. The Forest Authority supports and monitors pri-
vate forest owners and their forest management activities.
If the Forest Owner decides to contract work to the local FOA,
the FOA operations supervisor (FOA Operations Supervisor)
takes over. In collaboration with the Forest Authority, the
FOA Operations Supervisor plans the treatment of the stand.
The operations are carried out by a local logging contractor
(Logging Contractor) which is contracted by the FOA Operations
Supervisor. Once the logging operation is completed, the tim-
ber broker (Timber Broker) measures both the roundwood and
energywood assortments in the forest. This procedure is used
to guarantee unbiased measurement by a neutral individual.
After the measurement the energy cooperative, in the form of
the logistics manager (MWB Logistics Manager), takes over. The
MWB Logistics Manager visits all energywood assortments on
offer, checks quality and volume and negotiates the purchase
price with the FOA Operations Supervisor. After the purchase,
the pile is added to the stock. TheMWB Logistics Supervisor is in
touch with the second functional unit of the cooperative: the
plant manager (MWB Plant Manager). When the bunker of the
plant needs to be refilled, theMWB Logistics Manager schedules
a suitable time with the chipping contractor (Chipping
Contractor) and the haulage company (Hauling Contractor).
Contrary to the supply chains in ENO, the responsibility for
the processing and transportation of chips lies with the chip
customer. When the chipping operation is finished, the
monitoring and accounting is done by the accounting office
(MWB Accounting Office) and sales manager of the energy
cooperative (MWB Sales Manager). The accounting office of the
FOA (FOA Accounting Office) monitors the incoming payment
and matches them with their database and finally pays the
Forest Owner and the Logging Contractor. The accounting of
ns analysed in FELD (Germany) and ENO (Finland).
ENO
Actor Functional unit
Forest Owner Forest Owner
Forest Authority Forest Authority
isor Forest Service Company Forest Service Company
Logging Contractor Logging Contractor
Chipping Contractor Chipping Contractor
Energy Cooperative Chairman
Accounting Office
r
e
PLAFO FSP CONFA
Finding stand
Negotiations and completion of contract
Preparation of logging
Logging
Logging follow-up
Payment to forest owner and logging
contractor
Preparation of chipping
Chipping and transport to plant
Chipping follow-up
Accounting for biomass
Supervision
Payment to chipping
contractor
Evaluation of calorific value
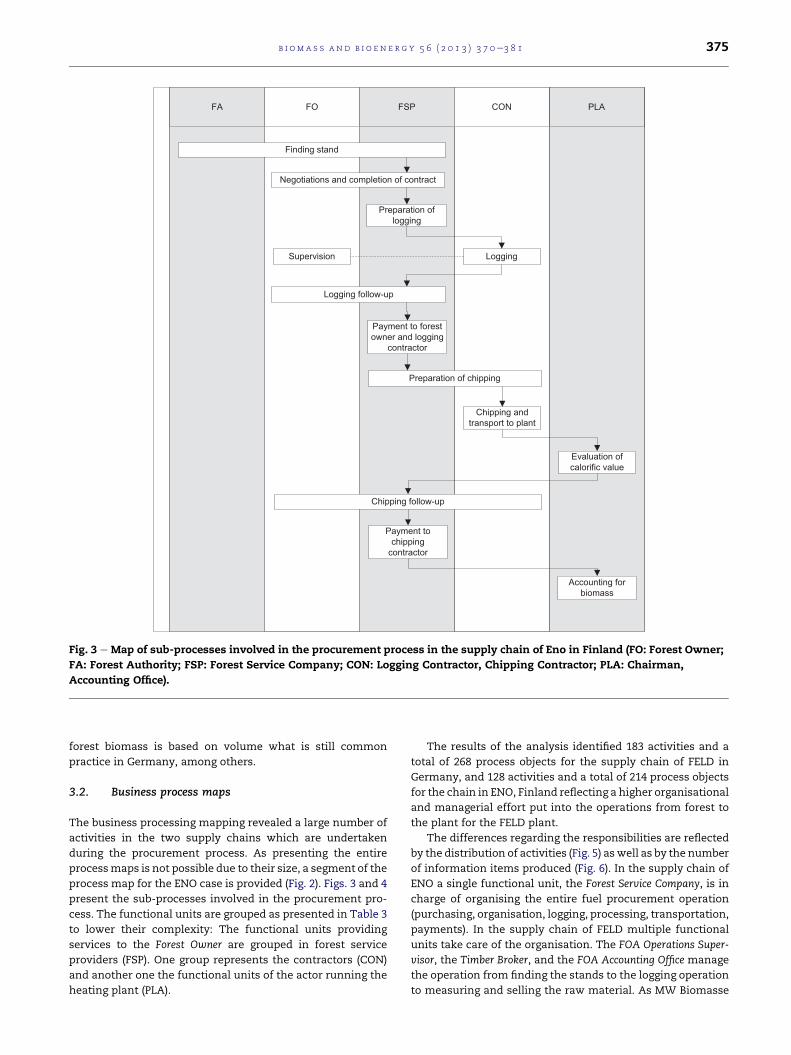
Fig. 3 e Map of sub-processes involved in the procurement process in the supply chain of Eno in Finland (FO: Forest Owner;
FA: Forest Authority; FSP: Forest Service Company; CON: Logging Contractor, Chipping Contractor; PLA: Chairman,
Accounting Office).
b i om a s s a n d b i o e n e r g y 5 6 ( 2 0 1 3 ) 3 7 0e3 8 1 375
forest biomass is based on volume what is still common
practice in Germany, among others.
3.2. Business process maps
The business processing mapping revealed a large number of
activities in the two supply chains which are undertaken
during the procurement process. As presenting the entire
processmaps is not possible due to their size, a segment of the
process map for the ENO case is provided (Fig. 2). Figs. 3 and 4
present the sub-processes involved in the procurement pro-
cess. The functional units are grouped as presented in Table 3
to lower their complexity: The functional units providing
services to the Forest Owner are grouped in forest service
providers (FSP). One group represents the contractors (CON)
and another one the functional units of the actor running the
heating plant (PLA).
The results of the analysis identified 183 activities and a
total of 268 process objects for the supply chain of FELD in
Germany, and 128 activities and a total of 214 process objects
for the chain in ENO, Finland reflecting a higher organisational
and managerial effort put into the operations from forest to
the plant for the FELD plant.
The differences regarding the responsibilities are reflected
by the distribution of activities (Fig. 5) aswell as by the number
of information items produced (Fig. 6). In the supply chain of
ENO a single functional unit, the Forest Service Company, is in
charge of organising the entire fuel procurement operation
(purchasing, organisation, logging, processing, transportation,
payments). In the supply chain of FELD multiple functional
units take care of the organisation. The FOA Operations Super-
visor, the Timber Broker, and the FOA Accounting Office manage
the operation from finding the stands to the logging operation
to measuring and selling the raw material. As MW Biomasse

PLAFO FSP CONFA
Finding stand
Negotiations and completion of contract
Negotiations and completion of contract
Preparation of loggingPreparation of logging
Logging
Manual measurement of
removal
Logging follow-up
Evaluation of quality and purchase
Preparation of chipping
Supervision
Chipping follow-up
Accounting for raw material and
chipping
Payment forest owner and logging
contractor
Supervision
Chipping and transport to plant
Fig. 4 e Map of sub-processes involved in the procurement process in the supply chain of Feldkirchen-Westerham in
Germany Germany (FO: Forest Owner; FA: Forest Authority; FSP: FOA Operations Supervisor, FOA Accounting Office, Timber
Broker; CON: Logging Contractor, Chipping Contractor, Hauling Contractor; PLA: MW Biomasse Logistics Manager, MW
Biomasse Sales Manager, MW Biomasse Plant manager, MW Biomasse Accounting Office).
b i om a s s an d b i o e n e r g y 5 6 ( 2 0 1 3 ) 3 7 0e3 8 1376
itself takes care of the biomass supply, the MWB Logistics
Manager, MWB Sales Manager and the MWB Accounting Office,
are involved in the organisation of the chipping operation and
the accounting of it. Taking this into consideration the num-
ber of activities occurring for the organisation and manage-
ment of the SC is 72 in ENO and 103 in FELD.
A noteworthy difference between the supply chains is that
forest owners in the Finnish supply chain are much more
involved in the forest operations compared to the German
one. Furthermore, the forest work carried out by the con-
tractors is usually done more independently and contractors
are given more responsibility than in Germany. For example,
the Logging Contractor in Finland has the final decision on
which trees are going to be cut whereas in Germany that de-
cision lies with the Forest Authority. Furthermore, in Germany
the logging sites are monitored on a daily basis by the FOA
Operations Supervisor and chipping operations by the MWB
Logistics Manager. This is one reason for a lower amount of
activities in the procurement process in ENO.
Fig. 7 gives an overview of the data exchanges between
the different functional units and the links between them. The
numbers shown are maxima, meaning that not all of these
exchanges are executed in every procurement operation.
For instance, if an operation runs without any errors and
failures the number can be significantly lower. The total
number of data exchanges per operation is 39 and 66 in ENO
and FELD, respectively.
3.3. Time consumption
The results showed that the overall average time consumption
of the organisational andmanagerial work load (OMWL) in ENO

Fig. 5 e Distribution of the number of activities, including
actions, communications and payments, by group of
functional units of Feldkirchen-Westerham (FELD) in
Germany (FO: Forest Owner; FA: Forest Authority; FSP: FOA
Operations Supervisor, FOA Accounting Office, Timber
Broker; CON: Logging Contractor, Chipping Contractor,
Hauling Contractor; PLA: MW Biomasse Logistics Manager,
MW Biomasse Sales Manager, MW Biomasse Plant
manager, MW Biomasse Accounting Office) and Eno (ENO)
in Finland (FO: Forest Owner; FA: Forest Authority; FSP:
Forest Service Company; CON: Logging Contractor,
Chipping Contractor; PLA: Chairman, Accounting Office).
Fig. 6 e Number of information items, including e.g. data,
paper documents, by group of functional units of
Feldkirchen-Westerham (FELD) in Germany (FO: Forest
Owner; FA: Forest Authority; FSP: FOA Operations
Supervisor, FOA Accounting Office, Timber Broker; CON:
Logging Contractor, Chipping Contractor, Hauling
Contractor; PLA: MW Biomasse Logistics Manager, MW
Biomasse Sales Manager, MW Biomasse Plant manager,
MW Biomasse Accounting Office) and Eno (ENO) in Finland
(FO: Forest Owner; FA: Forest Authority; FSP: Forest Service
Company; CON: Logging Contractor, Chipping Contractor;
PLA: Chairman, Accounting Office).
b i om a s s a n d b i o e n e r g y 5 6 ( 2 0 1 3 ) 3 7 0e3 8 1 377
and FELD is 1335 and 2071 min/operation, respectively (Fig. 8).
The simulations also demonstrated that the supply chain with
the highest number of functional units and activities involved
(FELD) also involves the highest OMWL. As the assortments
produced differ between the supply chains, the results of
calculating the OMWL per 100 m3 gives a slightly different
picture. While in ENO a work time input of 1483 min/100 m3 is
required, in FELD it amounts to 1381 min/100 m3 given the
higher output of the roundwood procurement operations.
The share of OMWL per grouping of functional units for
both supply chains (Fig. 8) showed a broader range in the case
of ENO. In this case, the Forest Service Company has the largest
share with a total of 710 min/operation (789 min/100 m3). The
organisational tasks carried out by the Forest Service Company
are taken care of by multiple functional units in FELD
grouped in FSP. If their shares of the OMWL are simulated
in a separate model, the result is 913 min/operation
(609 min/100 m3). The results also show that the Forest Owner
in ENO is more involved in the overall processes compared to
FELD. In addition the involvement of the Forest Authority in
FELD is higher due to the fact that the district forester is
marking stands before harvesting and acts as a mediator
between Forest Owner and Forest Owners Association. Also the
Logging Contractor’s involvement in FELD is higher than in
ENO due to higher organisational effort in the preparation of
the logging both in terms of communicating with all involved
stakeholders and practical arrangements of the harvesting
operation.
4. Discussion
This study focused on business process mapping and simu-
lation of forest operations which has not been carried out
earlier in this form. Nonetheless, the general study set up is
similar to earlier studies using discrete-event simulation as
demonstrated, for example, by Tolvanen-Sikanen et al. [30]
and Vaatainen et al. [31]. In these studies as well discrete-
event simulation models were developed on the basis of
process flowcharts. However, the focus of research in the
previous studies was centred on decision making in timber
buying processes and machine interaction, respectively. The
present study again focused on the investigation of business
processes.
There is a wide variability in the results of previous studies
related to the estimation of work load of state foresters.
While Baumann’s study resulted in a work load of only
270 min/100 m3 [35], Hug determined a much higher figure of
960 min/100 m3 [34]. When comparing similar functional
units, the results of this study for FELD and ENO are

a)
Forest service provider Contractors PlantForest owner/Forest
Authority
8
10
2
14
51
3
31
11
Forest service company
Forest owner Logging contractor
Forest authority
Energy cooperative chairman
Energy cooperative
accouting office
Chipping and transportation
contractor
b)
PlantContractorsForest service provider
Forest owner/Forest authority
57
5
5
1 4
1
1
1
1
42
24
1 1
99
21
1
Forest authority
Forest Owner
Timber broker
Forest owner association
accounting office
Forest owners association operation supervisor
Transportation contractor
Logging contractor
Chipping contractor
MW Biomasse plant manager
MW Biomasse sales manager
MW Biomasse logistics manager
MW Biomasse accounting office
Fig. 7 e Number of total data exchanges between the functional units of the supply chain in Eno (a) and Feldkirchen-
Westerham (b). The numbers shown are totals, meaning that not all of them are necessarily exchanged every time.
b i om a s s an d b i o e n e r g y 5 6 ( 2 0 1 3 ) 3 7 0e3 8 1378
606 min/100 m3 and 792 min/100 m3, respectively. It must be
taken into account that there are several differences in the
setup of the various supply chains that precludes a direct
comparison. For instance, in the FELD case energywood is only
a by-product of roundwood procurement from commercial
thinnings and final fellings, which covers the overall
procurement costs and makes the operation profitable. The
ENO case represents an energywood operation from young
stands with a significantly lower recovery per ha.
The analysis of forest energy supply chains is a challenge
due to the fact that forest energy operations are often inte-
grated into traditional roundwood harvesting operations as

0
500
1000
1500
2000
2500
3000
ENO FELD
OM
WL
(m
in/1
00m
3)
Case
Fig. 8 e Comparison of the organisational and managerial
work load (OMWL) in the supply chains of Feldkirchen-
Westerham in Germany (FELD) and Eno in Finland (ENO).
The high-low lines show the absolute minima and
maxima of the OMWL.
0
100
200
300
400
500
600
700
800
900
FO FA FSP CON PLA
OM
WL
(m
in/1
00
m3)
ENO
FELD
Fig. 9 e Organisational and managerial work load by group
of functional units in Feldkirchen-Westerham (FELD) in
Germany (FO: Forest Owner; FA: Forest Authority; FSP: FOA
Operations Supervisor, FOA Accounting Office, Timber
Broker; CON: Logging Contractor, Chipping Contractor,
Hauling Contractor; PLA: MW Biomasse Logistics Manager,
MW Biomasse Sales Manager, MW Biomasse Plant
manager, MW Biomasse Accounting Office) and Eno (ENO)
in Finland (FO: Forest Owner; FA: Forest Authority; FSP:
Forest Service Company; CON: Logging Contractor,
Chipping Contractor; PLA: Chairman, Accounting Office).
b i om a s s a n d b i o e n e r g y 5 6 ( 2 0 1 3 ) 3 7 0e3 8 1 379
was the case in FELD. This makes the analysis more complex
and furthermore a clear separation is not possible in many
cases. In the future, as the demand for forest biomass for
energy is increasing, it can be expected that biomass
increasingly will be procured from young stands. As such
operations are economically critical, supply chains with lean
and efficient business processes will be required.
Generally, the quality of the process maps strongly de-
pends on the knowledge and experience of the interviewees
and their awareness of the supply chain. Therefore, an itera-
tive interview process with experienced practitioners
involved in the actual operations was chosen as a means
of cross-validating the results and the time estimates.
Their strong involvement as data suppliers, observers, and
evaluators ensures a realistic picture of the real-life working
processes. Nonetheless, business process maps cannot show
the complete reality since the processes within supply chains
are highly flexible, among other reasons. This seems to be the
case particularly in small-scale district heating plants where a
lot of the work is shared between the different functional
units.
The study revealed interesting new results related to the
design and set up of supply chains in two different operational
environments. The investigation of the supply chains revealed,
for example that the number of activities carried out by the
Forest Owner in ENO exceeds FELD by one third. The OMWL is
even four times higher. This indicates that the Forest Owner’s
involvement with their forest is much larger in ENO and that
theyspendmoretimemonitoring theoperations intheir forests.
However, many of the activities carried out by the Forest
Owners, for example monitoring the logging and checking the
worksitesafter theoperations,arenotof immediate importance
for the operation itself. Nonetheless, they influence the overall
OMWL inENOconsiderably as canbe seen from thedistribution
in Fig. 9.When the Forest Owner’sOMWL isnot considered in the
simulation, the difference between the total OMWLs of ENO
(981 min/operation) and FELD (1986 min/operation) indicates a
higher work load in FELD, even when the higher volume recov-
ered is considered (ENO: 1090 min/100 m3, FELD: 1324 min/
100 m3). When these models are used for cost calculations it
must be considered whether taking the Forest Owner’s opportu-
nity costs into account ismeaningful and a careful analysis has
to be done which activities performed by the Forest Owner are
necessary from an operational point of view.
Finally, the use of process maps for the critical evaluation
of each process object is essential to answer the increasing
number of questions surrounding the more intensive use of
forest biomass for energy, as among others, the reasons of
certain operational environments to have less contributors
and stakeholders in the chain, the mechanisms involved in
the information flows among stakeholders, whether the
OMWL can be decreased by eliminating stakeholders and/or
by centralising responsibilities, and what are the potentials of
modern information and communication technologies to
improve the overall chain efficiency.
5. Conclusions
The present study investigated supply chains in two different
locations in European countries and provided a detailed
insight into their internal structure. The business process
mapping revealed considerable differences in the numbers of
activities and functional units involved in different opera-
tional environments. Additionally, the work expenditure

b i om a s s an d b i o e n e r g y 5 6 ( 2 0 1 3 ) 3 7 0e3 8 1380
related to managerial and organisational tasks defined as
organisational and managerial work load (OMWL) was inves-
tigated for the supply chains as a whole and for each of the
functional units. Although the maps are company specific,
both supply chains reflect the characteristics of their opera-
tional environments and can be used to analyse similarities
and differences between these.
The methods and results provided are essential for un-
derstanding the supply chain structure and can be used as a
basis for a modelling approach to develop lean business pro-
cesses for forest biomass procurement. Future research must
be addressed to improve the overall efficiency of supply
chains for forest biomass for energy, for example by imple-
menting a process re-engineering method.
Acknowledgements
The authors are in debt to all enterprises and entrepreneurs
who have provided their valuable time and data, especially
Metsapalvelu Turunen in Eno, Waldbesitzervereinigung
Holzkirchen, and MW Biomasse in Feldkirchen-Westerham.
Also, we would like to thank the help of METLA experts, in
particular Robert Prinz for his help with supplying estimates
for feeding the models. Furthermore, we would like to thank
Urpo Hassinen of Metsakeskus, Gerhard Bauer as well as
Klaus Kagerer of theWaldbesitzervereinigung Holzkirchen for
evaluating and validating the process maps and the expert
estimations on the OMWL.
r e f e r e n c e s
[1] CEC (Commission of the European Communities). Biomassaction plan. Communication from the commission. COM;2005. 628 final.
[2] CEC (Commission of the European Communities). EU actionagainst climate change e leading global action to 2020 andbeyond. Luxembourg: Office for Official Publications of theEuropean Communities; 2009.
[3] Alakangas E, Heikkinen A, Lensu T, Vesterinen P. Biomassfuel trade in Europe e summary report. VTT-R-03508-07.EUBIONET II-project. Jyvaslyla: VTT Technical ResearchCentre of Finland; 2007.
[4] Asikainen A, Liiri H, Peltola S, Karjalainen T, Laitila J. Forestenergy potential in Europe (EU27). Working papers of theFinnish Forest Research Institute No 69. Helsinki: FinnishForest Research Institute; 2008.
[5] Roser D, Asikainen A, Stupak I, Pasanen K. Forest energyresources and potentials. In: Roser D, Asikainen A, Raulund-Rasmussen K, Stupak I, editors. Sustainable use of forestbiomass for energy e a synthesis with focus on the Baltic andNordic region. Dodrecht: Springer; 2008.
[6] Nord-Larsen T, Talbot T. Assessment of forest-fuel resourcesin Denmark: technical and economic availability. BiomassBioenerg 2004;27:97e109.
[7] Ahtikoski A, Heikkila J, Alenius V, Siren M. Economic viabilityof utilizing biomass energy from young stands e the case ofFinland. Biomass Bioenerg 2008;32:988e96.
[8] Manley A, Richardson J. Silviculture and economic benefits ofproducing wood energy from conventional forestry systems
and measures to mitigate negative impacts. BiomassBioenerg 1995;9:89e105.
[9] Heikkila J, Siren M, Aijala O. Management alternatives ofenergy wood thinning stands. Biomass Bioenerg2007;31:255e66.
[10] Heikkila J, Siren M, Ahtikoski A, Hynynen J, Sauvula T,Lehtonen M. Energy wood thinning as a part of standmanagement of Scots Pine and Norway spruce. Silva Fenn2009;43(1):129e46.
[11] Nurmi J. Recovery of logging residues from spruce (Piceaabies) dominated stands. Biomass Bioenerg 2007;31:375e80.
[12] Laitila J. Harvesting technology and the cost of fuel chipsfrom early thinnings. Silva Fenn 2008;42(2):267e83.
[13] Spinelli R, Cuchet E, Roux P. A new feller-buncher forharvesting energy wood: results from a European testprogramme. Biomass Bioenerg 2007;31:205e10.
[14] Jylha P, Laitila J. Energy wood and pulpwood harvesting fromyoung stands using a prototype whole-tree bundler. SilvaFenn 2007;41(4):763e79.
[15] Hakkila P. Developing technology for large-scale productionof forest chips e Wood Energy Technology Programme1999e2004. Helsinki: Finnish National Technology Agency;2004.
[16] Palander T, Vaatainen J, Laukkanen S, Malinen J. Modellingbackhauling on Finnish energy-wood network usingminimizing of empty routes. Int J Forest Eng2004;15(2):79e84.
[17] Roser D, Mola-Yudego B, Sikanen L, Prinz R, Gritten D,Emer B, et al. Natural drying treatments during seasonalstorage of wood for bioenergy in different Europeanlocations. Biomass Bioenerg 2011;10:4238e47.
[18] Ranta T, Rinne S. The profitability of uncomminuted rawmaterials in Finland. Biomass Bioenerg 2006;30:231e7.
[19] Gunnarsson H, Ronnqvist M, Lundgren JT. Supply chainmodelling of forest fuel. Eur J Oper Res 2004;158:103e23.
[20] Philpott A, Graeme E. Supply chain optimisation in the paperindustry. Ann Oper Res 2001;108:225e37.
[21] Vaatainen K, Asikainen A, Eronen J. Improving the logisticsof biofuel reception at the power plant of Kuopio City. Int JForest Eng 2005;16(1):51e64.
[22] Spinelli R, Visser R. Analyzing and estimating delays in woodchipping operations. Biomass Bioenerg 2009;33:429e33.
[23] Roser D, Mola-Yudego B, Prinz R, Emer B, Sikanen L. Chippingoperations and efficiency in different operationalenvironments. Silva Fenn 2012;46(2):275e86.
[24] Windisch J, Sikanen L, Roser D, Gritten D. Supply chainmanagement applications for forest fuel procurement e costor benefit. Silva Fenn 2010;44(5):845e58.
[25] Damileo R. The basics of process mapping. New York:Productivity Press; 1996.
[26] Bashford H, Sawnhey A, Mund A, Walsh K. Process mappingof residential foundation slab construction processes. In:Yucesan E, Chen CH, Snowdon J, Charnes J, editors.Proceedings of the 2002 winter simulation conference 2002.p. 1752e60.
[27] Cheng MY, Tsai MH, Sutan W. Benchmarking-based processreengineering for construction management. AutomatConstr 2009;18:605e23.
[28] Bevilacqua M, Ciarapica F, Giacchetta G. Business processreengineering of a supply chain and a traceability system: acase study. J Food Eng 2009;93:13e22.
[29] Greasly A. Using process mapping and business processsimulation to support a process-based approach to changein a public sector organisation. Technovation2006;26:95e103.
[30] Tolvanen-Sikanen T, Sikanen L, Harstela P. A game theoreticsimulation model for quality oriented timber supply tosawmills. Silva Fenn 1995;29(1):71e86.

b i om a s s a n d b i o e n e r g y 5 6 ( 2 0 1 3 ) 3 7 0e3 8 1 381
[31] Vaatainen K, Liiri H, Roser D. Cost-competitiveness ofharwarders in CTL-logging conditions in Finland e adiscrete-event simulation study at the contractor level. In:Ackermann PA, Langin DW, Antonides MC, editors. Precisionforestry in plantations, semi-natural forests. Proceedings ofthe international precision forestry symposium.Stellenbosch: Stellenbosch University; 2006. p. 451e63.
[32] Haartveit E, Kozak R, Maness T. Supply chain managementmapping for the forest products industry: three cases fromWestern Canada. JFPBR 2004;1(5):1e30.
[33] Cohen D, Kozak R. Mapping the value chain of SMEs in theforest products industry. Report to Environment Canada andthe Canadian Forest Service; 2006.
[34] Hug J. Optimierung von Geschaftsprozessen in derForstwirtschaft durch den Einsatz vonInformationstechnologie am Beispiel der Holzbereitstellungauf Revierebene [Optimisation of business processes inforestry through the usage of information technology usingthe example of the wood procurement on district level].Freiburg: Albert-Ludwig-University Freiburg; 2004.
[35] Baumann T. Analyse logistischer Prozesse und derenOptimierungspotentiale entlang der Holzbereitstellungskettevom Wald zum Werk unterstutzt durch spezielle Verfahrender Prozessmodellierung e Durchgefuhrt am Beispielverschiedener Forst- und Holzbetriebe in der Region Ostalb
(Baden-Wurttemberg) [Analysis of logistical processes andtheir optimisation potential along the wood supply chainfrom forest to the mill supported by special procedures ofprocess modelling e conducted using the example ofdifferent forest and wood companies in the Region Ostalb(Baden-Wurttemberg)]. Freiburg: Albert-Ludwig-UniversityFreiburg; 2008.
[36] Hoem L, Haartveit EY. Mapping the distribution channel forsolid wood products. In: NSR conference on forestoperations 2004-Proceedings. Silva Carelica 2004;vol. 45.p. 159e65.
[37] Eberhardinger A, Warkotsch W, Zormaier F, Schardt M,Huber T, Zimmer B. Prozessanalyse und Okobilanzierung derBereitstellung von Walkdhackgut [Process analysis andecobalancing of forest fuel procurement]. Freising: Chair ofForest Work Science and Applied Computer Science of theTU Munich; 2009.
[38] Silverstein D, Samuel P, DeCarlo N. The Innovators Toolkit.50þ techniques for predictable and sustainable organicgrowth. Hoboken: John Wiley & Sons; 2008.
[39] Banks J, Carson II JS, Nelson BL, Nicol DM. Discrete-eventsystem simulation. 5th ed. Pearson Education Inc.; 2010.
[40] Gans N, Koole G, Mandelbaum A. Telephone call centers:tutorial, review, and research prospects. M&SOM2003;5(2):79e141.