Embed Size (px)
Citation preview

BusinessResearch Methods
Introduction to Data Analysis
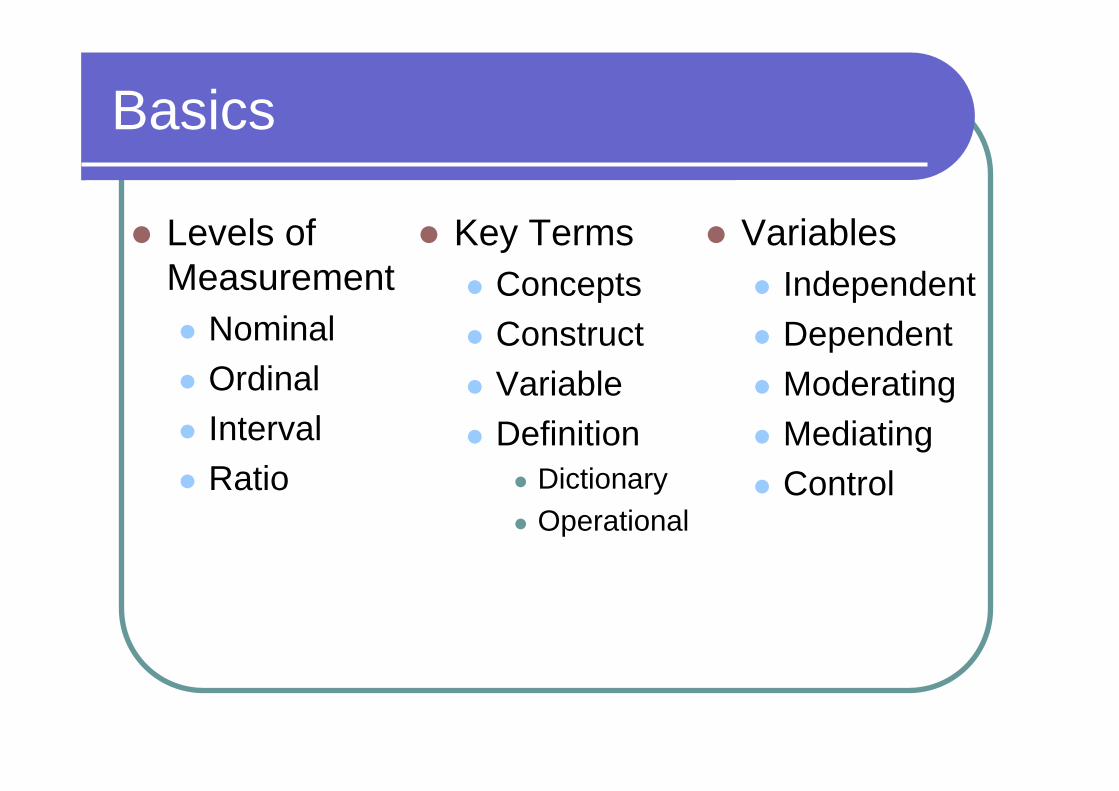
Basics
Levels of Measurement Nominal Ordinal Interval Ratio
Variables Independent Dependent Moderating Mediating Control
Key Terms Concepts Construct Variable Definition
Dictionary Operational
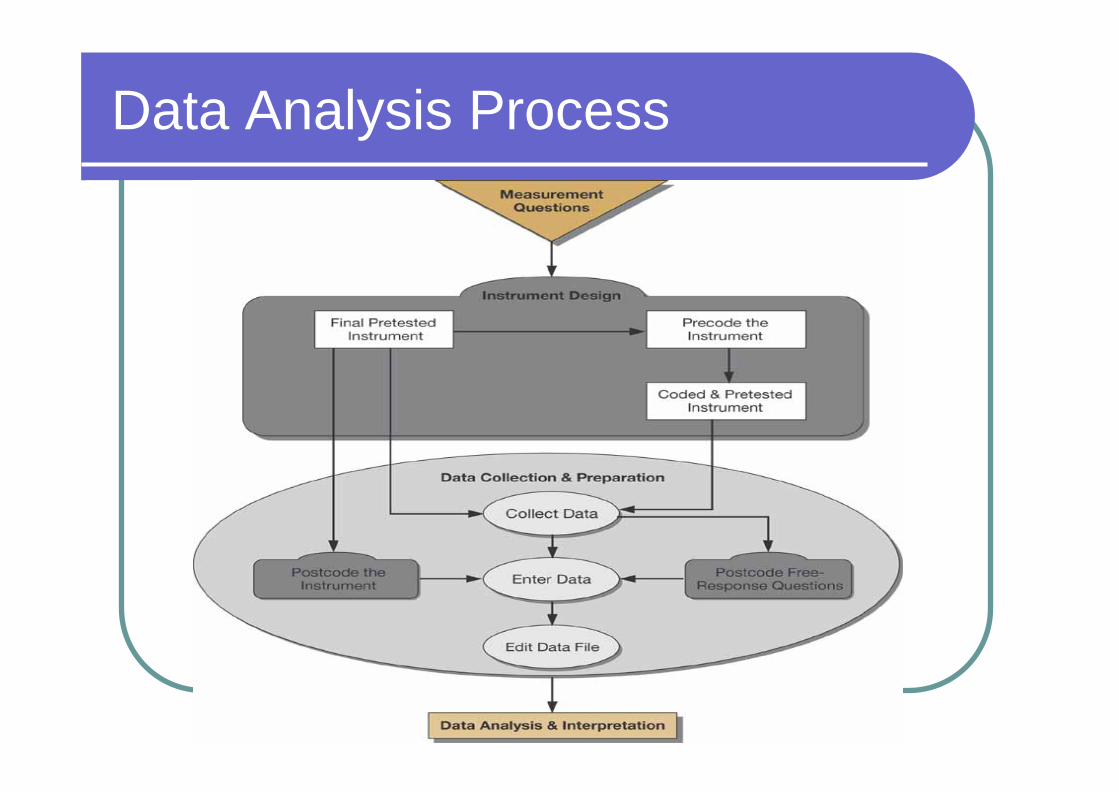
Data Analysis Process
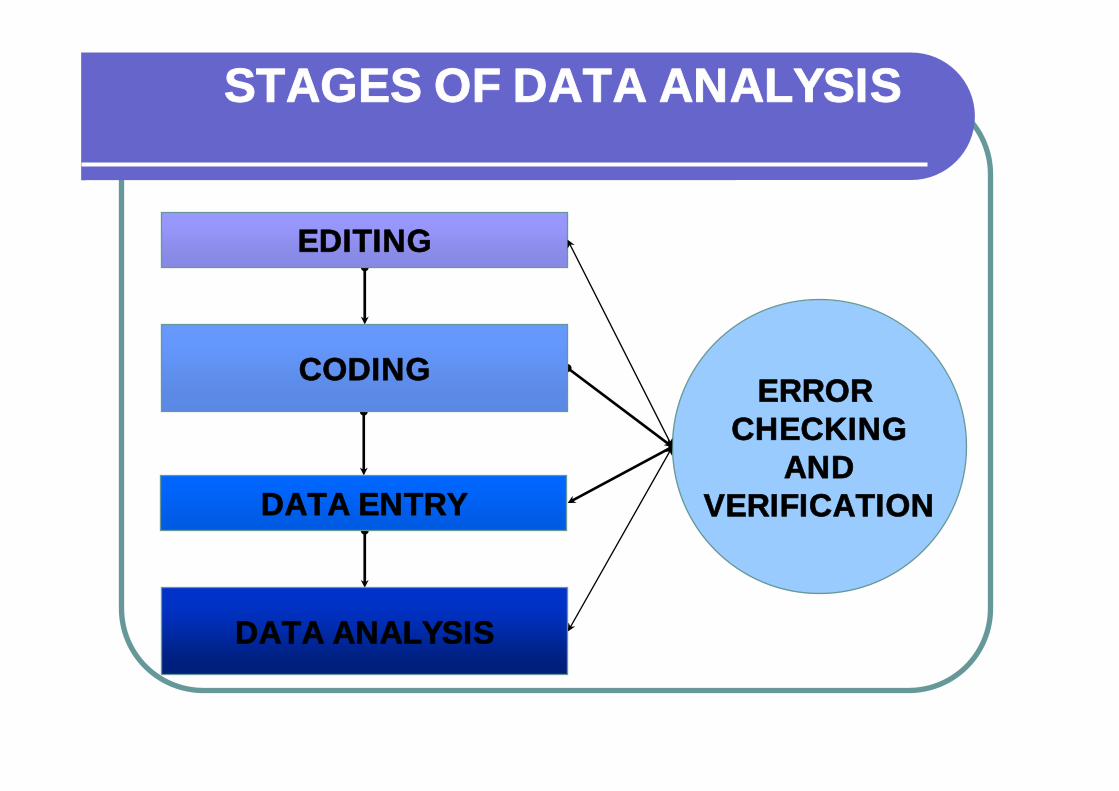
DATA ANALYSIS
DATA ENTRY
STAGES OF DATA ANALYSIS
ERROR CHECKING
ANDVERIFICATION
CODING
EDITING
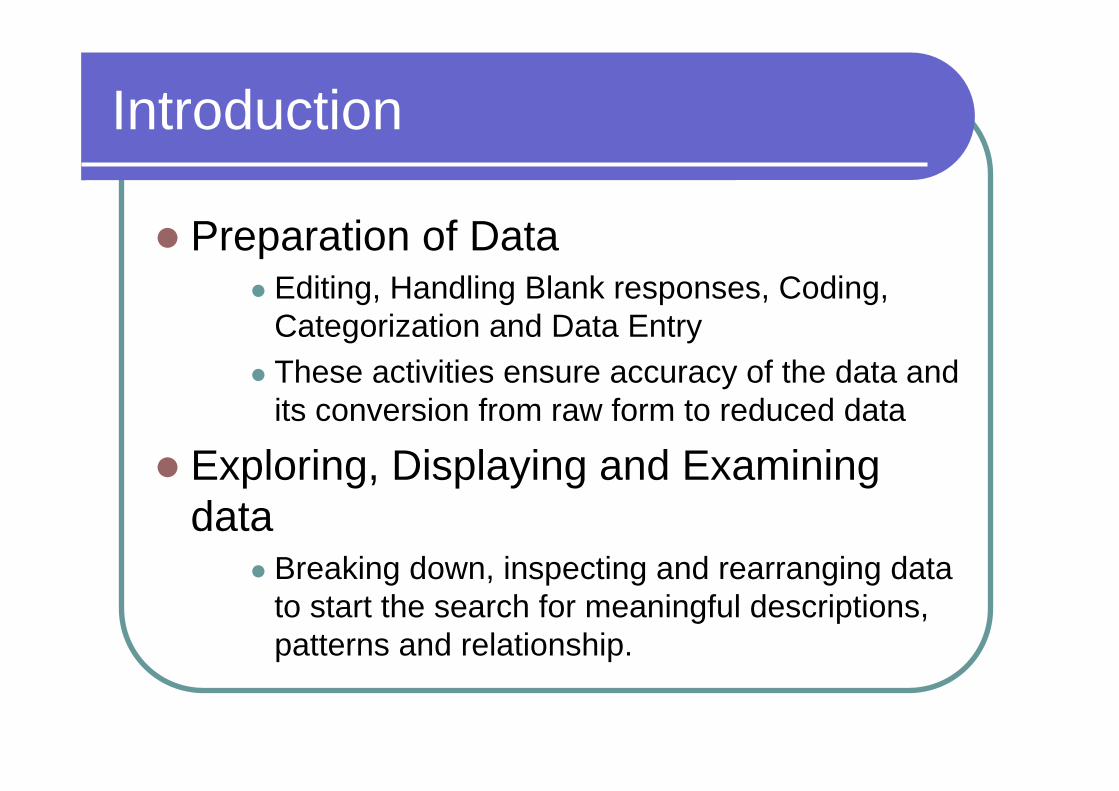
Introduction
Preparation of Data Editing, Handling Blank responses, Coding,
Categorization and Data Entry These activities ensure accuracy of the data and
its conversion from raw form to reduced data
Exploring, Displaying and Examining data
Breaking down, inspecting and rearranging data to start the search for meaningful descriptions, patterns and relationship.
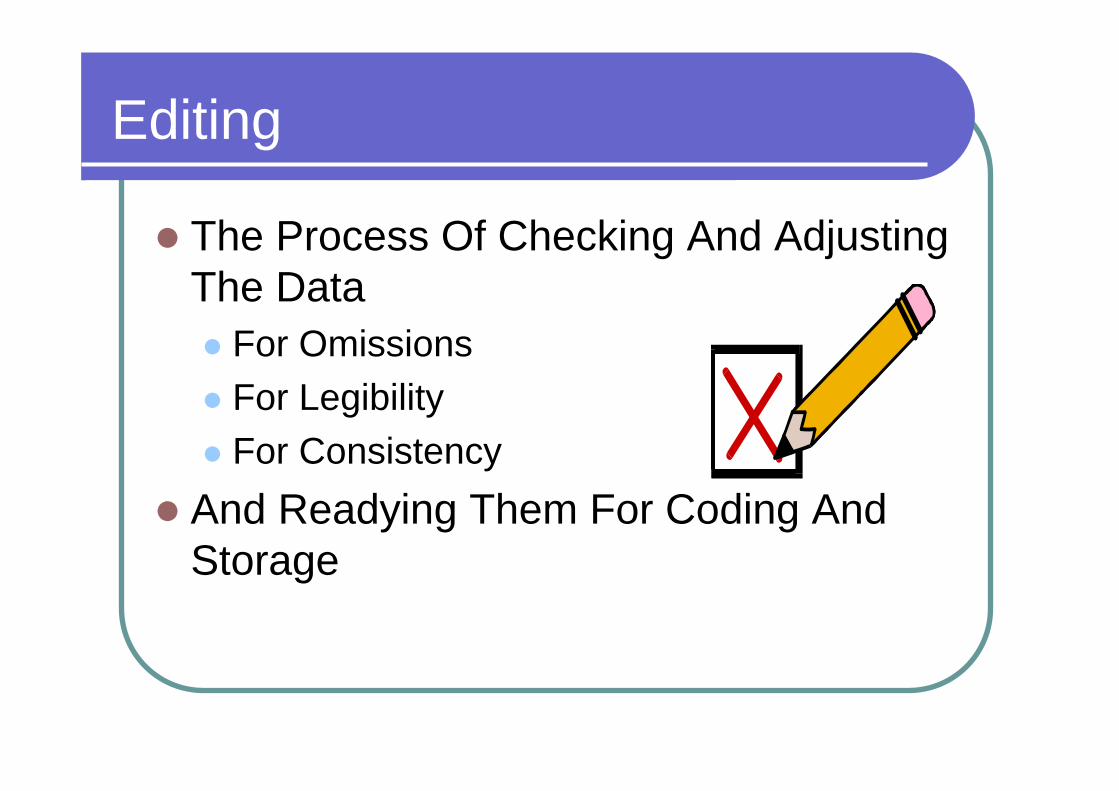
Editing
The Process Of Checking And Adjusting The Data For Omissions For Legibility For Consistency
And Readying Them For Coding And Storage
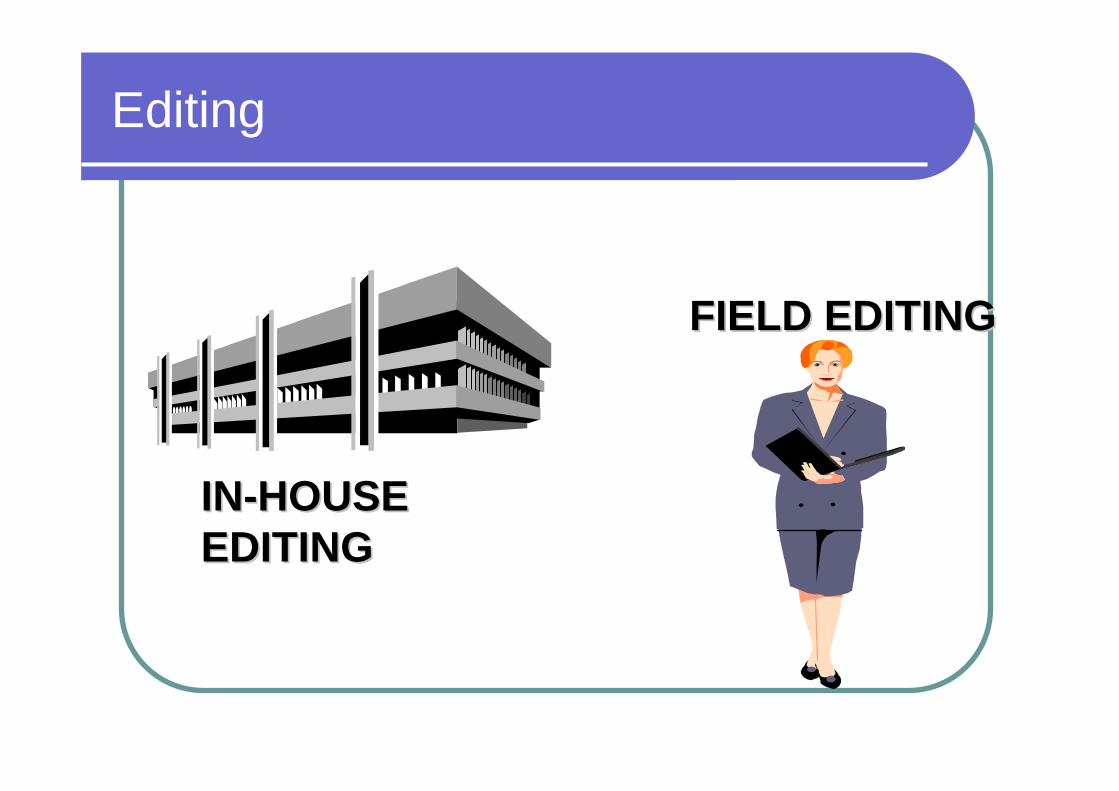
Editing
ININ--HOUSEHOUSEEDITINGEDITING
FIELD EDITINGFIELD EDITING
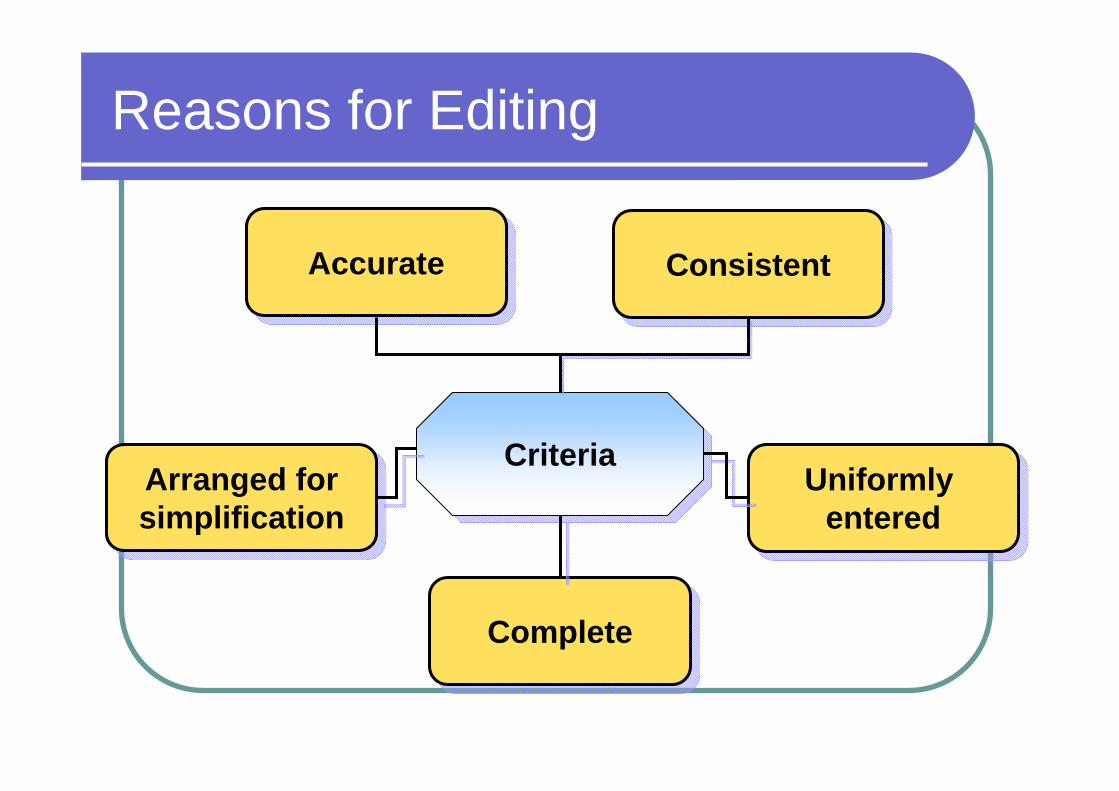
Reasons for Editing
CriteriaCriteria
ConsistentConsistent
Uniformly entered
Uniformly entered
Arranged forsimplificationArranged forsimplification
CompleteComplete
AccurateAccurate
Birth Year Recorded By Interviewer
1873? 1973 MORE LIKELY
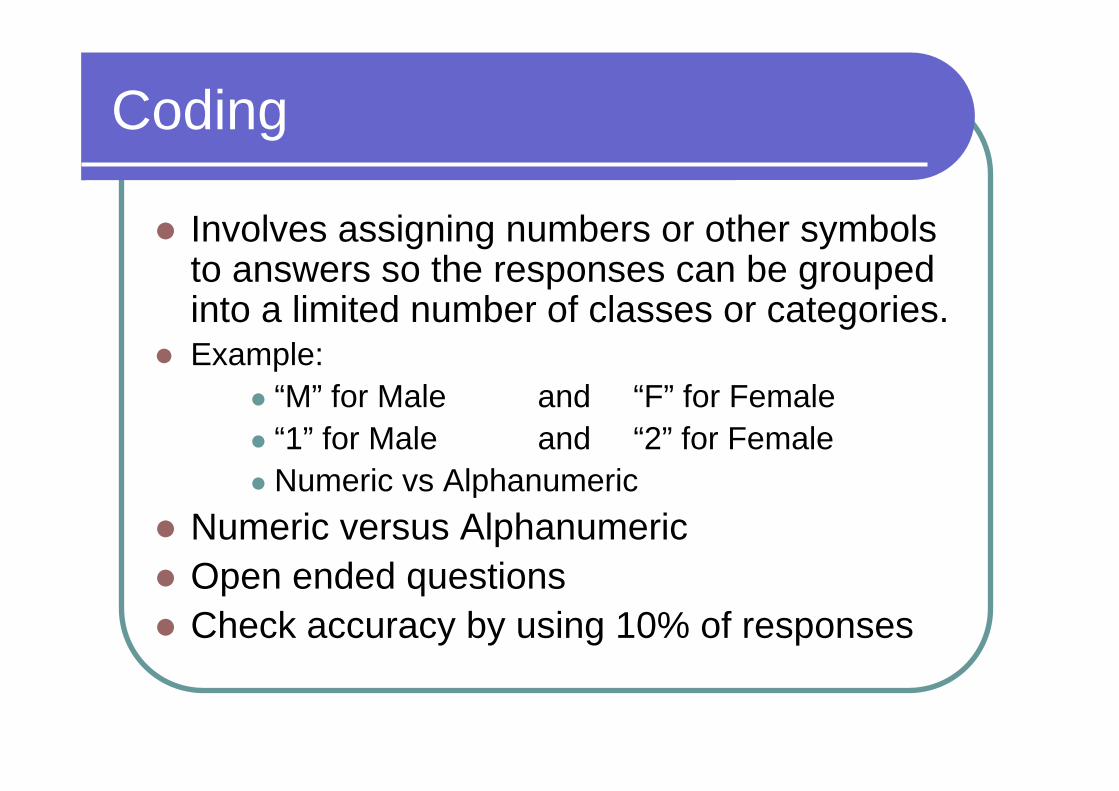
Coding
Involves assigning numbers or other symbols to answers so the responses can be grouped into a limited number of classes or categories.
Example: “M” for Male and “F” for Female “1” for Male and “2” for Female Numeric vs Alphanumeric
Numeric versus Alphanumeric Open ended questions Check accuracy by using 10% of responses
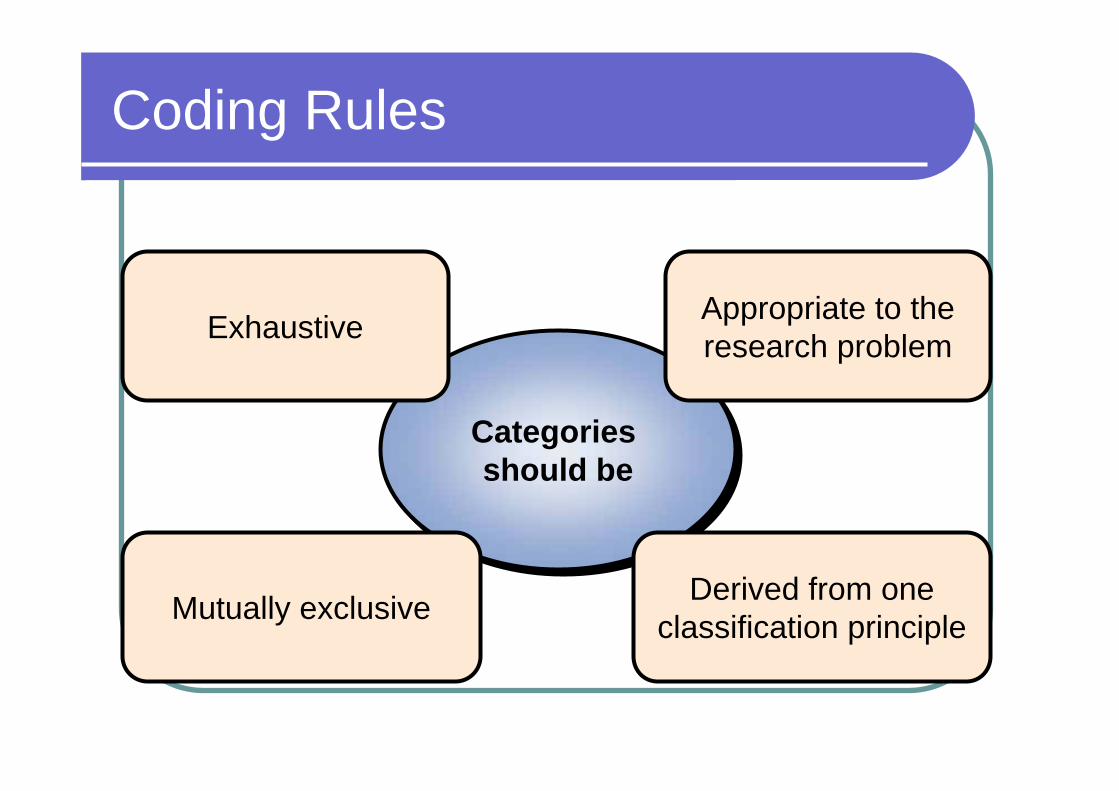
Coding Rules
Categories should be
Categories should be
Appropriate to the research problemExhaustive
Mutually exclusive Derived from one classification principle
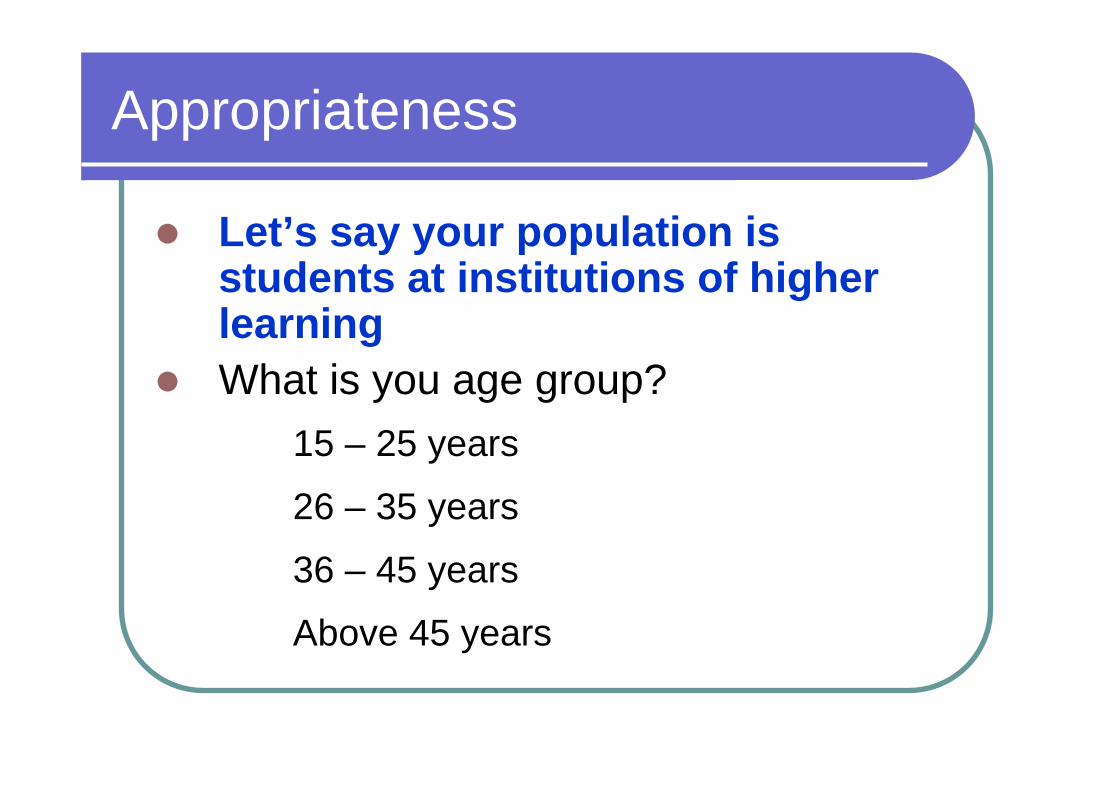
Appropriateness
Let’s say your population is students at institutions of higher learning
What is you age group?� 15 – 25 years
� 26 – 35 years
� 36 – 45 years
� Above 45 years
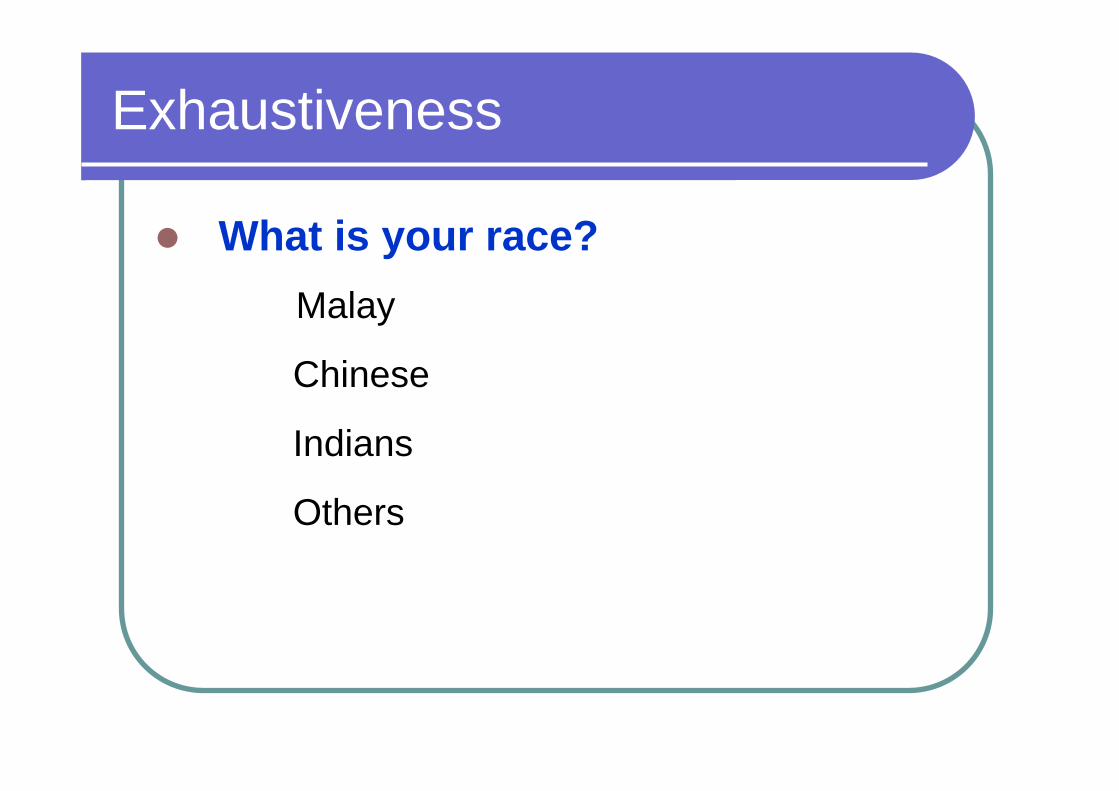
Exhaustiveness
What is your race?� Malay
� Chinese
� Indians
� Others
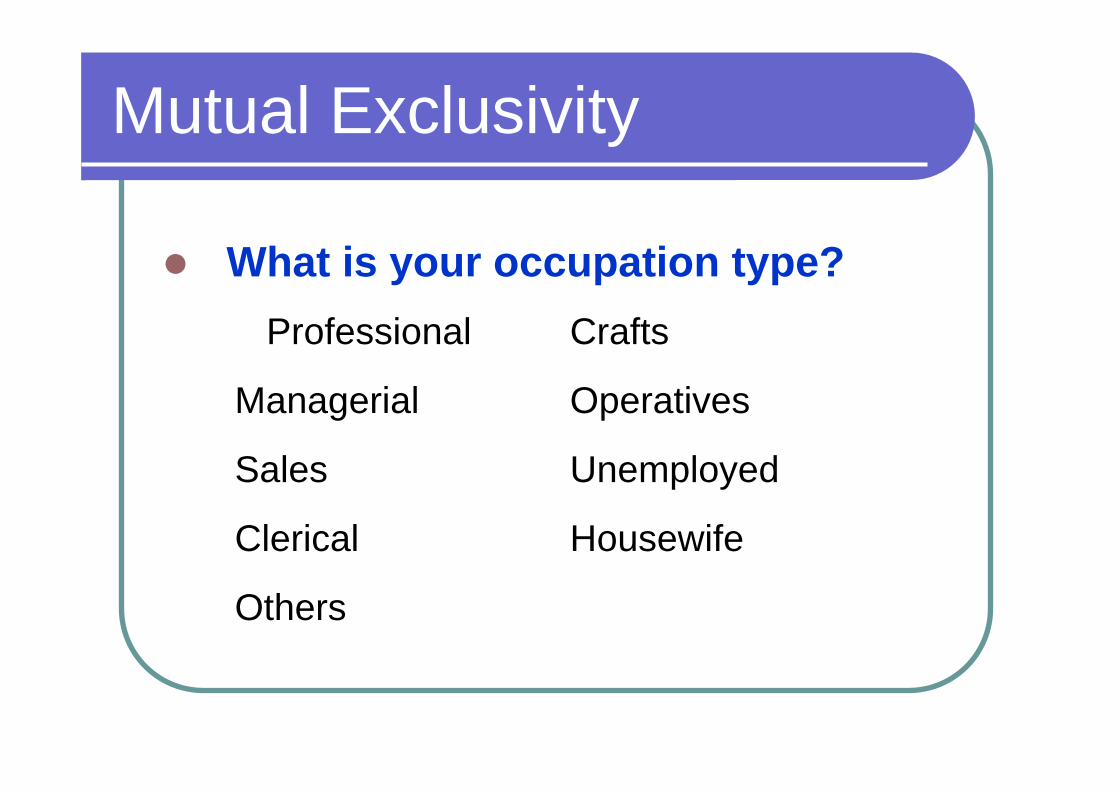
Mutual Exclusivity
What is your occupation type?� Professional � Crafts
� Managerial � Operatives
� Sales � Unemployed
� Clerical � Housewife
� Others
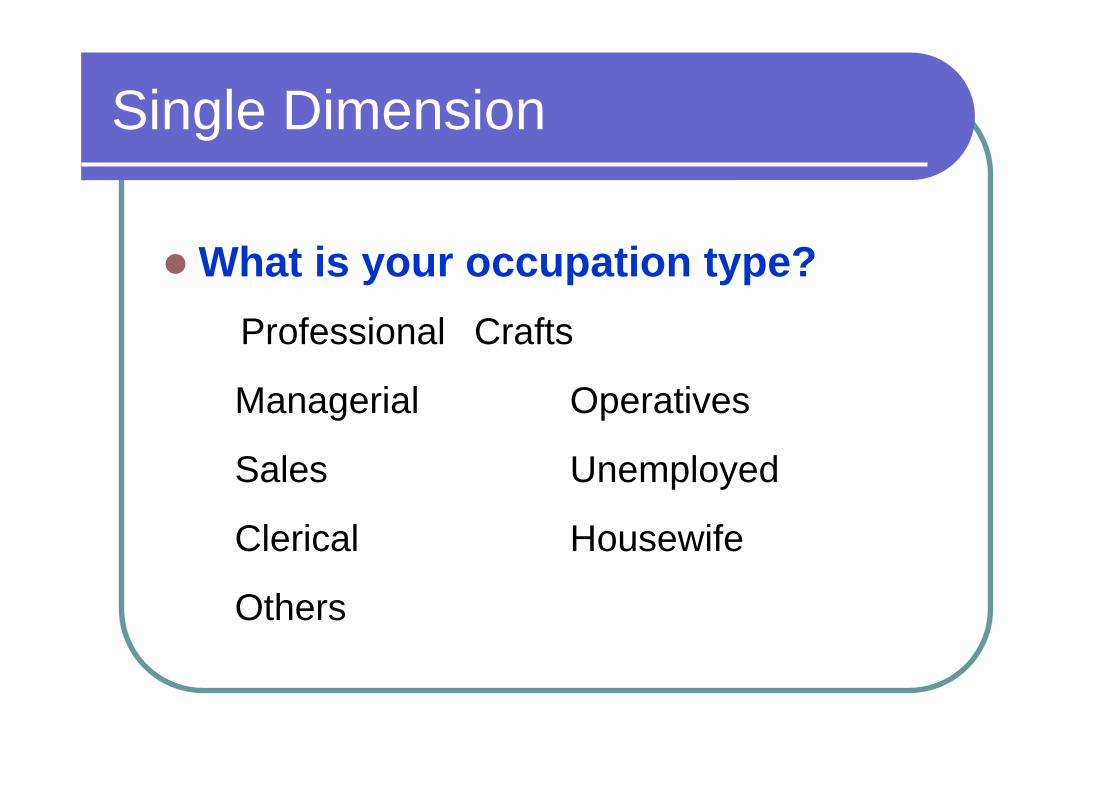
Single Dimension
What is your occupation type?� Professional � Crafts
� Managerial � Operatives
� Sales � Unemployed
� Clerical � Housewife
� Others
Coding Open-ended Responses
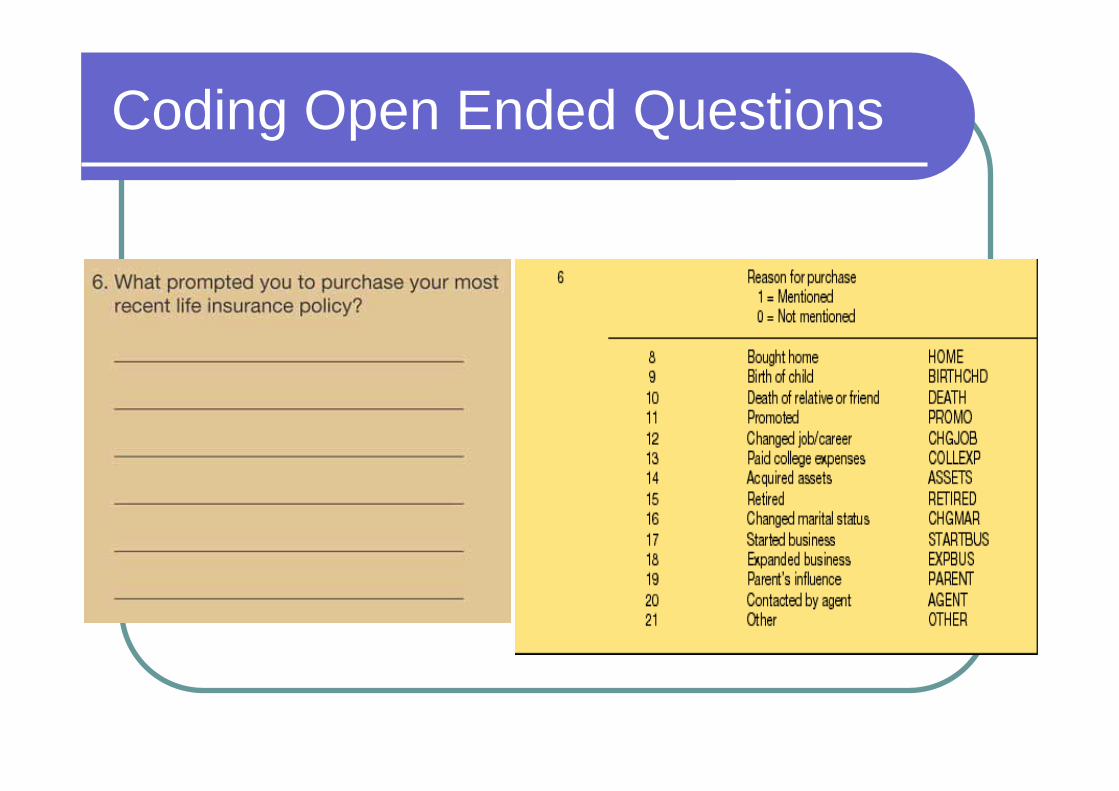
Coding Open Ended Questions
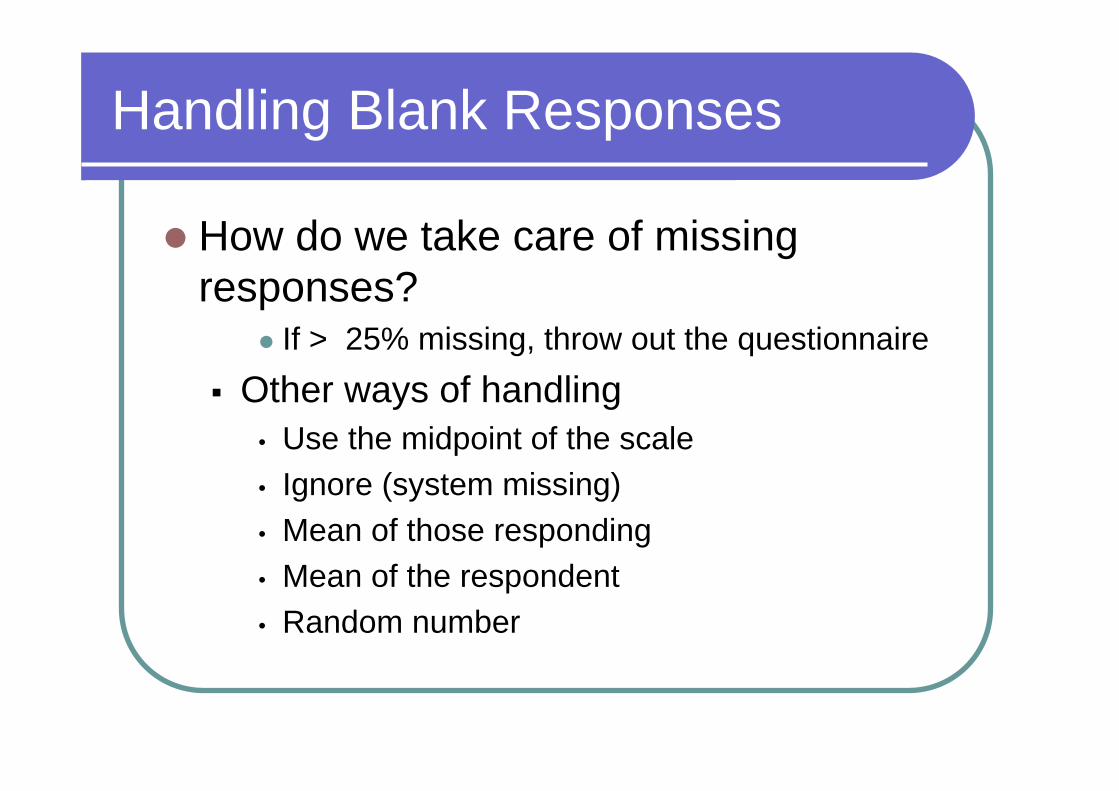
Handling Blank Responses
How do we take care of missing responses?
If > 25% missing, throw out the questionnaire Other ways of handling
• Use the midpoint of the scale• Ignore (system missing)• Mean of those responding• Mean of the respondent• Random number
Code Book
Identifies each variable Provides a variable’s description Identifies each code name and position
on storage medium
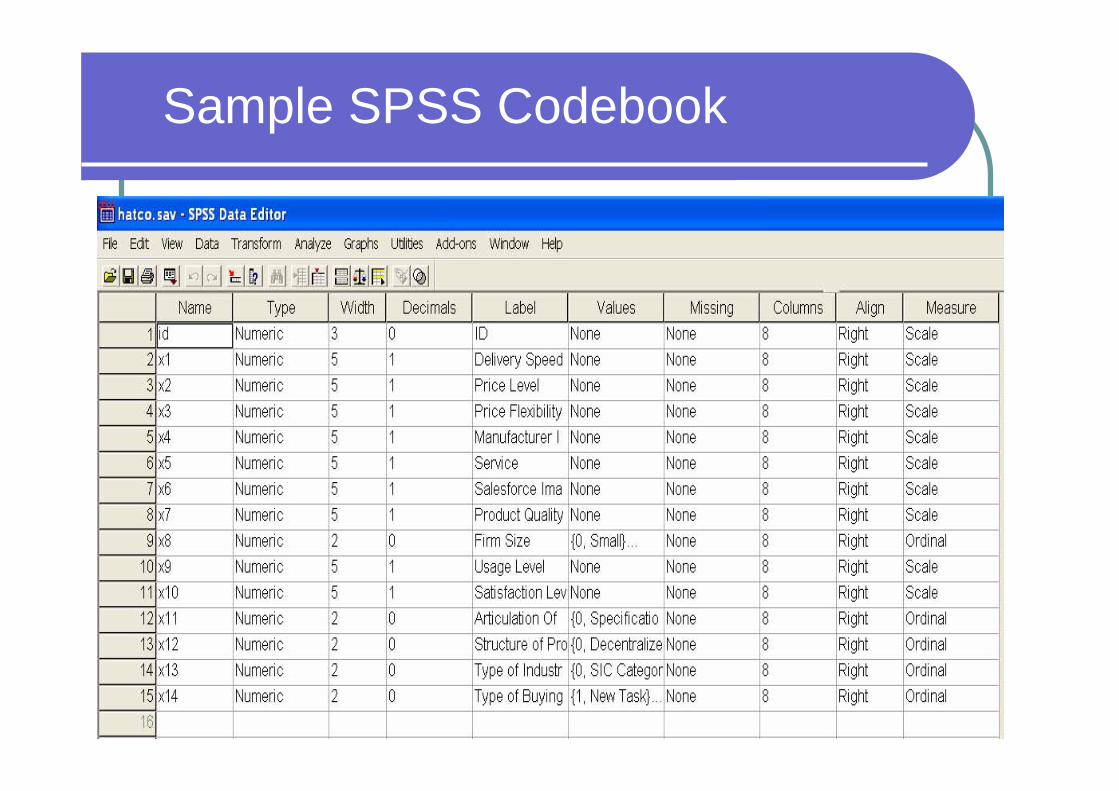
Sample SPSS Codebook
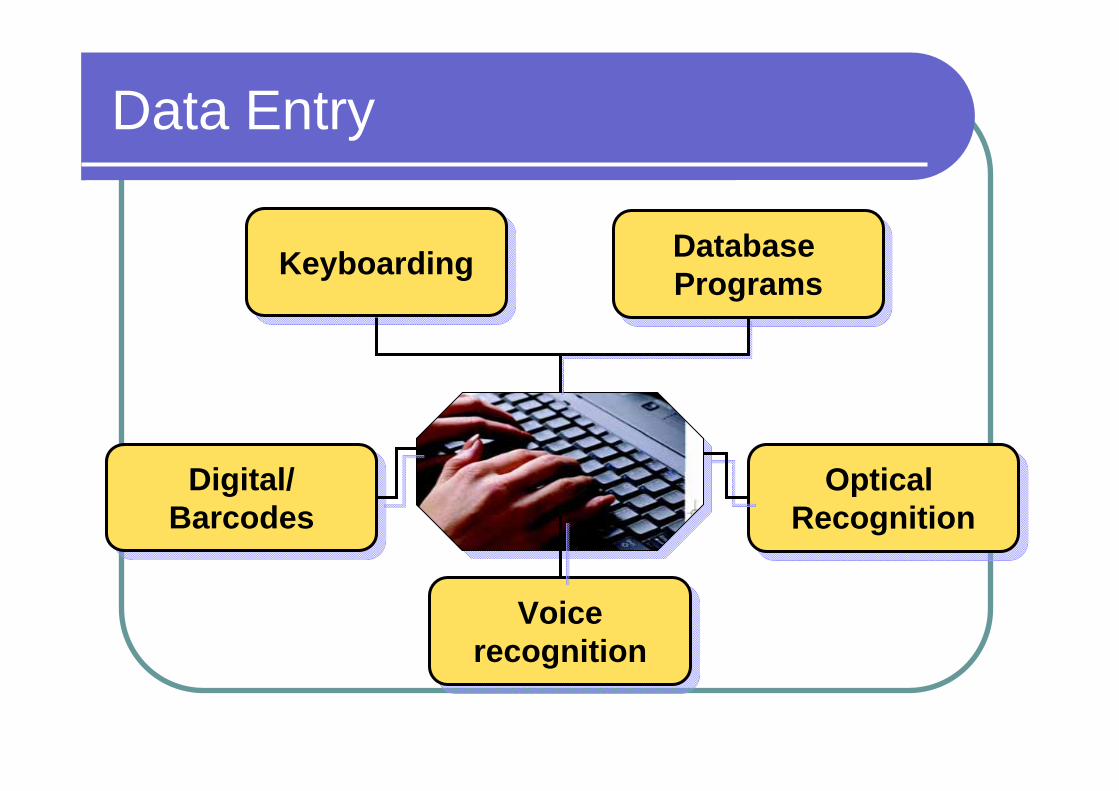
Data Entry
Database Programs
Database Programs
Optical Recognition
Optical Recognition
Digital/BarcodesDigital/
Barcodes
Voicerecognition
Voicerecognition
KeyboardingKeyboarding
Data Transformation
WeightsAssigning numbers to responses on a
pre-determined rule Respecification of the Variable
Transforming existing data to form new variables or items Recode Compute
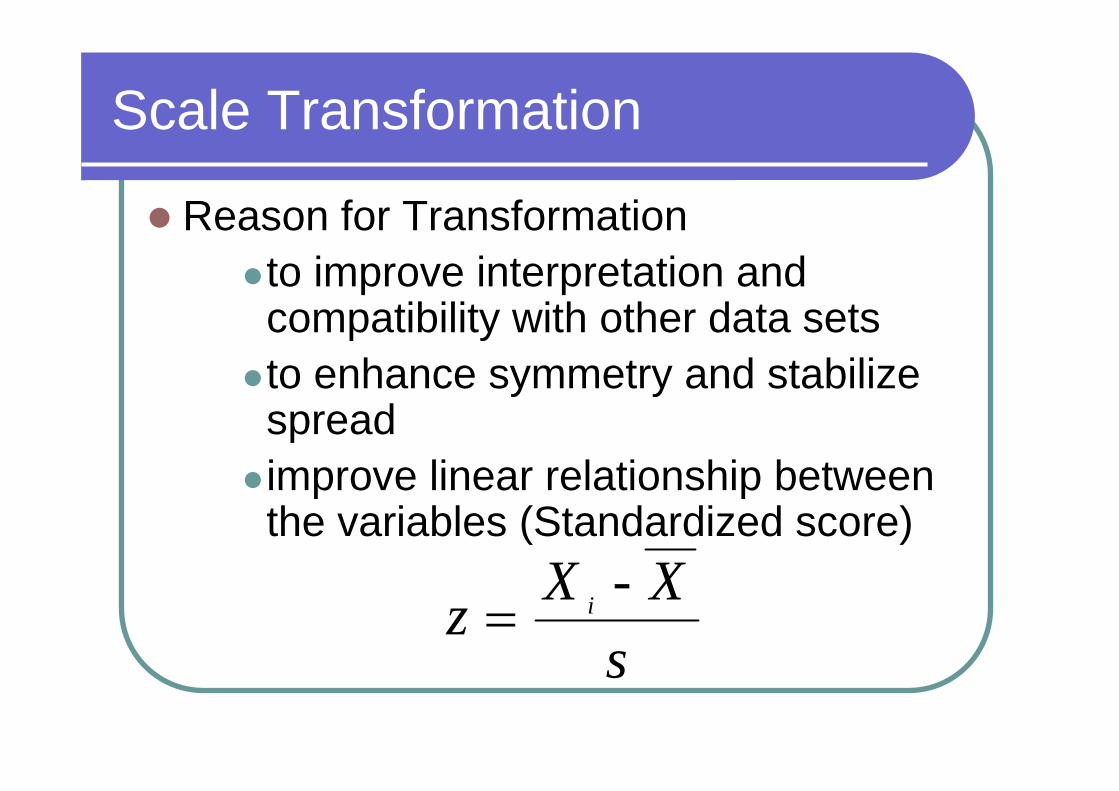
Scale Transformation
Reason for Transformationto improve interpretation and
compatibility with other data setsto enhance symmetry and stabilize
spread improve linear relationship between
the variables (Standardized score)
sXXz i -
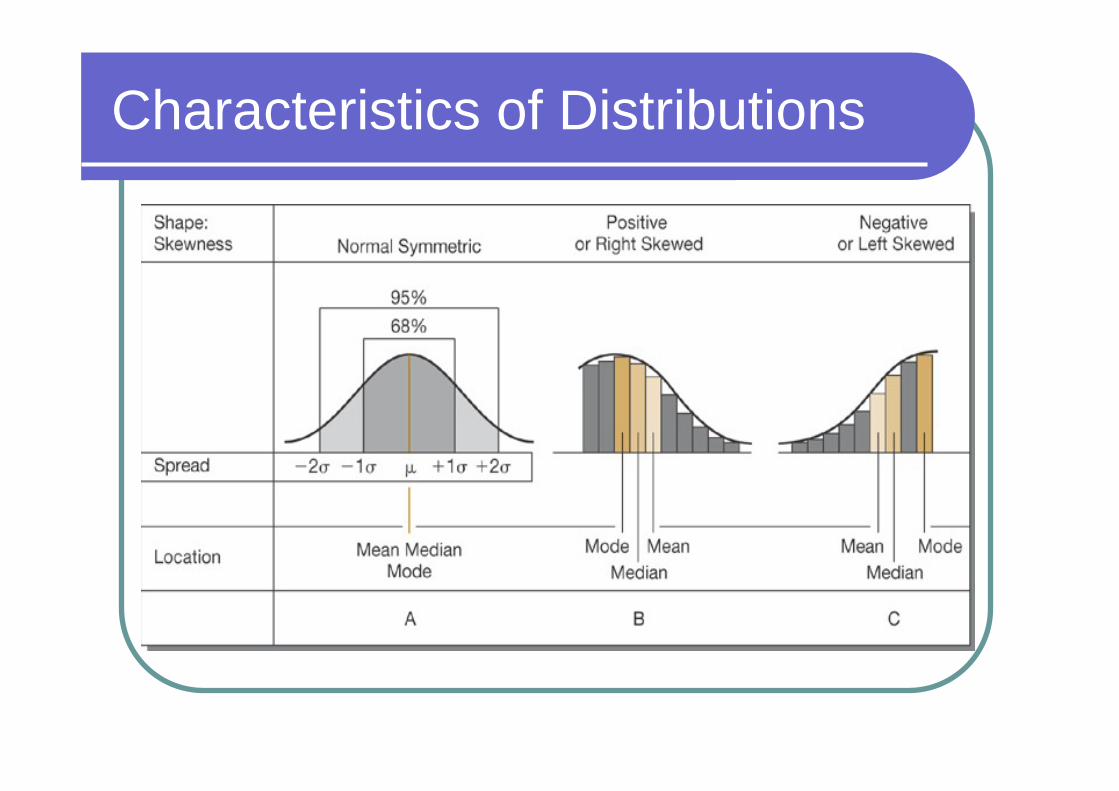
Characteristics of Distributions
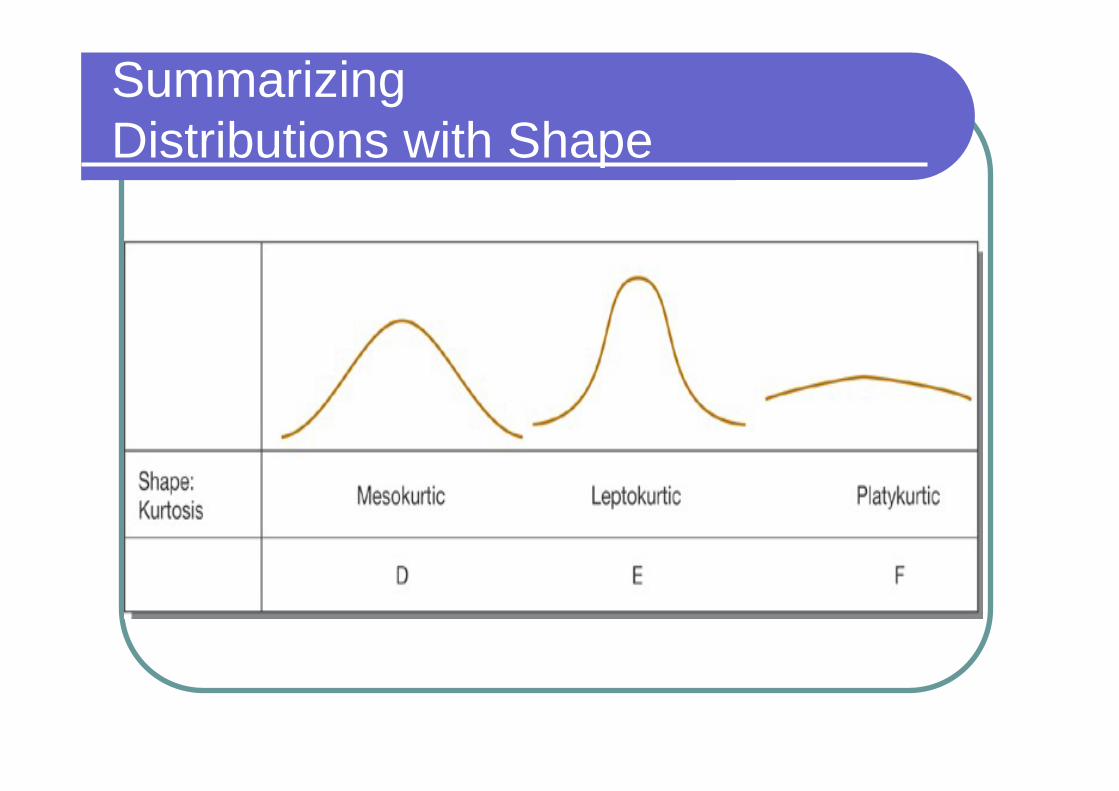
Summarizing Distributions with Shape
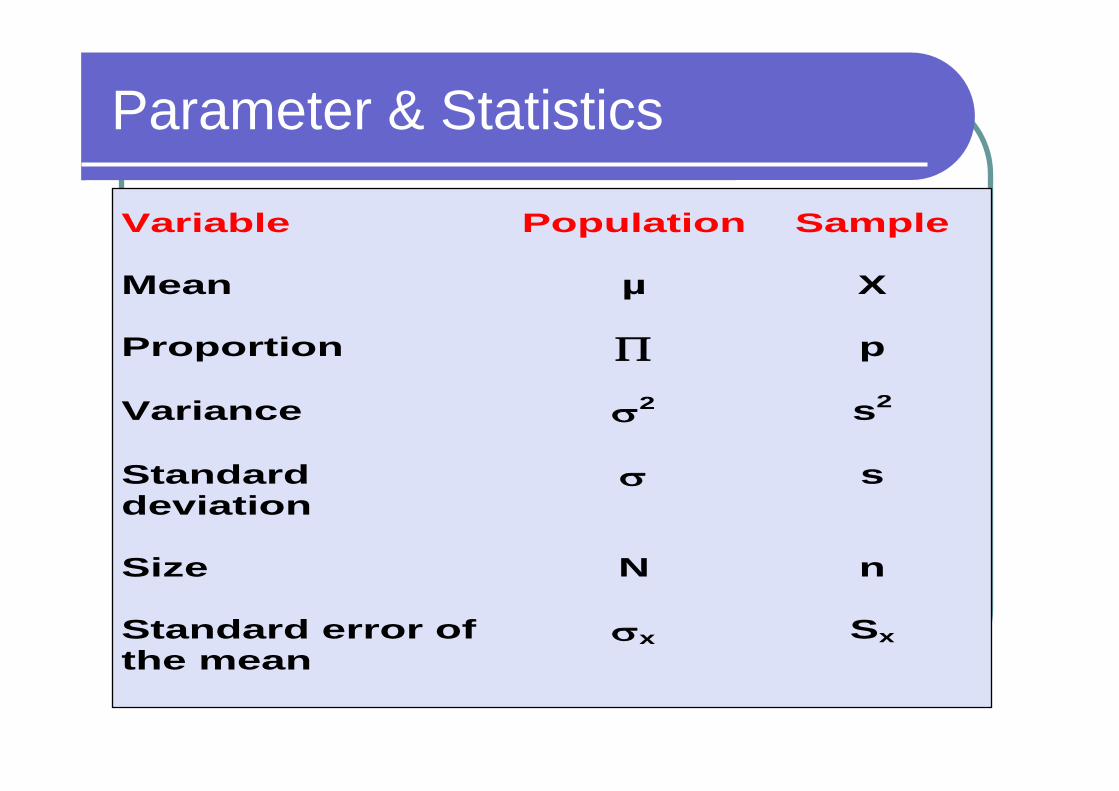
Parameter & Statistics
Variable Population Sample Mean
µ
X
Proportion
p
Variance
2
s2
Standard deviation
s
Size
N
n
Standard error of the mean
x
Sx
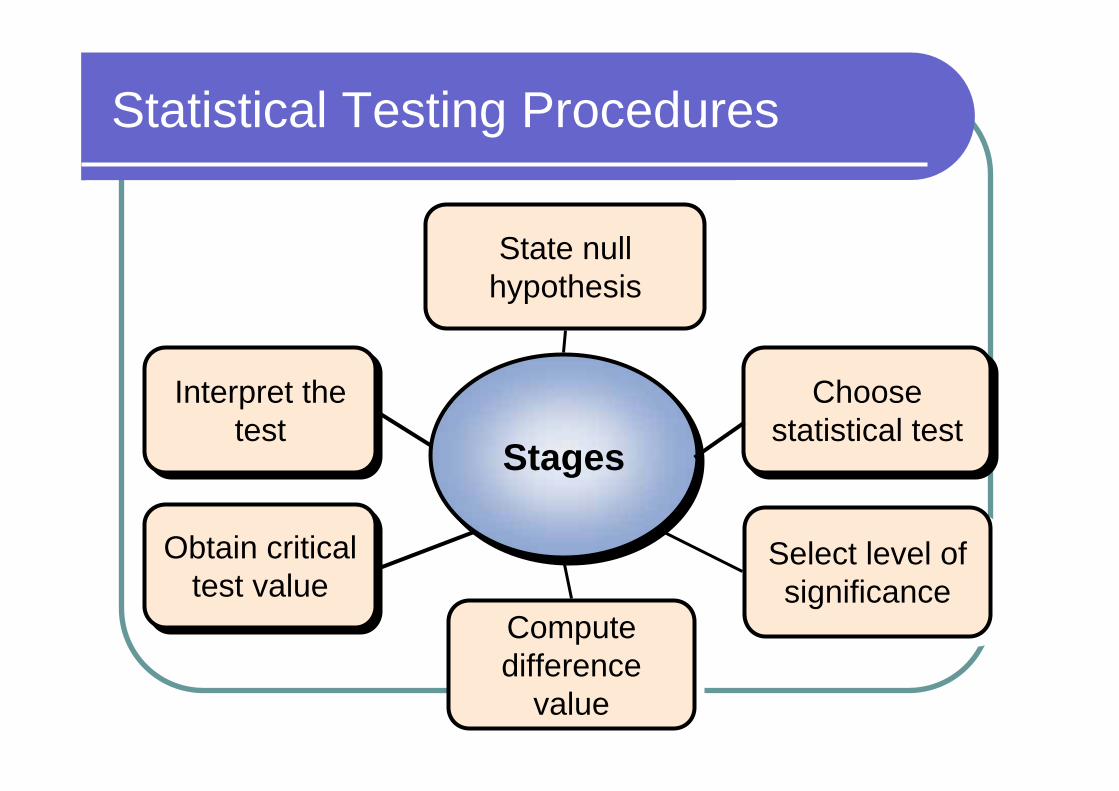
Statistical Testing Procedures
Obtain critical test value
Obtain critical test value
Interpret the test
Interpret the test
StagesStagesChoose
statistical testChoose
statistical test
State null hypothesisState null
hypothesis
Select level of significance
Select level of significance
Compute difference
value
Compute difference
value
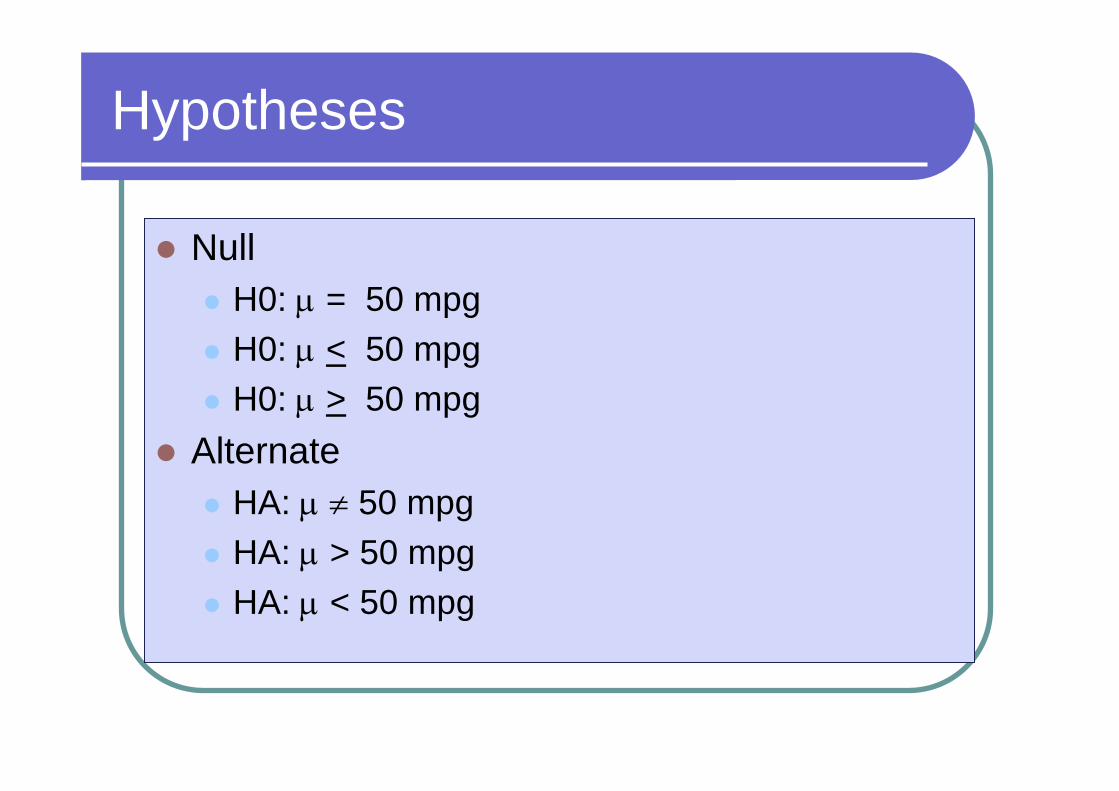
Hypotheses
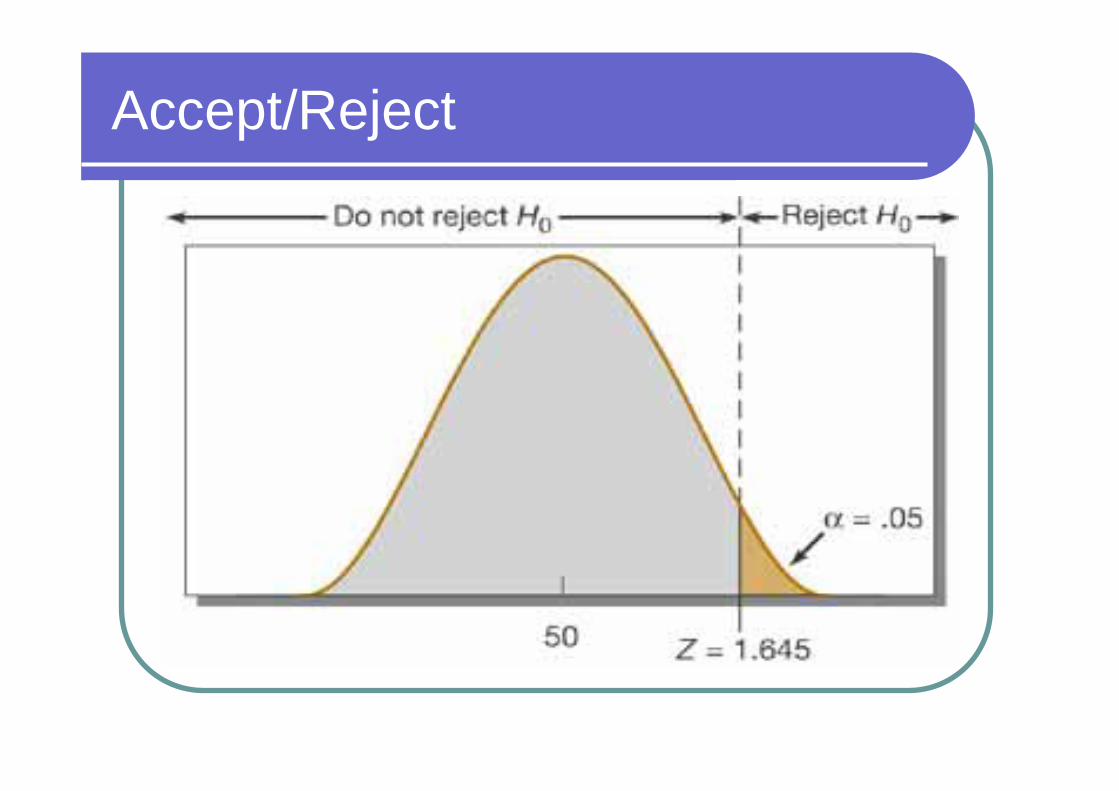
Null H0: = 50 mpg H0: < 50 mpg H0: > 50 mpg
Alternate HA: 50 mpg HA: > 50 mpg HA: < 50 mpg
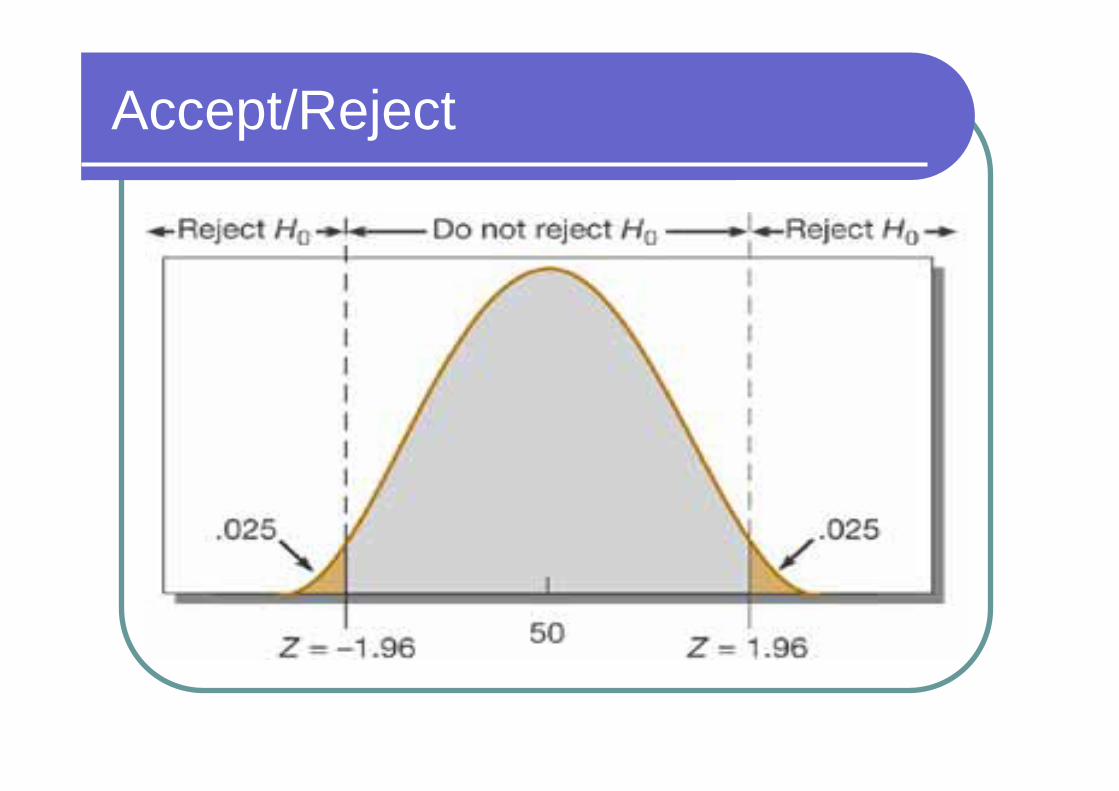
Accept/Reject
Accept/Reject
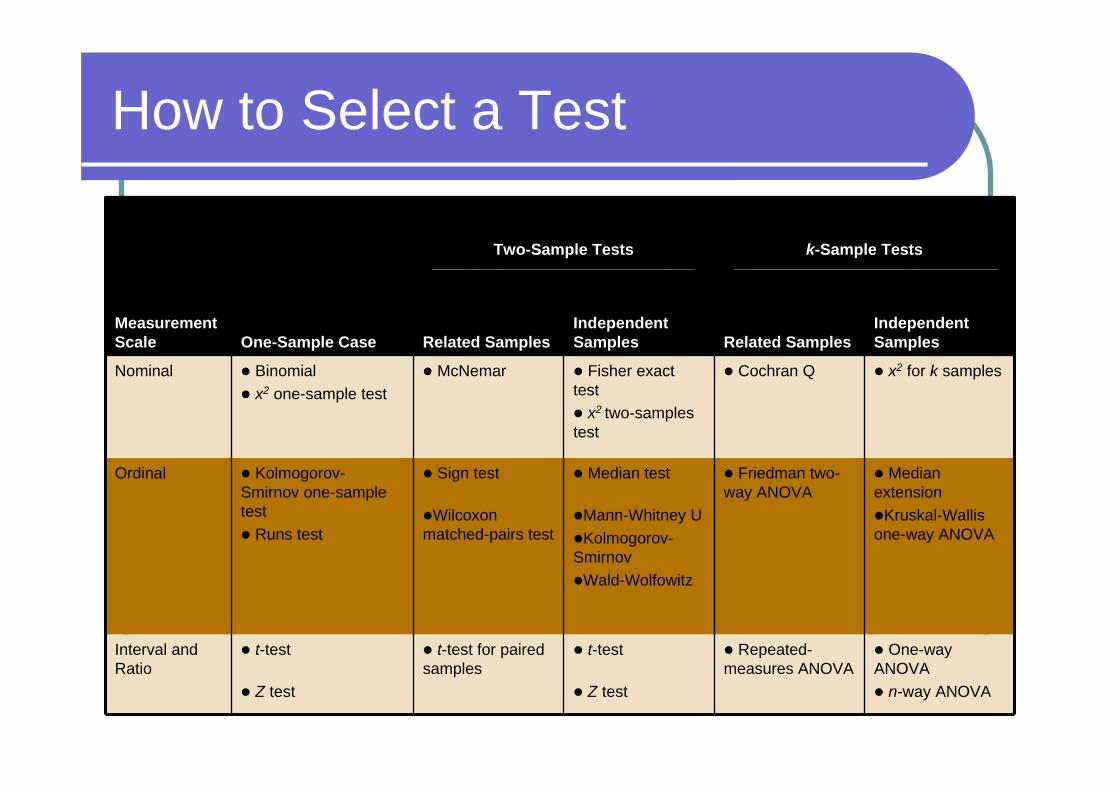
How to Select a Test
k-Sample Tests____________________________________________
Two-Sample Tests____________________________________________
Independent SamplesRelated Samples
Independent SamplesRelated SamplesOne-Sample Case
Measurement Scale
One-way ANOVA n-way ANOVA
x2 for k samples
Median extensionKruskal-Wallis one-way ANOVA
Repeated-measures ANOVA
t-test
Z test
t-test for paired samples
t-test
Z test
Interval and Ratio
Friedman two-way ANOVA
Median test
Mann-Whitney UKolmogorov-SmirnovWald-Wolfowitz
Sign test
Wilcoxonmatched-pairs test
Kolmogorov-Smirnov one-sample test Runs test
Ordinal
Cochran Q Fisher exact test x2 two-samples test
McNemar Binomial x2 one-sample test
Nominal
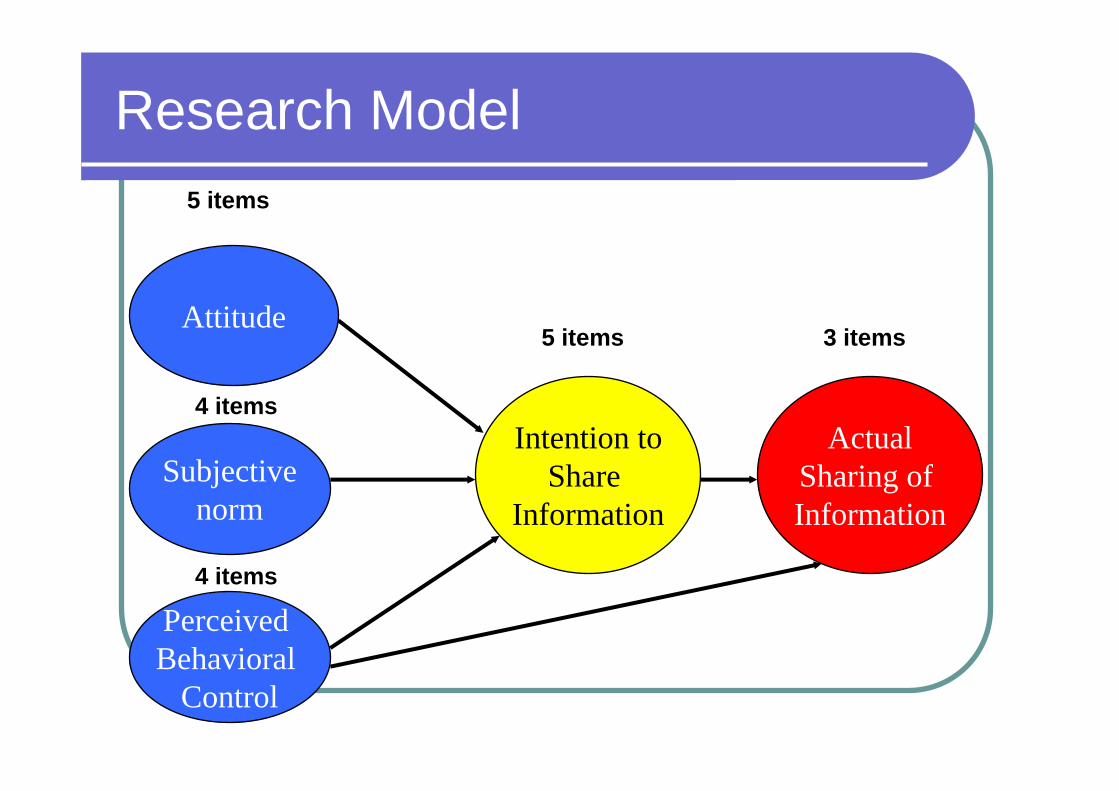
Research Model
Attitude
Intention toShare
InformationSubjective
norm
5 items
4 items
3 items
Perceived Behavioral
Control
4 items
ActualSharing of Information
5 items
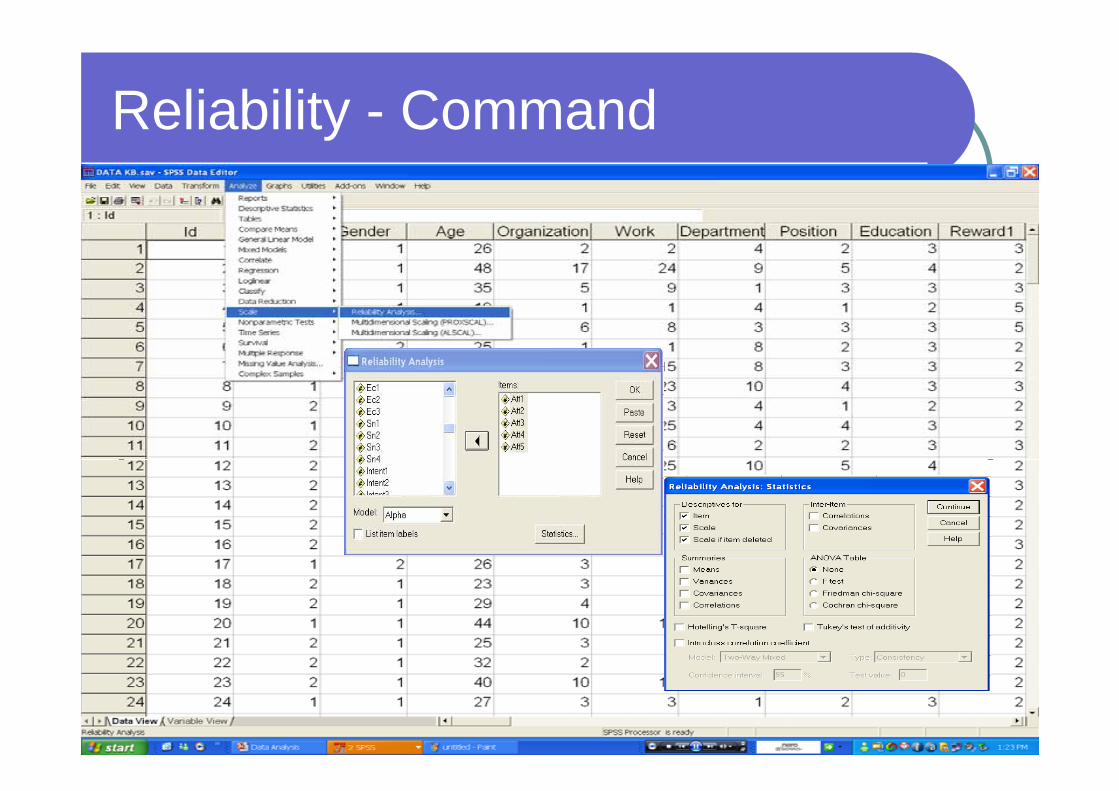
Reliability - Command

Reliability
Reliability Statistics
.977 5
Cronbach'sAlpha N of Items
Item-Total Statistics
15.25 6.681 .973 .96515.26 6.560 .925 .97215.24 6.906 .929 .97215.21 6.825 .900 .97515.25 6.555 .935 .970
Att1Att2Att3Att4Att5
Scale Mean ifItem Deleted
ScaleVariance if
Item Deleted
CorrectedItem-TotalCorrelation
Cronbach'sAlpha if Item
Deleted
Question:
How reliable are our instruments?
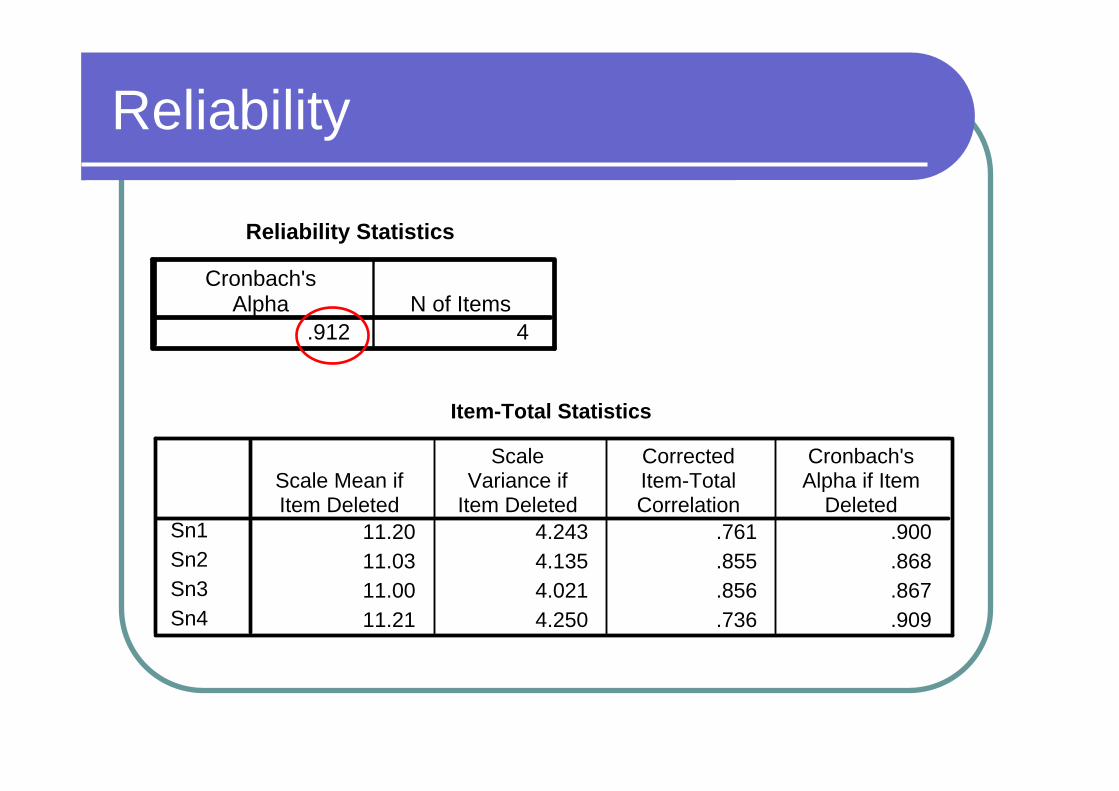
Reliability
Reliability Statistics
.912 4
Cronbach'sAlpha N of Items
Item-Total Statistics
11.20 4.243 .761 .90011.03 4.135 .855 .86811.00 4.021 .856 .86711.21 4.250 .736 .909
Sn1Sn2Sn3Sn4
Scale Mean ifItem Deleted
ScaleVariance if
Item Deleted
CorrectedItem-TotalCorrelation
Cronbach'sAlpha if Item
Deleted
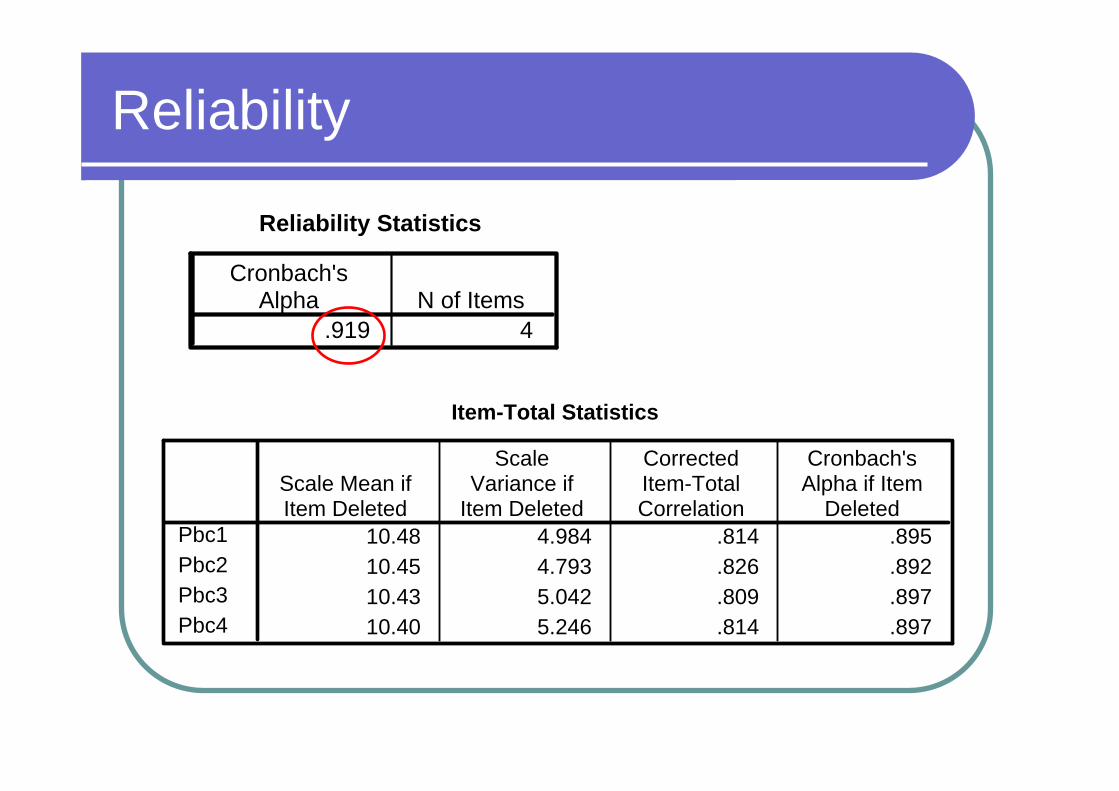
Reliability
Reliability Statistics
.919 4
Cronbach'sAlpha N of Items
Item-Total Statistics
10.48 4.984 .814 .89510.45 4.793 .826 .89210.43 5.042 .809 .89710.40 5.246 .814 .897
Pbc1Pbc2Pbc3Pbc4
Scale Mean ifItem Deleted
ScaleVariance if
Item Deleted
CorrectedItem-TotalCorrelation
Cronbach'sAlpha if Item
Deleted
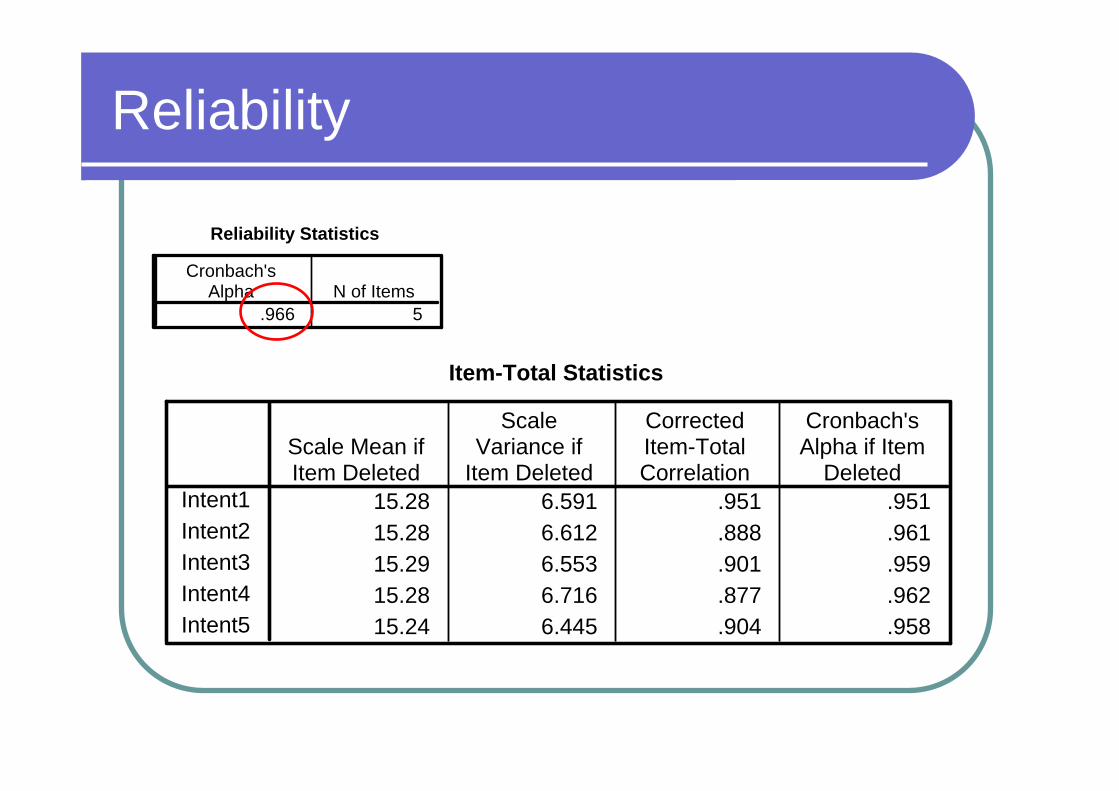
Reliability
Reliability Statistics
.966 5
Cronbach'sAlpha N of Items
Item-Total Statistics
15.28 6.591 .951 .95115.28 6.612 .888 .96115.29 6.553 .901 .95915.28 6.716 .877 .96215.24 6.445 .904 .958
Intent1Intent2Intent3Intent4Intent5
Scale Mean ifItem Deleted
ScaleVariance if
Item Deleted
CorrectedItem-TotalCorrelation
Cronbach'sAlpha if Item
Deleted
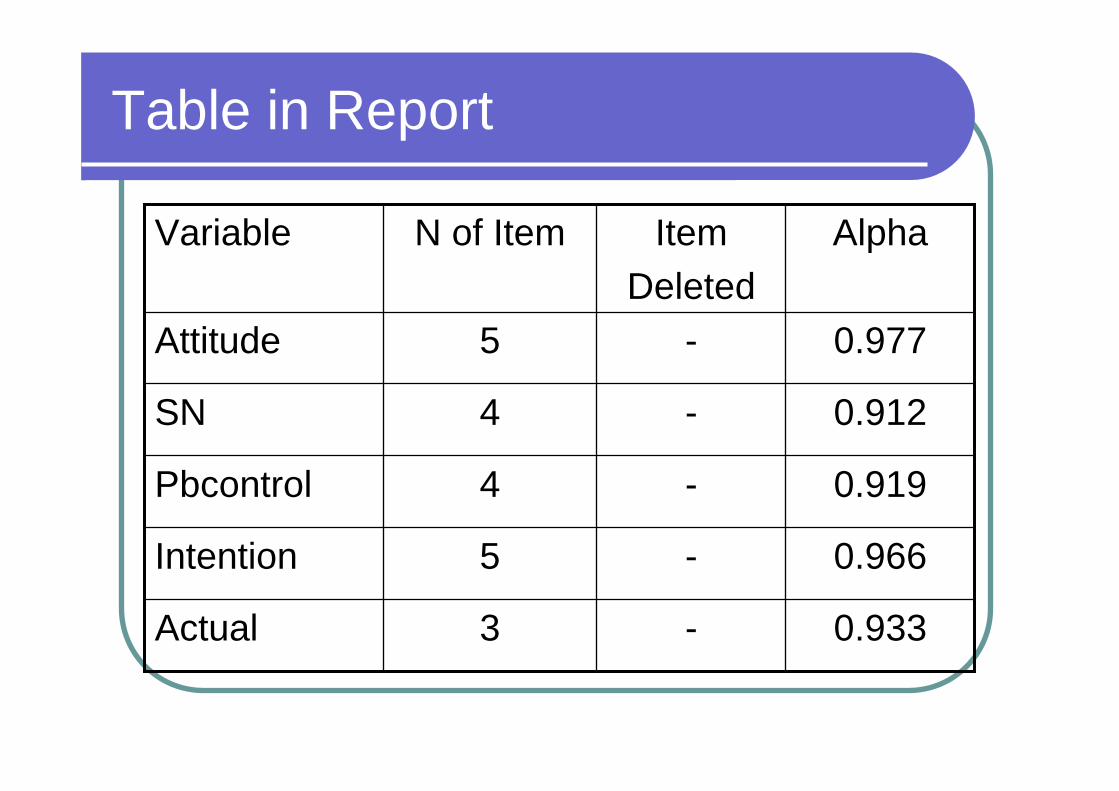
Table in Report
3
5
4
4
5
N of Item
0.933-Actual
0.966-Intention
0.919-Pbcontrol
0.912-SN
0.977-Attitude
AlphaItemDeleted
Variable
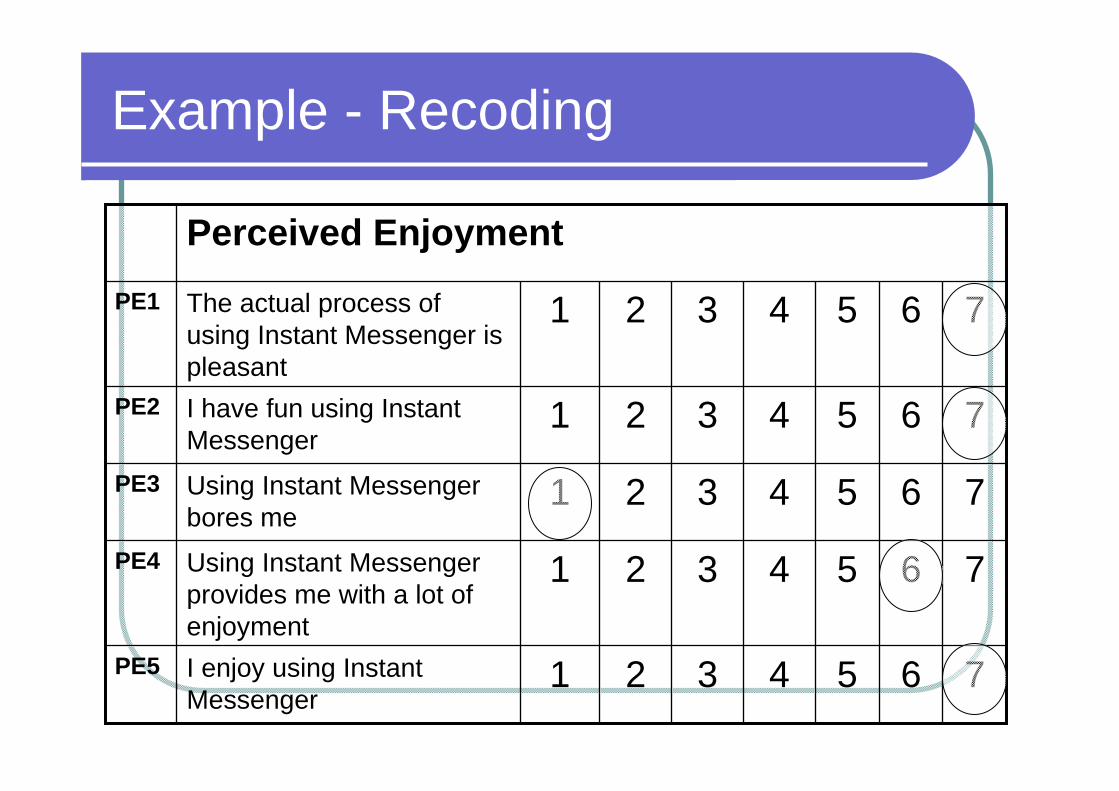
Example - Recoding
PE5
PE4
PE3
PE2
PE1
7654321I enjoy using Instant Messenger
7654321Using Instant Messenger provides me with a lot of enjoyment
7654321Using Instant Messenger bores me
7654321I have fun using Instant Messenger
7654321The actual process of using Instant Messenger is pleasant
Perceived Enjoyment

Recoding
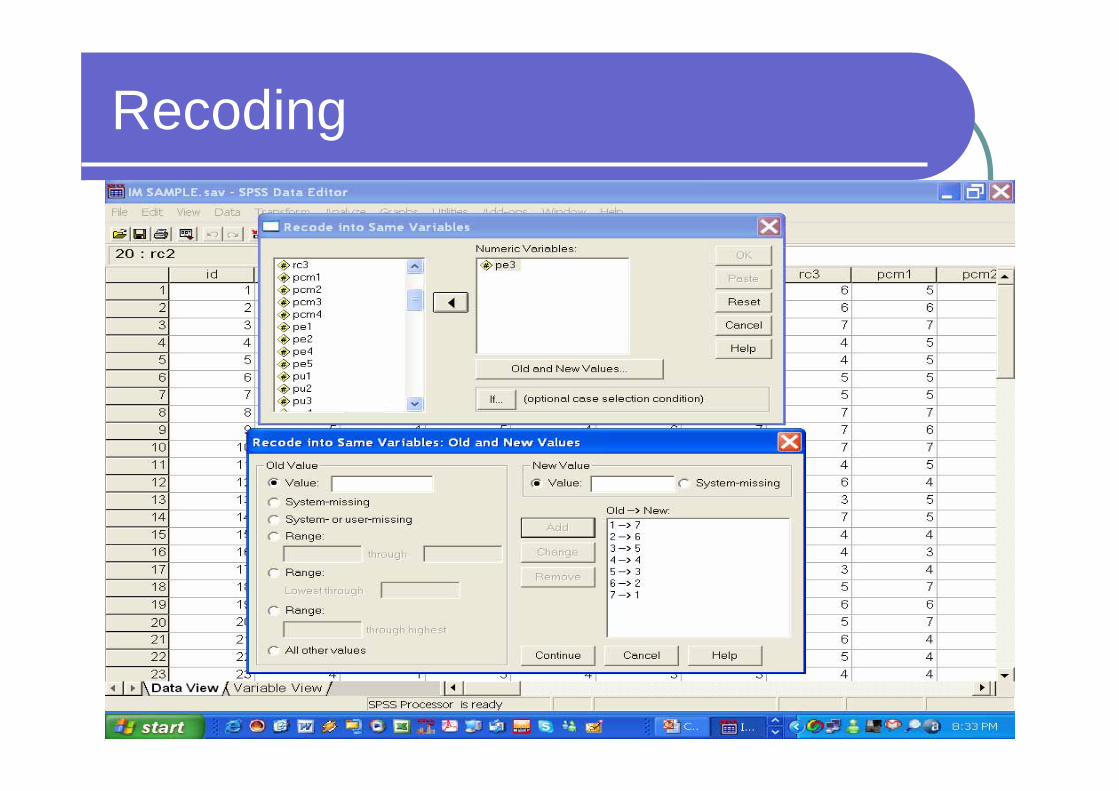
Recoding
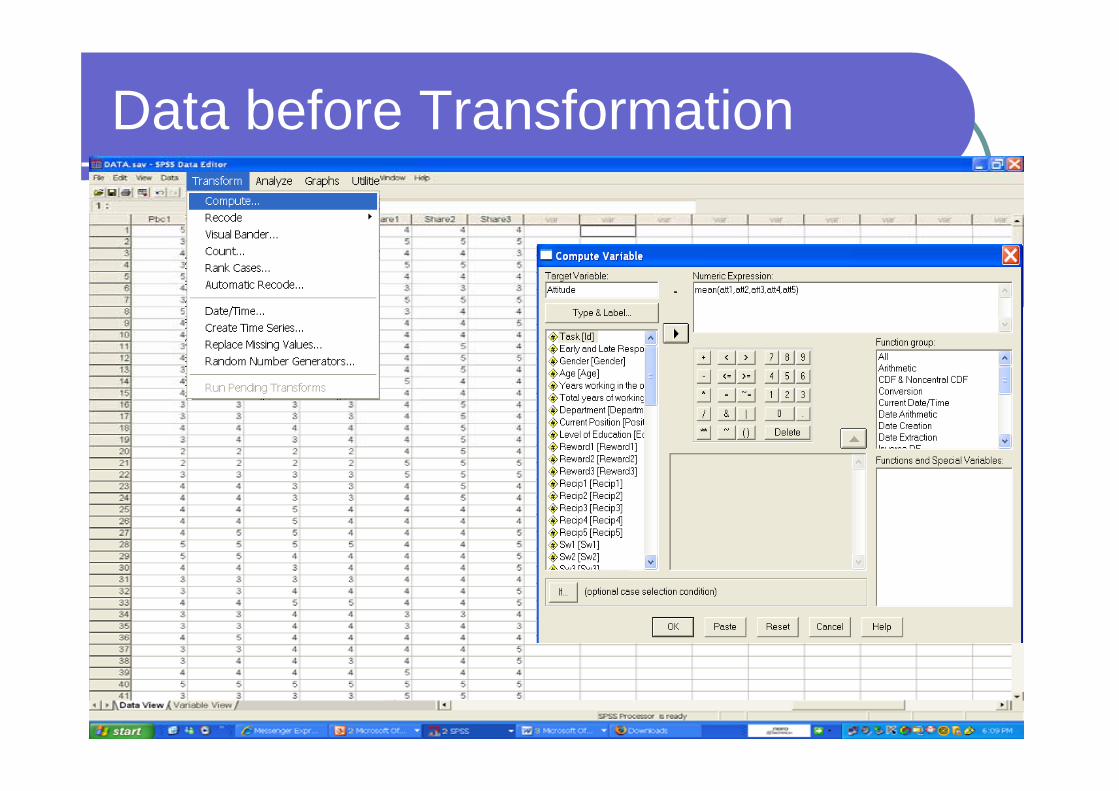
Data before Transformation
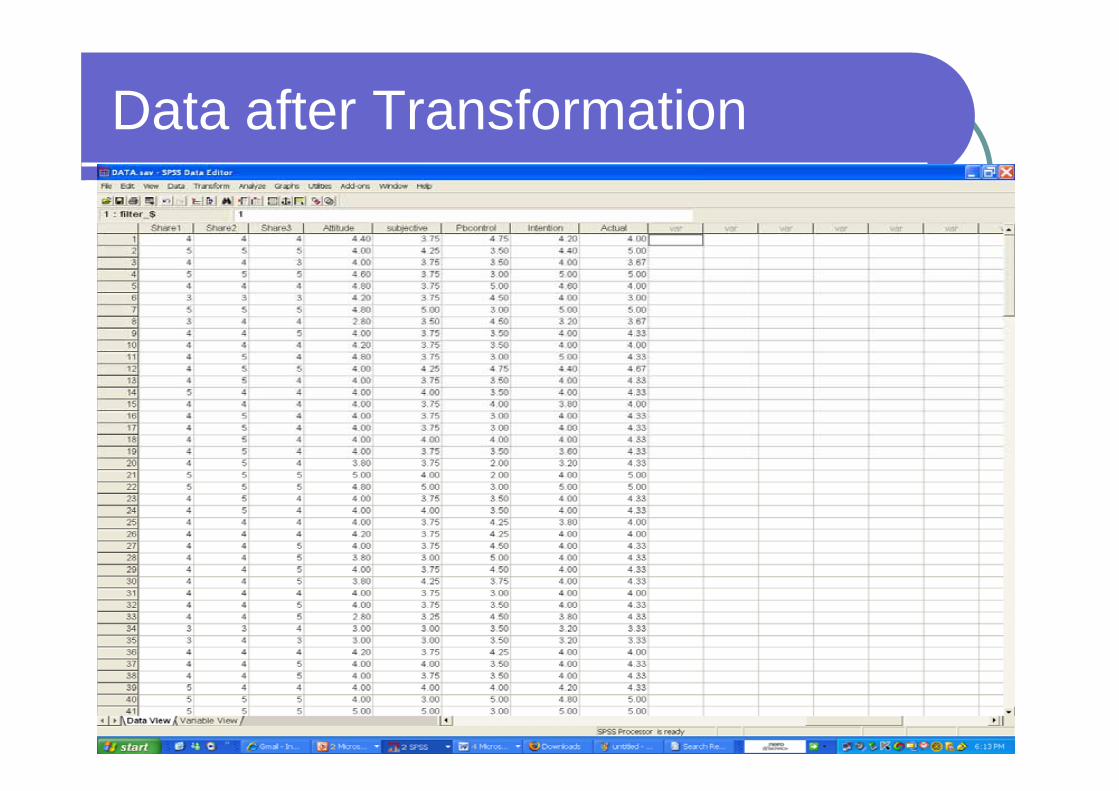
Data after Transformation
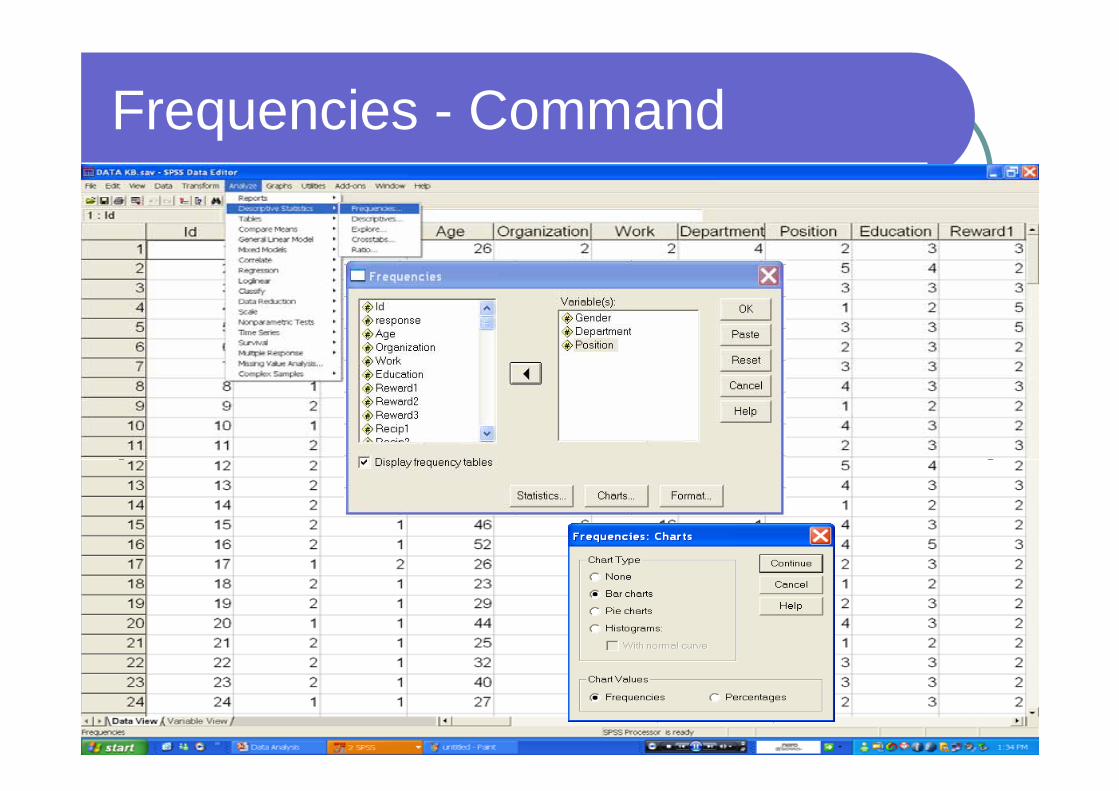
Frequencies - Command
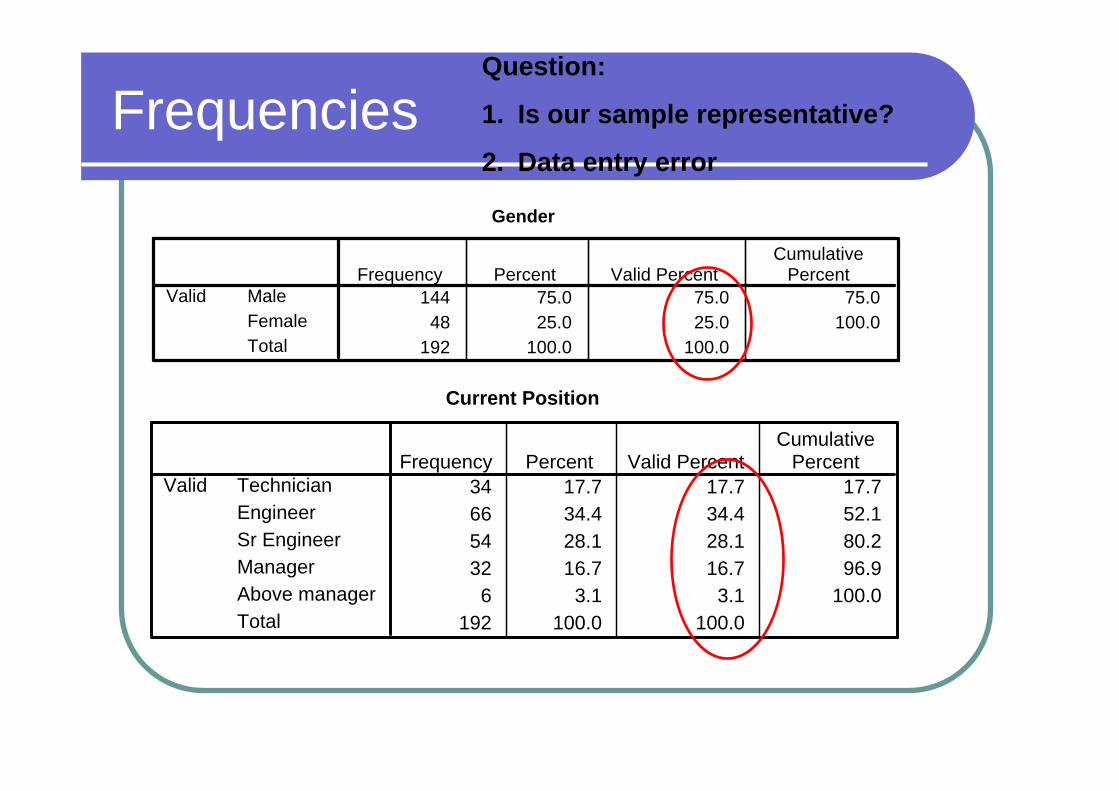
Frequencies
Gender
144 75.0 75.0 75.048 25.0 25.0 100.0
192 100.0 100.0
MaleFemaleTotal
ValidFrequency Percent Valid Percent
CumulativePercent
Current Position
34 17.7 17.7 17.766 34.4 34.4 52.154 28.1 28.1 80.232 16.7 16.7 96.9
6 3.1 3.1 100.0192 100.0 100.0
TechnicianEngineerSr EngineerManagerAbove managerTotal
ValidFrequency Percent Valid Percent
CumulativePercent
Question:
1. Is our sample representative?
2. Data entry error
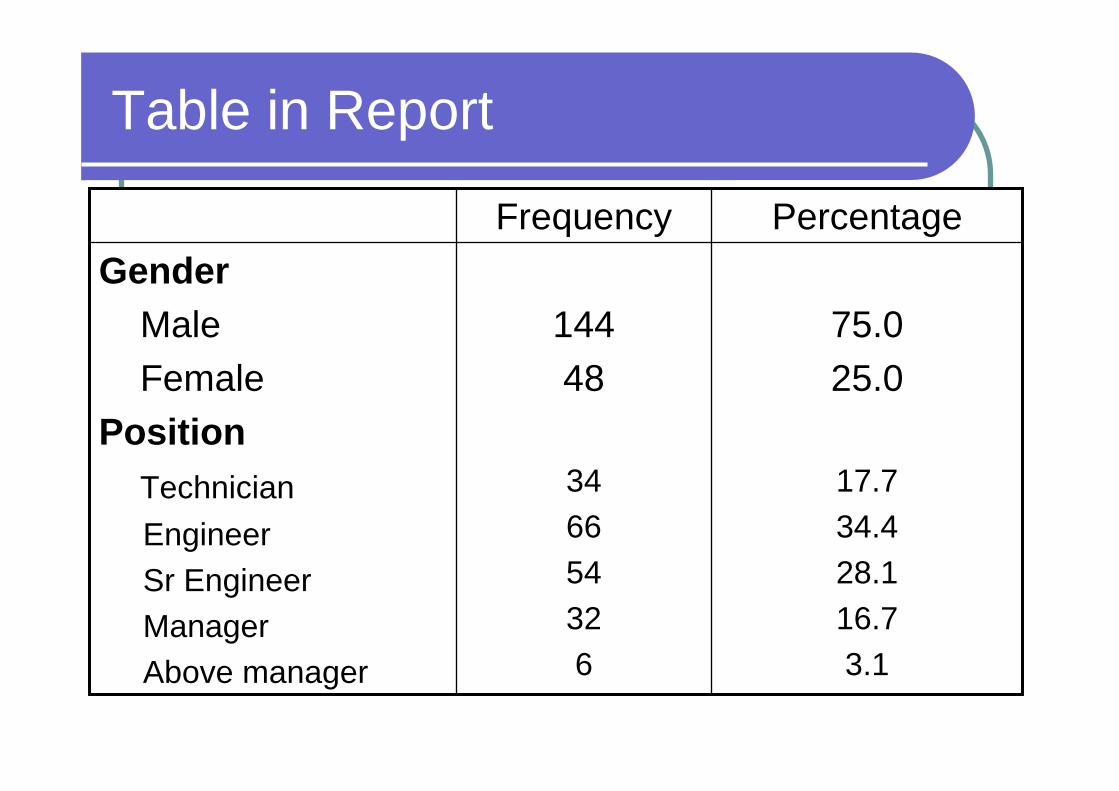
Table in Report
75.025.0
17.734.428.116.73.1
14448
346654326
GenderMaleFemale
PositionTechnicianEngineerSr EngineerManagerAbove manager
PercentageFrequency
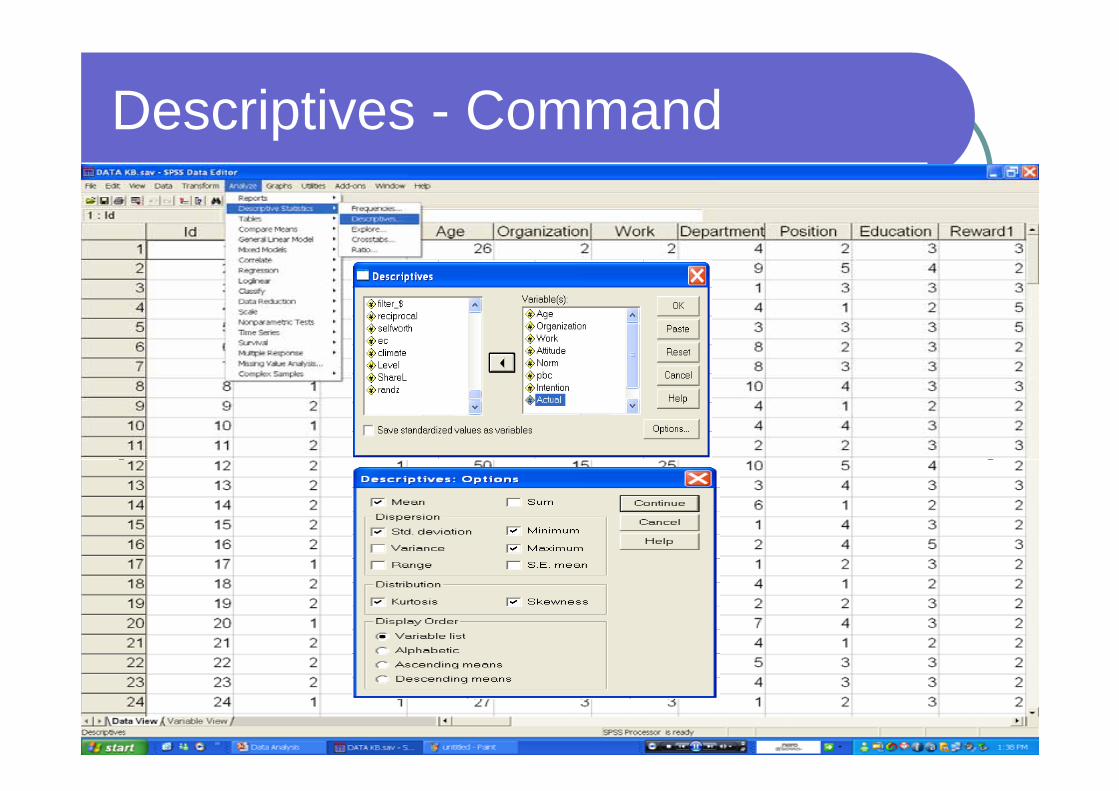
Descriptives - Command
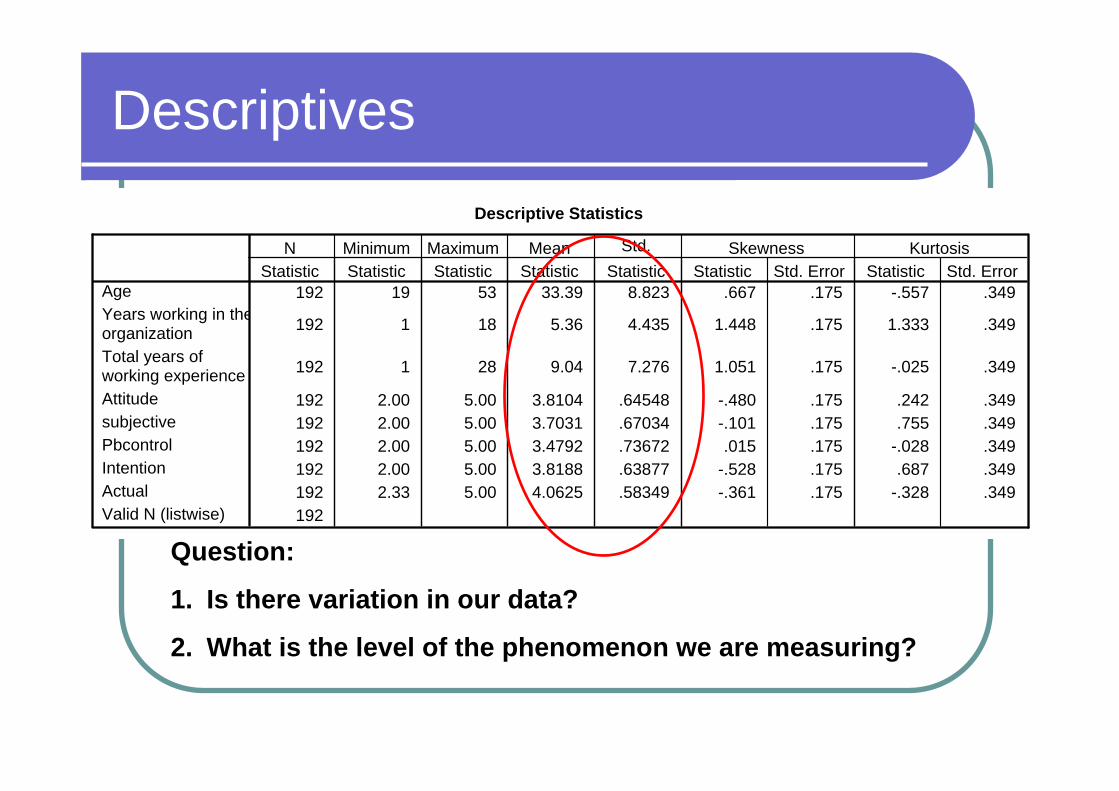
DescriptivesDescriptive Statistics
192 19 53 33.39 8.823 .667 .175 -.557 .349
192 1 18 5.36 4.435 1.448 .175 1.333 .349
192 1 28 9.04 7.276 1.051 .175 -.025 .349
192 2.00 5.00 3.8104 .64548 -.480 .175 .242 .349192 2.00 5.00 3.7031 .67034 -.101 .175 .755 .349192 2.00 5.00 3.4792 .73672 .015 .175 -.028 .349192 2.00 5.00 3.8188 .63877 -.528 .175 .687 .349192 2.33 5.00 4.0625 .58349 -.361 .175 -.328 .349192
AgeYears working in theorganizationTotal years ofworking experienceAttitudesubjectivePbcontrolIntentionActualValid N (listwise)
Statistic Statistic Statistic Statistic Statistic Statistic Std. Error Statistic Std. ErrorN Minimum Maximum Mean Std.
D i iSkewness Kurtosis
Question:
1. Is there variation in our data?
2. What is the level of the phenomenon we are measuring?
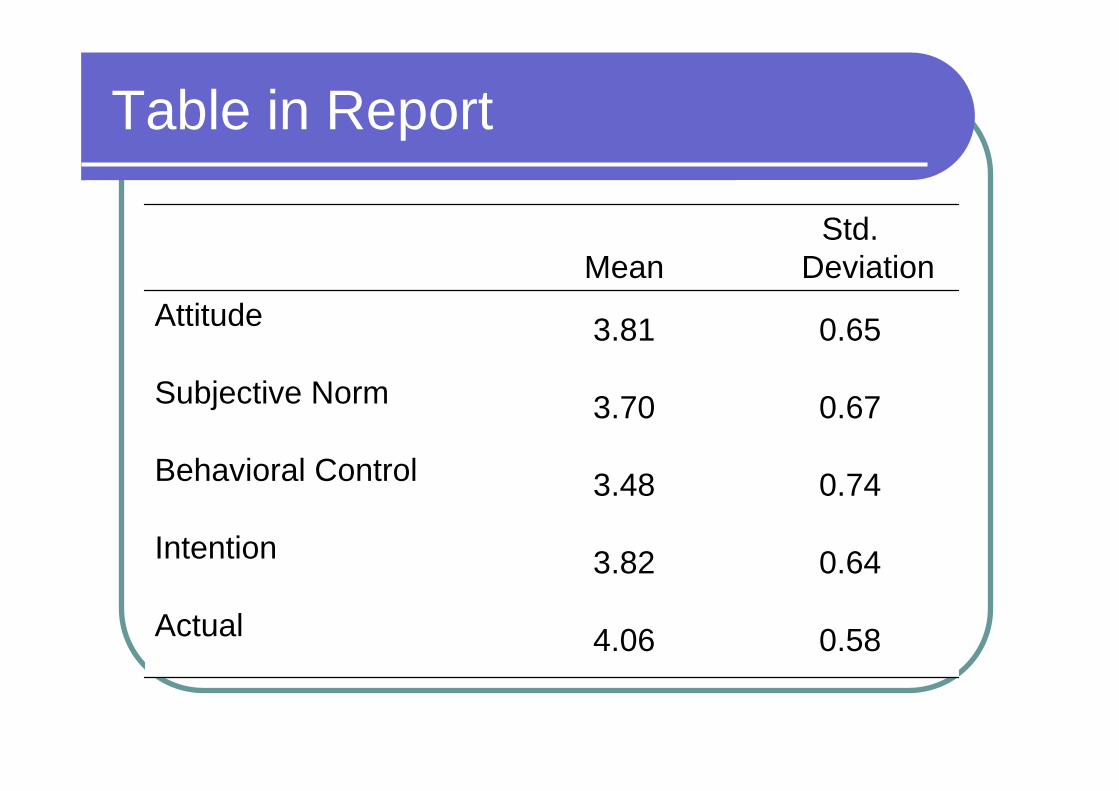
Table in Report
0.584.06Actual
0.643.82Intention
0.743.48Behavioral Control
0.673.70Subjective Norm
0.653.81Attitude
Std. DeviationMean
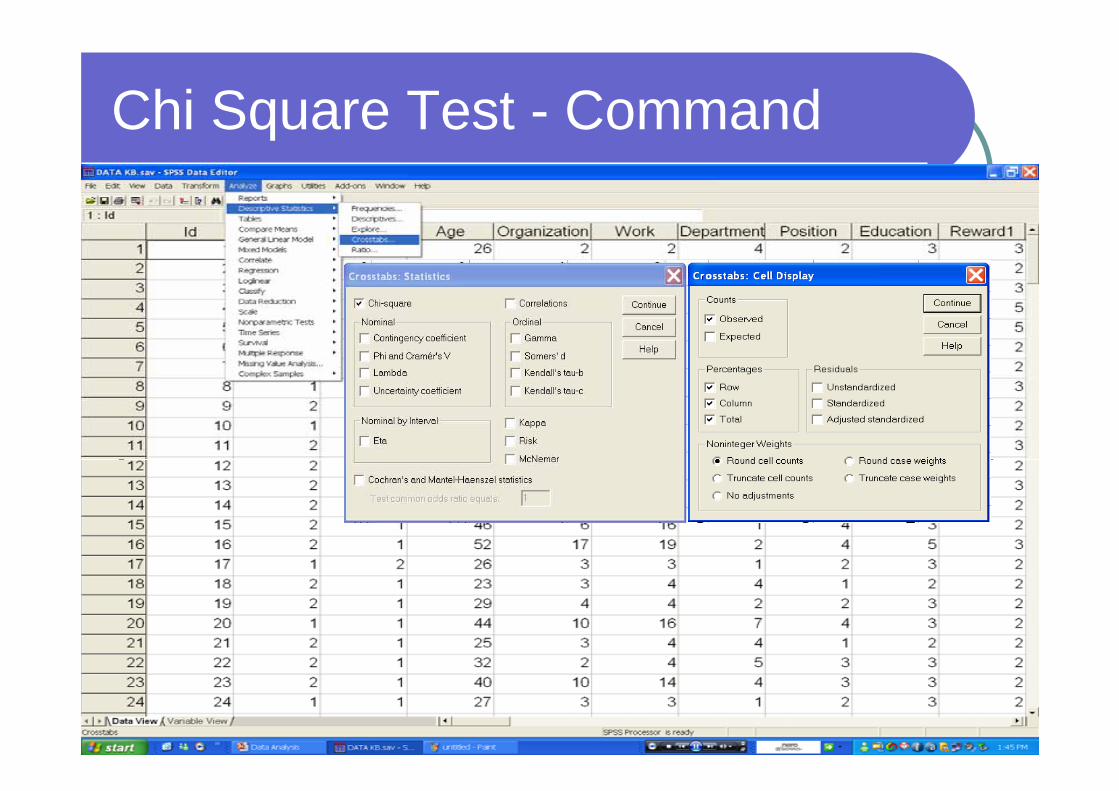
Chi Square Test - Command
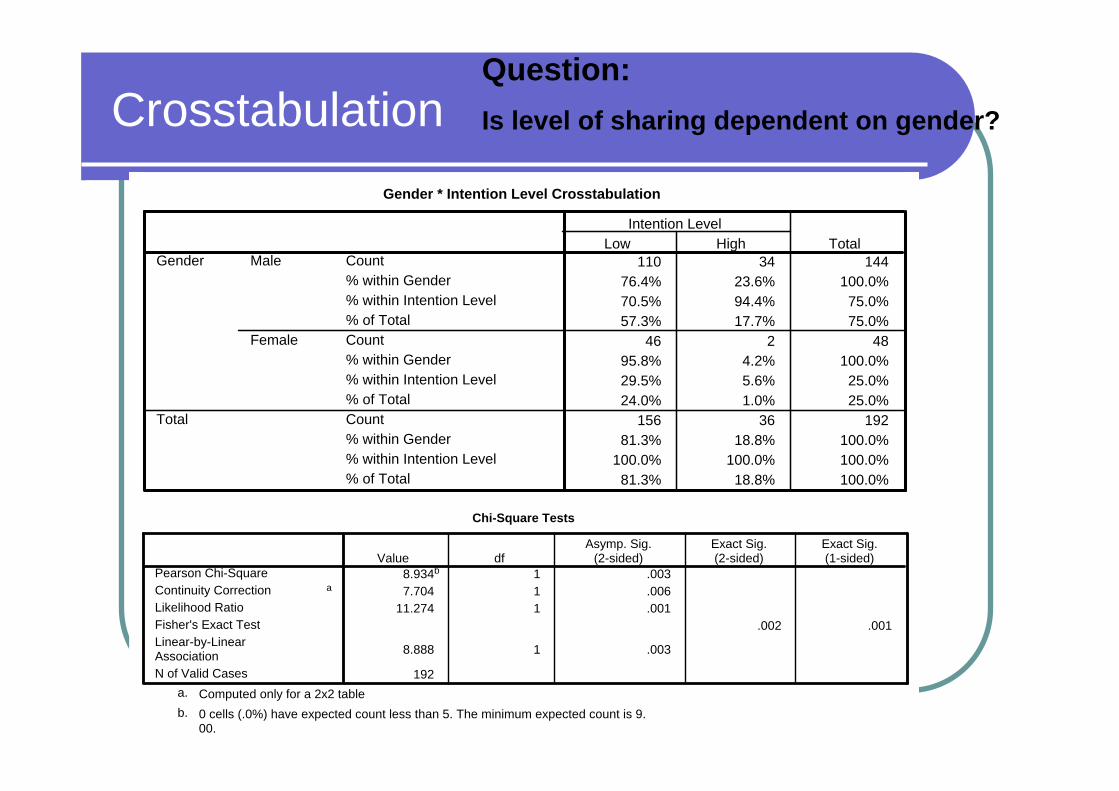
CrosstabulationGender * Intention Level Crosstabulation
110 34 14476.4% 23.6% 100.0%70.5% 94.4% 75.0%57.3% 17.7% 75.0%
46 2 4895.8% 4.2% 100.0%29.5% 5.6% 25.0%24.0% 1.0% 25.0%
156 36 19281.3% 18.8% 100.0%
100.0% 100.0% 100.0%81.3% 18.8% 100.0%
Count% within Gender% within Intention Level% of TotalCount% within Gender% within Intention Level% of TotalCount% within Gender% within Intention Level% of Total
Male
Female
Gender
Total
Low HighIntention Level
Total
Chi-Square Tests
8.934b 1 .0037.704 1 .006
11.274 1 .001.002 .001
8.888 1 .003
192
Pearson Chi-SquareContinuity Correction a
Likelihood RatioFisher's Exact TestLinear-by-LinearAssociationN of Valid Cases
Value dfAsymp. Sig.
(2-sided)Exact Sig.(2-sided)
Exact Sig.(1-sided)
Computed only for a 2x2 tablea.
0 cells (.0%) have expected count less than 5. The minimum expected count is 9.00.
b.
Question:Is level of sharing dependent on gender?
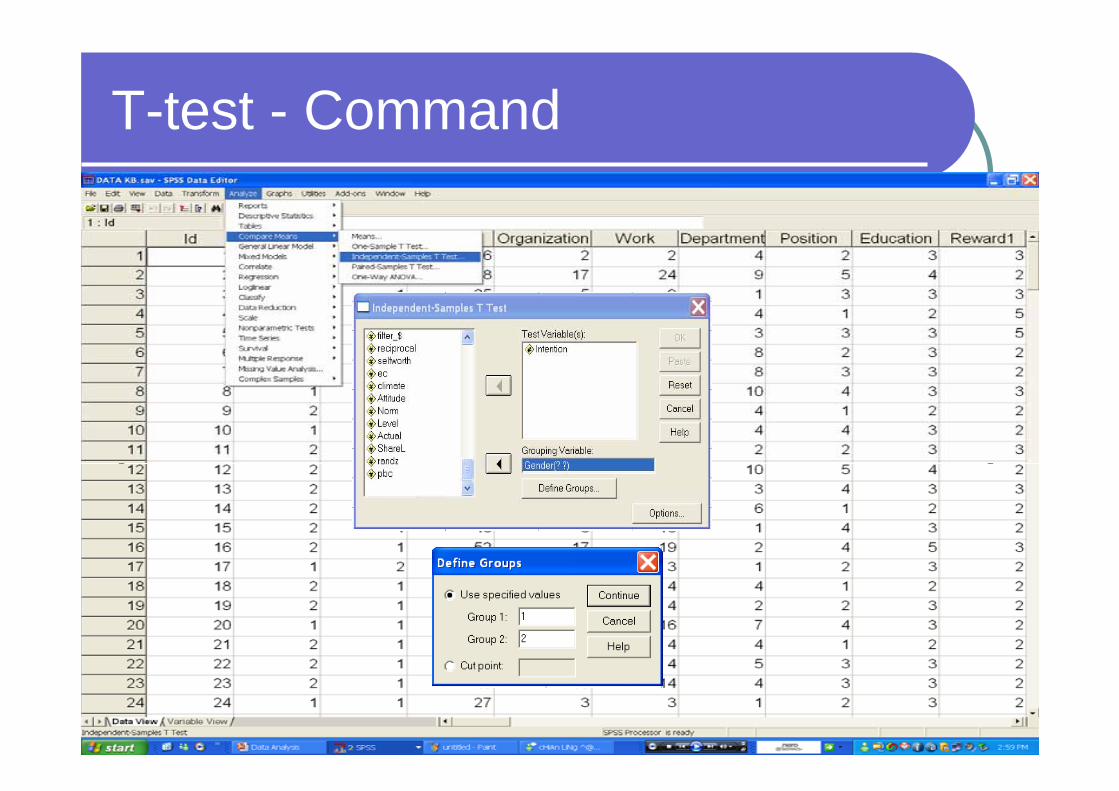
T-test - Command
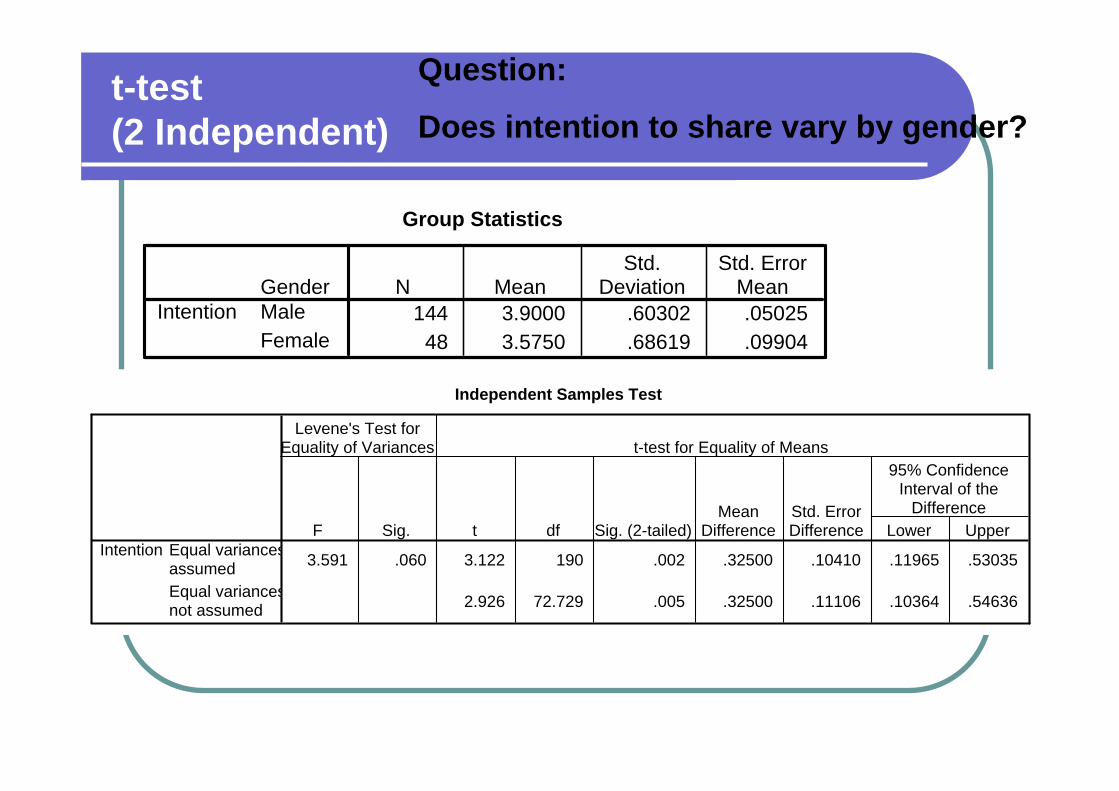
t-test (2 Independent)
Group Statistics
144 3.9000 .60302 .0502548 3.5750 .68619 .09904
GenderMaleFemale
IntentionN Mean
Std.Deviation
Std. ErrorMean
Independent Samples Test
3.591 .060 3.122 190 .002 .32500 .10410 .11965 .53035
2.926 72.729 .005 .32500 .11106 .10364 .54636
Equal variancesassumedEqual variancesnot assumed
IntentionF Sig.
Levene's Test forEquality of Variances
t df Sig. (2-tailed)Mean
DifferenceStd. ErrorDifference Lower Upper
95% ConfidenceInterval of the
Difference
t-test for Equality of Means
Question:
Does intention to share vary by gender?
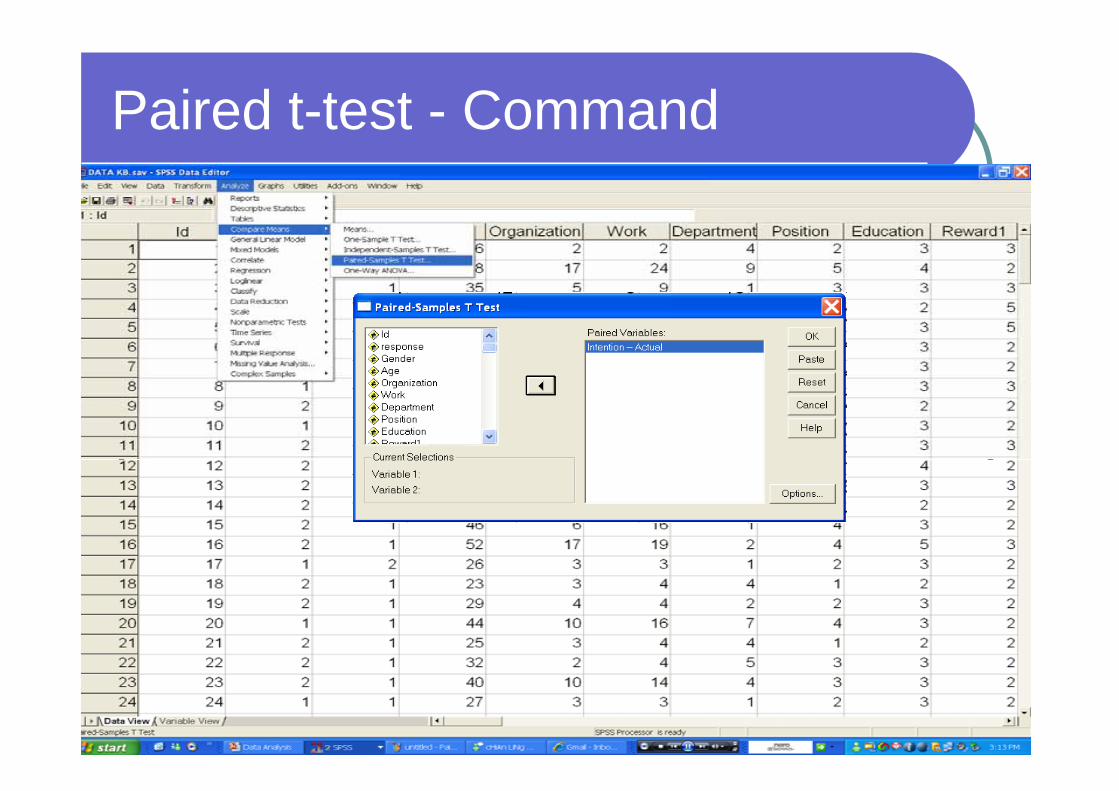
Paired t-test - Command
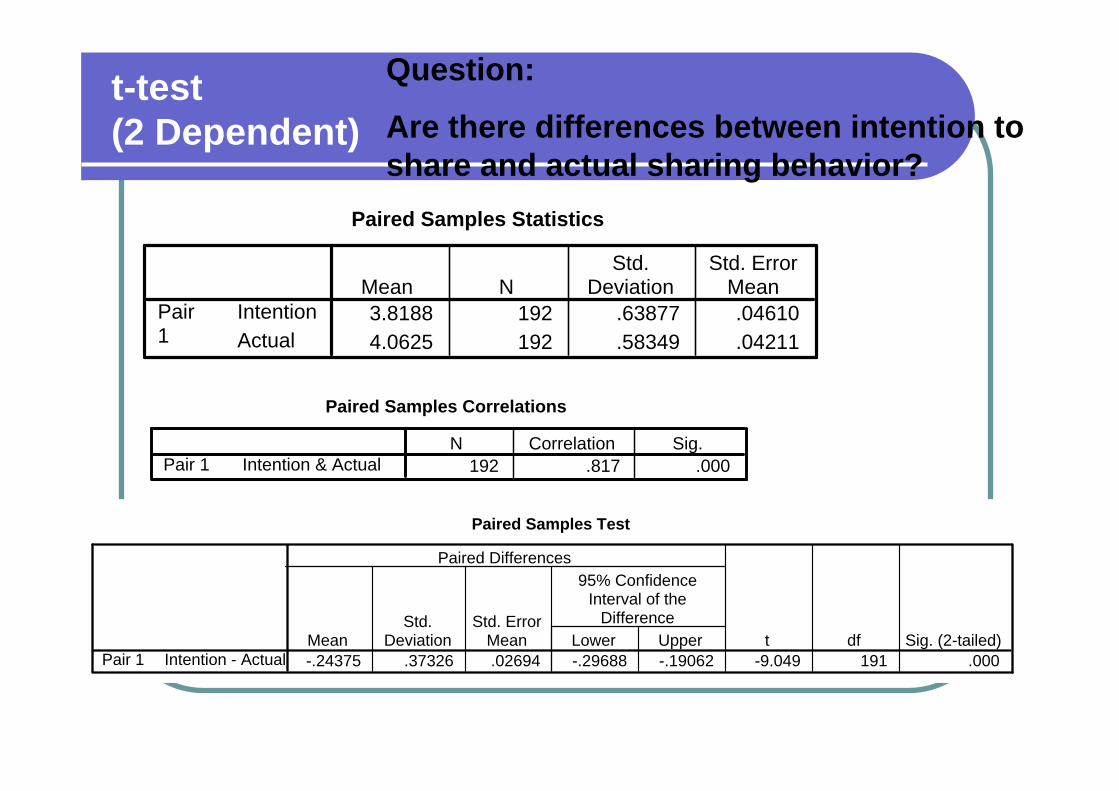
t-test (2 Dependent)
Paired Samples Statistics
3.8188 192 .63877 .046104.0625 192 .58349 .04211
IntentionActual
Pair1
Mean NStd.
DeviationStd. Error
Mean
Paired Samples Correlations
192 .817 .000Intention & ActualPair 1N Correlation Sig.
Paired Samples Test
-.24375 .37326 .02694 -.29688 -.19062 -9.049 191 .000Intention - ActualPair 1Mean
Std.Deviation
Std. ErrorMean Lower Upper
95% ConfidenceInterval of the
Difference
Paired Differences
t df Sig. (2-tailed)
Question:
Are there differences between intention to share and actual sharing behavior?
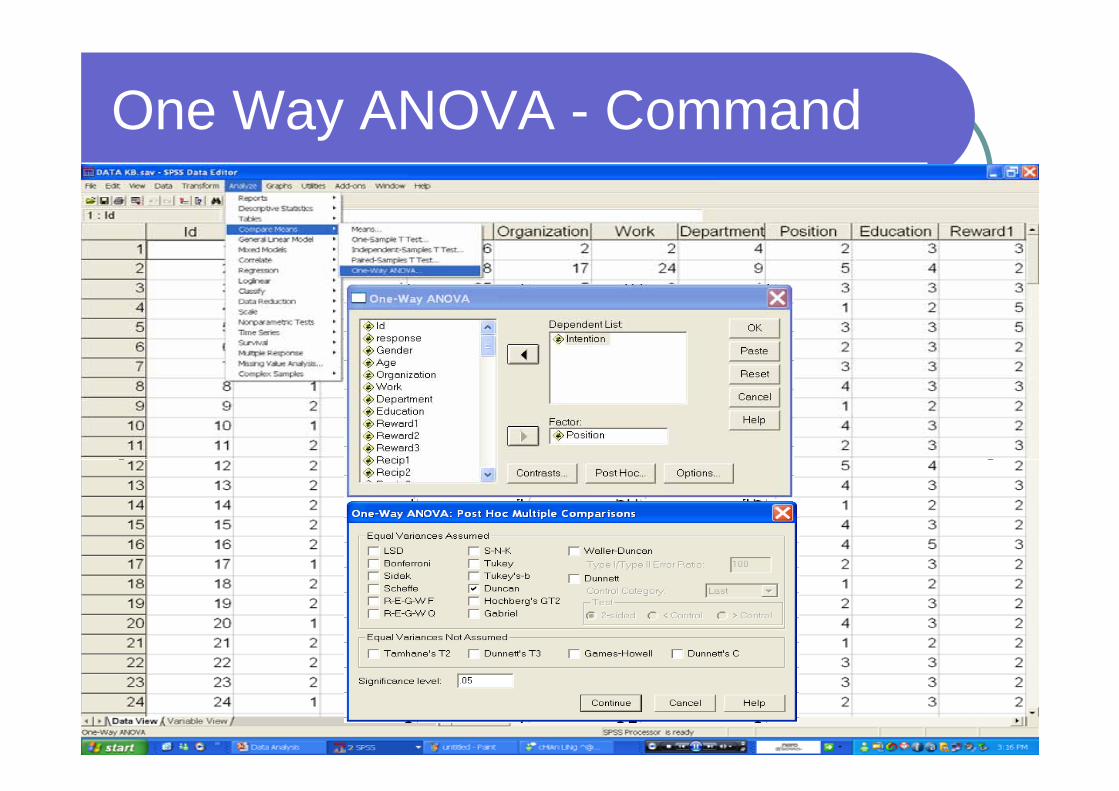
One Way ANOVA - Command
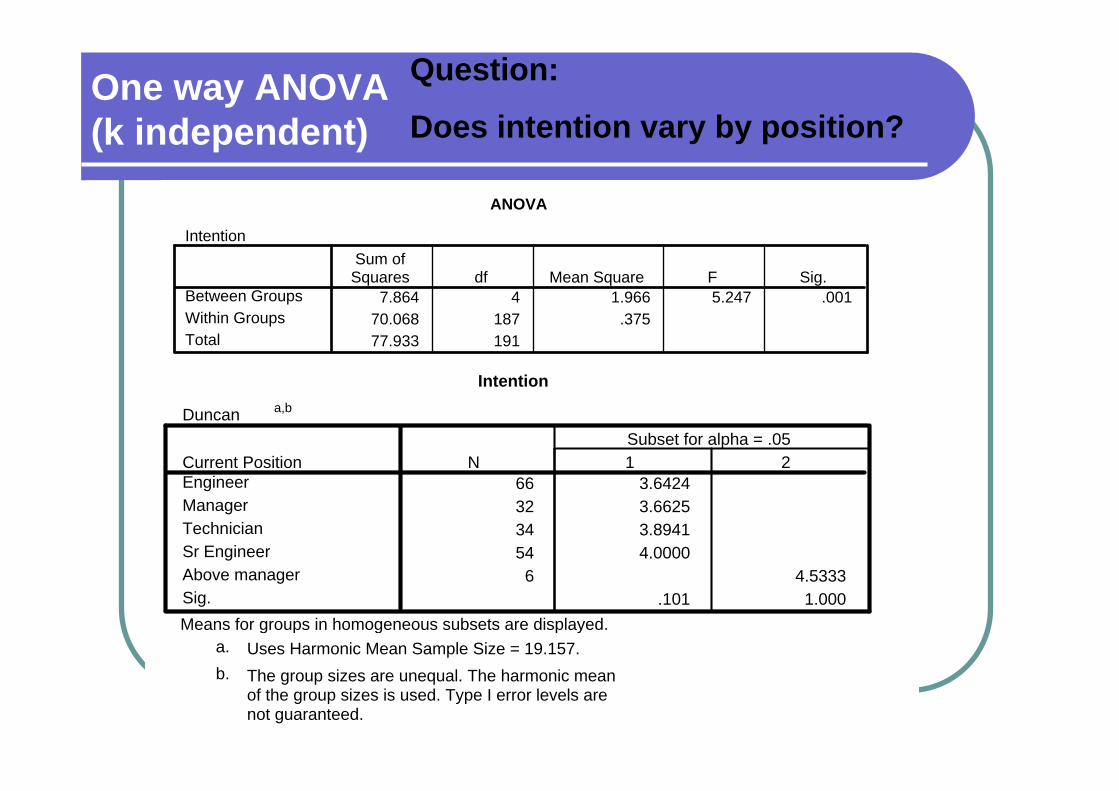
One way ANOVA (k independent)
ANOVA
Intention
7.864 4 1.966 5.247 .00170.068 187 .37577.933 191
Between GroupsWithin GroupsTotal
Sum ofSquares df Mean Square F Sig.
Intention
Duncan a,b
66 3.642432 3.662534 3.894154 4.00006 4.5333
.101 1.000
Current PositionEngineerManagerTechnicianSr EngineerAbove managerSig.
N 1 2Subset for alpha = .05
Means for groups in homogeneous subsets are displayed.Uses Harmonic Mean Sample Size = 19.157.a.
The group sizes are unequal. The harmonic meanof the group sizes is used. Type I error levels arenot guaranteed.
b.
Question:
Does intention vary by position?
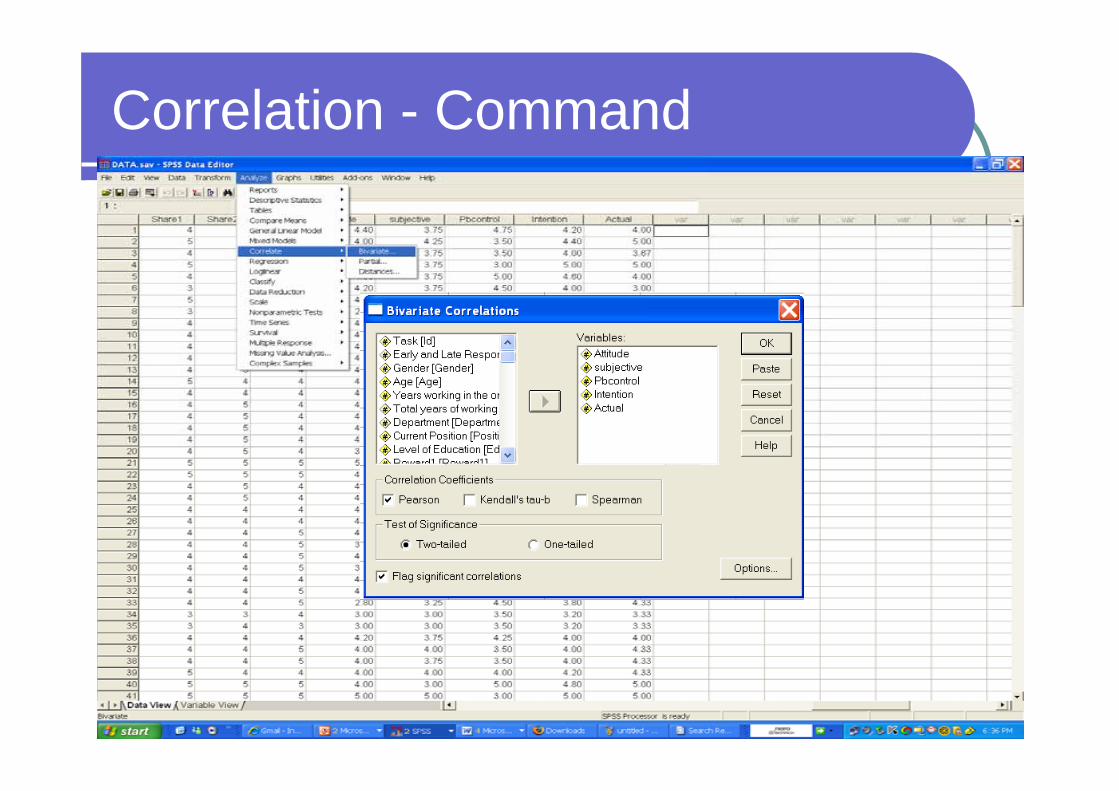
Correlation - Command
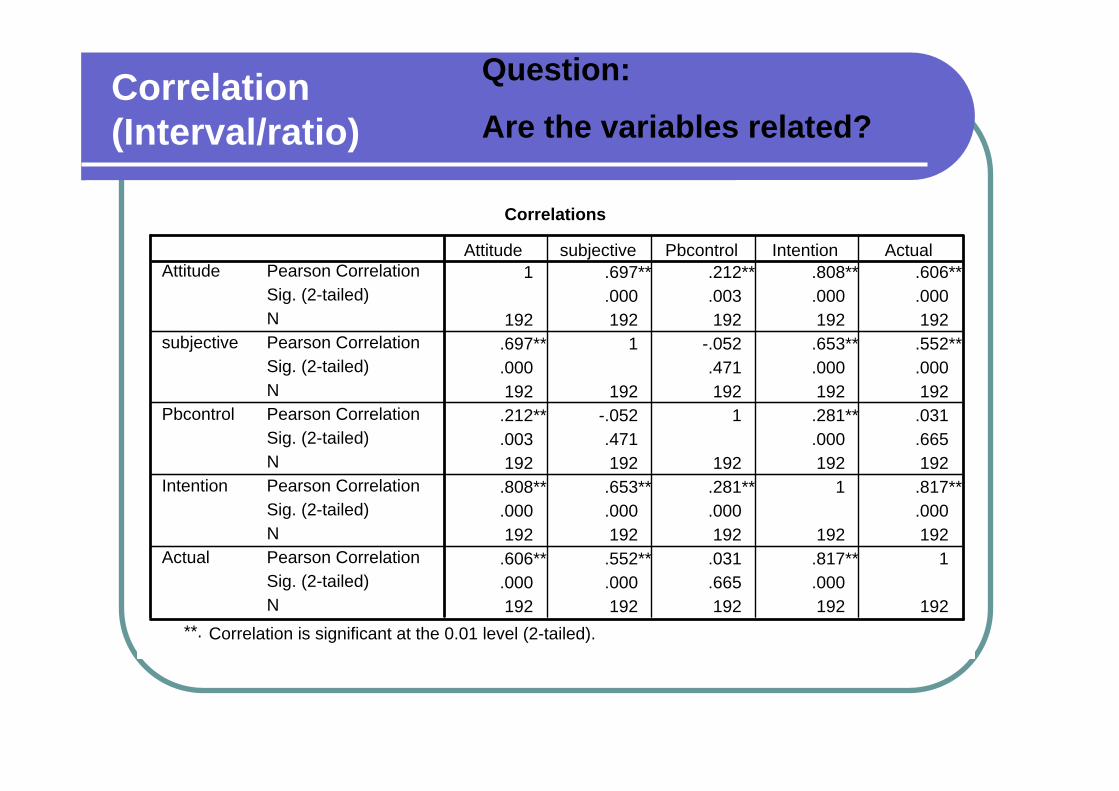
Correlation (Interval/ratio)
Question:
Are the variables related?
Correlations
1 .697** .212** .808** .606**.000 .003 .000 .000
192 192 192 192 192.697** 1 -.052 .653** .552**.000 .471 .000 .000192 192 192 192 192.212** -.052 1 .281** .031.003 .471 .000 .665192 192 192 192 192.808** .653** .281** 1 .817**.000 .000 .000 .000192 192 192 192 192.606** .552** .031 .817** 1.000 .000 .665 .000192 192 192 192 192
Pearson CorrelationSig. (2-tailed)NPearson CorrelationSig. (2-tailed)NPearson CorrelationSig. (2-tailed)NPearson CorrelationSig. (2-tailed)NPearson CorrelationSig. (2-tailed)N
Attitude
subjective
Pbcontrol
Intention
Actual
Attitude subjective Pbcontrol Intention Actual
Correlation is significant at the 0.01 level (2-tailed).**.
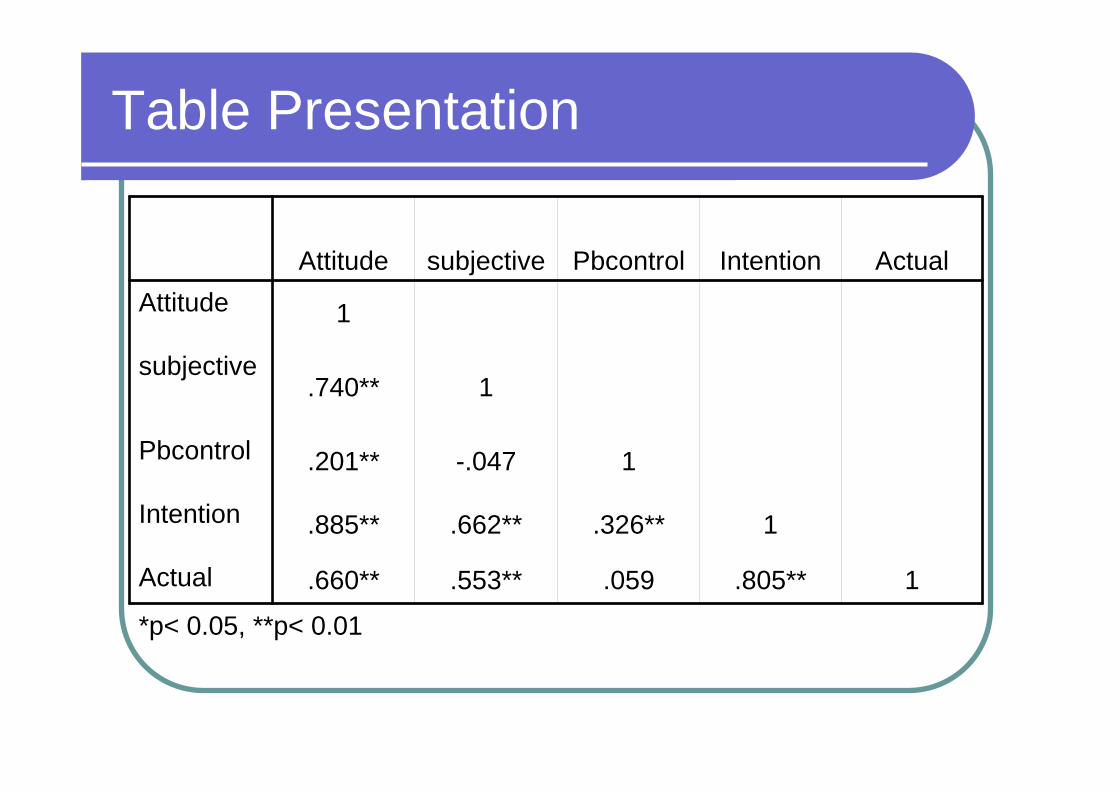
Table Presentation
1.805**.059.553**.660**Actual
1.326**.662**.885**Intention
1-.047.201**Pbcontrol
1.740**subjective
1AttitudeActualIntentionPbcontrolsubjectiveAttitude
*p< 0.05, **p< 0.01
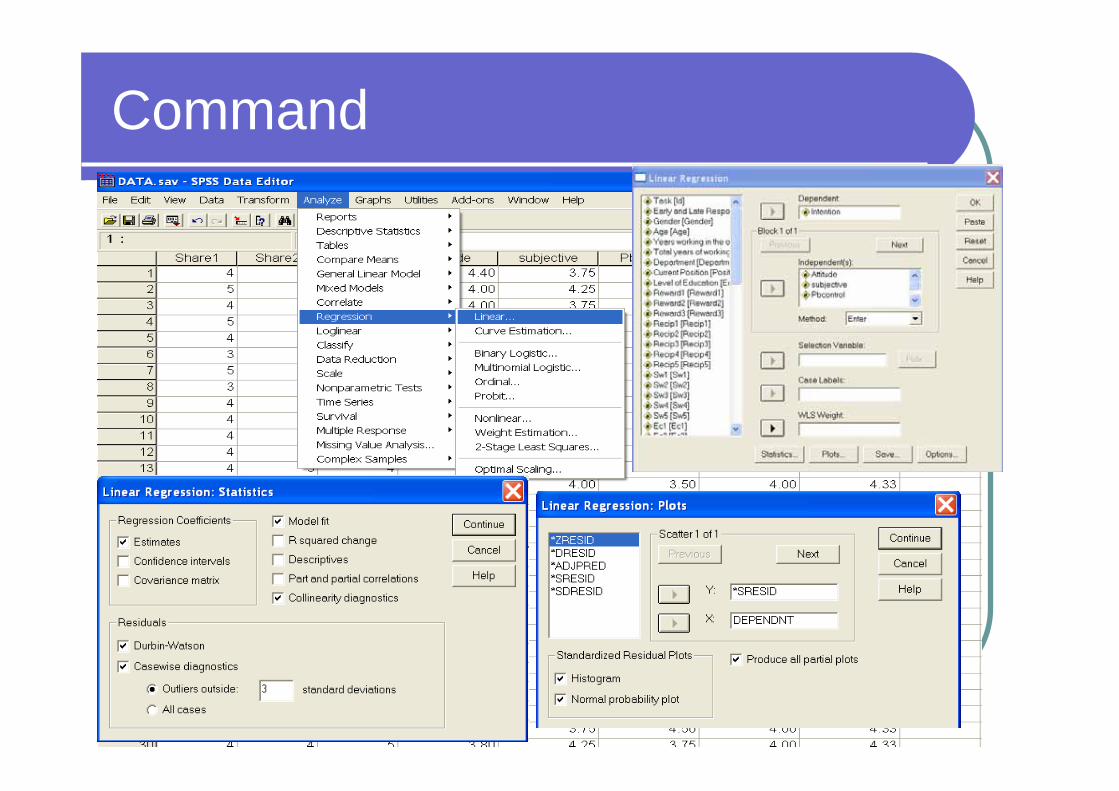
Command
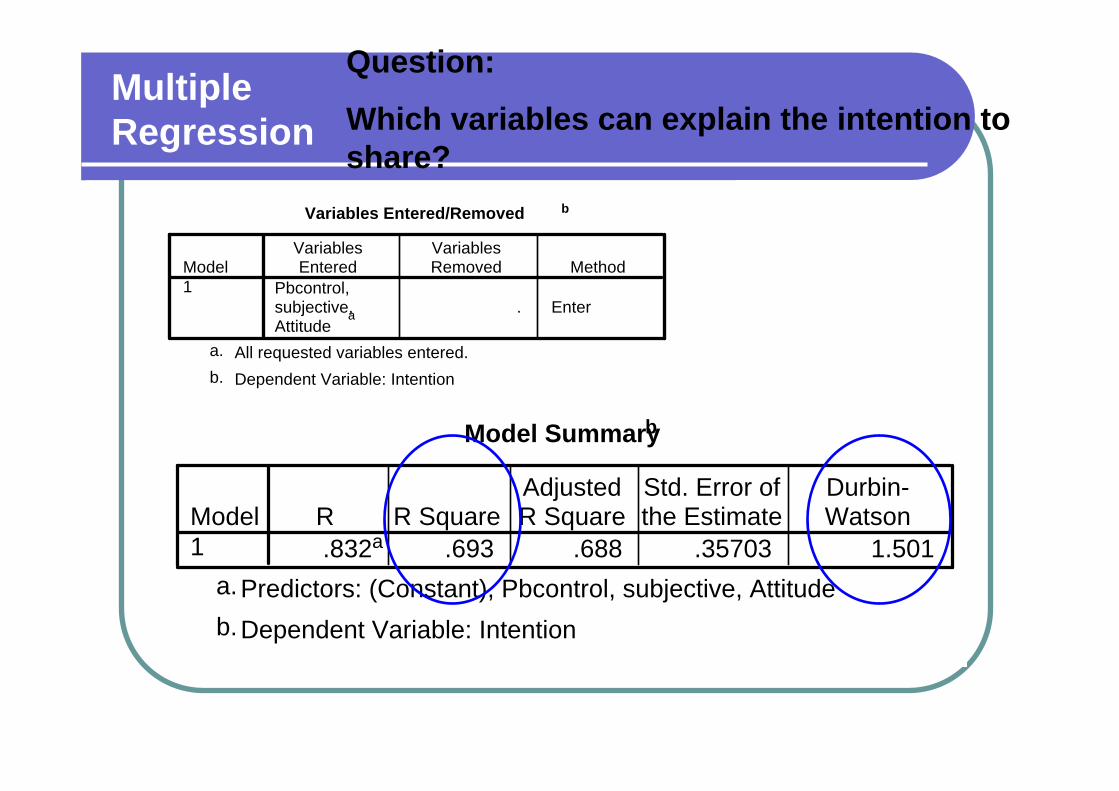
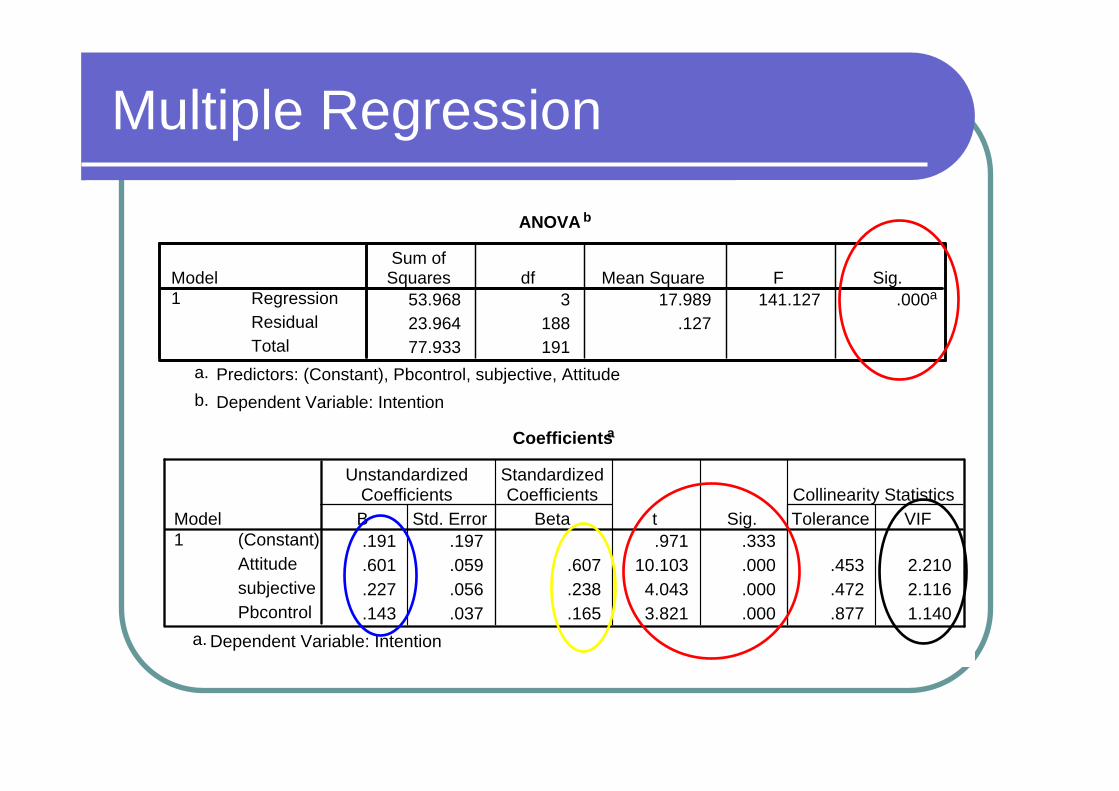
Multiple Regression
Question:
Which variables can explain the intention to share?
Variables Entered/Removed b
Pbcontrol,subjective,Attitude
a . Enter
Model1
VariablesEntered
VariablesRemoved Method
All requested variables entered.a.
Dependent Variable: Intentionb.
Model Summaryb
.832a .693 .688 .35703 1.501Model1
R R SquareAdjustedR Square
Std. Error ofthe Estimate
Durbin-Watson
Predictors: (Constant), Pbcontrol, subjective, Attitudea.
Dependent Variable: Intentionb.
Multiple Regression
ANOVA b
53.968 3 17.989 141.127 .000a
23.964 188 .12777.933 191
RegressionResidualTotal
Model1
Sum ofSquares df Mean Square F Sig.
Predictors: (Constant), Pbcontrol, subjective, Attitudea.
Dependent Variable: Intentionb.
Coefficientsa
.191 .197 .971 .333
.601 .059 .607 10.103 .000 .453 2.210
.227 .056 .238 4.043 .000 .472 2.116
.143 .037 .165 3.821 .000 .877 1.140
(Constant)AttitudesubjectivePbcontrol
Model1
B Std. Error
UnstandardizedCoefficients
Beta
StandardizedCoefficients
t Sig. Tolerance VIFCollinearity Statistics
Dependent Variable: Intentiona.
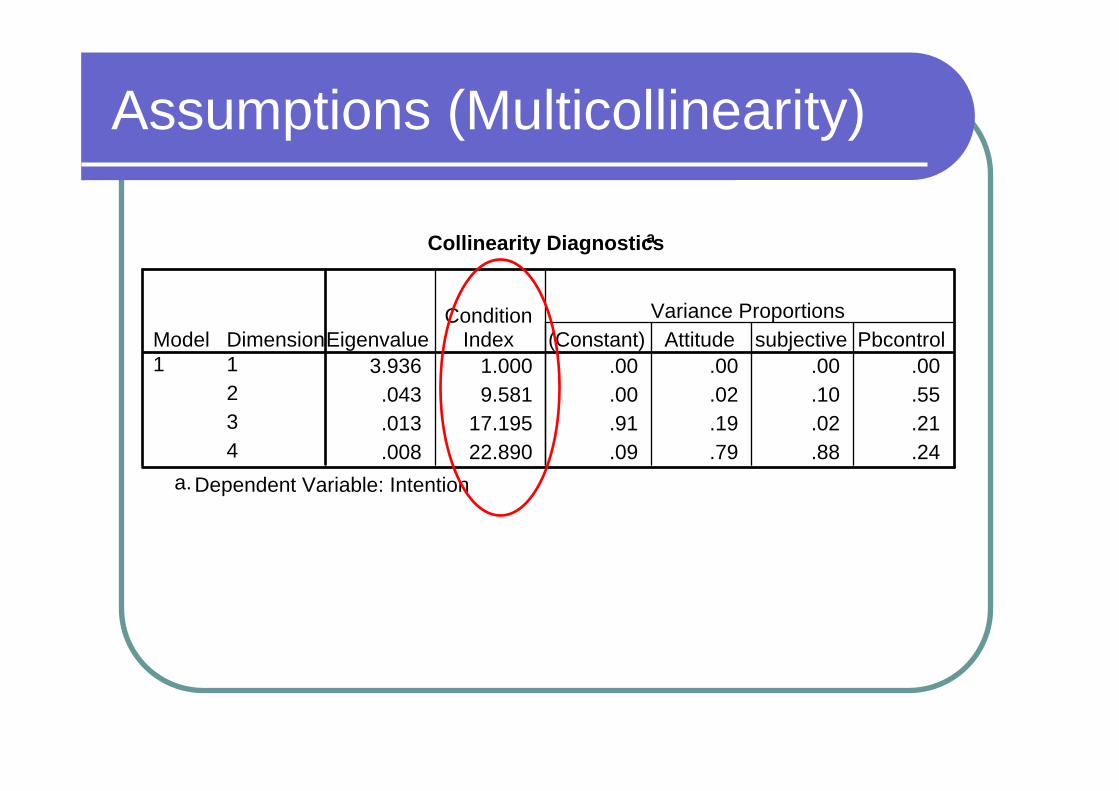
Assumptions (Multicollinearity)
Collinearity Diagnosticsa
3.936 1.000 .00 .00 .00 .00.043 9.581 .00 .02 .10 .55.013 17.195 .91 .19 .02 .21.008 22.890 .09 .79 .88 .24
Dimension1234
Model1
EigenvalueCondition
Index (Constant) Attitude subjective PbcontrolVariance Proportions
Dependent Variable: Intentiona.
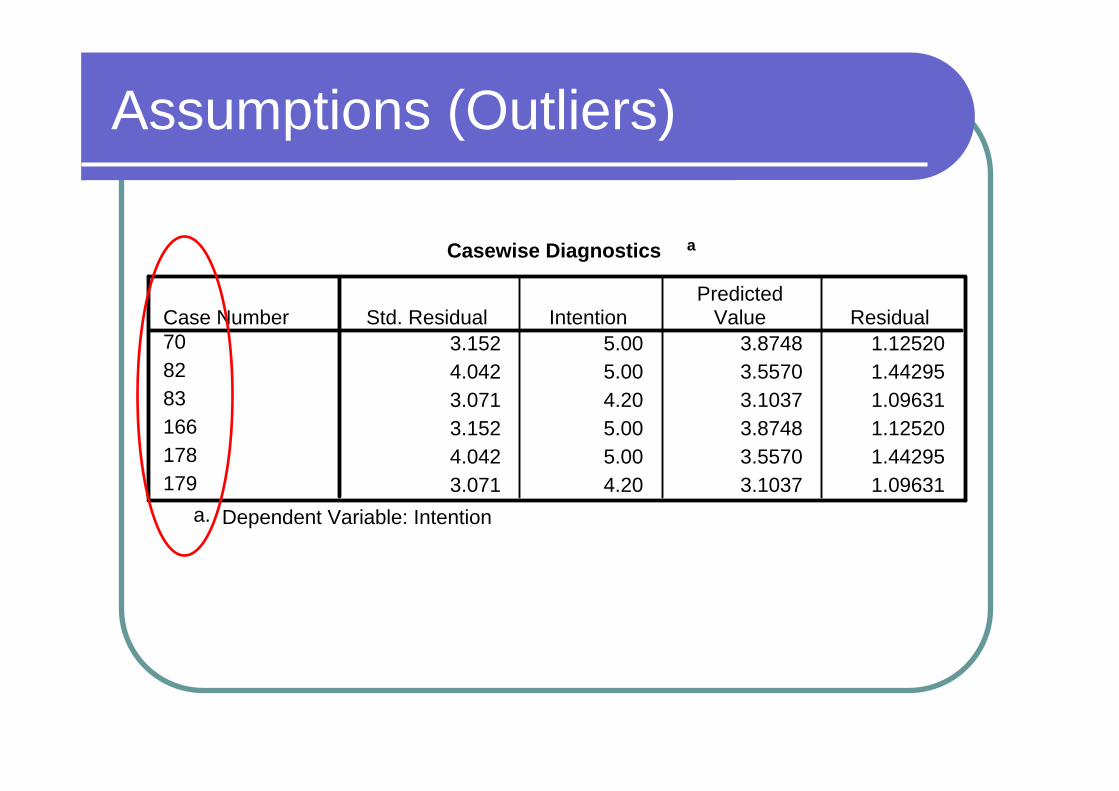
Assumptions (Outliers)
Casewise Diagnostics a
3.152 5.00 3.8748 1.125204.042 5.00 3.5570 1.442953.071 4.20 3.1037 1.096313.152 5.00 3.8748 1.125204.042 5.00 3.5570 1.442953.071 4.20 3.1037 1.09631
Case Number708283166178179
Std. Residual IntentionPredicted
Value Residual
Dependent Variable: Intentiona.
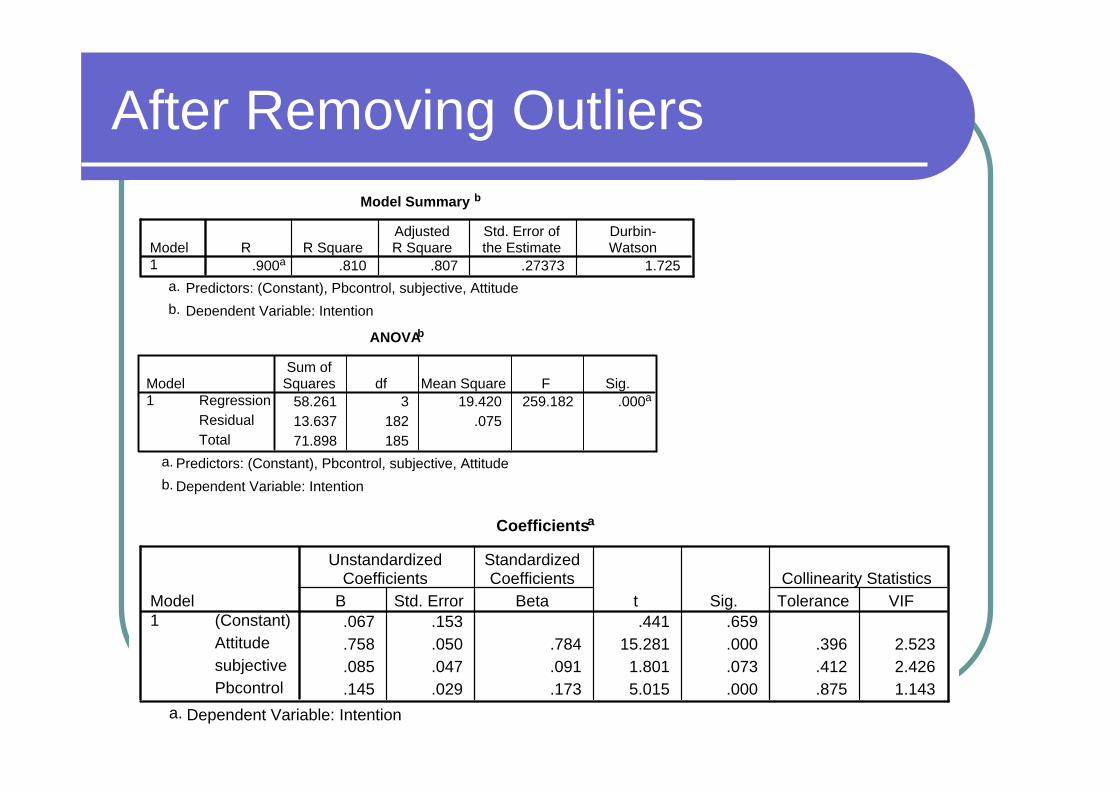
After Removing OutliersModel Summary b
.900a .810 .807 .27373 1.725Model1
R R SquareAdjustedR Square
Std. Error ofthe Estimate
Durbin-Watson
Predictors: (Constant), Pbcontrol, subjective, Attitudea.
Dependent Variable: Intentionb.
Coefficientsa
.067 .153 .441 .659
.758 .050 .784 15.281 .000 .396 2.523
.085 .047 .091 1.801 .073 .412 2.426
.145 .029 .173 5.015 .000 .875 1.143
(Constant)AttitudesubjectivePbcontrol
Model1
B Std. Error
UnstandardizedCoefficients
Beta
StandardizedCoefficients
t Sig. Tolerance VIFCollinearity Statistics
Dependent Variable: Intentiona.
ANOVAb
58.261 3 19.420 259.182 .000a
13.637 182 .07571.898 185
RegressionResidualTotal
Model1
Sum ofSquares df Mean Square F Sig.
Predictors: (Constant), Pbcontrol, subjective, Attitudea.
Dependent Variable: Intentionb.
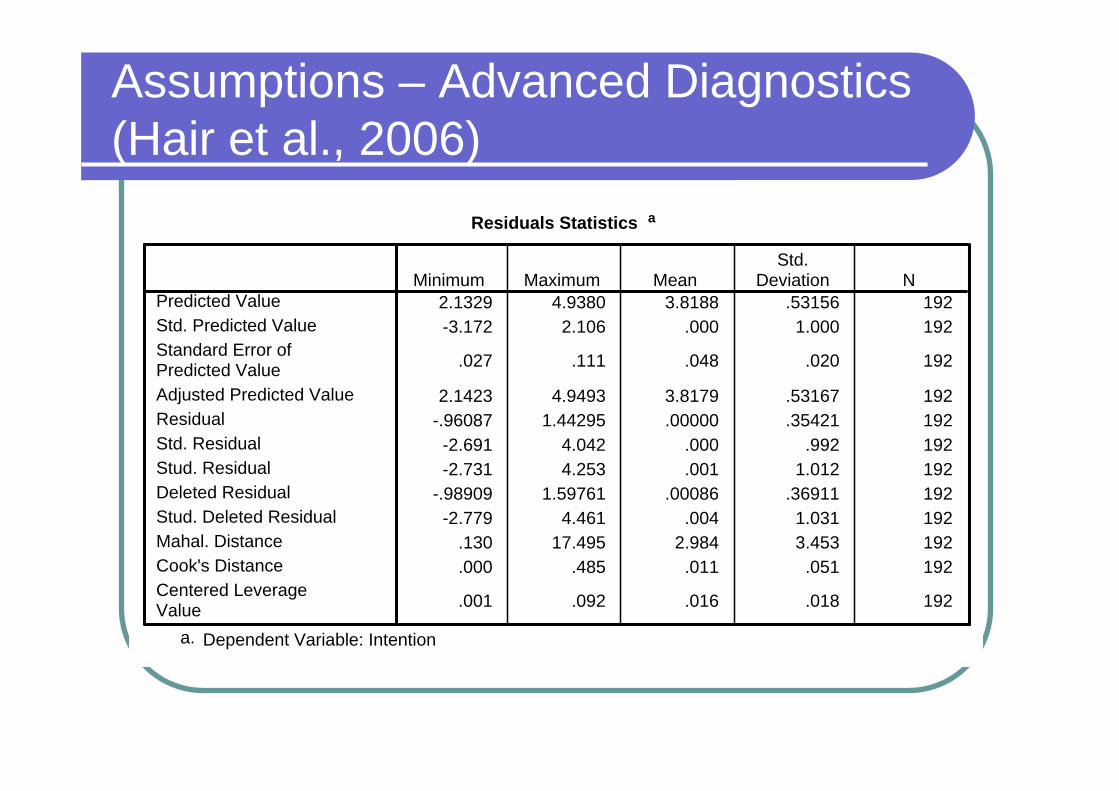
Assumptions – Advanced Diagnostics (Hair et al., 2006)
Residuals Statistics a
2.1329 4.9380 3.8188 .53156 192-3.172 2.106 .000 1.000 192
.027 .111 .048 .020 192
2.1423 4.9493 3.8179 .53167 192-.96087 1.44295 .00000 .35421 192
-2.691 4.042 .000 .992 192-2.731 4.253 .001 1.012 192
-.98909 1.59761 .00086 .36911 192-2.779 4.461 .004 1.031 192
.130 17.495 2.984 3.453 192
.000 .485 .011 .051 192
.001 .092 .016 .018 192
Predicted ValueStd. Predicted ValueStandard Error ofPredicted ValueAdjusted Predicted ValueResidualStd. ResidualStud. ResidualDeleted ResidualStud. Deleted ResidualMahal. DistanceCook's DistanceCentered LeverageValue
Minimum Maximum MeanStd.
Deviation N
Dependent Variable: Intentiona.
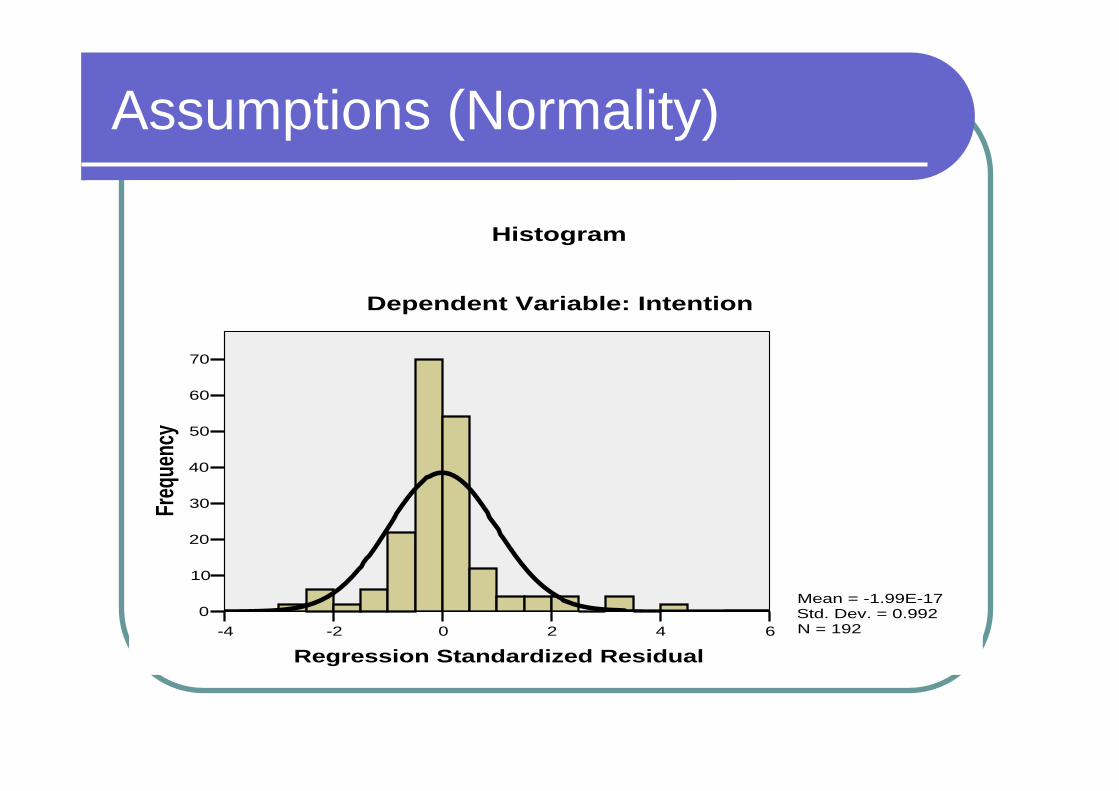
Assumptions (Normality)
6420-2-4
Regression Standardized Residual
70
60
50
40
30
20
10
0
Freq
uenc
y
Mean = -1.99E-17Std. Dev. = 0.992N = 192
Dependent Variable: Intention
Histogram
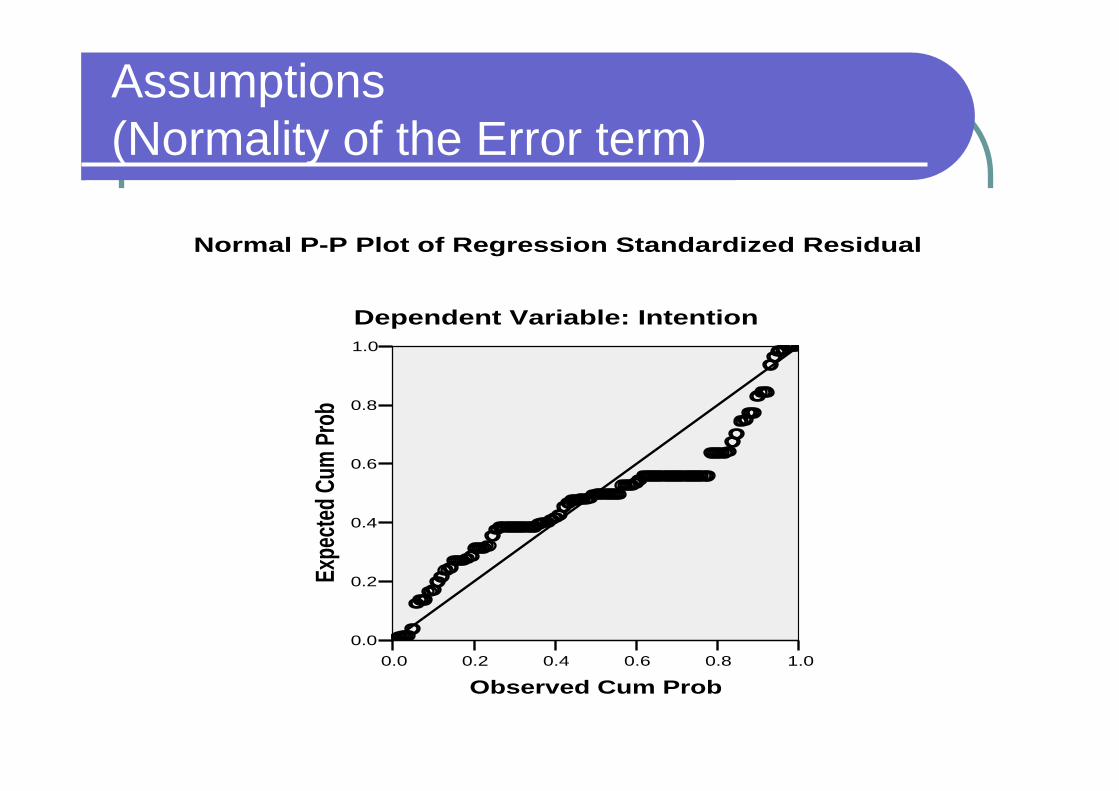
Assumptions (Normality of the Error term)
1.00.80.60.40.20.0
Observed Cum Prob
1.0
0.8
0.6
0.4
0.2
0.0
Expe
cted C
um Pr
obDependent Variable: Intention
Normal P-P Plot of Regression Standardized Residual
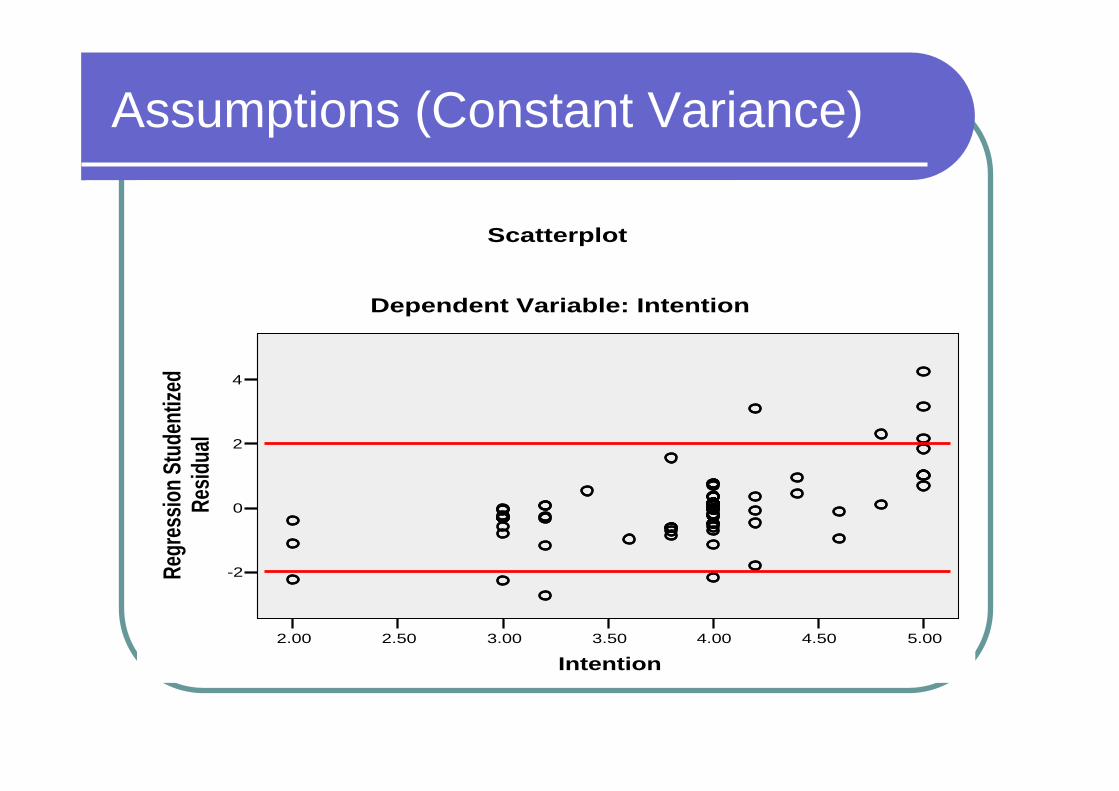
Assumptions (Constant Variance)
5.004.504.003.503.002.502.00
Intention
4
2
0
-2Regr
essio
n Stu
dent
ized
Resid
ual
Dependent Variable: Intention
Scatterplot
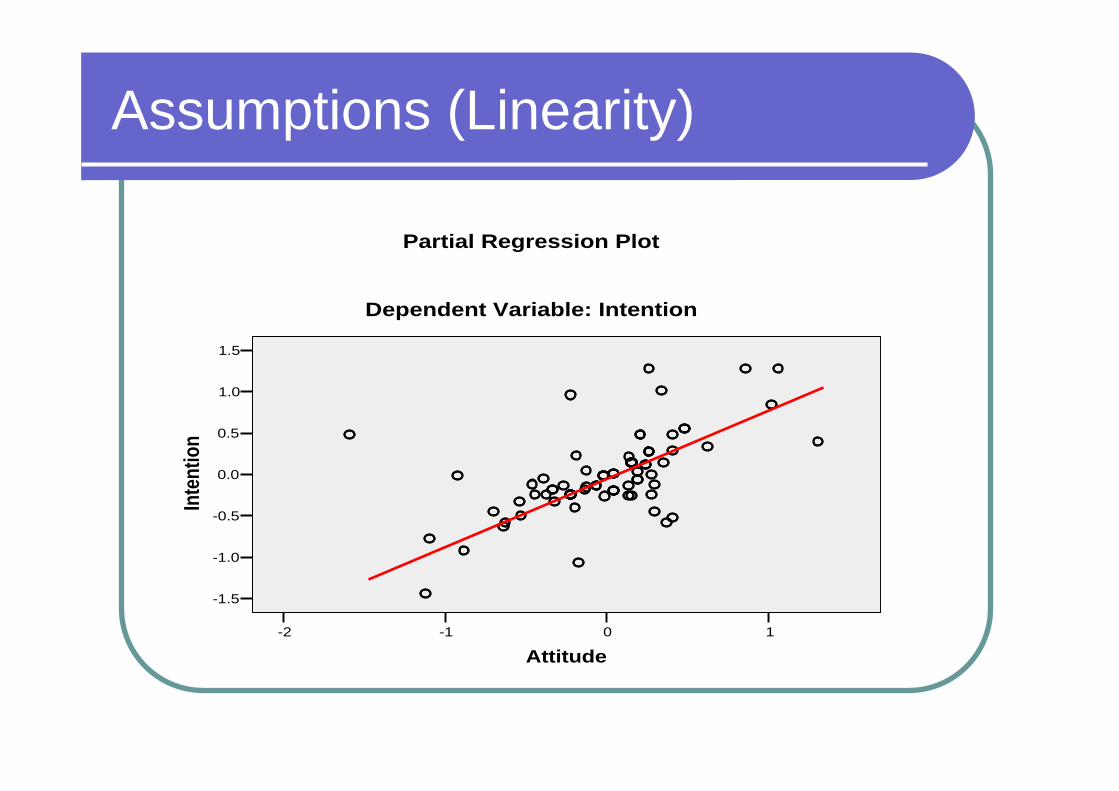
Assumptions (Linearity)
10-1-2
Attitude
1.5
1.0
0.5
0.0
-0.5
-1.0
-1.5
Inte
ntio
n
Dependent Variable: Intention
Partial Regression Plot
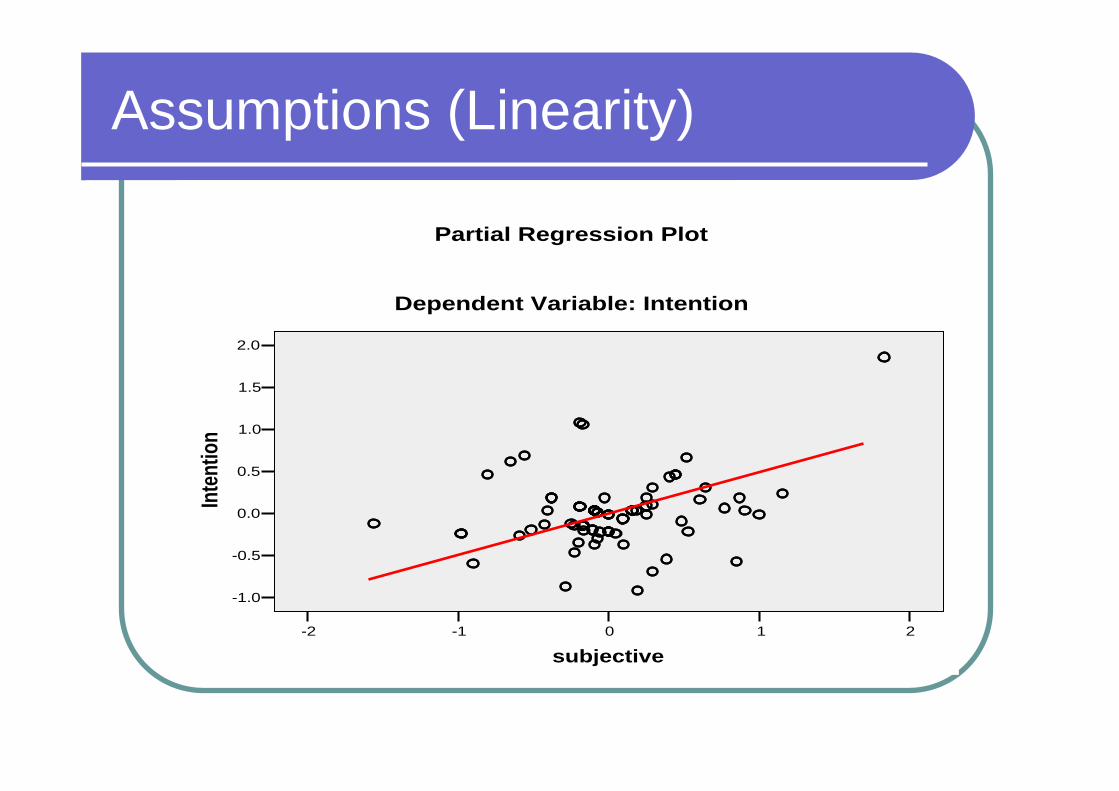
Assumptions (Linearity)
210-1-2
subjective
2.0
1.5
1.0
0.5
0.0
-0.5
-1.0
Inte
ntio
n
Dependent Variable: Intention
Partial Regression Plot
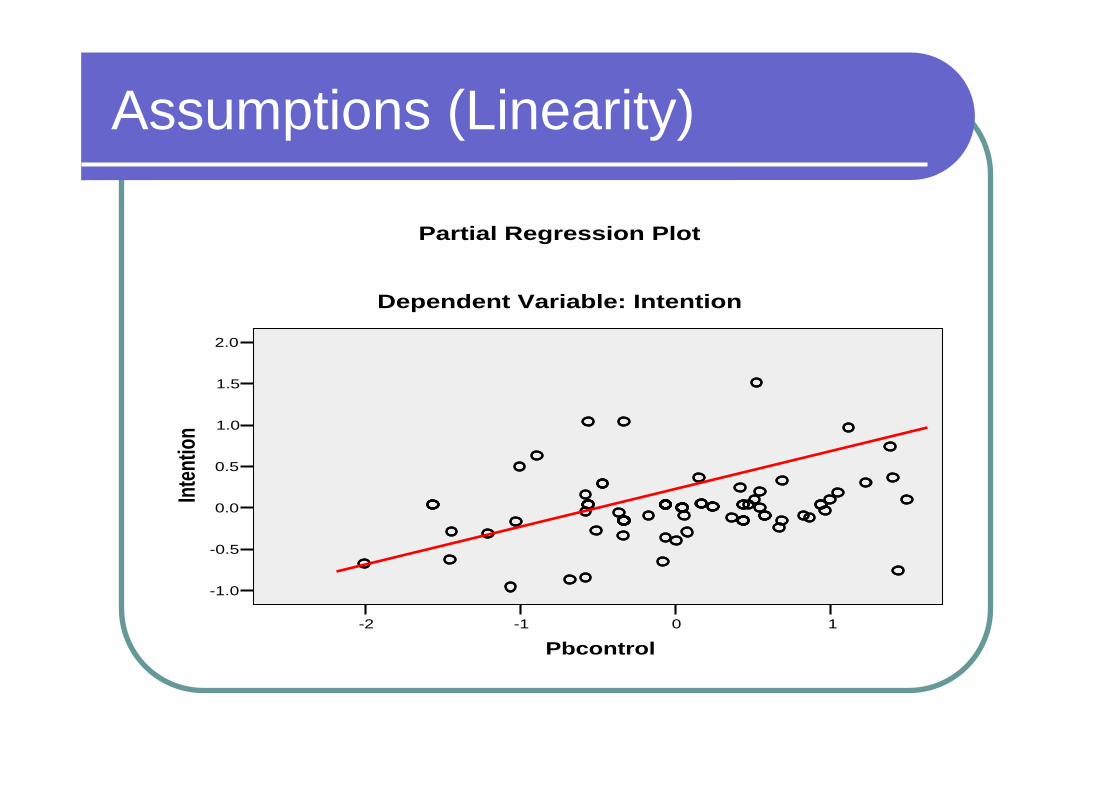
Assumptions (Linearity)
10-1-2
Pbcontrol
2.0
1.5
1.0
0.5
0.0
-0.5
-1.0
Inten
tion
Dependent Variable: Intention
Partial Regression Plot
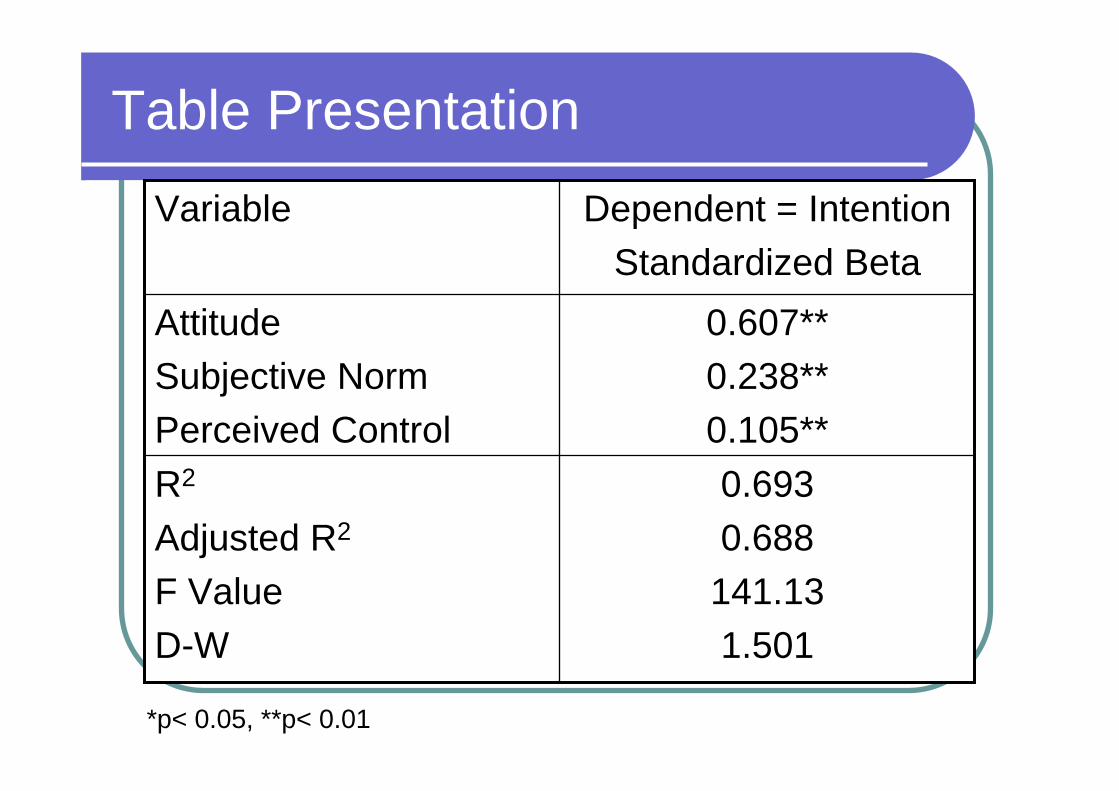
Table Presentation
0.607**0.238**0.105**
AttitudeSubjective NormPerceived Control
0.6930.688
141.131.501
R2
Adjusted R2
F ValueD-W
Dependent = IntentionStandardized Beta
Variable
*p< 0.05, **p< 0.01