Embed Size (px)
Citation preview

BUSINESS RESULTS1/1/2017 - 30/9/2017
BUSINESS RESULTS 1/1/2017 - 30/9/2017
2
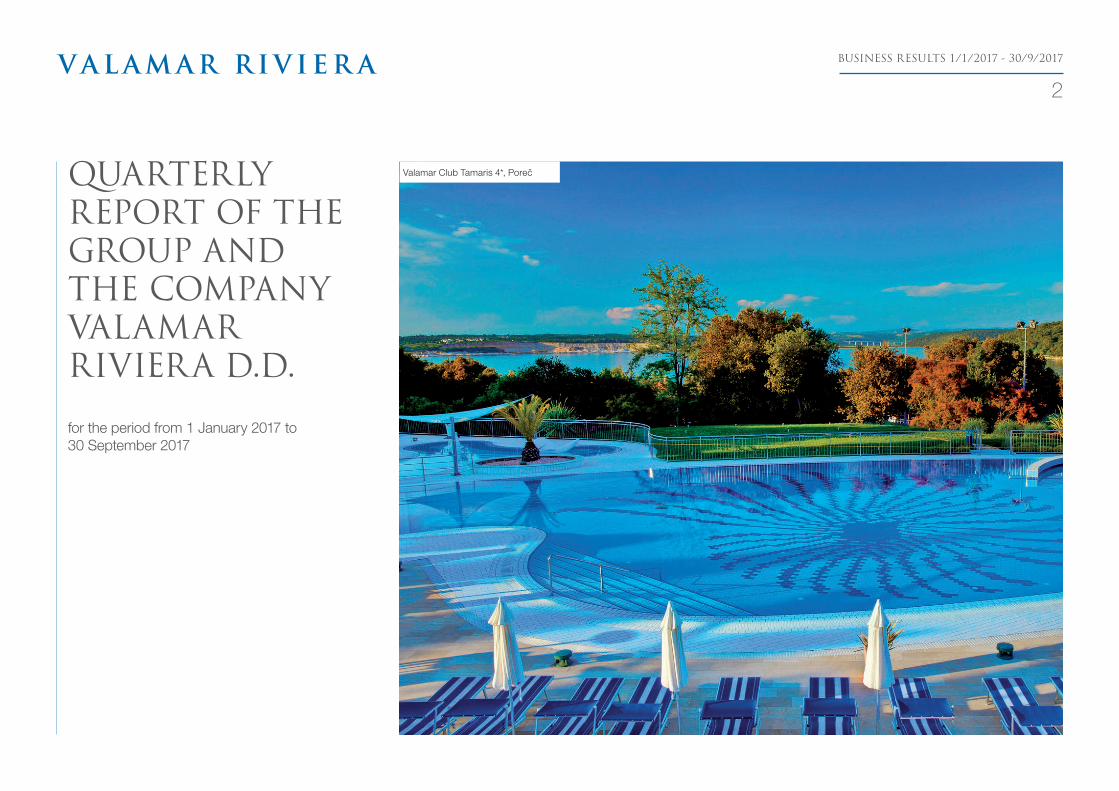
Valamar Club Tamaris 4*, PorečQUARTERLYREPORT OF THEGROUP AND THE COMPANYVALAMARRIVIERA D.D.
for the period from 1 January 2017 to 30 September 2017

BUSINESS RESULTS 1/1/2017 - 30/9/2017
3
In the first nine months of 2017 the Group reported strong adjusted EBITDA growth, up 19% and totaling HRK 772 million (HRK 649 million in 2016). The growth was mainly driven by higher sales revenues (up 20%; from HRK 1,382 million to HRK 1,665 million) and active operating efficiency management seen in the achieved adjusted EBITDA margin of 46% (46% in 2016), despite this year’s negative effect of foreign exchange differences on achieved sales revenues (1.3% average HRK vs. EUR appreciation compared to the first nine months in 2016) and VAT rate for hospitality services going from 13% to 25% as of 1 January 2017.
Total revenues were HRK 1,740 million, up 17% over last year’s comparable period (HRK 1,487 million in 2016). In the total revenues, HRK 1,665 million represented sales revenues (HRK 1,382 million in 2016) while the remaining part was mainly financial income, down by HRK 22 million (from HRK 81 million to HRK 59 million) due to last year’s one-off income from share portfolio sales. Sales revenues growth was largely driven by higher board revenues (up 23% and totaling HRK 1,387 million; HRK 1,127 million in 2016) and revenues of other operating departments (+32%; laundry, tourist agency, etc.).
In the first nine months of 2017 the Group reported 5,925,880 overnights (+20%) while the average daily rate rose by 6%. Board revenue growth was mainly driven by: i) the Imperial hotel group acquisition, ii) large investments focused on improving competitiveness and the quality of services and products, iii) demand-driven optimization of the distribution and price management iv) better occupancy and strong business results achieved during the first half of 2017.
Executive Summary
Bellevue Resort 4* and Valamar Girandella Resort 4*&5*), the development of premium camping resorts, Imperial’s projects and a range of other smaller projects for improving quality, operating efficiency and energy saving.
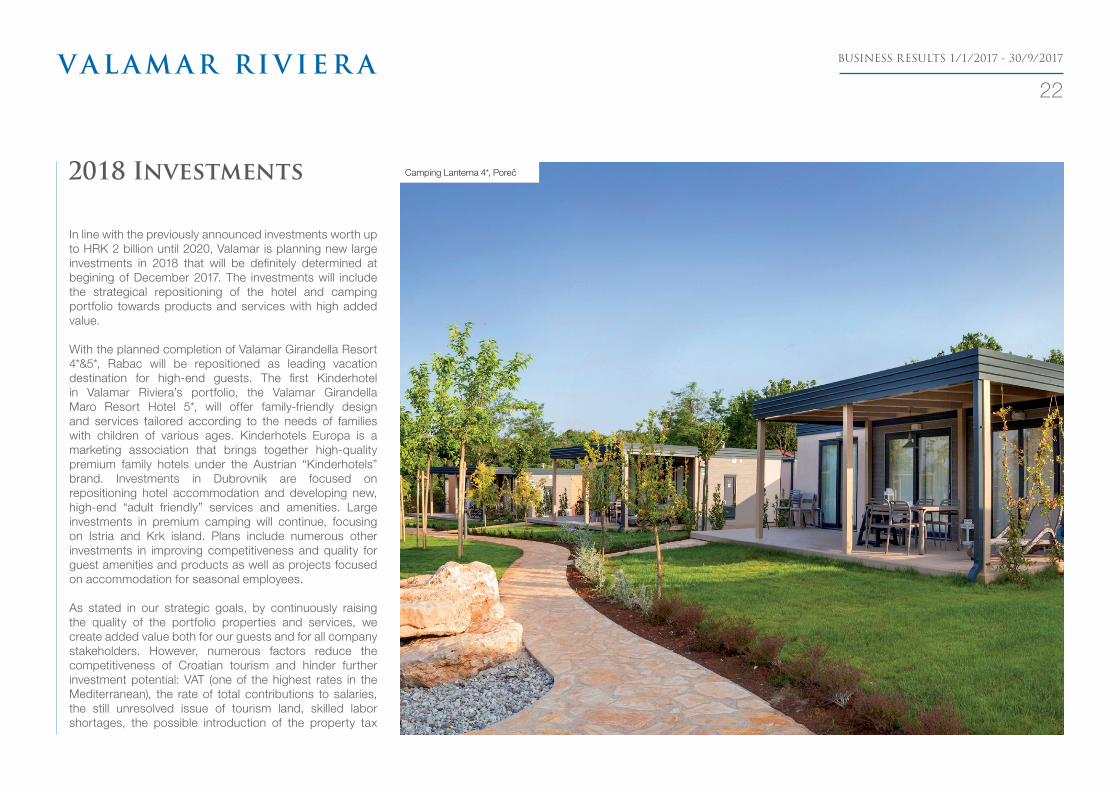
In line with the previously announced investments worth up to HRK 2 billion until 2020, Valamar Riviera is planning new large investments in 2018 that will be definitely determined at begining of December 2017. The planned investments will include the strategical repositioning of the hotel and camping portfolio towards products and services with high added value. For details, see “2018 Investments” on page 22.
Valamar Riviera is committed to increasing further transparency and quality of business and financial communication with investors. In 2017 Valamar Riviera won another first place award for Best Investor Relations, conferred by the business newspaper “Poslovni dnevnik” and the Zagreb Stock Exchange.
Valamar’s press release is available from the Valamar Riviera corporate website (valamar-riviera.com/en/3Q2017).
Operating costs rose by 22% and totaled HRK 903 million, mainly due to i) this year’s consolidation of the Imperial hotel group, ii) increased material costs driven by larger business volumes, iii) the salary increase policy, and iv) new employees hired as construction staff (to carry out the large investments) and resort staff (to ensure service quality in the new Premium/Upscale properties).
The Group reported a negative financial result of HRK 9 million (in 2016 the reported profit was HRK 38 million). This was mainly due to last year’s one-off income driven by share portfolio sales and forex loss related to long-term loans due to HRK vs. EUR depreciation during the third quarter of 2017.
Enterprise value continued to grow (+21%) driven by increased market capitalization and efficient net debt management.
By the end of last year, Valamar Riviera concluded a Management contract regarding the management of Imperial’s properties and facilities. The contract has been implemented as of 4 January 2017. Valamar Riviera successfully acquired 54.71% of Imperial’s share capital by the end of last year. Valamar Riviera now manages a portfolio that includes 30 hotels and resorts and 15 camping resorts that can welcome more than 56,000 guests daily.
The Group’s largest investments cycle worth over HRK 900 million was completed, and the new investments received great market feedback. Most of the investment was focused on the projects in Rabac (Family Life
BUSINESS RESULTS 1/1/2017 - 30/9/2017
4
Considering the previously announced targeted total consolidated operating net revenues of HRK 1.57 billion excluding Imperial and HRK 1.69 billion including Imperial, Valamar Riviera announces the expected range of 2017 consolidated operating revenues and EBITDA.
In the business year 2017 we expect consolidated operating revenues ranging between HRK 1,755 million and HRK 1,775 million (HRK 1,489 million in 2016), with expected growth ranging between 17.9% and 19.2% (from HRK 266 million to HRK 286 million). For more details and disclaimer, see page 18.
In the business year 2017 expected EBITDA will range between HRK 600 million and HRK 610 million (HRK 513 million in 2016) representing an increase ranging between 17.1 % and 19.0 % (from HRK 87 million to HRK 97 million), resulting in an expected EBITDA margin between 33.8% and 34.8% compared to 34.4 % in 2016.For more details and disclaimer, see page 18.
In accordance with our strategic goals for the period up to 2020, we are focusing on investments projects aimed at improving the portfolio properties and services. However, numerous factors reduce the competitiveness of Croatian tourism and hinder further investment potential: VAT and the rate of total contributions to salaries (both among the highest in the Mediterranean), the still unresolved issue of tourism land, skilled labor shortages, the possible introduction of the property tax and the likely tourist tax increase. For more details, see “2017 Investments“ on page 20 and “2018 Investments“ on page 22.
Following the successful acquisition of the Baška hotel group on Krk island and the Imperial hotel group on Rab island, we are considering further expansion by pursuing new partnerships and acquisition opportunities in Croatia and abroad.
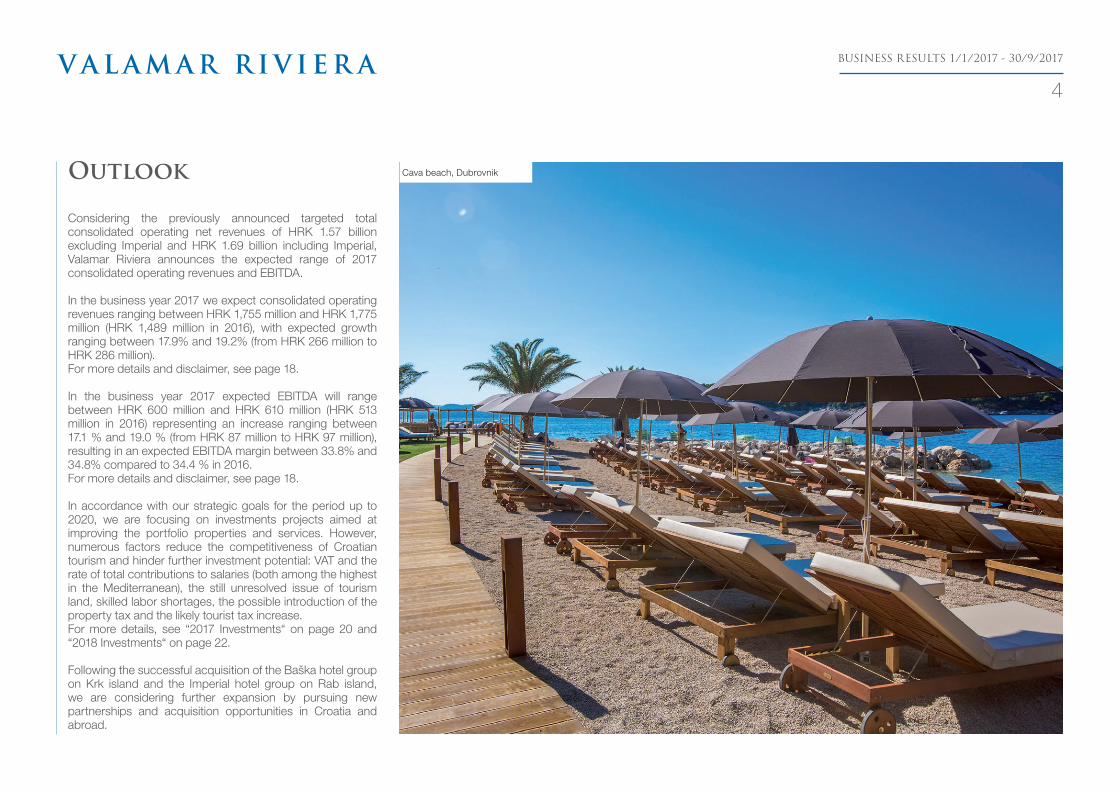
Outlook Cava beach, Dubrovnik
BUSINESS RESULTS 1/1/2017 - 30/9/2017
5
Table of contents
Significant Business Events 6
Results of the Group 9
2017 Outlook 18
Results of the Company 19
Investments 2017 20
Investments 2018 22
The Risks of the Company and the Group 24
Corporate Governance 28
Related-party Transactions 29
Branch Offices of the Company 29
Valamar Riviera Share 30
Investors Day and the 2016 Integrated Annual Report and Corporate Social Responsibility 32
Other information 33
Responsibility for the quarterly financial statements 34
Quarterly financial statements 35
BUSINESS RESULTS 1/1/2017 - 30/9/2017
6
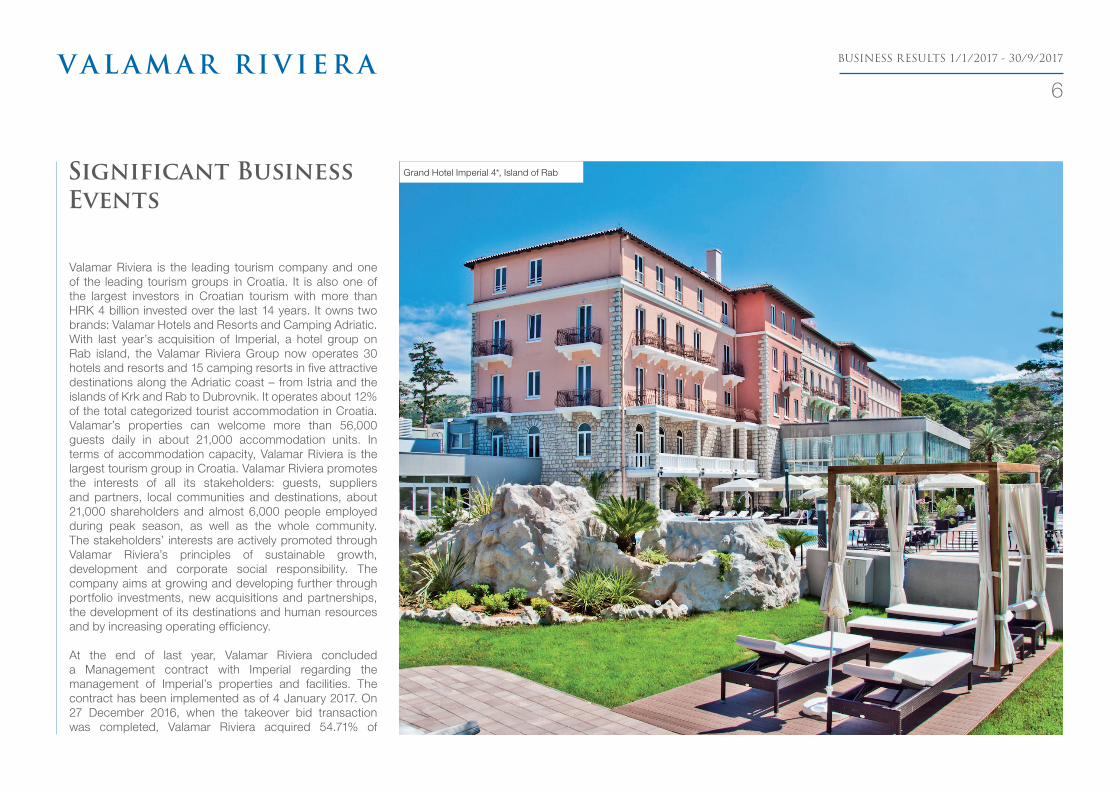
Grand Hotel Imperial 4*, Island of RabSignificant BusinessEvents
Valamar Riviera is the leading tourism company and one of the leading tourism groups in Croatia. It is also one of the largest investors in Croatian tourism with more than HRK 4 billion invested over the last 14 years. It owns two brands: Valamar Hotels and Resorts and Camping Adriatic. With last year’s acquisition of Imperial, a hotel group on Rab island, the Valamar Riviera Group now operates 30 hotels and resorts and 15 camping resorts in five attractive destinations along the Adriatic coast – from Istria and the islands of Krk and Rab to Dubrovnik. It operates about 12% of the total categorized tourist accommodation in Croatia. Valamar’s properties can welcome more than 56,000 guests daily in about 21,000 accommodation units. In terms of accommodation capacity, Valamar Riviera is the largest tourism group in Croatia. Valamar Riviera promotes the interests of all its stakeholders: guests, suppliers and partners, local communities and destinations, about 21,000 shareholders and almost 6,000 people employed during peak season, as well as the whole community. The stakeholders’ interests are actively promoted through Valamar Riviera’s principles of sustainable growth, development and corporate social responsibility. The company aims at growing and developing further through portfolio investments, new acquisitions and partnerships, the development of its destinations and human resources and by increasing operating efficiency.
At the end of last year, Valamar Riviera concluded a Management contract with Imperial regarding the management of Imperial’s properties and facilities. The contract has been implemented as of 4 January 2017. On 27 December 2016, when the takeover bid transaction was completed, Valamar Riviera acquired 54.71% of

BUSINESS RESULTS 1/1/2017 - 30/9/2017
7
Imperial’s share capital. Valamar Riviera also concluded a Cooperation Agreement with Allianz ZB from Zagreb, acting in its own name and on behalf of the mandatory pension funds it manages (category A and B). With this agreement, the two companies established joint activity towards Imperial. Valamar Riviera and Allianz ZB expect to achieve significant synergies in the future development of Imperial’s hotel portfolio and Rab as a tourist destination.
The General Assembly of Valamar Riviera was held on 4 May 2017 during which the following was established: • The Company’s realized profits in 2016 totaling
HRK 336,657,721 were distributed as follows: HRK 16,402,311 to legal reserves and HRK 320,255,410 to retained profits.
• The Management Board members were dischargedfrom managing the company business in 2016. The Supervisory Board members were discharged from supervising Valamar Riviera’s business management in 2016.
• The established dividend was HRK 0.80 (eighty lipa)per each share. The dividend would be paid out of the retained profit realized in 2013, 2014 and 2015. The total dividend that Valamar Riviera’s shareholders received on 29 May 2017 was HRK 99.4 million. 99% of this amount was paid in cash, and the remaining 1% in company shares.
• TheappointedAuditorforValamarRivierad.d.in2017isErnst & Young d.o.o. from Zagreb, 50 Radnička cesta.
• AsthetermofofficefortheSupervisoryBoardmembersexpired on 6 July 2017, the following were elected for a new 4-year term of office: Mr. Gustav Wurmböck, Mr. Franz Lanschützer, Mr. Mladen Markoč, Mr. Georg Eltz, Mr. Hans Dominik Turnovszky, Mr. Vicko Ferić, and Mr. Valter Knapić - employee representative elected by the Works Council. The newly elected Supervisory Board members started their term of office on 7 July 2017.
• The Assembly decided on the amendment to theCompany Statute.
In order to improve the operating efficiency and streamline operations, on 6 February 2017 Valamar Riviera initiated the merger of Puntižela d.o.o. The merger was completed on 31 March 2017 with its entry into the court register. Consequently, Valamar Riviera has become the universal legal successor of the merged company Puntižela.
Valamar Riviera d.d. and PBZ Croatia osiguranje, a pension fund management company acting in its own name and on behalf of the obligatory pension funds it manages (category A and B) submitted on 15 May 2017 a joint offer for the investment and recapitalization of Helios Faros d.d. u stečaju, a bankrupt hospitality company with registered office in Stari Grad on Hvar island. On 20 July 2017, the Assembly of bankruptcy creditors of Helios Faros decided to prepare a Bankruptcy plan following the investment and recapitalization offer for Helios Faros. In this offer, PBZ Croatia osiguranje and Valamar Riviera presented a restructuring plan as well as a six-year plan worth HRK 650 million for investments in hospitality assets. The total renovation and construction of two premium resorts containing around 700 accommodation units would reposition the Helios Faros portfolio as premium accommodation, thus turning Stari Grad into an attractive and well-known destination. Helios Faros would employ 500 people after the renovation of the Arkada and Lavanda hotels. The Bankruptcy plan would enable Helios Faros to emerge from bankruptcy and continue its business operations in close partnership with the destination, Stari Grad, in order to bring prosperity to the whole island. PBZ Croatia osiguranje and Valamar Riviera see this project as a confirmation of synergies arising from the joint activity of a large institutional investor and a strategic tourism investor contributing with its expertise and results. Consequently, Valamar Riviera would manage Helios Faros’ development and operations through a model contract related to the management of facilities. However, the Bankruptcy plan still needs to be adopted by the Assembly of bankruptcy creditors and validated by the bankruptcy judge.
On 5 June 2017, Valamar Riviera announced the conclusion of a contract with Kinderhotels Europa Management-Marketing-
Verwaltungs-und Verlags GesmbH regarding the purchase of the right to use the Kinderhotels brand for a period of 5 years and 5 months. With this, Valamar has become part of the Kinderhotel chain, specialized in family vacations. Kinderhotels Europa is a marketing association that brings together high-quality premium family hotels under the Austrian “Kinderhotels” brand. The collaboration between Valamar and Kinderhotels Europa will enable the hotel branding of Valamar Girandella Maro Resort 5* in Rabac, planned to be opened for the 2018 season. There are 50 such hotels in Europe, with this one being the third in Croatia.
At its meeting held on 28 June 2017, the Supervisory Board of Valamar Riviera approved new large 2018 investments to reposition the portfolio towards products and services with high added value. The investment community was notified on 5 September 2017 that the investment in a new family hotel, the Valamar Pinia Family Suites 5*, has been postponed due to an unpredictable fiscal framework for investors in tourism as well as delays in the preparation of required technical documentation. The Company will ultimately decide on 2018 investments at begining of December 2017. For details, see “2018 Investments” on page 22.
On 25 September 2017 and 28 September 2017, Valamar Riviera notified of the legal transactions concluded with TUI UK and DER Touristik Deutschland GmbH related to the provision of hospitality services at the Company’s properties. The total estimated annual value of the concluded agreements is HRK 80 million and HRK 70 million, respectively. The partnerships with TUI UK and DER Touristik, two leading tour operators on the European source market, will secure one part of the occupancy at the Company’s hotels in 2018 main season and shoulder season.
In order to improve operating efficiency and streamline operations, the Supervisory Board of Valamar Riviera approved the initiation of the Elafiti Babin-kuk d.o.o. merger on 20 October 2017. Elafiti Babin-kuk d.o.o. is a company where Valamar Riviera holds 100% stake and the merger will be
BUSINESS RESULTS 1/1/2017 - 30/9/2017
8
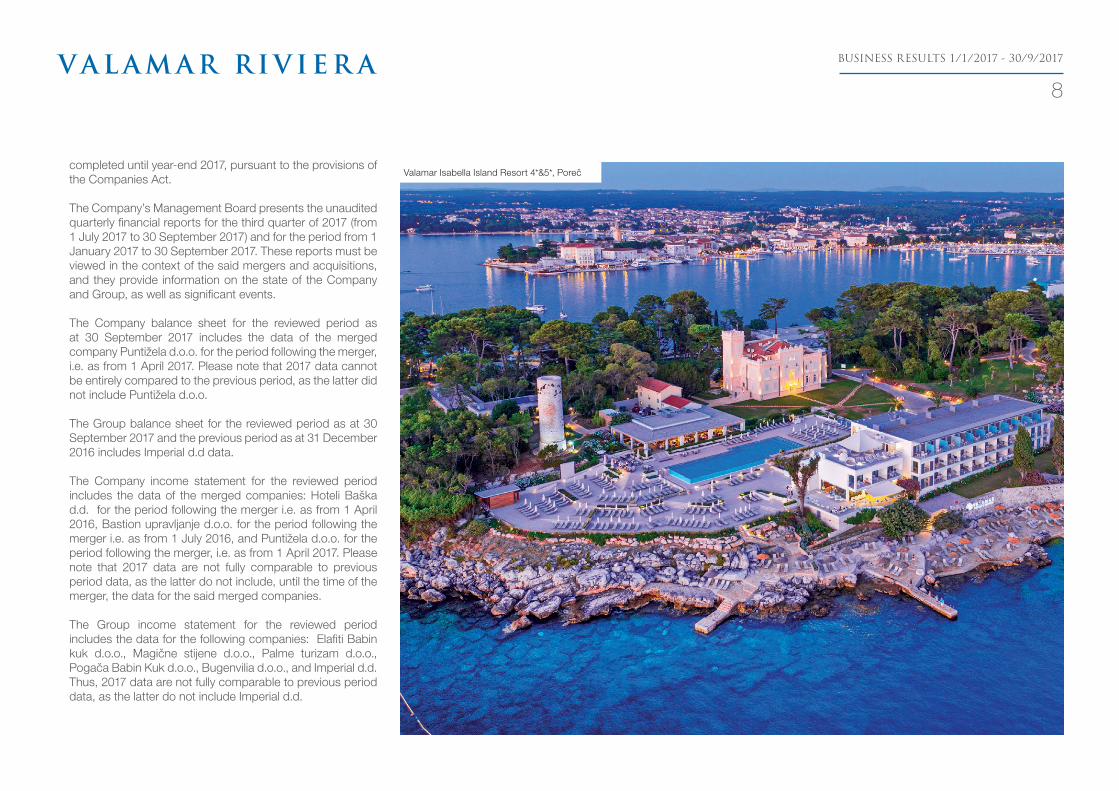
Valamar Isabella Island Resort 4*&5*, Porečcompleted until year-end 2017, pursuant to the provisions of the Companies Act.
The Company’s Management Board presents the unaudited quarterly financial reports for the third quarter of 2017 (from 1 July 2017 to 30 September 2017) and for the period from 1 January 2017 to 30 September 2017. These reports must be viewed in the context of the said mergers and acquisitions, and they provide information on the state of the Company and Group, as well as significant events.
The Company balance sheet for the reviewed period as at 30 September 2017 includes the data of the merged company Puntižela d.o.o. for the period following the merger, i.e. as from 1 April 2017. Please note that 2017 data cannot be entirely compared to the previous period, as the latter did not include Puntižela d.o.o.
The Group balance sheet for the reviewed period as at 30 September 2017 and the previous period as at 31 December 2016 includes Imperial d.d data.
The Company income statement for the reviewed period includes the data of the merged companies: Hoteli Baška d.d. for the period following the merger i.e. as from 1 April 2016, Bastion upravljanje d.o.o. for the period following the merger i.e. as from 1 July 2016, and Puntižela d.o.o. for the period following the merger, i.e. as from 1 April 2017. Please note that 2017 data are not fully comparable to previous period data, as the latter do not include, until the time of the merger, the data for the said merged companies.
The Group income statement for the reviewed period includes the data for the following companies: Elafiti Babin kuk d.o.o., Magične stijene d.o.o., Palme turizam d.o.o., Pogača Babin Kuk d.o.o., Bugenvilia d.o.o., and Imperial d.d. Thus, 2017 data are not fully comparable to previous period data, as the latter do not include Imperial d.d.
BUSINESS RESULTS 1/1/2017 - 30/9/2017
9
1 Classified accordiong to the Quarterly Financial Statement (TFI POD-RDG). EBIT, EBITDA and their adjusted values and respective margins are recorded on the basis of operating income.
2 In compliance with the classification under the USALI international standard for reporting in hotel industry (Uniform System of Accounts for the Lodging Industry).
3 Operating costs include material costs, staff costs, other costs, and other operating costs reduced by extraordinary expenses and one-off items.
4 EBITDA (eng. earnings before interest, taxes, depreciation and amortization) is calculated as: operating income - total operating costs + depreciation and amortisation + value adjustments.
5 The adjustment includes (+) extraordinary income and (-) expenses in accordance with the USALI standard classification and (-) one-off termination benefit costs and (-) administrative costs related to the process of merger and business reorganisation.
6 Adjusted by the result of extraordinary operations and one-off items.
7 Net debt: non-current and current liabilities to banks and other financial institutions + liabilities for loans, deposits and other– cash and cash equivalents – long-term and short-term investments in securities – current loans given, deposits, etc.
8 The number of shares as at 30 September 2017 amounts to 124,223,091, while at 31 December 2016 to 124,170,508.
9 EV refers to enterprise value; calculated as market capitalization + net debt.10 DPS refers to dividends per share.
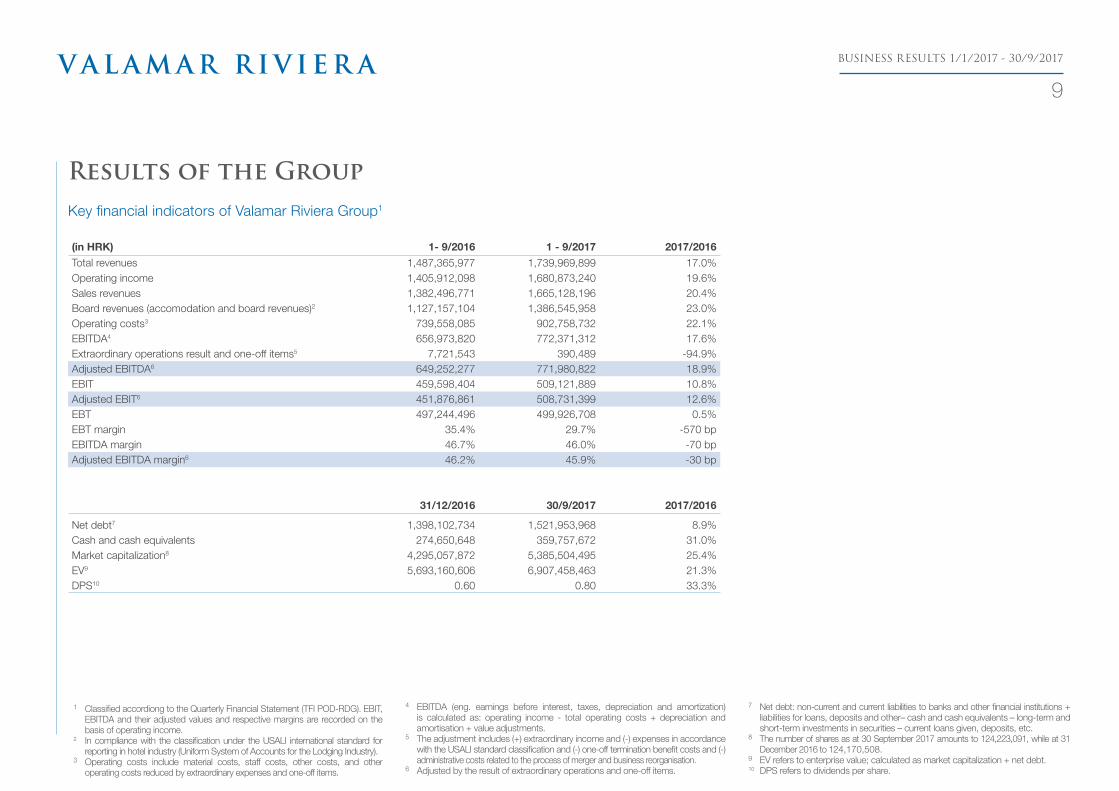
Results of the GroupKey financial indicators of Valamar Riviera Group1
(in HRK) 1- 9/2016 1 - 9/2017 2017/2016Total revenues 1,487,365,977 1,739,969,899 17.0%Operating income 1,405,912,098 1,680,873,240 19.6%Sales revenues 1,382,496,771 1,665,128,196 20.4%Board revenues (accomodation and board revenues)2 1,127,157,104 1,386,545,958 23.0%Operating costs3 739,558,085 902,758,732 22.1%EBITDA4 656,973,820 772,371,312 17.6%Extraordinary operations result and one-off items5 7,721,543 390,489 -94.9%Adjusted EBITDA6 649,252,277 771,980,822 18.9%EBIT 459,598,404 509,121,889 10.8%Adjusted EBIT6 451,876,861 508,731,399 12.6%EBT 497,244,496 499,926,708 0.5%EBT margin 35.4% 29.7% -570 bp EBITDA margin 46.7% 46.0% -70 bp Adjusted EBITDA margin6 46.2% 45.9% -30 bp
31/12/2016 30/9/2017 2017/2016
Net debt7 1,398,102,734 1,521,953,968 8.9%Cash and cash equivalents 274,650,648 359,757,672 31.0%Market capitalization8 4,295,057,872 5,385,504,495 25.4%EV9 5,693,160,606 6,907,458,463 21.3%DPS10 0.60 0.80 33.3%
BUSINESS RESULTS 1/1/2017 - 30/9/2017
10
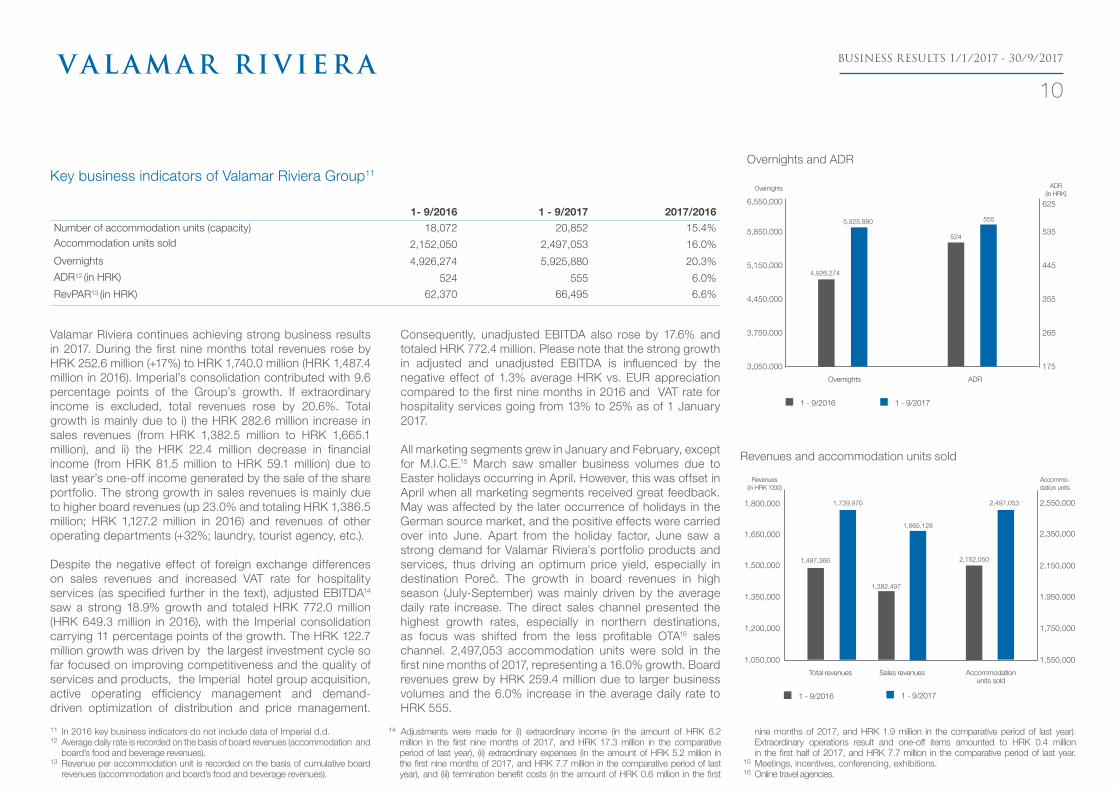
Valamar Riviera continues achieving strong business results in 2017. During the first nine months total revenues rose by HRK 252.6 million (+17%) to HRK 1,740.0 million (HRK 1,487.4 million in 2016). Imperial’s consolidation contributed with 9.6 percentage points of the Group’s growth. If extraordinary income is excluded, total revenues rose by 20.6%. Total growth is mainly due to i) the HRK 282.6 million increase in sales revenues (from HRK 1,382.5 million to HRK 1,665.1 million), and ii) the HRK 22.4 million decrease in financial income (from HRK 81.5 million to HRK 59.1 million) due to last year’s one-off income generated by the sale of the share portfolio. The strong growth in sales revenues is mainly due to higher board revenues (up 23.0% and totaling HRK 1,386.5 million; HRK 1,127.2 million in 2016) and revenues of other operating departments (+32%; laundry, tourist agency, etc.).
Despite the negative effect of foreign exchange differences on sales revenues and increased VAT rate for hospitality services (as specified further in the text), adjusted EBITDA14
saw a strong 18.9% growth and totaled HRK 772.0 million (HRK 649.3 million in 2016), with the Imperial consolidation carrying 11 percentage points of the growth. The HRK 122.7 million growth was driven by the largest investment cycle so far focused on improving competitiveness and the quality of services and products, the Imperial hotel group acquisition, active operating efficiency management and demand-driven optimization of distribution and price management.
Consequently, unadjusted EBITDA also rose by 17.6% and totaled HRK 772.4 million. Please note that the strong growth in adjusted and unadjusted EBITDA is influenced by the negative effect of 1.3% average HRK vs. EUR appreciation compared to the first nine months in 2016 and VAT rate for hospitality services going from 13% to 25% as of 1 January 2017.
All marketing segments grew in January and February, except for M.I.C.E.15 March saw smaller business volumes due to Easter holidays occurring in April. However, this was offset in April when all marketing segments received great feedback. May was affected by the later occurrence of holidays in the German source market, and the positive effects were carried over into June. Apart from the holiday factor, June saw a strong demand for Valamar Riviera’s portfolio products and services, thus driving an optimum price yield, especially in destination Poreč. The growth in board revenues in high season (July-September) was mainly driven by the average daily rate increase. The direct sales channel presented the highest growth rates, especially in northern destinations, as focus was shifted from the less profitable OTA16 sales channel. 2,497,053 accommodation units were sold in the first nine months of 2017, representing a 16.0% growth. Board revenues grew by HRK 259.4 million due to larger business volumes and the 6.0% increase in the average daily rate to HRK 555.
14 Adjustments were made for (i) extraordinary income (in the amount of HRK 6.2 million in the first nine months of 2017, and HRK 17.3 million in the comparative period of last year), (ii) extraordinary expenses (in the amount of HRK 5.2 million in the first nine months of 2017, and HRK 7.7 million in the comparative period of last year), and (iii) termination benefit costs (in the amount of HRK 0.6 million in the first
11 In 2016 key business indicators do not include data of Imperial d.d.12 Average daily rate is recorded on the basis of board revenues (accommodation and
board’s food and beverage revenues).13 Revenue per accommodation unit is recorded on the basis of cumulative board revenues (accommodation and board’s food and beverage revenues).
Key business indicators of Valamar Riviera Group11
1- 9/2016 1 - 9/2017 2017/2016Number of accommodation units (capacity) 18,072 20,852 15.4%Accommodation units sold 2,152,050 2,497,053 16.0%
Overnights 4,926,274 5,925,880 20.3%ADR12 (in HRK) 524 555 6.0%
RevPAR13 (in HRK) 62,370 66,495 6.6%
Overnights ADR(in HRK)
Overnights and ADR
1 - 9/2017 1 - 9/2016
Overnights ADR
535
355
445
265
3,050,000
3,750,000
4,450,000
5,150,000
5,850,000
6,550,000
175
625
5,925,880 555
524
4,926,274
Revenues and accommodation units sold
1 - 9/2017 1 - 9/2016
Total revenues Sales revenues Accommodation units sold
Revenues(in HRK ‘000)
Accommo-dation units
1,650,000
1,800,000
1,500,000
1,350,000
1,200,000
1,050,000 1,550,000
1,739,970
1,665,128
2,497,053
1,487,366
1,382,497
2,152,050
1,750,000
1,950,000
2,150,000
2,350,000
2,550,000
nine months of 2017, and HRK 1.9 million in the comparative period of last year). Extraordinary operations result and one-off items amounted to HRK 0.4 million in the first half of 2017, and HRK 7.7 million in the comparative period of last year.
15 Meetings, incentives, conferencing, exhibitions.16 Online travel agencies.
BUSINESS RESULTS 1/1/2017 - 30/9/2017
11
Camping Krk 5*, KrkValamar Riviera reported a 19.6% growth in consolidated operating income that totaled HRK 1,680.9 million. HRK 15.8 million represented other operating revenues (HRK 23.4 million in 2016), while the remaining HRK 1,665.1 million represented sales revenues. Domestic sales revenues totaled HRK 130.5 million, representing 7.5% of total revenues (6.8% in 2016) and rose by 29.0% over previous comparable period results. International sales revenues rose by HRK 253.3 million, totaling HRK 1,534.7 million and represented 88.2% of total revenues (86.1% in 2016). Other operating revenues fell by HRK 7.7 million. Other operating and financial income represented 4.3 % of the total revenues (7.1% in 2016).
Total operating costs were HRK 902.8 million. They grew by 22.1% mainly due to i) this year’s consolidation of the Imperial hotel group, ii) increased material costs driven by larger business volumes, iii) the salary increase policy (2% in June 2016, 2% in December 2016, 1.5% in June 2017, and 0.5% increment for years of service since 1 January 2017), and iv) new employees hired as construction staff (to carry out the large investments) and resort staff (to ensure service quality in the new Premium/Upscale properties). For comparability’s sake, if Imperial’s consolidation is excluded, operating costs grew by 13.3% and remained under control through their active management.
Profit before tax rose by HRK 2.7 million over last year’s comparable period results and totaled HRK 500.0 million. Operating profit rose by HRK 49.5 million and totaled HRK 509.1 million. EBT margin fell by 550 basis points to 30% (35% in 2016) due to the 33.5% amortization growth and a HRK 46.8 million decrease in the financial result (for details, see next page).
BUSINESS RESULTS 1/1/2017 - 30/9/2017
12
Compared to the same period last year, during the first nine months of 2017 total operating expenses grew by 23.8%. This is mainly due to this year’s consolidation of Imperial, increased amortization costs, material costs and staff costs (as previously explained). For comparability’s sake, if Imperial’s data are excluded, total operating expenses grew by 16.0%.
Material costs represented 36.6% of total operating expenses (38.0% in 2016) and totaled HRK 428.4 million. They grew by 19.0% mainly due to Imperial’s consolidation and increased raw material costs (especially direct food and beverages costs as well as costs of energy sources and water) driven by larger business volumes.
Staff costs totaled HRK 371.6 million and represented 31.7% of total operating expenses (30.5% in 2016). Their 28.6% growth was driven by the factors mentioned earlier in the detailed description of realized operating costs.
Amortization grew by 33.5% mainly due to the larger consolidation scope and the previous investments and totaled HRK 263.2 million (HRK 197.1 million in 2016) representing 22.5% of operating expenses (20.8% in 2016). Other costs rose by 13.6% or HRK 12.2 million mainly due to Imperial’s consolidation. Provisions and value adjustments totaled HRK 69.6 thousand. Other operating expenses totaled HRK 6.5 million and fell by HRK 3.6 million.
Financial income totaled HRK 59.1 million in the first nine months of 2017 and fell by HRK 22.4 million compared to the same period last year. Other financial income presented the most significant decrease of HRK 35.0 million, mainly due to last year’s one-time income generated by the sale of the share portfolio. Interest rates, foreign exchange differences, dividends and similar income from third parties presented the highest individual growth in the first nine months compared to the same period last year. They grew by HRK 13.7 million
driven by forex differences related to long-term loans due to HRK appreciation in 1H 2017. Unrealized gains from financial assets fell by HRK 1.1 million due to last year’s one-time effect of the early termination of an interest rate derivative financial instrument.
The Group’s financial expenses totaled HRK 68.3 million and grew by HRK 24.5 million in relation to the previous comparable period. Financial expenses related to interests, foreign exchange differences and other expenses from third parties grew by HRK 28.4 million. Due to HRK depreciation in 3Q 2017, forex losses related to long-term loans grew by HRK 21.9 million. Financial expenses related to interests rose by HRK 6.1 million, mainly due to financial leverage used for the 2017 investment cycle. Other financial expenses fell by HRK 2.6 million due to last year’s expense related to the Group’s share portfolio sales and the early repayment charges for the termination of an interest rate derivative financial instrument.
Total operating expenses of Valamar Riviera Group17
(in HRK) 1 -9/2016 1 - 9/2017 2017/2016Operating costs18 739,558,085 902,758,732 22.1%Total operating expenses 946,313,694 1,171,751,351 23.8% Material costs 359,946,104 428,336,554 19.0% Staff costs 288,972,289 371,576,608 28.6% Depreciation and amortisation 197,103,933 263,179,786 33.5% Other costs 89,863,787 102,056,770 13.6% Provisions and value adjustments 271,483 69,637 -74.3% Other operating expenses 10,156,098 6,531,996 -35.7%
17 Classified according to the Quarterly Financial Statement (TFI POD-RDG).18 Operating costs include material costs, staff costs, other costs, and other operating costs reduced by extraordinary expenses and one-off items.
BUSINESS RESULTS 1/1/2017 - 30/9/2017
13
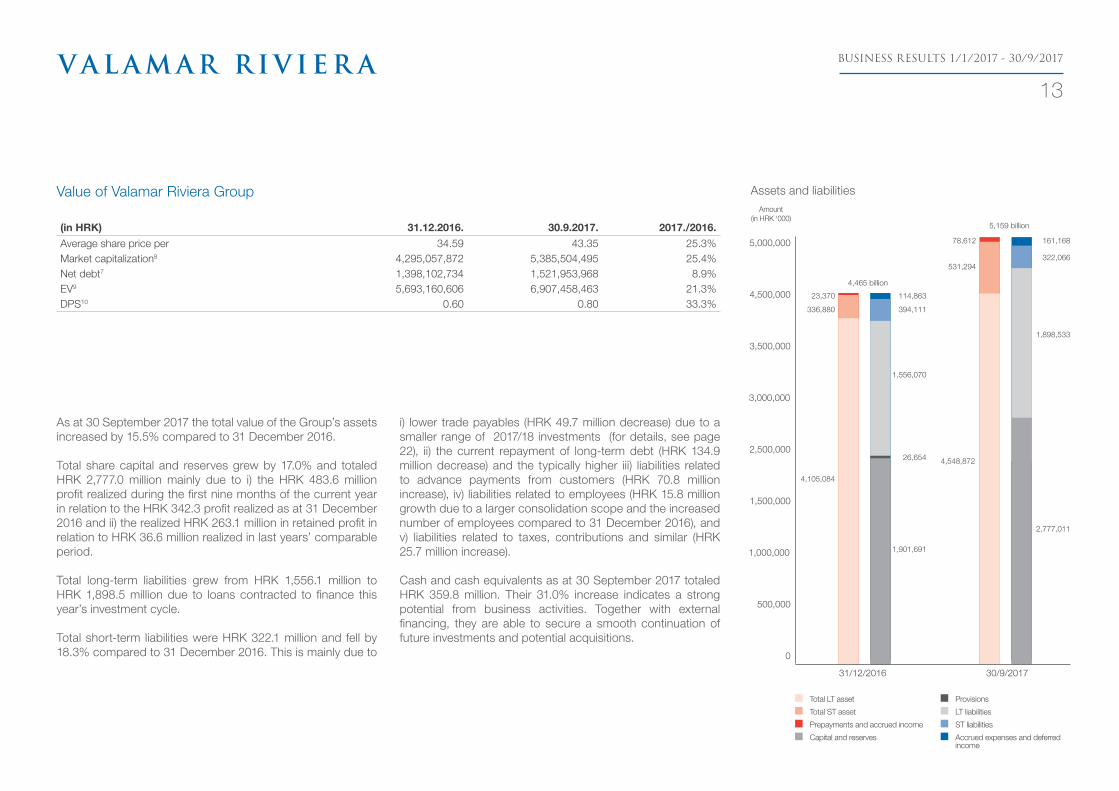
As at 30 September 2017 the total value of the Group’s assets increased by 15.5% compared to 31 December 2016.
Total share capital and reserves grew by 17.0% and totaled HRK 2,777.0 million mainly due to i) the HRK 483.6 million profit realized during the first nine months of the current year in relation to the HRK 342.3 profit realized as at 31 December 2016 and ii) the realized HRK 263.1 million in retained profit in relation to HRK 36.6 million realized in last years’ comparable period.
Total long-term liabilities grew from HRK 1,556.1 million to HRK 1,898.5 million due to loans contracted to finance this year’s investment cycle.
Total short-term liabilities were HRK 322.1 million and fell by 18.3% compared to 31 December 2016. This is mainly due to
i) lower trade payables (HRK 49.7 million decrease) due to a smaller range of 2017/18 investments (for details, see page 22), ii) the current repayment of long-term debt (HRK 134.9 million decrease) and the typically higher iii) liabilities related to advance payments from customers (HRK 70.8 million increase), iv) liabilities related to employees (HRK 15.8 million growth due to a larger consolidation scope and the increased number of employees compared to 31 December 2016), and v) liabilities related to taxes, contributions and similar (HRK 25.7 million increase).
Cash and cash equivalents as at 30 September 2017 totaled HRK 359.8 million. Their 31.0% increase indicates a strong potential from business activities. Together with external financing, they are able to secure a smooth continuation of future investments and potential acquisitions.
Total LT asset
Total ST asset
Prepayments and accrued income
Capital and reserves
Provisions
LT liabilities
ST liabilities
Accrued expenses and deferred income
Assets and liabilitiesAmount
(in HRK ‘000)
5,000,000
4,500,000
3,000,000
2,500,000
3,500,000
1,500,000
1,000,000
500,000
0
2,777,011
4,548,872
1,898,533
322,066531,294
161,16878,612
30/9/2017
1,901,691
4,105,084
1,556,070
394,111336,880
114,86323,370
31/12/2016
26,654
Value of Valamar Riviera Group
(in HRK) 31.12.2016. 30.9.2017. 2017./2016.Average share price per 34.59 43.35 25.3%Market capitalization8 4,295,057,872 5,385,504,495 25.4%Net debt7 1,398,102,734 1,521,953,968 8.9%EV9 5,693,160,606 6,907,458,463 21.3%DPS10 0.60 0.80 33.3%
4,465 billion
5,159 billion

BUSINESS RESULTS 1/1/2017 - 30/9/2017
14
Key operating indicators of Valamar Riviera Group per segments19
HOTELS AND RESORTS Total Premium Upscale Midscale
Economy
1 - 9/2016 1 - 9/20172017/
2016 1 - 9/2016 1 - 9/20172017/
2016 1 - 9/2016 1 - 9/20172017/
2016 1 - 9/2016 1 - 9/20172017/
2016 1 - 9/2016 1 - 9/20172017/
2016
Number of accommodation units 7,927 8,982 13.3% 1,037 1,269 22.4% 1,422 1,980 39.2% 3,112 3,493 12.2% 2,356 2,240 -4.9%
Accommodation units sold 1,135,259 1,321,988 16.4% 177,036 191,397 8.1% 206,416 283,214 37.2% 451,331 515,428 14.2% 300,476 331,949 10.5%
Overnights 2,462,250 2,890,063 17.4% 344,390 414,395 20.3% 465,161 675,421 45.2% 974,975 1,094,676 12.3% 677,724 705,571 4.1%
ADR12 (in HRK) 770 795 3.3% 1,180 1,344 13.9% 1,031 1,058 2.6% 713 705 -1.2% 434 395 -8.9%
Board revenues (in HRK) 873,876,123 1,051,156,986 20.3% 208,976,675 257,240,730 23.1% 212,715,413 299,502,555 40.8% 321,797,842 363,192,131 12.9% 130,386,193 131,221,570 0.6%
19 According to the classification under the USALI international standard for reporting in hotel industry (Uniform System of Accounts for the Lodging Industry). Business
operations of Imperial’s properties on the Island of Rab are not included in 2016. Puntižela - Pula business is included in destination Poreč. A detailed comparison of
the new portfolio segmentation can be found on page 17.
Upscale hotels and resorts reported the strongest growth in board revenues (+HRK 86.8 million). Accommodation units sold grew by 37.2% and the realized average daily rate was HRK 1,058, thus resulting in board revenues totaling HRK 299.5 million. The achieved results were mainly due to i) this year’s business generated at the new Bellevue Family Life Resort 4*: with fewer operating days, this Upscale property achieved a near 65% growth in board revenues, and ii) this year’s consolidation of the hotels and resorts on the island of Rab with their 9% contribution to board revenues. The strong growth reported by the Valamar Zagreb 4* was driven by the increase in the average daily rate in peak season and larger business volumes in the preseason period, especially through allotments and groups. Valamar Hotel & Casa Sanfior 4* reported strong growth mainly due to a very good group placement in the preseason period and the excellent feedback received by the direct sales channel. Two events, “X-Jam Croatia” and “Lighthouse Festival Croatia” are the main drivers for the board revenue growth reported by the Tamaris cluster. The allotment and group sales channels mainly contributed to the board revenue growth reported by the Valamar Argosy 4*.
The Midscale segment achieved HRK 363.2 million in board revenues, which were negatively affected by Bellevue Family Life Resort 4* going from Midscale to Upscale. However, this was offset by the positive effect of this year’s consolidation
Board revenues in the hotels and resorts segment saw a high growth (HRK 177.3 million) and totaled HRK 1,051.2 million, mainly carried by the Premium and Upscale segment. The strong business results were driven by the excellent market feedback that the new investments received, the acquisition of the Imperial hotel group, demand-driven optimization of the marketing mix and prices and the successful realization of group stays (leisure and events). Please note that the growth was partly due to the business operations of the hotels and resorts on the island of Rab. If they were excluded, the total board revenues of hotels and resorts grew by 10%.
The Premium segment of hotels and resorts reported HRK 257.2 million in board revenues, due to a HRK 164 increase in the average daily rate and the 8.1% increase in the number of accommodation units sold. The 23.1% growth in board revenues was mainly due to the newly-opened Valamar Girandella Resort 4*&5* that achieved a 75% growth in board revenues with fewer operating days and Valamar Isabella Island Resort 4*&5* reporting strong growth in the direct sales channel along with the 15% growth in the average daily rate. Last year’s Daimler AG – Mercedes-Benz M.I.C.E. event did not take place, but this was compensated by allotments and growth in all other sales channels with focus on the average daily rate optimization at the Valamar Dubrovnik President 5*and Valamar Lacroma 4*.
of Imperial Midscale hotels and resorts (18% contribution to board revenues). All Midscale hotels and resorts reported growth, with most of the comparable growth generated by the hotels: i) Valamar Diamant 4*, Valamar Crystal 4* and Valamar Rubin 3* (successful replacement of the OTA sales channel with the direct channel, ii) Miramar 3* and Allegro 3* (increase in allotments and in the direct channel in peak season), iii) Corinthia 3* (more operating days, successful group placement in the preseason period and excellent feedback received by the individual channel in peak season) and iv) Valamar Club Dubrovnik 3* (sales channel optimization with focus on the allotment and group channels).
The Economy segment of hotels and resorts totaled HRK 131.2 million in board revenues. The Economy segment was negatively affected by the newly- renovated Valamar Girandella Resort 4*&5* going from Economy to Premium. However, this was offset by the positive effect of this year’s consolidation of destination Rab (carrying 9% of the growth) and other comparable segment growth. Most of it was generated by i) Lanterna Apartments 2* (increased demand, “X-Jam Croatia” and „Lighthouse Festival Croatia“), ii) Tirena 3* (excellent feedback received by the allotment and group channel). Marina Hotel and Mediteran Residence 2* reported a drop in board revenues due to the accommodation of seasonal staff in destination Rabac.

BUSINESS RESULTS 1/1/2017 - 30/9/2017
15
Key operating indicators of Valamar Riviera Group per segments (continued)19
CAMPING RESORTS Total Premium Upscale Midscale
Economy
1 - 9/2016 1 - 9/20172017/
2016 1 - 9/2016 1 - 9/20172017/
2016 1 - 9/2016 1 - 9/20172017/
2016 1 - 9/2016 1 - 9/20172017/
2016 1 - 9/2016 1 - 9/20172017/
2016
Number of accommodation units 10,145 11,870 17.0% 511 3,466 578.3% 4,437 1,434 -67.7% 3,387 5,150 52.1% 1,810 1,820 0.5%
Accommodation units sold 1,016,791 1,175,065 15.6% 67,535 383,697 468.1% 465,767 165,511 -64.5% 331,484 475,776 43.5% 152,005 150,081 -1.3%
Overnights 2,464,024 3,035,817 23.2% 197,294 1,128,592 472.0% 1,194,363 393,896 -67.0% 717,211 1,148,132 60.1% 355,156 365,197 2.8%
ADR12 (in HRK) 249 285 14.6% 362 345 -4.5% 280 317 13.2% 209 251 20.5% 193 206 6.7%
Board revenues (in HRK) 253,280,981 335,388,972 32.4% 24,419,347 132,448,152 442.4% 130,335,205 52,428,916 -59.8% 69,116,362 119,536,786 73.0% 29,410,067 30,975,118 5.3%
Key operating indicators of Valamar Riviera Group per destinations19
DESTINATION Poreč Rabac Island of Krk Island of Rab
Dubrovnik
1 - 9/2016 1 - 9/20172017/
2016 1 - 9/2016 1 - 9/20172017/
2016 1 - 9/2016 1 - 9/20172017/
2016 1 - 9/2016 1 - 9/20172017/
2016 1 - 9/2016 1 - 9/20172017/
2016
Number of accommodation units 10,632 10,584 -0.5% 2,065 1,971 -4.6% 3,414 3,577 4.8% / 2,759 / 1,961 1,961 0.0%
Accommodation units sold 1,192,839 1,235,135 3.5% 252,544 287,726 13.9% 423,473 434,586 2.6% / 252,389 / 283,194 287,217 1.4%
Overnights 2,813,257 2,990,665 6.3% 590,167 639,858 8.4% 991,139 1,035,442 4.5% / 695,238 / 531,711 564,677 6.2%
ADR12 (in HRK) 469 490 4.7% 579 658 13.8% 387 438 13.2% / 505 / 912 953 4.5%
Board revenues (in HRK) 558,985,247 605,770,006 8.4% 146,117,945 189,467,303 29.7% 163,772,689 190,308,846 16.2% / 127,383,259 / 258,281,223 273,616,544 5.9%
to Premium. Camping Resort Lanterna 4* reported an 18% growth in board revenues due to the great feedback received by marketing activities related to the placement of this year’s investments in new products and amenities. The rest of the growth was mainly driven by the excellent performance of Camping Resort Krk 5*.
Excluding Camping Resort Lanterna 4* last year’s operation, the Upscale segment reported a strong 25.3% growth in board revenues. The high growth in board revenues reported by Camping Marina 4* and Ježevac 4* was mainly due to the investment in new mobile homes. Better results at Camping Bunculuka 4* were driven by the average daily rate increase.
Camping resorts reported high board revenues totaling HRK 335.4 million in the first nine months of 2017. Campsites reported strong overall performance due to increased demand and the excellent feedback received by this year’s investments, mobile homes in particular. The optimization of the average rate for mobile homes, the increased number of overnights and this year’s consolidation of the camping resorts on Rab resulted in a strong 32.4% growth in board revenues. This year’s consolidation of Rab camping resorts affected revenues by 15%.
The Premium segment grew by HRK 108.0 million, mainly because Camping Resort Lanterna 4* went from Upscale
All Midscale campsites reported growth in board revenues that totaled HRK 119.5 million. Most of the growth was driven by the consolidation of Rab campsites. The remaining 18% in the growth resulted from a better performance of the following campsites: i) Stara Baška 3* and Zablaće 3* due to investments in new mobile homes, and ii) Solaris 3*, Orsera 3* and Solitudo 3* due to increased business volume.
The Economy segment achieved HRK 31.0 million in board revenues. The 5.3% growth was mainly influenced by the investment in Camping Brioni 2* and a better performance reported by Istra 2* and Tunarica 2*.
BUSINESS RESULTS 1/1/2017 - 30/9/2017
16
Board revenues in destination Poreč totaled HRK 605.8 million (HRK 559.0 million in 2016). The 4.7% increase in the average daily rate and the 3.5% increase in the number of accommodation units sold resulted in the HRK 46.8 million increase in board revenues. Most of the board revenues growth in this destination was generated by business operations at Valamar Isabella Island Resort 4*&5*, Apartments Lanterna 2*, Camping Resort Lanterna 4*, Valamar Zagreb 4* and the Brulo region: Valamar Diamant 4*, Valamar Crystal 4* and Valamar Rubin 3*.
Board revenues in destination Rabac grew by HRK 43.3 million and totaled HRK 189.5 million (HRK 146.1 million in 2016), mainly due to the excellent feedback received by the new investments, Valamar Girandella Resort 4*/5* and Bellevue Family Life Resort 4*, as well as business generated at Hotel & Casa Valamar Sanfior 4*, Allegro 3* and Miramar 3* and Camping Marina 4*.
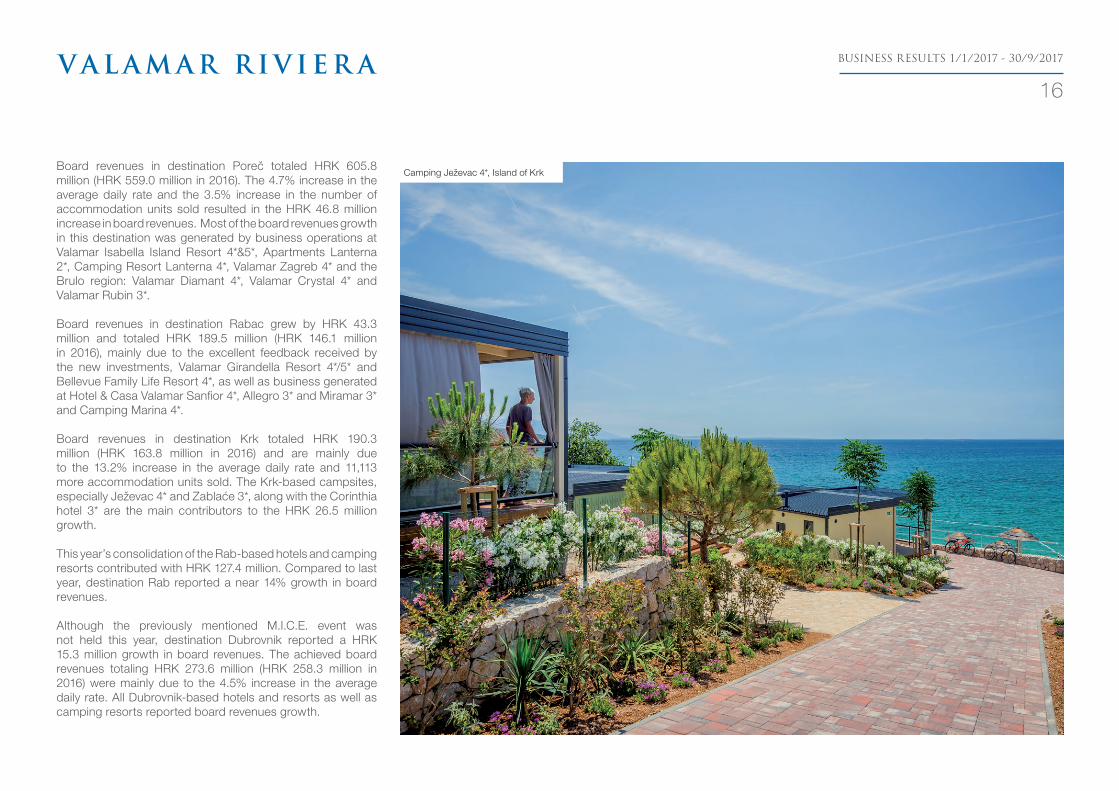
Board revenues in destination Krk totaled HRK 190.3 million (HRK 163.8 million in 2016) and are mainly due to the 13.2% increase in the average daily rate and 11,113 more accommodation units sold. The Krk-based campsites, especially Ježevac 4* and Zablaće 3*, along with the Corinthia hotel 3* are the main contributors to the HRK 26.5 million growth.
This year’s consolidation of the Rab-based hotels and camping resorts contributed with HRK 127.4 million. Compared to last year, destination Rab reported a near 14% growth in board revenues.
Although the previously mentioned M.I.C.E. event was not held this year, destination Dubrovnik reported a HRK 15.3 million growth in board revenues. The achieved board revenues totaling HRK 273.6 million (HRK 258.3 million in 2016) were mainly due to the 4.5% increase in the average daily rate. All Dubrovnik-based hotels and resorts as well as camping resorts reported board revenues growth.
Camping Ježevac 4*, Island of Krk

BUSINESS RESULTS 1/1/2017 - 30/9/2017
17
Hotels and Resorts Overview20 Categorization Segment Destination
2016 2017 2016 2017Valamar Dubrovnik President Hotel ***** ***** Premium Premium DubrovnikValamar Isabella Island Resort **** / ***** **** / ***** Premium Premium PorečValamar Lacroma Hotel ****+ ****+ Premium Premium DubrovnikValamar Club Tamaris **** **** Upscale Upscale PorečValamar Riviera Hotel & Residence **** **** Upscale Upscale PorečValamar Zagreb Hotel **** **** Upscale Upscale PorečHotel & Casa Valamar Sanifor **** **** Upscale Upscale RabacValamar Argosy Hotel **** **** Upscale Upscale DubrovnikHotel Padova **** **** Upscale Upscale Island of RabValamar Diamant Hotel & Residence **** **** Midscale Midscale PorečValamar Crystal Hotel **** **** Midscale Midscale PorečValamar Pinia Hotel & Residence *** *** Midscale Midscale PorečValamar Rubin Hotel *** *** Midscale Midscale PorečBellevue Family Life Resort **** **** Midscale Upscale RabacAllegro Hotel *** *** Midscale Midscale RabacMiramar Hotel *** *** Midscale Midscale RabacHotel Corinthia *** *** Midscale Midscale Island of KrkZvonimir Hotel, Atrium & Villa Adria **** / ***** **** / ***** Midscale Midscale Island of KrkValamar Koralj Romantic Hotel *** *** Midscale Midscale Island of KrkValamar Club Dubrovnik *** *** Midscale Midscale DubrovnikGrand Hotel Imperial **** **** Midscale Midscale Island of RabHotel & Ville Carolina **** **** Midscale Midscale Island of RabTourist Village San Marino *** *** Midscale Midscale Island of RabNaturist Resort Solaris *** *** Economy Economy PorečPical Hotel *** ** Economy Economy PorečTirena Hotel *** *** Economy Economy DubrovnikValamar Girandella Resort ** **** / ***** Economy Premium RabacLanterna Apartments ** ** Economy Economy PorečHotel Eva & Apartments Suha Punta ** ** Economy Economy Island of RabMarina Hotel & Mediteran Residence ** ** Economy Economy Rabac
Camping Resorts Overview20 Categorization Segment Destination
2016 2017 2016 2017Camping Krk ***** ***** Premium Premium Island of KrkCamping Ježevac **** **** Upscale Upscale Island of KrkCamping Resort Lanterna **** **** Upscale Premium PorečCamping Marina **** **** Upscale Upscale RabacNaturist Camping Bunculuka **** **** Upscale Upscale Island of KrkCamping Orsera *** *** Midscale Midscale PorečNaturist Resort Solaris *** *** Midscale Midscale PorečCamping Zablaće *** *** Midscale Midscale Island of KrkCamping Škrila *** *** Midscale Midscale Island of KrkCamping Solitudo *** *** Midscale Midscale DubrovnikCamping & Residence San Marino *** *** Midscale Midscale Island of RabCamping Padova 3 *** *** Midscale Midscale Island of RabNaturist Camping Istra ** ** Economy Economy PorečCamping Brioni ** ** Economy Economy Pula - PuntiželaCamping Tunarica ** ** Economy Economy Rabac
Over the years Valamar Riviera has consolidated its portfolio in order to clearly differentiate, develop and reposition its tourism products. A precise definition of market segments, innovative development of service concepts, brand management, profitability increase and return-on- investment optimization demanded a revised segmentation of the portfolio of hospitality properties.
Last year’s acquisition of Imperial d.d. added 5 new hotels and resorts and 2 camping resorts to Valamar Riviera’s portfolio. The additional 2,759 accommodation units contributes the growth of the Group’s business volume and profitability in 2017. The Group’s total accommodation capacity in 2017 is 20,852 accommodation units.
20 Business operations of Imperial’s properties are not included in 2016.
BUSINESS RESULTS 1/1/2017 - 30/9/2017
18
2017 Outlook
materially differ from the said expectations and forecasts. Risks and uncertainties include, but are not limited to those described in the chapter “Risks of the Company and the Group”.
Materially significant deviations from the 2017 outlook may arise from changes in circumstances, assumptions not being realized, as well as other risks, uncertainties, and factors, including:•Macro-economic trends in theRepublic ofCroatia and in
the source markets, including currency exchange rates fluctuations and prices of goods and services, deflation and inflation, unemployment, trends in the gross domestic product and industrial production, as well as other trends having a direct or indirect impact on the purchasing power of Valamar Riviera’s guests;
• Economic conditions, security and political conditions,trends and events in the capital markets of the Republic of Croatia and Valamar Riviera’s source markets;
• Spending and disposable income of guests, as well asguests’ preferences, trust in and satisfaction with Valamar Riviera’s products and services;
• Trends in the number of overnights, bookings, andaverage daily rates of accommodation at Valamar Riviera’s properties;
• Trends in the Croatian Kuna exchange rate in relation toworld currencies (primarily the Euro), change in market interest rates and the price of equity securities, and other financial risks to which Valamar Riviera is exposed;
• Labor force availability and costs, transport, energy, andutilities costs, selling prices of fuel and other goods and services, as well as supply chain disruptions;
• Changes in accounting policies and findings of financial
report audits, as well as findings of tax and other business audits;
•Outcomes and costs of judicial proceedings to whichValamar Riviera is a party;
• Loss of competitive strength and reduced demand forproducts and services of Croatian tourism and Valamar Riviera under the impact of weather conditions and seasonal movements;
• Reliability of IT business solutions and cyber security ofValamar Riviera’s business operations, as well as related costs;
• Changes of tax and other regulations and laws, traderestrictions, and rates of customs duty;
• Adverseclimaticeventsandenvironmentalrisks.
Should materially significant changes to the stated outlook for the business year 2017 occur, Valamar Riviera shall immediately inform the public thereof, in compliance with Article 459 of the Capital Market Act. The given outlook statements are not an outright recommendation to buy, hold or sell Valamar Riviera’s shares.
Considering the previously announced targeted total consolidated operating net revenues of HRK 1.57 billion excluding Imperial and HRK 1.69 billion including Imperial, Valamar Riviera announces the expected range of 2017 consolidated operating revenues and EBITDA.
In the business year 2017 we expect consolidated operating revenues ranging between HRK 1,755 million and HRK 1,775 million (HRK 1,489 million in 2016), with expected growth ranging between 17.9% and 19.2% (from HRK 266 million to HRK 286 million).
In the business year 2017 expected EBITDA will range between HRK 600 million and HRK 610 million (HRK 513 million in 2016) representing an increase ranging between 17.1 % and 19.0 % (from HRK 87 million to HRK 97 million), resulting in an expected EBITDA margin between 33.8% and 34.8%, compared to 34.4 % in 2016.
Our outlook is based on (i) results achieved in the first nine months of 2017; (ii) operating revenues achieved by 19 October 2017; (iii) recorded bookings (representing 98.8% of the realized and expected 2017 accommodation revenues recorded in the books); (iv) 4Q business results forecast; and (v) the absence of significant negative effects of the risks to which the Company and the Group are exposed.
Outlook statements are based on currently available information, current assumptions, forward-looking expectations and projections. This outlook is not a guarantee of future results and is subject to future events, risks, and uncertainties, many of which are beyond the control of, or currently unknown to Valamar Riviera, as well as potentially incorrect assumptions that could cause the actual results to
Valamar Lacroma Dubrovnik 4*, Dubrovnik

BUSINESS RESULTS 1/1/2017 - 30/9/2017
19
Valamar Crystal Hotel 4*, Poreč
Results of the Company
beverages costs and costs of energy sources and water) driven by larger business volume.
Staff costs totaled HRK 344.5 million, represented 32% of operating expenses (30% in 2016) and grew by HRK 60.9 million compared to the same period last year. Staff costs growth was driven by the i) Hoteli Baška and Puntižela mergers and staff carryover, ii) salary increase policy (2% in June 2016, 2% in December 2016, 1.5% in June 2017, and 0.5% increment for years of service since 1 January 2017), and iii) the hiring of construction site staff (to carry out the large investments) and resort staff (to ensure high service quality in the new Premium/Upscale properties).
Amortization rose by 20% due to previous large investments and the Hoteli Baška and Puntižela mergers. Amortization represented 20% of operating expenses (19% in 2016) and totaled HRK 215.6 million (HRK 180.2 million in 2016). Other costs rose by 8.1% and totaled HRK 95.5 million. Provisions and value adjustments totaled HRK 70 thousand. Other operating expenses totaled HRK 6 million and fell by HRK 1.5 million.
During the first nine months of 2017, financial income totaled HRK 55.6 million and fell by HRK 23.1 million compared to the same period last year. Other financial income had the most significant decrease of HRK 34.7 million, mainly due to last year’s one-time income generated by the sale of shares. Interest rates, foreign exchange differences, dividends and similar income from unrelated parties presented the highest individual growth of HRK 12.6 million in the first nine months of 2017, driven by foreign exchange differences related to long-term loans due to HRK appreciation. Unrealized gains from financial assets fell by HRK 1.1 million due to last year’s one –time effect related to the early termination of an interest rate derivative financial instrument.
Please note that the data provided in the current year’s financial reports are not fully comparable to prior year’s data because of the said mergers. The items in the current period and prior period until the time of the merger i.e. until 31 March 2017 did not include Puntižela d.o.o. Similarly, the items in the prior period until the time of the merger i.e. i) until 31 March 2016 did not include the merged Hoteli Baška d.d. and ii) until 30 June 2016 did not include the merged Bastion upravljanje d.o.o. All significant changes in the Company’s financial reports should also be viewed in the context of the said transactions in the previous period.
In the period from 1 January 2017 to 30 September 2017, total revenues grew by HRK 130.8 million (+9%) and totaled HRK 1,597.9 million. Sales revenues totaled HRK 1,529.6 million and represented 96% of total revenues (93% in 2016). They increased by HRK 161.3 million (+12%) compared to the same period last year. Sales revenues between parties within the group totaled HRK 9.4 million (HRK 0.5 million in 2016) largely consisting of the management fee for Imperial’s properties on Rab. Sales revenues outside the group totaled HRK 1,520.2 million (HRK 1,368 million in 2016). Domestic sales revenues grew by 17.6% over prior comparable period results, totaling HRK 117 million and representing 7.3% of total revenues (6.8% in 2016). International sales revenues totaled HRK 1,412.6 million, representing 88.4% of total revenues (86.5% in 2016) and grew by 11.3% over prior comparable period results. Other operating and financial income represented 4% of total revenues (7% in 2016). Other operating revenues fell by 37%, totaling HRK 12.7 million and represented 1% of total revenues (1% in 2016).
Material costs totaled HRK 418.6 million, representing 39% of operating expenses (40% in 2016) and rose by HRK 41.5 million due to higher raw material costs (direct food and
The Company’s financial expenses totaled HRK 67.4 million and grew by HRK 27.7 million compared to the same period last year. Financial expenses related to interests, foreign exchange differences and other expenses from third parties rose by HRK 25.1 million. Due to HRK depreciation in 3Q 2017, foreign exchange losses related to long-term loans rose by HRK 20.1 million. Financial expenses related to interests grew by HRK 5.9 million due to the financial leverage used for the 2017 investment cycle. Other financial expenses grew by HRK 3.9 million driven by the negative land revaluation in a subsidiary.
Operating profit rose by HRK 10.7 million and totaled HRK 461.9 million, driven by the largest series of investments so far focused on improving competitiveness, services and products, as well as active operating efficiency management and demand–driven optimization of prices, marketing mix and sales channels. Profit before tax was HRK 450.1 million (HRK 490.3 million in 2016). The Company gross margin was 29.2% (35.3% in 2016).
Total company assets as of 30 September 2017 were HRK 4,803 million and grew by 15.8% compared to 31 December 2016.
BUSINESS RESULTS 1/1/2017 - 30/9/2017
20
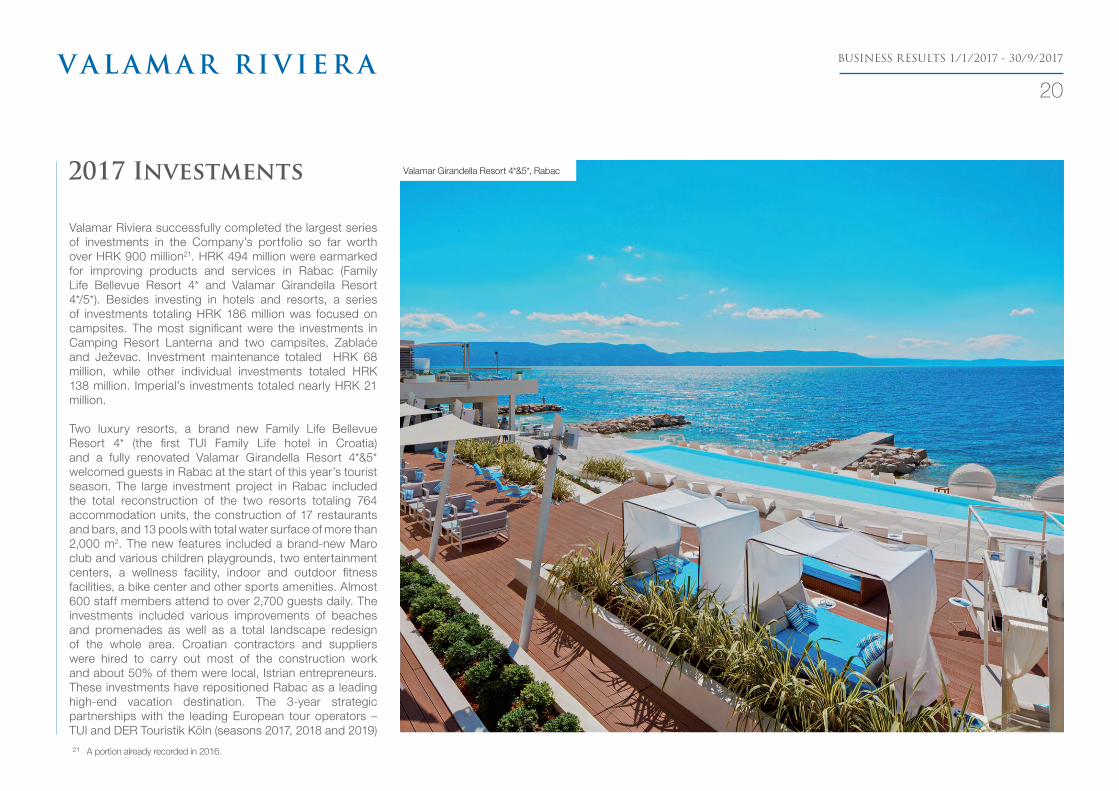
Valamar Girandella Resort 4*&5*, Rabac2017 Investments
Valamar Riviera successfully completed the largest series of investments in the Company’s portfolio so far worth over HRK 900 million21. HRK 494 million were earmarked for improving products and services in Rabac (Family Life Bellevue Resort 4* and Valamar Girandella Resort 4*/5*). Besides investing in hotels and resorts, a series of investments totaling HRK 186 million was focused on campsites. The most significant were the investments in Camping Resort Lanterna and two campsites, Zablaće and Ježevac. Investment maintenance totaled HRK 68 million, while other individual investments totaled HRK 138 million. Imperial’s investments totaled nearly HRK 21 million.
Two luxury resorts, a brand new Family Life Bellevue Resort 4* (the first TUI Family Life hotel in Croatia) and a fully renovated Valamar Girandella Resort 4*&5* welcomed guests in Rabac at the start of this year’s tourist season. The large investment project in Rabac included the total reconstruction of the two resorts totaling 764 accommodation units, the construction of 17 restaurants and bars, and 13 pools with total water surface of more than 2,000 m2. The new features included a brand-new Maro club and various children playgrounds, two entertainment centers, a wellness facility, indoor and outdoor fitness facilities, a bike center and other sports amenities. Almost 600 staff members attend to over 2,700 guests daily. The investments included various improvements of beaches and promenades as well as a total landscape redesign of the whole area. Croatian contractors and suppliers were hired to carry out most of the construction work and about 50% of them were local, Istrian entrepreneurs. These investments have repositioned Rabac as a leading high-end vacation destination. The 3-year strategic partnerships with the leading European tour operators – TUI and DER Touristik Köln (seasons 2017, 2018 and 2019) 21 A portion already recorded in 2016.

BUSINESS RESULTS 1/1/2017 - 30/9/2017
21
Family Life Bellevue Resort 4*, Rabachave secured occupancy. With this, more than 100,000 guests are expected to visit Rabac in the next three years, thus improving the promotion of Istrian tourism. Moreover, the number of guests from air travel markets will grow, thus creating opportunities for season prolongation.
Besides key investments in Rabac, Valamar Riviera continued investing in the concept of Premium camping. Investments totaling HRK 98 million were focused on upgrades in Camping Resort Lanterna 4*, one of the best European campsites. The reception area together with the shops and catering establishments underwent renovation. The campsite now features new high quality mobile homes and new amenities for children. Valamar Riviera invested HRK 66 million in upgrading accommodation and services on the island of Krk and in new high quality mobile homes for two campsites, Ježevac 4* and Zablaće 3*. In order to improve the quality of other campsites on the island of Krk, as well as in Istria and Dubrovnik, a range of investments was focused on improving accommodation, beach amenities, and catering establishments.
In 2017 Imperial completed its investment cycle totaling nearly HRK 21 million. Most of it was invested in San Marino campsite 3*, which featured a new premium zone with luxury mobile homes at the start of this tourist season. Significant investments were made in improving the business communication network and preparing the necessary project documentation for the forthcoming investments.
Moreover, several other projects to create new and improve existing features were completed and they will considerably improve the quality and experience at all destinations. They included beaches, expanding the Wi-Fi coverage, business digitalization, technological processes and energy efficiency.
BUSINESS RESULTS 1/1/2017 - 30/9/2017
22
Camping Lanterna 4*, Poreč2018 Investments
In line with the previously announced investments worth up to HRK 2 billion until 2020, Valamar is planning new large investments in 2018 that will be definitely determined at begining of December 2017. The investments will include the strategical repositioning of the hotel and camping portfolio towards products and services with high added value.
With the planned completion of Valamar Girandella Resort 4*&5*, Rabac will be repositioned as leading vacation destination for high-end guests. The first Kinderhotel in Valamar Riviera’s portfolio, the Valamar Girandella Maro Resort Hotel 5*, will offer family-friendly design and services tailored according to the needs of families with children of various ages. Kinderhotels Europa is a marketing association that brings together high-quality premium family hotels under the Austrian “Kinderhotels” brand. Investments in Dubrovnik are focused on repositioning hotel accommodation and developing new, high-end “adult friendly” services and amenities. Large investments in premium camping will continue, focusing on Istria and Krk island. Plans include numerous other investments in improving competitiveness and quality for guest amenities and products as well as projects focused on accommodation for seasonal employees.
As stated in our strategic goals, by continuously raising the quality of the portfolio properties and services, we create added value both for our guests and for all company stakeholders. However, numerous factors reduce the competitiveness of Croatian tourism and hinder further investment potential: VAT (one of the highest rates in the Mediterranean), the rate of total contributions to salaries, the still unresolved issue of tourism land, skilled labor shortages, the possible introduction of the property tax
BUSINESS RESULTS 1/1/2017 - 30/9/2017
23
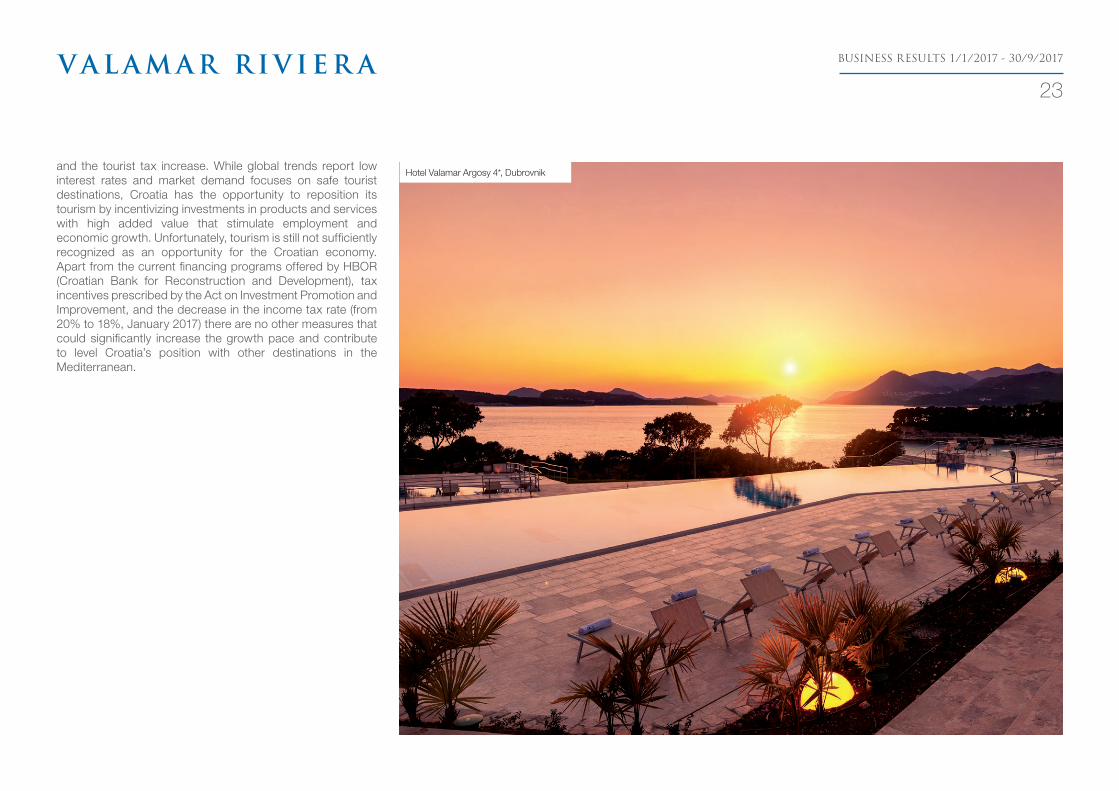
Hotel Valamar Argosy 4*, Dubrovnikand the tourist tax increase. While global trends report low interest rates and market demand focuses on safe tourist destinations, Croatia has the opportunity to reposition its tourism by incentivizing investments in products and services with high added value that stimulate employment and economic growth. Unfortunately, tourism is still not sufficiently recognized as an opportunity for the Croatian economy. Apart from the current financing programs offered by HBOR (Croatian Bank for Reconstruction and Development), tax incentives prescribed by the Act on Investment Promotion and Improvement, and the decrease in the income tax rate (from 20% to 18%, January 2017) there are no other measures that could significantly increase the growth pace and contribute to level Croatia’s position with other destinations in the Mediterranean.
BUSINESS RESULTS 1/1/2017 - 30/9/2017
24
DubrovnikThe Risks of the Company and the Group
Tourism is a global industry, closely connected with the real and financial economy, geopolitical position and environmental sustainability. The integrity of this industry will determine its future growth. The Company and Group monitor and assess risks at micro and macro levels. Moreover, when defining the strategy, particular attention is given to the short and medium–term risk impact in order to maintain business sustainability over time.
When monitoring and assessing risks the Company and Group use a proactive approach thus assessing the potential impact of each individual risk. The Company and Group consider risk management to be a key factor of differentiation among competitors. Risk management aims at creating sustainable value, thus offering reliability and security to numerous stakeholders.
There are five key steps in a risk management process:1) Identifying potential risks;2) Assessing identified risks;3) Determining actions and responsibilities for efficient
risk management;4) Monitoring and overseeing preventive actions;5) Exchanging information on risk management results
conducted by the Management board.
The different types of risks facing Valamar Riviera can be classified into the following groups:•Financialrisks
- related to financial variables, can have a negative
BUSINESS RESULTS 1/1/2017 - 30/9/2017
25
impact on meeting liabilities for the company and the Group, liquidity, debt management etc.;
•Businessrisks- related to the way company business is conducted in
terms of supply and demand, competition, adapting to market trends, investments, growth etc.;
•Operationalrisks- can arise form errors in business operations, human
error, IT system etc.;•Globalrisks
- can arise from natural disasters, pandemics, food shortage, social unrest, wars and other force majeure events beyond Valamar Riviera’s control;
•Compliancerisks- can arise from failure to comply with state laws and
local regulations; risks related to changes in tax and other regulations.
Financial risksIn their day-to-day business activities, the Company and Group face a number of financial threats, especially:
1) Foreign exchange risk;2) Interest rate risk;3) Credit risk;4) Price risk;5) Liquidity risk;6) Share-related risks.
The Company and Group have a proactive approach in mitigating interest rate and foreign exchange risks, by employing available market instruments. Internal risk management goals and policies aim at protecting foreign currency inflows during seasonal activity and partial interest hedging of the principal loan amount.
1) Foreign exchange riskThe Company and Group conduct their business operations across national borders and are exposed to
foreign exchange risks. They mainly result from changes in the euro/ kuna exchange rate. Foreign exchange risk arises from future commercial transactions and recognized assets and liabilities. Most of our sales revenue generated abroad and long-term debt is denominated in euros. Hence, for the most part the Company and Group are naturally hedged from exchange rate risks. Since some liabilities are denominated in kunas, the Company and Group actively manage risks by using derivative instruments available on the financial market. The instruments are used according to operating assessments and expected market trends. In this way the assets, liabilities and cash flow are protected from the risk impact.
2) Interest rate riskVariable rate loans expose the Company and Group to cash flow interest rate risk. Periodically, the Company and Group resort to derivative instruments in order to hedge cash flow and interest rate by applying interest rate swaps. The economic effect of such swaps is the conversion of variable interest rate loans into fixed interest rate loans for a pre-committed hedged part of the loan principal. The Company and Group have interest-bearing assets (cash assets and deposits) so their revenue and cash flow depend on changes in market interest rates. This becomes evident especially during the season when the Company and Group have significant cash surpluses at their disposal.
3) Credit riskCredit risk arises from cash assets, time deposits and receivables. According to the Company and Group sales policy, business transactions are conducted only with customers with suitable credit history, i.e. by agreeing advances, bank securities and (for individual customers) payments made through major credit card companies. The Company and Group continuously strive to monitor their exposure towards other parties and their credit rating as well as obtain security instruments (bills of exchange, promissory notes) in order to reduce bad debt risks related to services provided.
4) Price risk The Company and Group hold equity securities and are exposed to equity price risk due to security price volatility. Valamar Riviera is not an active participant in the market trade in terms of investing in equity and debt securities. However, with the HRK 285 million invested in buying shares of Imperial d.d., the company is exposed to the said risk to a certain extent.
5) Liquidity riskThe Company and Group have a sound liquidity risk management. Sufficient funds for meeting liabilities are available at any given moment through adequate amounts from contracted credit lines and by ensuring credit line availability in the future. Liquidity risk is managed by generating strong positive net operating cash flows, while capital investments are financed by credit lines. All the credit lines in 2017 have already been arranged with financial institutions. The repayment of the major credit lines coincides with periods of strong cash inflows from operations. The Company and Group monitor the level of available funds through daily cash and debt reports. Long-term cash flow forecasts as well as annual (monthly) forecasts are based on the set budget. After meeting the needs of working capital management the surplus is deposited in the treasury. From there the funds are invested in interest-bearing current accounts, time deposits, money market deposit accounts and marketable securities. Only instruments with suitable maturities and sufficient liquidity are selected, according to the forecast needs for liquid funds.
6) Share-related risksThe market value of shares is the riskiest asset class due to its volatility resulting from the volatile nature of the whole capital market, macroeconomic trends on markets where the Company and Group operate and discrepancies between the expectations of financial analysts and the actual results. Furthermore, other contributing factors are also changes in the dividend policy, various activities in the segment of consolidations, mergers, acquisitions and forming of strategic
BUSINESS RESULTS 1/1/2017 - 30/9/2017
26
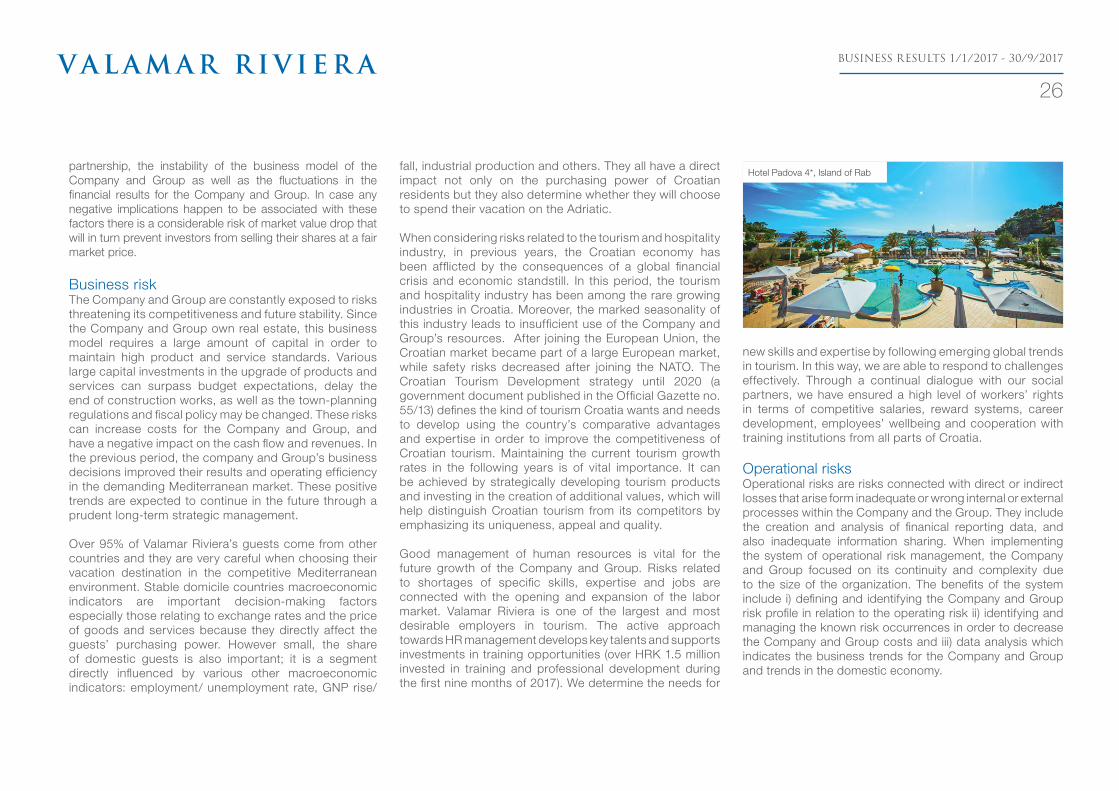
Hotel Padova 4*, Island of Rabpartnership, the instability of the business model of the Company and Group as well as the fluctuations in the financial results for the Company and Group. In case any negative implications happen to be associated with these factors there is a considerable risk of market value drop that will in turn prevent investors from selling their shares at a fair market price.
Business riskThe Company and Group are constantly exposed to risks threatening its competitiveness and future stability. Since the Company and Group own real estate, this business model requires a large amount of capital in order to maintain high product and service standards. Various large capital investments in the upgrade of products and services can surpass budget expectations, delay the end of construction works, as well as the town-planning regulations and fiscal policy may be changed. These risks can increase costs for the Company and Group, and have a negative impact on the cash flow and revenues. In the previous period, the company and Group’s business decisions improved their results and operating efficiency in the demanding Mediterranean market. These positive trends are expected to continue in the future through a prudent long-term strategic management.
Over 95% of Valamar Riviera’s guests come from other countries and they are very careful when choosing their vacation destination in the competitive Mediterranean environment. Stable domicile countries macroeconomic indicators are important decision-making factors especially those relating to exchange rates and the price of goods and services because they directly affect the guests’ purchasing power. However small, the share of domestic guests is also important; it is a segment directly influenced by various other macroeconomic indicators: employment/ unemployment rate, GNP rise/
fall, industrial production and others. They all have a direct impact not only on the purchasing power of Croatian residents but they also determine whether they will choose to spend their vacation on the Adriatic.
When considering risks related to the tourism and hospitality industry, in previous years, the Croatian economy has been afflicted by the consequences of a global financial crisis and economic standstill. In this period, the tourism and hospitality industry has been among the rare growing industries in Croatia. Moreover, the marked seasonality of this industry leads to insufficient use of the Company and Group’s resources. After joining the European Union, the Croatian market became part of a large European market, while safety risks decreased after joining the NATO. The Croatian Tourism Development strategy until 2020 (a government document published in the Official Gazette no. 55/13) defines the kind of tourism Croatia wants and needs to develop using the country’s comparative advantages and expertise in order to improve the competitiveness of Croatian tourism. Maintaining the current tourism growth rates in the following years is of vital importance. It can be achieved by strategically developing tourism products and investing in the creation of additional values, which will help distinguish Croatian tourism from its competitors by emphasizing its uniqueness, appeal and quality.
Good management of human resources is vital for the future growth of the Company and Group. Risks related to shortages of specific skills, expertise and jobs are connected with the opening and expansion of the labor market. Valamar Riviera is one of the largest and most desirable employers in tourism. The active approach towards HR management develops key talents and supports investments in training opportunities (over HRK 1.5 million invested in training and professional development during the first nine months of 2017). We determine the needs for
new skills and expertise by following emerging global trends in tourism. In this way, we are able to respond to challenges effectively. Through a continual dialogue with our social partners, we have ensured a high level of workers’ rights in terms of competitive salaries, reward systems, career development, employees’ wellbeing and cooperation with training institutions from all parts of Croatia.
Operational risksOperational risks are risks connected with direct or indirect losses that arise form inadequate or wrong internal or external processes within the Company and the Group. They include the creation and analysis of finanical reporting data, and also inadequate information sharing. When implementing the system of operational risk management, the Company and Group focused on its continuity and complexity due to the size of the organization. The benefits of the system include i) defining and identifying the Company and Group risk profile in relation to the operating risk ii) identifying and managing the known risk occurrences in order to decrease the Company and Group costs and iii) data analysis which indicates the business trends for the Company and Group and trends in the domestic economy.
BUSINESS RESULTS 1/1/2017 - 30/9/2017
27
Camping Krk 5*, Island of KrkThe Company and Group are aware of the reliability of IT business solutions and safety in the cyber world. Hence, they continually upgrade, develop and implement new technologies in everyday business operations. A special focus is given to providing sufficient resources for the de-velopment and implementation of new technologies re-lated to ICT, data protection, and upgrade of the current business systems and implementation of new ones.
Global risksDespite improved security and political conditions, which have encouraged to a certain extent investments into tourism and hospitality, there are challenges that the Croatian tourism has to face, such as: •Periods of global financial crisis which reduce the
purchasing power of the travelling-prone population;•Securityissuesrelatedtogloballyescalatingterrorism
threats;•Security and political instability in the immediate
environment of the neighboring countries.
Environmental risks can also have an adverse effect on the Company and Group’s business results, primarily in terms of customer satisfaction with the whole experience while staying at one of Valamar’s properties and this can affect the number of arrivals. The possible risks can include: sea pollution (caused by oil or chemical spillage), but also long-term water quality reduction and coast pollution due to inadequate waste disposal and waste water treatment as well as extensive use of agricultural fertilizers. Other environmental conditions typical for climate changes such as long drought periods or long rainy periods can directly influence the guests’ length of stay in the hotels and campsites as well as increasing
the operating costs. A number of other natural disasters and calamities (earthquakes, fires, floods and rainstorms), air pollution caused by toxic gas emissions from industrial plants and vehicles, as well excessive urbanization and the introduction of invasive species should also be taken into consideration.
Compliance risksChanges in tax laws and other regulations pose a very serious threat and represent a demanding segment in risk management because in this particular situation the possibilities for the Company and Group are limited. In previous years, there has been a number of important changes in tax and non-tax charging regulations, which have adversely affected the Company and Group profitability:•InMarch2012thestandardVATrategrewfrom23%to25%,
in January 2013 a new 10% VAT rate was introduced only to be replaced within a year by a 13% VAT rate applicable to the tourism and hospitality industry (January 2014), while in January 2017 a new 25% VAT rate was introduced for F&B (a la carte) services;
• InMay 2012 the health insurance employer contributionrate fell from 15% to 13% and then in April 2014 it grew back to 15%;
•Frequentincreasesinvariousfeesandchargesregardingwater distribution and the like.
Such frequent changes in laws regulating taxes and parafiscal charges often take place only after the business policy and budget for the next financial year have been approved and commercial terms and conditions with partners agreed. All this jeopardizes the Company and Group financial position and future investment plans as well as credibility towards shareholders. The Company and Group are also threatened by changes in regulations governing concession fees for maritime domain and tourism land use, the latter still presenting unresolved legal issues. Given the nature of the Company and Group’s business, the right to use parts of the maritime domain as well as land for tourism purposes is of vital importance for future growth, especially for campsite-related operations.
Valamar Isabella Island Resort 4*&5*, Poreč

BUSINESS RESULTS 1/1/2017 - 30/9/2017
28
CorporateGovernance
The company Valamar Riviera d.d. and the Group continuously strive to develop and operate according to good practices of corporate governance. The business strategy, corporate policy, key corporate regulations and business practice are all geared towards creating a transparent and efficient business operation while forging solid bonds with the local community. In order to foster further growth and set high corporate governance standards, the Company adopted its own Corporate Governance Code in 2008 and the Management Board fully complies with its provisions. After the company was listed on the Official market of the Zagreb Stock Exchange, the Company has also complied with the Zagreb Stock Exchange Governance Code. The Company respects and implements the prescribed corporate governance measures (as reported in detail in the prescribed annual questionnaire and published as prescribed on the Zagreb Stock Exchange and Valamar Riviera websites).
The major direct shareholders according to the Central Depository and Clearing Company data are listed in the table in the “Valamar Riviera Share“ section.
The Company defined the process of preparing and disclosing financial reports in a detailed internal document. With this, the financial reporting procedure is set within a system of internal review and risk management. Moreover, in order to monitor and mitigate the financial reporting risk, the Company uses the measures described in “The Risks of the Company and the Group“.
The Companies Act and the Company’s Articles of Association define the General Assembly’s authority and prescribe how it meets and works. The meeting invitation, proposals and the adopted resolutions are made public
Supervisory Board: As the term of office for the Supervisory Board members expired on 6 July 2017 (Mr. Gustav Wurmböck - Chairman, Mr. Franz Lanschützer - Deputy Chairman, Mr. Mladen Markoč - Deputy Chairman, and members: Mr. Georg Eltz, Ms. Mariza Jugovac, Mr. Hans Dominik Turnovszky and Mr. Vicko Ferić), the following were elected for a new 4 –year term of office: Mr. Gustav Wurmböck - Chairman, Mr. Franz Lanschützer - Deputy Chairman, Mr. Mladen Markoč - Deputy Chairman, and members: Mr. Georg Eltz, Mr. Hans Dominik Turnovszky, Mr. Vicko Ferić, and Mr. Valter Knapić - employee representative elected by the Works Council. The term of office for the newly elected Supervisory Board members started on 7 July 2017.
In order to perform efficiently its function and duties as prescribed by the Audit Act, the Supervisory Board has formed the following bodies:
Presidium of the Supervisory Board: Mr. Gustav Wurmböck, Chairman, Mr. Franz Lanschützer and Mr. Mladen Markoč, Presidium Members.
Audit Committee: Mr. Georg Eltz, Chairman, and members: Mr. Franz Lanschützer, Mr. Mladen Markoč, Mr. Vicko Ferić, and Mr. Dubravko Kušeta.
Investment Committee: Mr. Franz Lanschützer, Chairman and members: Mr. Georg Eltz, Mr. Vicko Ferić, Mr. Hans Dominik Turnovszky, and Mr. Gustav Wurmböck.
Compliant to effective regulations and Company bylaws, The Management and Supervisory Board primarily act through meetings and by correspondence in their decision-making.
according to the provisions of the Companies Act, the Capital Market Act and the Zagreb Stock Exchange Rules.
There is a time limit related to the voting right at the General Assembly: according to the provisions of the Croatian Companies Act, shareholders are required to register their participation within the prescribed time limit in order to attend the General Assembly. Under no circumstances can the financial right arising from securities be separated from holding the securities. There are no securities with special control rights nor are there any limitations to voting rights in the Company (one share, one vote). The Company’s Articles of Association comply with the Croatian Companies Act and they define the procedure of appointing and recalling members of the Management Board and Supervisory Board. There are no limitations based on gender, age, education, profession or similar.
According to the General Assembly’s decision dated 17 November 2014, the Company can acquire its own shares.
The Companies Act determines any amendments to the Company’s Articles of Association, without any additional limitations.
The Management Board members’ authority fully complies with the regulations prescribed by the Companies Act.
The Company’s Corporate Bodies Are:
Management Board: Mr. Željko Kukurin, President of the Management Board, and Mr. Marko Čižmek, Member of the Management Board.

BUSINESS RESULTS 1/1/2017 - 30/9/2017
29
Branch Offices of the Company
Related-party transactions
The following branch offices were registered on 2 September 2011: Podružnica za turizam RABAC (branch office for tourism), with registered office in Rabac, Slobode 80, Podružnica za turizam ZLATNI OTOK (branch office for tourism), with registered office in Krk, Vršanska 8. Podružnica za turizam DUBROVNIK-BABIN KUK (branch office for tourism), with registered office in Dubrovnik, Dr. Ante Starčevića 45, was registered on 4 October 2013. Podružnica za savjetovanje u vezi s poslovanjem i upravljanjem ZAGREB (Branch Office for Business and Management Consulting), with registered office in Zagreb, Miramarska 24 was registered on 1 October 2014, and on 1 April 2017 Podružnica za turizam BRIONI (branch office for tourism), with registered office in Pula, Puntižela 155.
The Rabac, Zlatni otok, Dubrovnik-Babin kuk and Brioni branch offices, as economic drivers of their local communities, continue to operate in their destinations supporting their development by promoting further investments,hospitality development and participation in social and business activities.
Transactions between related parties within the Group are conducted under standard commercial terms and conditions and at current market prices.
In the period under review, revenues resulting from related-party transactions totaled HRK 9.5 million22 (in 2016: HRK 546 thousand) for the Company, and HRK 20 thousand (in 2016: HRK 12 thousand) for the Group. The expenses amounted to HRK 22.5 million (in 2016: HRK 22.4 million) for the Company, and HRK 196 thousand (in 2016: HRK 581 thousand) for the Group.
On 30 September 2017 the related-party receivables and payables balance totaled HRK 123.5 million23 for the Company (at year-end 2016: HRK 138.5 million23), and HRK 8 thousand for the Group (at year-end 2016 there was none). Liabilities for the Company totaled HRK 58 thousand (at year-end 2016: HRK 279 thousand), while the Group had no liabilites (at the end of 2016: HRK 154 thousand).
22 For the most part refers to the management fee regarding the management of Imperial’s properties and facilities. The Management contract has been implemented as of 4 January 2017.
23 For the most part refers to the re-invoiced amount arising from the investment made in the reconstruction and upgrading of the hotel Valamar Lacroma owned by subsidiary Elafiti Babin-kuk d.o.o.

BUSINESS RESULTS 1/1/2017 - 30/9/2017
30
RIVP-R-A Share
The Company did not acquire its treasury shares in the first nine months of 2017. In the respective period the Company released 62,583 treasury shares, out of which 24,182 for dividend payout. On 30 September 2017, the Company held in total 1,794,451 treasury shares, or 1.42% of the share capital.
In the period from 1 January 2017 to 30 September 2017, the highest recorded share price in regular trading on the regulated market was HRK 48.60, while the lowest was HRK 34.68. The Company’s share price increased by 23.8%, exceeding both CROBEX and CROBEX 10 indices trends, which recorded a decrease of 9.1% and 7.2% respectively. With a regular trading turnover of HRK 1.4 million a day24, the Valamar Riviera’s share is the most traded share on the Zagreb Stock Exchange.
Apart from the Zagreb Stock Exchange indices, the share makes a component part of the Vienna Stock Exchange indices (CROX25 and SETX26), and SEE Link indices27 (SEELinX and SEELinX EWI). Zagrebačka banka d.d. and Interkapital vrijednosni papiri d.o.o. perform specialist tasks of ordinary shares of the Company listed in the Official Market of Zagrebačka burza d.d. They provide support to Valamar Riviera’s share turnover, which in the period under review was an average 24.9%28.
The Company actively holds meetings and conference calls with domestic and foreign investors, as well as presentations for investors thus providing support to high-level transparency, creation of additional liquidity, increase of share value, and involvement of potential investors. During the first nine months of 2017, more than fifty-five meetings were held, including those held at US financial centers, London Stock Exchange, at the Zagreb and Ljubljana Stock Exchange conference, and Wood&Co brokerage house conference in Bucharest and Erste Group conference in Stegersbach. By the end of this year we plan to participate in the following investor conferences: Auerbach Grayson “Frontier & Emerging Markets
Performance of Valamar Riviera’s share and CROBEX and CROBEX 10 indices
Average RIVP-R-A share price (in HRK)
RIVP-R-A CROBEX (indexed on the basis of the RIVP-R-A average share price on 2/1/2017)
CROBEX 10 (indexed on the basis of the RIVP-R-A average share price on 2/1/2017)
30.0
32.5
37.5
40.0
Analytical coverage of Valamar Riviera is provided by: 1) Alta invest d.d., Ljubljana; 2) ERSTE bank d.d., Zagreb; 3) FIMA vrijednosnice d.o.o., Varaždin; 4) Interkapital vrijednosni papiri d.o.o., Zagreb; 5) Raiffeisenbank Austria d.d., Zagreb; 6) UniCredit Group - Zagrebačka banka d.d., Zagreb.
2/1/2017 28/2/2017 30/4/2017 31/8/2017 30/9/2017
+23.8%
-7.2%
-9.1%
47.5
42.5
30/6/2017
35.0
45.0
24 Block transactions are excluded from the calculation.25 Croatian Traded Index (CROX) is a capitalization-weighted price index and is made up of 12 most liquid and highest capitalized shares of Zagreb Stock Exchange.26 South-East Europe Traded Index (SETX) is a capitalization-weighted price index
consisting of blue chip stocks traded on stock exchanges in the region of South-eastern Europe (shares listed in Bucharest, Ljubljana, Sofia, Belgrade and Zagreb). 27 SEE Link is a regional platform for securities trading. It was founded by Bulgarian, Macedonian, and Zagreb Stock Exchange. SEE LinX and SEE LinX EWI are two
“blue chip” regional indices composed of ten most liquid regional companies listed on three Stock Exchanges: five from Croatia, three from Bulgaria, and two from Macedonia.28 Block transactions are excluded from the calculation. Data refers to the period 1/1 - 30/9/2017.
Conference” - New York (October), WOOD&Co/Belgrade Stock Exchange: Upgrade in Belgrade - Belgrade (November) and Wood&Co “EME Conference 2017” - Prague (December). In this way Valamar Riviera strives to grow further value for all its stakeholders and promote Valamar Riviera’s share as one of the leading shares not only on the Croatian capital market but also among other tourism shares in the region.
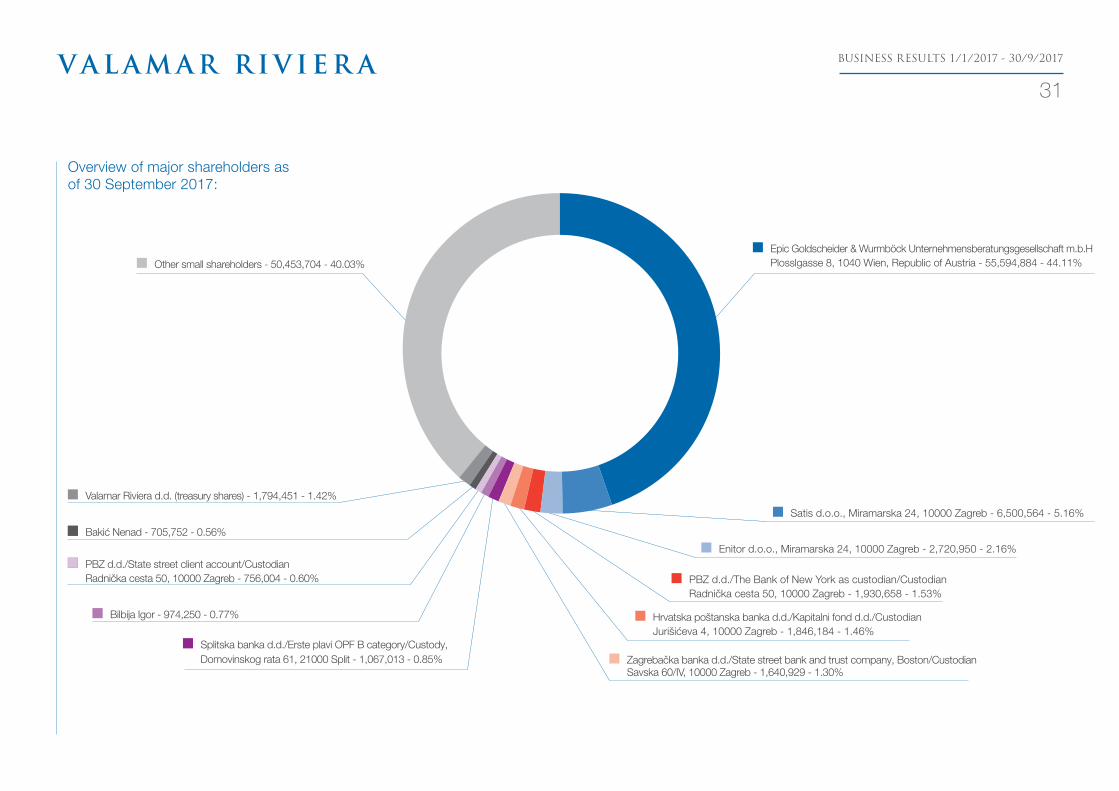
BUSINESS RESULTS 1/1/2017 - 30/9/2017
31
Epic Goldscheider & Wurmböck Unternehmensberatungsgesellschaft m.b.H Plosslgasse 8, 1040 Wien, Republic of Austria - 55,594,884 - 44.11%
PBZ d.d./The Bank of New York as custodian/Custodian Radnička cesta 50, 10000 Zagreb - 1,930,658 - 1.53%
Enitor d.o.o., Miramarska 24, 10000 Zagreb - 2,720,950 - 2.16%
Satis d.o.o., Miramarska 24, 10000 Zagreb - 6,500,564 - 5.16%
Zagrebačka banka d.d./State street bank and trust company, Boston/Custodian
Savska 60/IV, 10000 Zagreb - 1,640,929 - 1.30%
Bakić Nenad - 705,752 - 0.56%
Bilbija Igor - 974,250 - 0.77%
Splitska banka d.d./Erste plavi OPF B category/Custody, Domovinskog rata 61, 21000 Split - 1,067,013 - 0.85%
PBZ d.d./State street client account/Custodian Radnička cesta 50, 10000 Zagreb - 756,004 - 0.60%
Other small shareholders - 50,453,704 - 40.03%
Overview of major shareholders as of 30 September 2017:
Valamar Riviera d.d. (treasury shares) - 1,794,451 - 1.42%
Hrvatska poštanska banka d.d./Kapitalni fond d.d./Custodian Jurišićeva 4, 10000 Zagreb - 1,846,184 - 1.46%
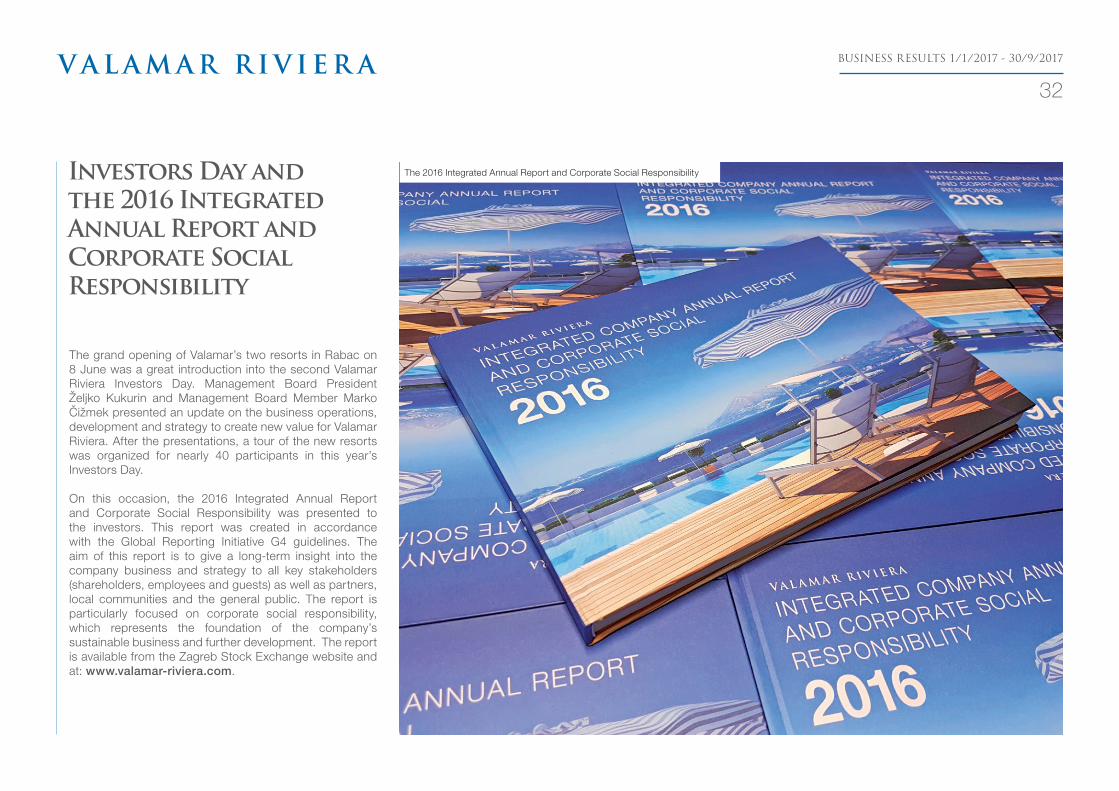
BUSINESS RESULTS 1/1/2017 - 30/9/2017
32
The 2016 Integrated Annual Report and Corporate Social ResponsibilityInvestors Day and the 2016 Integrated Annual Report and Corporate Social Responsibility
The grand opening of Valamar’s two resorts in Rabac on 8 June was a great introduction into the second Valamar Riviera Investors Day. Management Board President Željko Kukurin and Management Board Member Marko Čižmek presented an update on the business operations, development and strategy to create new value for Valamar Riviera. After the presentations, a tour of the new resorts was organized for nearly 40 participants in this year’s Investors Day.
On this occasion, the 2016 Integrated Annual Report and Corporate Social Responsibility was presented to the investors. This report was created in accordance with the Global Reporting Initiative G4 guidelines. The aim of this report is to give a long-term insight into the company business and strategy to all key stakeholders (shareholders, employees and guests) as well as partners, local communities and the general public. The report is particularly focused on corporate social responsibility, which represents the foundation of the company’s sustainable business and further development. The report is available from the Zagreb Stock Exchange website and at: www.valamar-riviera.com.
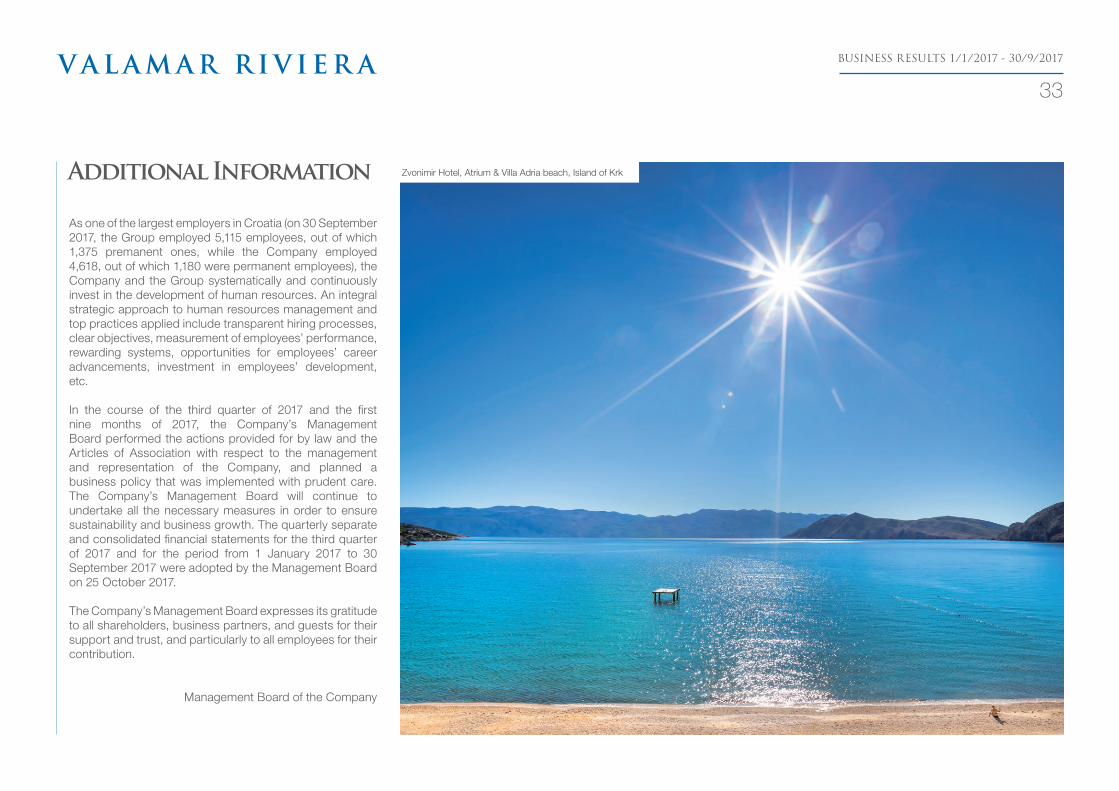
BUSINESS RESULTS 1/1/2017 - 30/9/2017
33
Additional Information
As one of the largest employers in Croatia (on 30 September 2017, the Group employed 5,115 employees, out of which 1,375 premanent ones, while the Company employed 4,618, out of which 1,180 were permanent employees), the Company and the Group systematically and continuously invest in the development of human resources. An integral strategic approach to human resources management and top practices applied include transparent hiring processes, clear objectives, measurement of employees’ performance, rewarding systems, opportunities for employees’ career advancements, investment in employees’ development, etc.
In the course of the third quarter of 2017 and the first nine months of 2017, the Company’s Management Board performed the actions provided for by law and the Articles of Association with respect to the management and representation of the Company, and planned a business policy that was implemented with prudent care. The Company’s Management Board will continue to undertake all the necessary measures in order to ensure sustainability and business growth. The quarterly separate and consolidated financial statements for the third quarter of 2017 and for the period from 1 January 2017 to 30 September 2017 were adopted by the Management Board on 25 October 2017.
The Company’s Management Board expresses its gratitude to all shareholders, business partners, and guests for their support and trust, and particularly to all employees for their contribution.
Management Board of the Company
Zvonimir Hotel, Atrium & Villa Adria beach, Island of Krk
BUSINESS RESULTS 1/1/2017 - 30/9/2017
34
In Poreč, 25 October 2017
In accordance with provisions of Law on Capital Market, Marko Čižmek, Management board member responsible for finance, treasury and IT business as well as relations with institutional investors and Ljubica Grbac director of department of finance and accounting, procurator and person responsible for finance and accounting, together as persons responsible for the preparation of quarterly reports of company Valamar Riviera d.d. seated in Poreč, Stancija Kaligari 1, OIB 36201212847(hereinafter: Company), hereby make the following
STATEMENT
According to our best knowledge
- The shortened set of consolidated and unconsolidated financial reports for the third quarter of 2017 are prepared in accordance with applicable standards of financial reporting and represent a true and fair view of the assets and obligations, profit and loss, financial position and Company’s business as well as the companies included in the consolidation.
- Interim report of the Company’s Management board for the period between 1 January and 30 September 2017 contains the true presentation of development, results and position of the Company and companies included in the consolidation, with description of significant risks and uncertainties which the Company and companies included in the consolidation are exposed to.
Marko Čižmek Ljubica Grbac Member of the Management Board Director of Department of Finance and Accounting
Responsibilityfor the quarterlyfinancial statements
BUSINESS RESULTS 1/1/2017 - 30/9/2017
35
Reporting period: from 1/1/2017 to 30/9/2017
Quarterly financial report TFI-POD
Tax number (MB): 3474771Company registration number (MBS): 040020883Personal identification number (OIB): 36201212847
Issuing company: Valamar Riviera d.d.
Postal code and place 52440 Poreč
Street and house number: Stancija Kaligari 1
E-mail address: [email protected]
Internet address: www.valamar-riviera.com
Municipality/city code and name: 348 Poreč
County code and name: 18 Istarska
Number of employees:(period end) 5.115
NKD code: 5510
Consolidated report: YESCompanies of the consolidation subject (according to IFRS): Seat: MB:
Valamar hotels & resorts GmbH Frankfurt 04724750667Hoteli Baška d.d. Baška 03035140Mirta Bašćanska d.o.o. Baška 01841017Vala Bašćanska d.o.o. Baška 02086131Baškaturist d.o.o. Baška 03849236Puntižela d.o.o. Pula 03203379Bastion upravljanje d.o.o. Zagreb 01877453Elafiti Babin kuk d.o.o. Dubrovnik 01273094Magične stijene d.o.o. Dubrovnik 02315211Palme turizam d.o.o. Dubrovnik 02006103Pogača Babin Kuk d.o.o. Dubrovnik 02236346Bugenvilia d.o.o. Dubrovnik 02006120Imperial d.d. Rab 03044572
Accounting firm:
Contact person: Sopta Anka(please insert only the contact’s full name)
Telephone: 052/408 188 Fax: 052/408 110
E-mail address: [email protected]
Family name and name: Kukurin Željko, Čižmek Marko(authorized representative)
Documents disclosed:
1. Financial statements (Balance Sheet, Income Statement, Cash Flow Statement, Statement of Changes in Equity and notes to financial statements)
2. Management Interim Report;
3. Declaration of the persons responsible for preparing the issuer's statements;
L.S. (authorized representative's signature)

BUSINESS RESULTS 1/1/2017 - 30/9/2017
36
Balance Sheet (as per 30/9/2017)Taxpayer: 36201212847; Valamar Riviera d.d.
ItemADP
codePreceding
yearCurrent
year1 2 3 4A) SUBSCRIBED CAPITAL UNPAID 001B) NON CURRENT ASSETS (ADP 003+010+020+031+036) 002 4.105.084.164 4.548.871.693I. INTANGIBLE ASSETS (ADP 004 to 009) 003 24.080.361 24.563.441
1. Research and Development expenditure 004 2. Patents, licences, royalties, trademarks and service marks, software and similar rights 005 17.238.280 13.986.816 3. Goodwill 006 6.567.609 6.567.609 4. Prepayments for intangible assets 007 5. Intangible assets under construction 008 274.472 4.009.016 6. Other intangible assets 009
II. TANGIBLE ASSETS (ADP 011 to 019) 010 3.941.768.572 4.386.518.223 1. Land 011 873.211.455 874.708.080 2. Property 012 2.522.990.552 2.392.254.603 3. Plants and equipment 013 225.945.122 249.838.374 4. Tools, plants and vehicles 014 81.203.324 94.220.465 5. Biological asset 015 6. Prepayments for tangible assets 016 31.783.971 6.798.809 7. Assets under construction 017 168.568.553 734.245.113 8. Other tangible assets 018 27.197.353 24.231.345 9. Investments property 019 10.868.242 10.221.434
III. NON-CURRENT FINANCIAL ASSETS (ADP 021 to 030) 020 6.601.376 5.138.925 1. Stakes (shares) in undertakings in a Group 021 1.365.316 1.553.010 2. Investments in other securities of undertakings in a Group 022 3. Loans, deposits etc given to undertakings in a Group 023 4. Stakes (shares) in undertakings with participating interest 024 5. Investments in other securities of undertakings with participating interest 025 6. Loans, deposits etc given to undertakings with participating interest 026 7. Investments in securities 027 4.766.325 3.197.280 8. Given loans, deposits and similar 028 299.735 218.635 9. Other investments accounted for using the equity method 029 10. Other non-current financial assets 030 170.000 170.000
IV. TRADE RECEIVABLES (ADP 032 to 035) 031 995.869 884.915 1. Receivables from undertakings in a Group 032 2. Receivables from undertakings with participating interests 033 3. Trade receivables 034 87.500 4. Other receivables 035 995.869 797.415
V. DEFERRED TAX ASSETS 036 131.637.986 131.766.189C) CURENT ASSETS (ADP 038+046+053+063) 037 336.880.206 531.294.007I. INVENTORIES (ADP 039 to 045) 038 19.245.740 18.339.851
1. Raw materials and consumables 039 18.967.510 17.668.861 2. Work in progress 040 3. Finished products 041 4. Merchandise 042 236.606 416.074 5. Prepayments for inventories 043 41.624 254.916 6. Other available-for-sale assets 044 7. Biological asset 045
II. RECEIVABLES (ADP 047 to 052) 046 42.229.932 151.536.210 1. Receivables from undertakings in a Group 047 204 250.688 2. Receivables from undertakings with participating interest 048 253 3. Trade receivables 049 17.711.198 134.688.853 4. Receivables from employees and members of the undertaking 050 657.014 5.253.641 5. Receivables from Government and other institutions 051 21.012.831 5.993.804 6. Other receivables 052 2.848.432 5.349.224
III. CURRENT FINANCIAL ASSETS (ADP 054 to 062) 053 753.886 1.660.274 1. Stakes (shares) in undertakings in a Group 054 2. Investments in other securities of undertakings in a Group 055 3. Loans, deposits etc given to undertakings in a Group 056 4. Stakes(shares) in undertakings with participating interest 057 5. Investments in other securities of undertakings with participating interest 058 6. Loans, deposits etc given to undertakings with participating interest 059 7. Investments in securities 060 252.267 8. Given loans, deposits and similar 061 753.886 709.967 9. Other financial assets 062 698.040
IV. CASH AND CASH EQUIVALENTS 063 274.650.648 359.757.672D) PREPAYMENTS AND ACCRUED INCOME 064 23.369.940 78.612.453E) TOTAL ASSETS (ADP 001+002+037+064) 065 4.465.334.310 5.158.778.153F) OFF-BALANCE SHEET ITEMS 066 54.631.638 54.572.742

BUSINESS RESULTS 1/1/2017 - 30/9/2017
37
Balance Sheet (as per 30/9/2017) (continued)Taxpayer: 36201212847; Valamar Riviera d.d.
ItemADP
codePreceding
yearCurrent
year1 2 3 4LIABILITIESA) CAPITAL AND RESERVES (ADP 068 to 070+076+077+081+084+087) 067 2.373.637.039 2.777.011.593I. SHARE CAPITAL 068 1.672.021.210 1.672.021.210II. CAPITAL RESERVES 069 2.204.690 3.602.906III. RESERVES FROM PROFIT (ADP 071+072-073+074+075) 070 84.401.862 102.055.848
1. Legal reserves 071 67.198.750 83.601.061 2. Reserves for own shares 072 44.815.284 44.815.285 3. Own stocks and shares (deductible items) 073 37.141.295 35.889.621 4. Statutory reserves 074 5. Other reserves 075 9.529.123 9.529.123
IV. REVALUATION RESERVES 076V. FAIR VALUE RESERVES (ADP 078 to 080) 077 273.313 295.257
1. Fair value of financial assets available for sale 078 273.313 295.257 2. Efficient portion of cash flow hedge 079 3. Efficient portion of foreign net investment hedge 080
VI. RETAINED EARNINGS OR LOSS CARRIED FORWARD (ADP 082-083) 081 36.580.064 263.139.338 1. Retained earnings 082 36.580.064 263.139.338 2. Loss carried forward 083
VII. PROFIT OR LOSS FOR THE FINANCIAL YEAR (ADP 085-086) 084 342.313.777 483.622.369 1. Profit for the financial year 085 342.313.777 483.622.369 2. Loss for the financial year 086
VIII. MINORITY INTEREST 087 235.842.123 252.274.665B) PROVISIONS (ADP 089 to 094) 088 49.709.322 49.632.004
1. Provisions for pensions, severance pay and similar libabilities 089 2. Provisions for tax obligations 090 3. Provisions for litigations in progress 091 49.709.322 49.632.004 4. Provisions for renewal of natural resources 092 5. Provision for costs within warranty period 093 6. Other provisions 094
C) NON-CURRENT LIBILITIES (ADP 096 to 106) 095 1.556.069.066 1.898.533.118 1. Liabilites to related parties 096 2. Liabilities for loans, deposits etc of undertakings in a Group 097 3. Liabilities to undertakings with participating interest 098 4. Liabilities for loans, deposits etc of undertakings with participating interest 099 5. Liabilities for loans, deposits and other 100 9.149.000 9.149.000 6. Liabilities to banks and other financial institutions 101 1.488.677.568 1.831.276.762 7. Liabilities for advance payments 102 8. Trade payables 103 9. Amounts payable for securities 104 10. Other non-current liabilities 105 2.044.339 1.903.711 11. Deffered tax 106 56.198.159 56.203.645
D) CURRENT LIABILITIES (ADP 108 to 121) 107 394.111.168 322.065.574 1. Liabilities to undertakings in a Group 108 70.197 2. Liabilities for loans, deposits etc of undertakings in a Group 109 3. Liabilities to undertakings with participating interest 110 4. Liabilities for loans, deposits etc of undertakings with participating interest 111 5. Liabilities for loans, deposits and other 112 103.000 6. Liabilities to banks and other financial institutions 113 180.344.025 45.445.392 7. Amounts payable for prepayment 114 23.380.655 94.191.487 8. Trade payables 115 154.542.693 104.827.447 9. Liabilities upon loan stocks 116 10. Liabilities to emloyees 117 20.674.590 36.497.202 11. Taxes, contributions and similar liabilities 118 11.615.356 37.345.966 12. Liabilities arising from share in the result 119 235.003 232.420 13. Liabilities arising from non-current assets held for sale 120 14. Other current liabilities 121 3.145.649 3.525.660
E) ACCRUED EXPENSES AND DEFERRED INCOME 122 91.807.715 111.535.864F) TOTAL LIABILITIES (ADP 067+088+095+107+122) 123 4.465.334.310 5.158.778.153G) OFF-BALANCE SHEET ITEMS 124 54.631.638 54.572.742
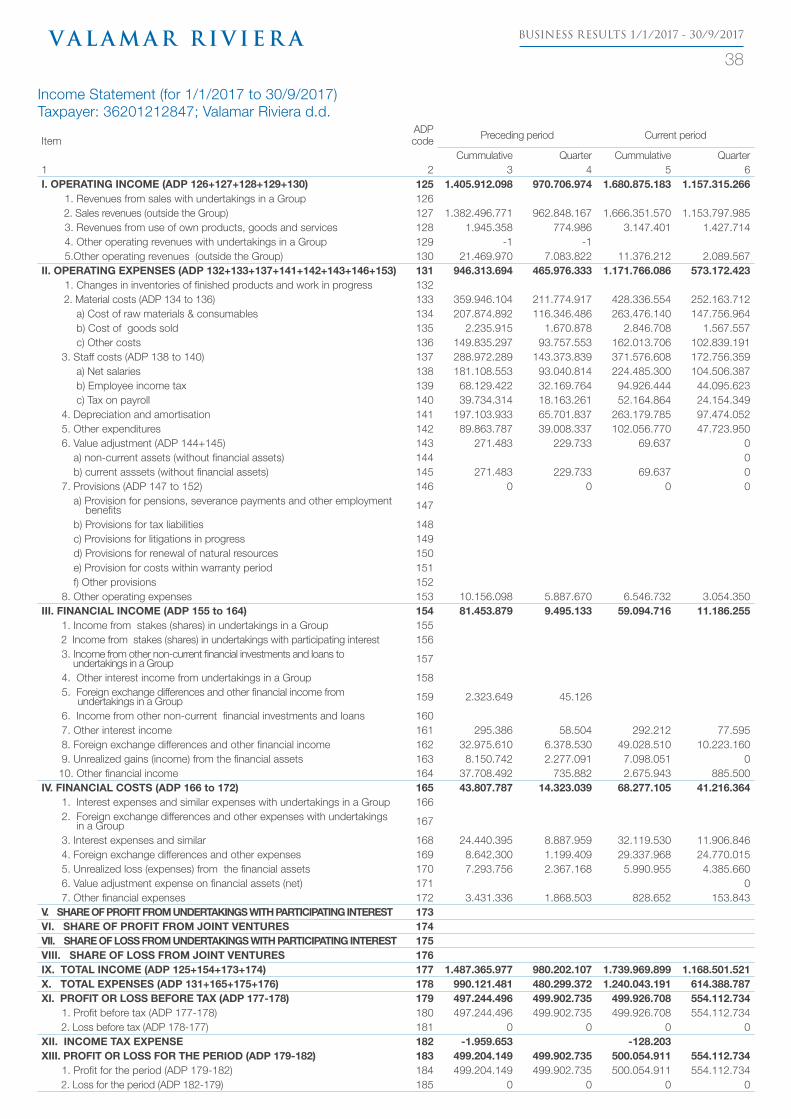
BUSINESS RESULTS 1/1/2017 - 30/9/2017
38
Income Statement (for 1/1/2017 to 30/9/2017)Taxpayer: 36201212847; Valamar Riviera d.d.
ItemADP
code Preceding period Current period
Cummulative Quarter Cummulative Quarter1 2 3 4 5 6I. OPERATING INCOME (ADP 126+127+128+129+130) 125 1.405.912.098 970.706.974 1.680.875.183 1.157.315.266
1. Revenues from sales with undertakings in a Group 126 2. Sales revenues (outside the Group) 127 1.382.496.771 962.848.167 1.666.351.570 1.153.797.985 3. Revenues from use of own products, goods and services 128 1.945.358 774.986 3.147.401 1.427.714 4. Other operating revenues with undertakings in a Group 129 -1 -1 5.Other operating revenues (outside the Group) 130 21.469.970 7.083.822 11.376.212 2.089.567
II. OPERATING EXPENSES (ADP 132+133+137+141+142+143+146+153) 131 946.313.694 465.976.333 1.171.766.086 573.172.423 1. Changes in inventories of finished products and work in progress 132 2. Material costs (ADP 134 to 136) 133 359.946.104 211.774.917 428.336.554 252.163.712 a) Cost of raw materials & consumables 134 207.874.892 116.346.486 263.476.140 147.756.964 b) Cost of goods sold 135 2.235.915 1.670.878 2.846.708 1.567.557 c) Other costs 136 149.835.297 93.757.553 162.013.706 102.839.191 3. Staff costs (ADP 138 to 140) 137 288.972.289 143.373.839 371.576.608 172.756.359 a) Net salaries 138 181.108.553 93.040.814 224.485.300 104.506.387 b) Employee income tax 139 68.129.422 32.169.764 94.926.444 44.095.623 c) Tax on payroll 140 39.734.314 18.163.261 52.164.864 24.154.349 4. Depreciation and amortisation 141 197.103.933 65.701.837 263.179.785 97.474.052 5. Other expenditures 142 89.863.787 39.008.337 102.056.770 47.723.950 6. Value adjustment (ADP 144+145) 143 271.483 229.733 69.637 0 a) non-current assets (without financial assets) 144 0 b) current asssets (without financial assets) 145 271.483 229.733 69.637 0 7. Provisions (ADP 147 to 152) 146 0 0 0 0 a) Provision for pensions, severance payments and other employment benefits 147
b) Provisions for tax liabilities 148 c) Provisions for litigations in progress 149 d) Provisions for renewal of natural resources 150 e) Provision for costs within warranty period 151 f) Other provisions 152 8. Other operating expenses 153 10.156.098 5.887.670 6.546.732 3.054.350
III. FINANCIAL INCOME (ADP 155 to 164) 154 81.453.879 9.495.133 59.094.716 11.186.255 1. Income from stakes (shares) in undertakings in a Group 155 2 Income from stakes (shares) in undertakings with participating interest 156 3. Income from other non-current financial investments and loans to undertakings in a Group 157
4. Other interest income from undertakings in a Group 158 5. Foreign exchange differences and other financial income from undertakings in a Group 159 2.323.649 45.126
6. Income from other non-current financial investments and loans 160 7. Other interest income 161 295.386 58.504 292.212 77.595 8. Foreign exchange differences and other financial income 162 32.975.610 6.378.530 49.028.510 10.223.160 9. Unrealized gains (income) from the financial assets 163 8.150.742 2.277.091 7.098.051 0 10. Other financial income 164 37.708.492 735.882 2.675.943 885.500
IV. FINANCIAL COSTS (ADP 166 to 172) 165 43.807.787 14.323.039 68.277.105 41.216.364 1. Interest expenses and similar expenses with undertakings in a Group 166 2. Foreign exchange differences and other expenses with undertakings in a Group 167
3. Interest expenses and similar 168 24.440.395 8.887.959 32.119.530 11.906.846 4. Foreign exchange differences and other expenses 169 8.642.300 1.199.409 29.337.968 24.770.015 5. Unrealized loss (expenses) from the financial assets 170 7.293.756 2.367.168 5.990.955 4.385.660 6. Value adjustment expense on financial assets (net) 171 0 7. Other financial expenses 172 3.431.336 1.868.503 828.652 153.843
V. SHARE OF PROFIT FROM UNDERTAKINGS WITH PARTICIPATING INTEREST 173VI. SHARE OF PROFIT FROM JOINT VENTURES 174VII. SHARE OF LOSS FROM UNDERTAKINGS WITH PARTICIPATING INTEREST 175VIII. SHARE OF LOSS FROM JOINT VENTURES 176IX. TOTAL INCOME (ADP 125+154+173+174) 177 1.487.365.977 980.202.107 1.739.969.899 1.168.501.521X. TOTAL EXPENSES (ADP 131+165+175+176) 178 990.121.481 480.299.372 1.240.043.191 614.388.787XI. PROFIT OR LOSS BEFORE TAX (ADP 177-178) 179 497.244.496 499.902.735 499.926.708 554.112.734
1. Profit before tax (ADP 177-178) 180 497.244.496 499.902.735 499.926.708 554.112.734 2. Loss before tax (ADP 178-177) 181 0 0 0 0
XII. INCOME TAX EXPENSE 182 -1.959.653 -128.203XIII. PROFIT OR LOSS FOR THE PERIOD (ADP 179-182) 183 499.204.149 499.902.735 500.054.911 554.112.734
1. Profit for the period (ADP 179-182) 184 499.204.149 499.902.735 500.054.911 554.112.734 2. Loss for the period (ADP 182-179) 185 0 0 0 0
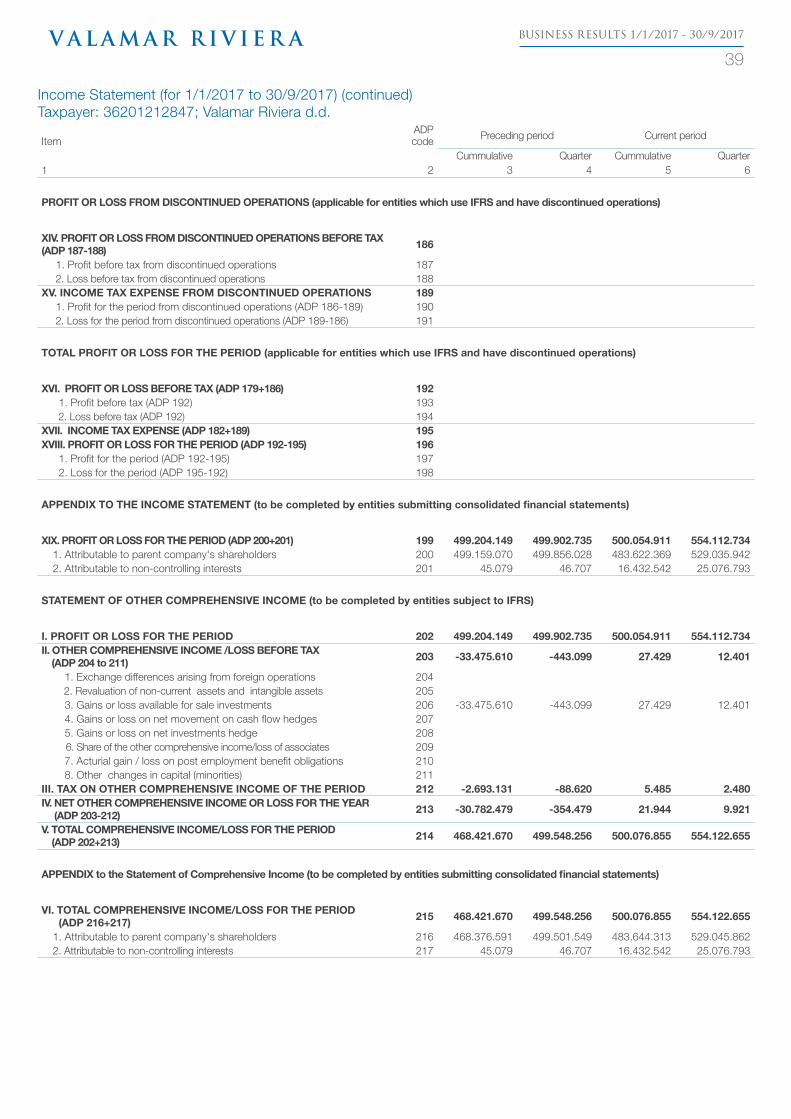
BUSINESS RESULTS 1/1/2017 - 30/9/2017
39
Income Statement (for 1/1/2017 to 30/9/2017) (continued)Taxpayer: 36201212847; Valamar Riviera d.d.
ItemADP
code Preceding period Current period
Cummulative Quarter Cummulative Quarter1 2 3 4 5 6
PROFIT OR LOSS FROM DISCONTINUED OPERATIONS (applicable for entities which use IFRS and have discontinued operations)
XIV. PROFIT OR LOSS FROM DISCONTINUED OPERATIONS BEFORE TAX (ADP 187-188) 186
1. Profit before tax from discontinued operations 187 2. Loss before tax from discontinued operations 188
XV. INCOME TAX EXPENSE FROM DISCONTINUED OPERATIONS 189 1. Profit for the period from discontinued operations (ADP 186-189) 190 2. Loss for the period from discontinued operations (ADP 189-186) 191
TOTAL PROFIT OR LOSS FOR THE PERIOD (applicable for entities which use IFRS and have discontinued operations)
XVI. PROFIT OR LOSS BEFORE TAX (ADP 179+186) 192 1. Profit before tax (ADP 192) 193 2. Loss before tax (ADP 192) 194
XVII. INCOME TAX EXPENSE (ADP 182+189) 195XVIII. PROFIT OR LOSS FOR THE PERIOD (ADP 192-195) 196
1. Profit for the period (ADP 192-195) 197 2. Loss for the period (ADP 195-192) 198
APPENDIX TO THE INCOME STATEMENT (to be completed by entities submitting consolidated financial statements)
XIX. PROFIT OR LOSS FOR THE PERIOD (ADP 200+201) 199 499.204.149 499.902.735 500.054.911 554.112.7341. Attributable to parent company's shareholders 200 499.159.070 499.856.028 483.622.369 529.035.9422. Attributable to non-controlling interests 201 45.079 46.707 16.432.542 25.076.793
STATEMENT OF OTHER COMPREHENSIVE INCOME (to be completed by entities subject to IFRS)
I. PROFIT OR LOSS FOR THE PERIOD 202 499.204.149 499.902.735 500.054.911 554.112.734II. OTHER COMPREHENSIVE INCOME /LOSS BEFORE TAX (ADP 204 to 211) 203 -33.475.610 -443.099 27.429 12.401
1. Exchange differences arising from foreign operations 204 2. Revaluation of non-current assets and intangible assets 205 3. Gains or loss available for sale investments 206 -33.475.610 -443.099 27.429 12.401 4. Gains or loss on net movement on cash flow hedges 207 5. Gains or loss on net investments hedge 208 6. Share of the other comprehensive income/loss of associates 209 7. Acturial gain / loss on post employment benefit obligations 210 8. Other changes in capital (minorities) 211
III. TAX ON OTHER COMPREHENSIVE INCOME OF THE PERIOD 212 -2.693.131 -88.620 5.485 2.480IV. NET OTHER COMPREHENSIVE INCOME OR LOSS FOR THE YEAR (ADP 203-212) 213 -30.782.479 -354.479 21.944 9.921
V. TOTAL COMPREHENSIVE INCOME/LOSS FOR THE PERIOD (ADP 202+213) 214 468.421.670 499.548.256 500.076.855 554.122.655
APPENDIX to the Statement of Comprehensive Income (to be completed by entities submitting consolidated financial statements)
VI. TOTAL COMPREHENSIVE INCOME/LOSS FOR THE PERIOD (ADP 216+217) 215 468.421.670 499.548.256 500.076.855 554.122.655
1. Attributable to parent company's shareholders 216 468.376.591 499.501.549 483.644.313 529.045.8622. Attributable to non-controlling interests 217 45.079 46.707 16.432.542 25.076.793

BUSINESS RESULTS 1/1/2017 - 30/9/2017
40
Cash Flow Statement - Indirect Method (for 1/1/2017 to 30/9/2017)Taxpayer: 36201212847; Valamar Riviera d.d.
ItemADP
codePreceding
yearCurrent
year1 2 3 4
CASH FLOW FROM OPERATING ACTIVITIES 1. Profit before taxes 001 497.244.496 499.926.7082. Adjustments (ADP 003 to 010) 002 161.333.291 276.238.216 a) Depreciation and amortisation 003 197.103.933 263.179.785 b) Profit and loss from sales and value adjustments of non-current tangible and intangible assets 004 -633.182 -1.726.874 c) Profit and loss from sales and unrealised profit and loss and value adjustments of financial assets 005 -34.246.385 5.427.318 d) Income from interest and dividends 006 -3.125.059 -3.240.918 e) Interest expenses 007 24.440.395 32.119.530 f) Provisions 008 -87.186 -36.231 g) Foreign exchange differences (unrealized) 009 -21.262.238 -18.377.298 h) Other adjustments for non-cash transactions and unrealized profit and loss 010 -856.987 -1.107.096
I. Increase or decrease of cash flow before changes in working capital (ADP 001+002) 011 658.577.787 776.164.9243. Changes in working capital (ADP 013 to 016) 012 -9.115.162 -142.234.931 a) Increase or decrease of current liabilities 013 87.973.011 4.143.408 b) Increase or decrease of current receivables 014 -90.167.939 -110.063.486 c) Increase or decrease of inventories 015 -1.968.376 905.889 d) Other increase or decrease of working capital 016 -4.951.858 -37.220.742
II. Cash from operating activities (ADP 011+012) 017 649.462.625 633.929.9934. Interest 018 -25.479.208 -32.119.5305. Income tax paid 019 352.212 -2.205.551
A) NET CASH FLOW FROM OPERATING ACTIVITIES (ADP 017 to 019) 020 624.335.629 599.604.912CASH FLOW FROM INVESTMENT ACTIVITIES
1. Proceeds from sale of non-current assets 021 633.182 1.726.8742. Proceeds from selling financial instruments 022 39.876.233 1.808.3033. Proceeds from interest rates 023 295.386 292.2124. Proceeds from dividends 0245. Proceeds from repayment of given loans and savings 025 40.847.730 9.822.3866. Other proceeds from investment activities 026 1.650.145
III. Total cash proceeds from investment activities (ADP 021 to 026) 027 81.652.531 15.299.9201. Purchase of non-current tangible and intangible assets 028 -243.594.982 -708.412.5162. Purchase of financial instruments 029 -187.6943. Loans and deposits for the period 030 -13.576.377 -8.508.7564. Acquisition of subsidiary, net of acquired cash 0315. Other payments from investment activities 032 -1.870.439
IV. Total cash payments from investment activities (ADP 028 to 032) 033 -259.041.798 -717.108.966B) NET INCREASE OF CASH FLOW FROM INVESTMENT ACTIVITIES (ADP 027+033) 034 -177.389.267 -701.809.046CASH FLOW FROM FINANCIAL ACTIVITIES
1. Proceeds from increase of subscribed capital 0352. Proceeds from issuing equity-based and debt-based financial instruments 036 1.640.0523. Proceeds from loan principal, loans and other borrowings 037 83.643.840 351.154.1054. Other proceeds from financial activities 038 21.943
V. Total proceeds from financial activities (ADP 035 to 038) 039 83.643.840 352.816.1001. Repayment of loan principals, loans and other borrowings and debt-based financial instruments
040 -92.351.124 -67.007.822
2. Dividends paid 041 -37.330.521 -98.342.3543. Payment of finance lease liabilities 042 -154.766
4. Re-purchase of treasury shares and decrease in subscribed share capital 043 -35.692.6435. Other payments from financial activities 044 -30.540.164
VI. Total cash payments from financing activities (ADP 040 to 044) 045 -195.914.452 -165.504.942C) NET CASH FLOW FROM FINANCIAL ACTIVITIES (ADP 039+045) 046 -112.270.612 187.311.158
1. Cash and cash equivalents-unrealized foreign exchange differences 047D) NET INCREASE OR DECREASE OF CASH FLOW (ADP 020+034+046+047) 048 334.675.750 85.107.024E) CASH AND CASH EQUIVALENTS AT THE BEGINNING OF PERIOD 049 318.755.282 274.650.648F) CASH AND CASH EQUIVALENTS AT THE END OF PERIOD (ADP 048+049) 050 653.431.032 359.757.672
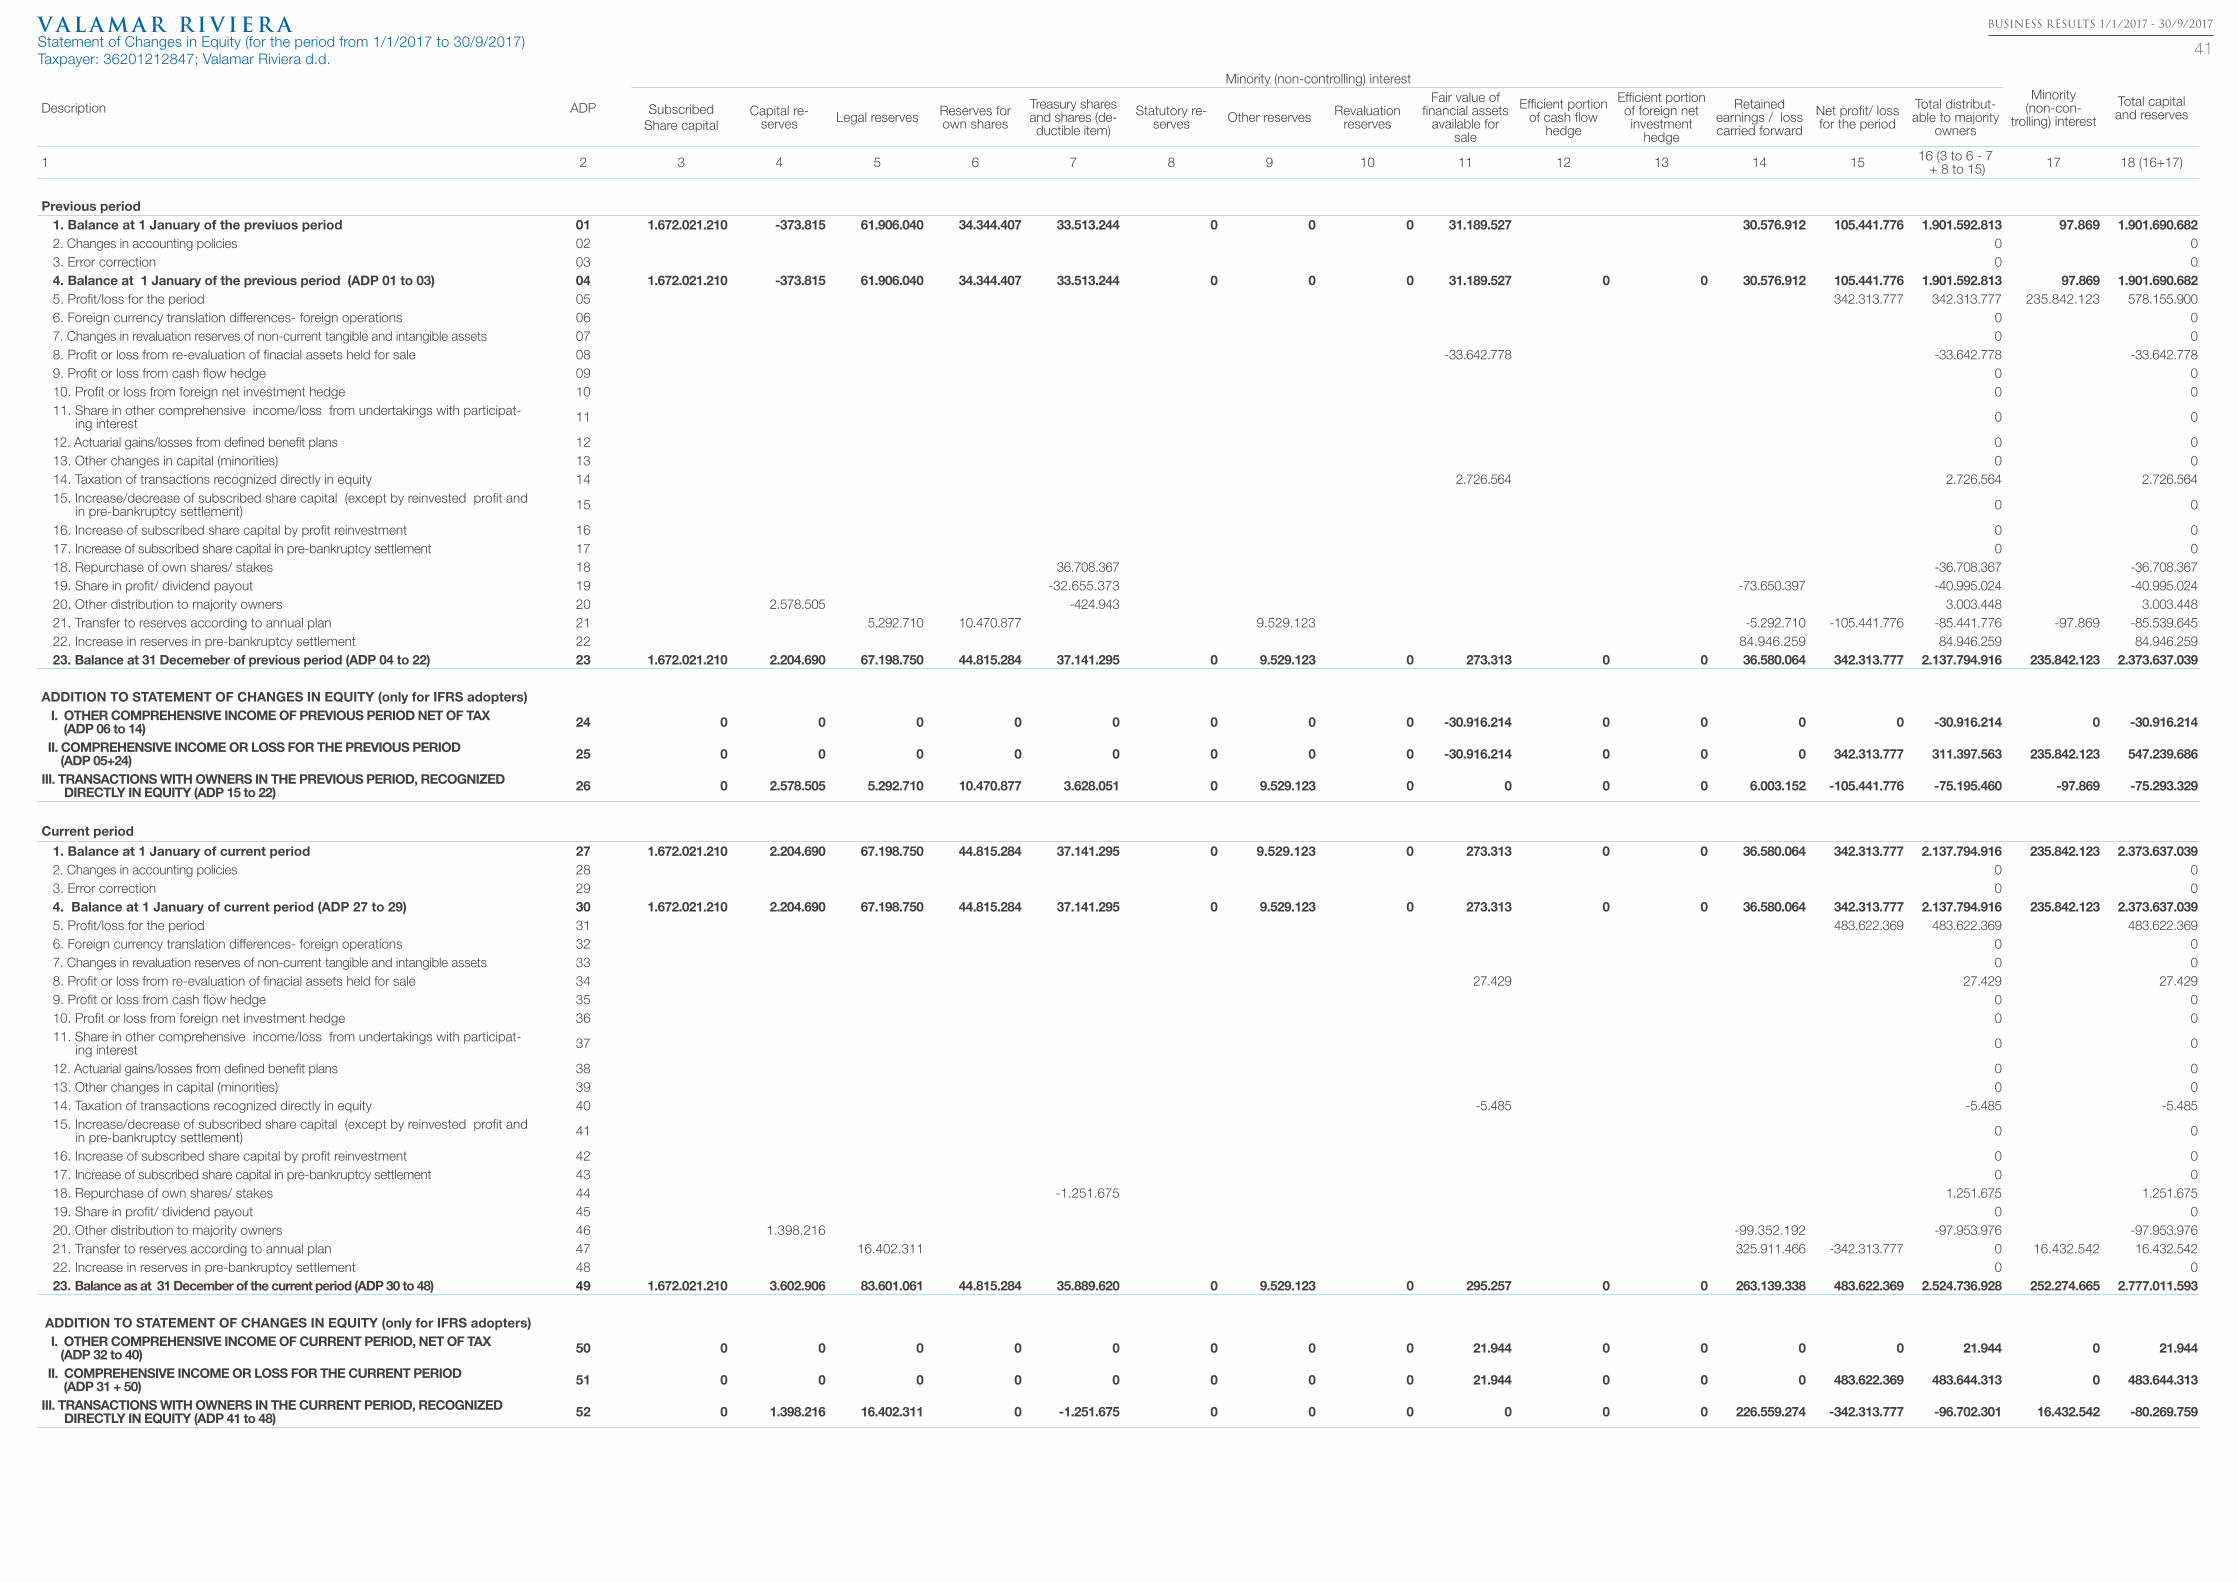
BUSINESS RESULTS 1/1/2017 - 30/9/2017
41Statement of Changes in Equity (for the period from 1/1/2017 to 30/9/2017)Taxpayer: 36201212847; Valamar Riviera d.d.
Description ADP
Minority (non-controlling) interestMinority
(non-con-trolling) interest
Total capital and reservesSubscribed
Share capitalCapital re-
serves Legal reserves Reserves for own shares
Treasury shares and shares (de-ductible item)
Statutory re-serves Other reserves Revaluation
reserves
Fair value of financial assets
available for sale
Efficient portion of cash flow
hedge
Efficient portion of foreign net investment
hedge
Retained earnings / loss carried forward
Net profit/ loss for the period
Total distribut-able to majority
owners
1 2 3 4 5 6 7 8 9 10 11 12 13 14 15 16 (3 to 6 - 7 + 8 to 15) 17 18 (16+17)
Previous period 1. Balance at 1 January of the previuos period 01 1.672.021.210 -373.815 61.906.040 34.344.407 33.513.244 0 0 0 31.189.527 30.576.912 105.441.776 1.901.592.813 97.869 1.901.690.6822. Changes in accounting policies 02 0 03. Error correction 03 0 04. Balance at 1 January of the previous period (ADP 01 to 03) 04 1.672.021.210 -373.815 61.906.040 34.344.407 33.513.244 0 0 0 31.189.527 0 0 30.576.912 105.441.776 1.901.592.813 97.869 1.901.690.6825. Profit/loss for the period 05 342.313.777 342.313.777 235.842.123 578.155.9006. Foreign currency translation differences- foreign operations 06 0 07. Changes in revaluation reserves of non-current tangible and intangible assets 07 0 08. Profit or loss from re-evaluation of finacial assets held for sale 08 -33.642.778 -33.642.778 -33.642.7789. Profit or loss from cash flow hedge 09 0 010. Profit or loss from foreign net investment hedge 10 0 011. Share in other comprehensive income/loss from undertakings with participat-
ing interest 11 0 0
12. Actuarial gains/losses from defined benefit plans 12 0 013. Other changes in capital (minorities) 13 0 014. Taxation of transactions recognized directly in equity 14 2.726.564 2.726.564 2.726.56415. Increase/decrease of subscribed share capital (except by reinvested profit and
in pre-bankruptcy settlement) 15 0 0
16. Increase of subscribed share capital by profit reinvestment 16 0 017. Increase of subscribed share capital in pre-bankruptcy settlement 17 0 018. Repurchase of own shares/ stakes 18 36.708.367 -36.708.367 -36.708.36719. Share in profit/ dividend payout 19 -32.655.373 -73.650.397 -40.995.024 -40.995.02420. Other distribution to majority owners 20 2.578.505 -424.943 3.003.448 3.003.44821. Transfer to reserves according to annual plan 21 5.292.710 10.470.877 9.529.123 -5.292.710 -105.441.776 -85.441.776 -97.869 -85.539.64522. Increase in reserves in pre-bankruptcy settlement 22 84.946.259 84.946.259 84.946.25923. Balance at 31 Decemeber of previous period (ADP 04 to 22) 23 1.672.021.210 2.204.690 67.198.750 44.815.284 37.141.295 0 9.529.123 0 273.313 0 0 36.580.064 342.313.777 2.137.794.916 235.842.123 2.373.637.039
ADDITION TO STATEMENT OF CHANGES IN EQUITY (only for IFRS adopters) I. OTHER COMPREHENSIVE INCOME OF PREVIOUS PERIOD NET OF TAX (ADP 06 to 14) 24 0 0 0 0 0 0 0 0 -30.916.214 0 0 0 0 -30.916.214 0 -30.916.214
II. COMPREHENSIVE INCOME OR LOSS FOR THE PREVIOUS PERIOD (ADP 05+24) 25 0 0 0 0 0 0 0 0 -30.916.214 0 0 0 342.313.777 311.397.563 235.842.123 547.239.686
III. TRANSACTIONS WITH OWNERS IN THE PREVIOUS PERIOD, RECOGNIZED DIRECTLY IN EQUITY (ADP 15 to 22) 26 0 2.578.505 5.292.710 10.470.877 3.628.051 0 9.529.123 0 0 0 0 6.003.152 -105.441.776 -75.195.460 -97.869 -75.293.329
Current period
1. Balance at 1 January of current period 27 1.672.021.210 2.204.690 67.198.750 44.815.284 37.141.295 0 9.529.123 0 273.313 0 0 36.580.064 342.313.777 2.137.794.916 235.842.123 2.373.637.0392. Changes in accounting policies 28 0 03. Error correction 29 0 04. Balance at 1 January of current period (ADP 27 to 29) 30 1.672.021.210 2.204.690 67.198.750 44.815.284 37.141.295 0 9.529.123 0 273.313 0 0 36.580.064 342.313.777 2.137.794.916 235.842.123 2.373.637.0395. Profit/loss for the period 31 483.622.369 483.622.369 483.622.3696. Foreign currency translation differences- foreign operations 32 0 07. Changes in revaluation reserves of non-current tangible and intangible assets 33 0 08. Profit or loss from re-evaluation of finacial assets held for sale 34 27.429 27.429 27.4299. Profit or loss from cash flow hedge 35 0 010. Profit or loss from foreign net investment hedge 36 0 011. Share in other comprehensive income/loss from undertakings with participat-
ing interest 37 0 0
12. Actuarial gains/losses from defined benefit plans 38 0 013. Other changes in capital (minorities) 39 0 014. Taxation of transactions recognized directly in equity 40 -5.485 -5.485 -5.48515. Increase/decrease of subscribed share capital (except by reinvested profit and
in pre-bankruptcy settlement) 41 0 0
16. Increase of subscribed share capital by profit reinvestment 42 0 017. Increase of subscribed share capital in pre-bankruptcy settlement 43 0 018. Repurchase of own shares/ stakes 44 -1.251.675 1.251.675 1.251.67519. Share in profit/ dividend payout 45 0 020. Other distribution to majority owners 46 1.398.216 -99.352.192 -97.953.976 -97.953.97621. Transfer to reserves according to annual plan 47 16.402.311 325.911.466 -342.313.777 0 16.432.542 16.432.54222. Increase in reserves in pre-bankruptcy settlement 48 0 023. Balance as at 31 December of the current period (ADP 30 to 48) 49 1.672.021.210 3.602.906 83.601.061 44.815.284 35.889.620 0 9.529.123 0 295.257 0 0 263.139.338 483.622.369 2.524.736.928 252.274.665 2.777.011.593
ADDITION TO STATEMENT OF CHANGES IN EQUITY (only for IFRS adopters) I. OTHER COMPREHENSIVE INCOME OF CURRENT PERIOD, NET OF TAX (ADP 32 to 40) 50 0 0 0 0 0 0 0 0 21.944 0 0 0 0 21.944 0 21.944
II. COMPREHENSIVE INCOME OR LOSS FOR THE CURRENT PERIOD (ADP 31 + 50) 51 0 0 0 0 0 0 0 0 21.944 0 0 0 483.622.369 483.644.313 0 483.644.313
III. TRANSACTIONS WITH OWNERS IN THE CURRENT PERIOD, RECOGNIZED DIRECTLY IN EQUITY (ADP 41 to 48) 52 0 1.398.216 16.402.311 0 -1.251.675 0 0 0 0 0 0 226.559.274 -342.313.777 -96.702.301 16.432.542 -80.269.759

BUSINESS RESULTS 1/1/2017 - 30/9/2017
42
Notes
(1) The notes to financial statements include additional and supplemental information not presented in the Balance Sheet, Income Statement, Cash Flow Statement or the Statement of Changes in Equity in accordance with the provisions of the relevant financial reporting standards. Companies of the consolidation subject Balance sheet-previous period Balance sheet-current period
31/12/2016 30/9/2017
Mirta Bašćanska d.o.o. Yes (merged to Hoteli Baška d.d. 13/1/2016)Vala Bašćanska d.o.o. Yes (merged to Hoteli Baška d.d. 13/1/2016)Baškaturist d.o.o. Yes (merged to Hoteli Baška d.d. 13/1/2016)Hoteli Baška d.d. Yes (merged to Valamar Riviera d.d. 31/3/2016)Bastion upravljanje d.o.o. Yes (merged to Valamar Riviera d.d. 30/6/2016)Puntižela d.o.o. Yes (merged to Valamar Riviera d.d. 31/3/2017)Valamar hotels & resorts GmbH Yes No
Elafiti Babin kuk d.o.o. Yes YesMagične stijene d.o.o. Yes YesPalme turizam d.o.o. Yes YesPogača Babin Kuk d.o.o. Yes YesBugenvilia d.o.o. Yes YesImperial d.d. Yes Yes
Companies of the consolidation subject: Income statment-previous period Income statment-current period
30/9/2016 30/9/2017
Mirta Bašćanska d.o.o. 1/1 - 13/1 (merged to Hoteli Baška d.d. 13/1/2016)
-
Vala Bašćanska d.o.o. 1/1 - 13/1 (merged to Hoteli Baška d.d. 13/1/2016)
-
Baškaturist d.o.o. 1/1 - 13/1 (merged to Hoteli Baška d.d. 13/1/2016)
-
Hoteli Baška d.d. 1/1 - 31/3 (merged to Valamar Riviera d.d. 31/3/2016)
-
Bastion upravljanje d.o.o. 1/1 - 30/6(merged to Valamar Riviera d.d. 30/6/2016)
-
Puntižela d.o.o.1/1 - 30/9
1/1 - 31/3(merged to Valamar Riviera d.d. 31/3/2017)
Valamar hotels & resorts GmbH - -Elafiti Babin kuk d.o.o. 1/1 - 30/9 1/1 - 30/9Magične stijene d.o.o. 1/1 - 30/9 1/1 - 30/9Palme turizam d.o.o. 1/1 - 30/9 1/1 - 30/9Pogača Babin Kuk d.o.o. 1/1 - 30/9 1/1 - 30/9Bugenvilia d.o.o. 1/1 - 30/9 1/1 - 30/9Imperial d.d. - 1/1 - 30/9

BUSINESS RESULTS 1/1/2017 - 30/9/2017
43
Reporting period: from 1/1/2017 to 30/9/2017
Quarterly financial report TFI-POD
Tax number (MB): 3474771Company registration number (MBS): 040020883Personal identification number (OIB): 36201212847
Issuing company: Valamar Riviera d.d.
Postal code and place 52440 Poreč
Street and house number: Stancija Kaligari 1
E-mail address: [email protected]
Internet address: www.valamar-riviera.com
Municipality/city code and name: 348 Poreč
County code and name: 18 Istarska
Number of employees:(period end) 4.618
NKD code: 5510
Consolidated report: NOCompanies of the consolidation subject (according to IFRS): Seat: MB:
Accounting firm:
Contact person: Sopta Anka(please insert only the contact’s full name)
Telephone: 052/408 188 Fax: 052/408 110
E-mail address: [email protected]
Family name and name: Kukurin Željko, Čižmek Marko(authorized representative)
Documents disclosed:
1. Financial statements (Balance Sheet, Income Statement, Cash Flow Statement, Statement of Changes in Equity and notes to financial statements)
2. Management Interim Report;
3. Declaration of the persons responsible for preparing the issuer's statements;
L.S. (authorized representative's signature)
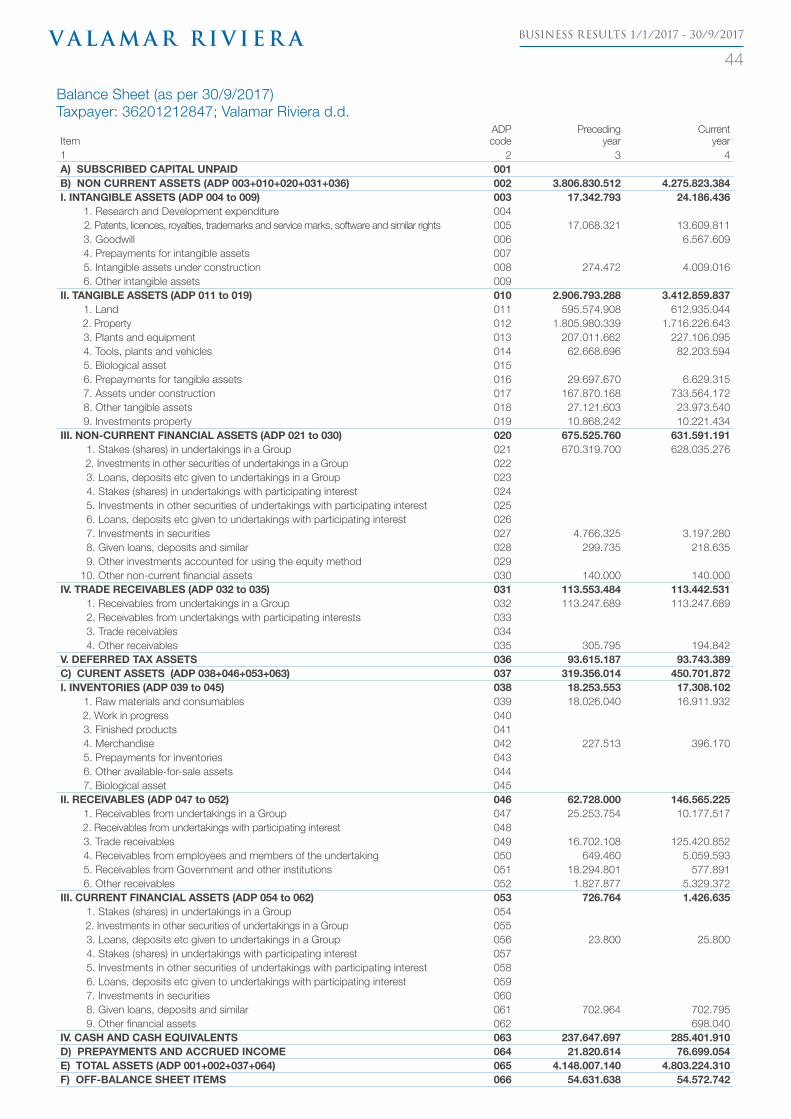
BUSINESS RESULTS 1/1/2017 - 30/9/2017
44
Balance Sheet (as per 30/9/2017)Taxpayer: 36201212847; Valamar Riviera d.d.
ItemADP
codePreceding
yearCurrent
year1 2 3 4A) SUBSCRIBED CAPITAL UNPAID 001B) NON CURRENT ASSETS (ADP 003+010+020+031+036) 002 3.806.830.512 4.275.823.384I. INTANGIBLE ASSETS (ADP 004 to 009) 003 17.342.793 24.186.436
1. Research and Development expenditure 004 2. Patents, licences, royalties, trademarks and service marks, software and similar rights 005 17.068.321 13.609.811 3. Goodwill 006 6.567.609 4. Prepayments for intangible assets 007 5. Intangible assets under construction 008 274.472 4.009.016 6. Other intangible assets 009
II. TANGIBLE ASSETS (ADP 011 to 019) 010 2.906.793.288 3.412.859.837 1. Land 011 595.574.908 612.935.044 2. Property 012 1.805.980.339 1.716.226.643 3. Plants and equipment 013 207.011.662 227.106.095 4. Tools, plants and vehicles 014 62.668.696 82.203.594 5. Biological asset 015 6. Prepayments for tangible assets 016 29.697.670 6.629.315 7. Assets under construction 017 167.870.168 733.564.172 8. Other tangible assets 018 27.121.603 23.973.540 9. Investments property 019 10.868.242 10.221.434
III. NON-CURRENT FINANCIAL ASSETS (ADP 021 to 030) 020 675.525.760 631.591.191 1. Stakes (shares) in undertakings in a Group 021 670.319.700 628.035.276 2. Investments in other securities of undertakings in a Group 022 3. Loans, deposits etc given to undertakings in a Group 023 4. Stakes (shares) in undertakings with participating interest 024 5. Investments in other securities of undertakings with participating interest 025 6. Loans, deposits etc given to undertakings with participating interest 026 7. Investments in securities 027 4.766.325 3.197.280 8. Given loans, deposits and similar 028 299.735 218.635 9. Other investments accounted for using the equity method 029 10. Other non-current financial assets 030 140.000 140.000
IV. TRADE RECEIVABLES (ADP 032 to 035) 031 113.553.484 113.442.531 1. Receivables from undertakings in a Group 032 113.247.689 113.247.689 2. Receivables from undertakings with participating interests 033 3. Trade receivables 034 4. Other receivables 035 305.795 194.842
V. DEFERRED TAX ASSETS 036 93.615.187 93.743.389C) CURENT ASSETS (ADP 038+046+053+063) 037 319.356.014 450.701.872I. INVENTORIES (ADP 039 to 045) 038 18.253.553 17.308.102
1. Raw materials and consumables 039 18.026.040 16.911.932 2. Work in progress 040 3. Finished products 041 4. Merchandise 042 227.513 396.170 5. Prepayments for inventories 043 6. Other available-for-sale assets 044 7. Biological asset 045
II. RECEIVABLES (ADP 047 to 052) 046 62.728.000 146.565.225 1. Receivables from undertakings in a Group 047 25.253.754 10.177.517 2. Receivables from undertakings with participating interest 048 3. Trade receivables 049 16.702.108 125.420.852 4. Receivables from employees and members of the undertaking 050 649.460 5.059.593 5. Receivables from Government and other institutions 051 18.294.801 577.891 6. Other receivables 052 1.827.877 5.329.372
III. CURRENT FINANCIAL ASSETS (ADP 054 to 062) 053 726.764 1.426.635 1. Stakes (shares) in undertakings in a Group 054 2. Investments in other securities of undertakings in a Group 055 3. Loans, deposits etc given to undertakings in a Group 056 23.800 25.800 4. Stakes (shares) in undertakings with participating interest 057 5. Investments in other securities of undertakings with participating interest 058 6. Loans, deposits etc given to undertakings with participating interest 059 7. Investments in securities 060 8. Given loans, deposits and similar 061 702.964 702.795 9. Other financial assets 062 698.040
IV. CASH AND CASH EQUIVALENTS 063 237.647.697 285.401.910D) PREPAYMENTS AND ACCRUED INCOME 064 21.820.614 76.699.054E) TOTAL ASSETS (ADP 001+002+037+064) 065 4.148.007.140 4.803.224.310F) OFF-BALANCE SHEET ITEMS 066 54.631.638 54.572.742
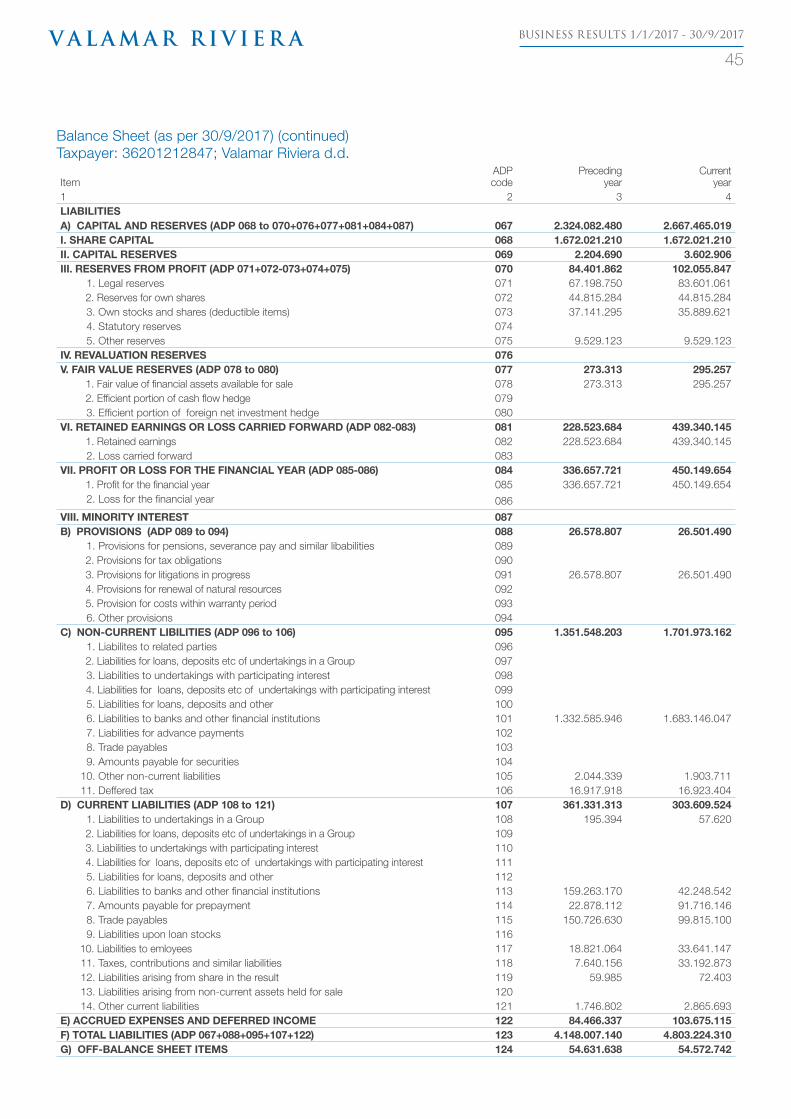
BUSINESS RESULTS 1/1/2017 - 30/9/2017
45
Balance Sheet (as per 30/9/2017) (continued)Taxpayer: 36201212847; Valamar Riviera d.d.
ItemADP
codePreceding
yearCurrent
year1 2 3 4LIABILITIESA) CAPITAL AND RESERVES (ADP 068 to 070+076+077+081+084+087) 067 2.324.082.480 2.667.465.019I. SHARE CAPITAL 068 1.672.021.210 1.672.021.210II. CAPITAL RESERVES 069 2.204.690 3.602.906III. RESERVES FROM PROFIT (ADP 071+072-073+074+075) 070 84.401.862 102.055.847
1. Legal reserves 071 67.198.750 83.601.061 2. Reserves for own shares 072 44.815.284 44.815.284 3. Own stocks and shares (deductible items) 073 37.141.295 35.889.621 4. Statutory reserves 074 5. Other reserves 075 9.529.123 9.529.123
IV. REVALUATION RESERVES 076V. FAIR VALUE RESERVES (ADP 078 to 080) 077 273.313 295.257
1. Fair value of financial assets available for sale 078 273.313 295.257 2. Efficient portion of cash flow hedge 079 3. Efficient portion of foreign net investment hedge 080
VI. RETAINED EARNINGS OR LOSS CARRIED FORWARD (ADP 082-083) 081 228.523.684 439.340.145 1. Retained earnings 082 228.523.684 439.340.145 2. Loss carried forward 083
VII. PROFIT OR LOSS FOR THE FINANCIAL YEAR (ADP 085-086) 084 336.657.721 450.149.654 1. Profit for the financial year 085 336.657.721 450.149.654 2. Loss for the financial year 086
VIII. MINORITY INTEREST 087B) PROVISIONS (ADP 089 to 094) 088 26.578.807 26.501.490
1. Provisions for pensions, severance pay and similar libabilities 089 2. Provisions for tax obligations 090 3. Provisions for litigations in progress 091 26.578.807 26.501.490 4. Provisions for renewal of natural resources 092 5. Provision for costs within warranty period 093 6. Other provisions 094
C) NON-CURRENT LIBILITIES (ADP 096 to 106) 095 1.351.548.203 1.701.973.162 1. Liabilites to related parties 096 2. Liabilities for loans, deposits etc of undertakings in a Group 097 3. Liabilities to undertakings with participating interest 098 4. Liabilities for loans, deposits etc of undertakings with participating interest 099 5. Liabilities for loans, deposits and other 100 6. Liabilities to banks and other financial institutions 101 1.332.585.946 1.683.146.047 7. Liabilities for advance payments 102 8. Trade payables 103 9. Amounts payable for securities 104 10. Other non-current liabilities 105 2.044.339 1.903.711 11. Deffered tax 106 16.917.918 16.923.404
D) CURRENT LIABILITIES (ADP 108 to 121) 107 361.331.313 303.609.524 1. Liabilities to undertakings in a Group 108 195.394 57.620 2. Liabilities for loans, deposits etc of undertakings in a Group 109 3. Liabilities to undertakings with participating interest 110 4. Liabilities for loans, deposits etc of undertakings with participating interest 111 5. Liabilities for loans, deposits and other 112 6. Liabilities to banks and other financial institutions 113 159.263.170 42.248.542 7. Amounts payable for prepayment 114 22.878.112 91.716.146 8. Trade payables 115 150.726.630 99.815.100 9. Liabilities upon loan stocks 116 10. Liabilities to emloyees 117 18.821.064 33.641.147 11. Taxes, contributions and similar liabilities 118 7.640.156 33.192.873 12. Liabilities arising from share in the result 119 59.985 72.403 13. Liabilities arising from non-current assets held for sale 120 14. Other current liabilities 121 1.746.802 2.865.693
E) ACCRUED EXPENSES AND DEFERRED INCOME 122 84.466.337 103.675.115F) TOTAL LIABILITIES (ADP 067+088+095+107+122) 123 4.148.007.140 4.803.224.310G) OFF-BALANCE SHEET ITEMS 124 54.631.638 54.572.742
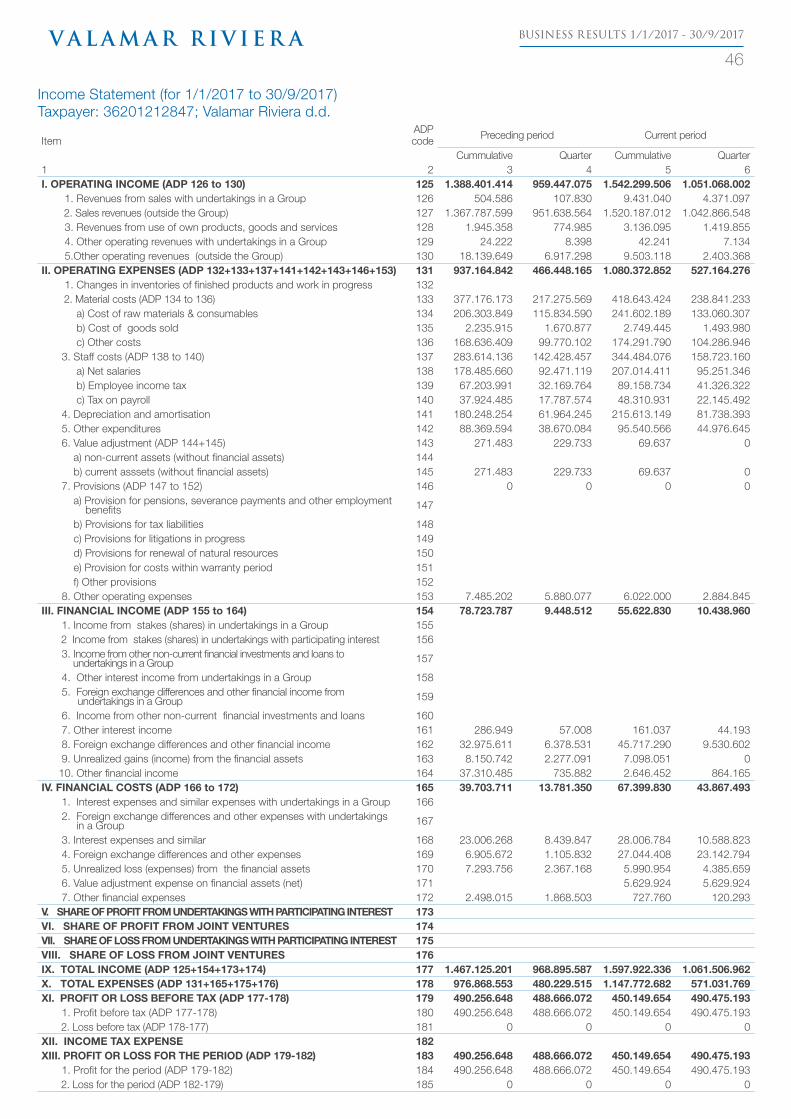
BUSINESS RESULTS 1/1/2017 - 30/9/2017
46
Income Statement (for 1/1/2017 to 30/9/2017)Taxpayer: 36201212847; Valamar Riviera d.d.
ItemADP
code Preceding period Current period
Cummulative Quarter Cummulative Quarter1 2 3 4 5 6I. OPERATING INCOME (ADP 126 to 130) 125 1.388.401.414 959.447.075 1.542.299.506 1.051.068.002
1. Revenues from sales with undertakings in a Group 126 504.586 107.830 9.431.040 4.371.097 2. Sales revenues (outside the Group) 127 1.367.787.599 951.638.564 1.520.187.012 1.042.866.548 3. Revenues from use of own products, goods and services 128 1.945.358 774.985 3.136.095 1.419.855 4. Other operating revenues with undertakings in a Group 129 24.222 8.398 42.241 7.134 5.Other operating revenues (outside the Group) 130 18.139.649 6.917.298 9.503.118 2.403.368
II. OPERATING EXPENSES (ADP 132+133+137+141+142+143+146+153) 131 937.164.842 466.448.165 1.080.372.852 527.164.276 1. Changes in inventories of finished products and work in progress 132 2. Material costs (ADP 134 to 136) 133 377.176.173 217.275.569 418.643.424 238.841.233 a) Cost of raw materials & consumables 134 206.303.849 115.834.590 241.602.189 133.060.307 b) Cost of goods sold 135 2.235.915 1.670.877 2.749.445 1.493.980 c) Other costs 136 168.636.409 99.770.102 174.291.790 104.286.946 3. Staff costs (ADP 138 to 140) 137 283.614.136 142.428.457 344.484.076 158.723.160 a) Net salaries 138 178.485.660 92.471.119 207.014.411 95.251.346 b) Employee income tax 139 67.203.991 32.169.764 89.158.734 41.326.322 c) Tax on payroll 140 37.924.485 17.787.574 48.310.931 22.145.492 4. Depreciation and amortisation 141 180.248.254 61.964.245 215.613.149 81.738.393 5. Other expenditures 142 88.369.594 38.670.084 95.540.566 44.976.645 6. Value adjustment (ADP 144+145) 143 271.483 229.733 69.637 0 a) non-current assets (without financial assets) 144 b) current asssets (without financial assets) 145 271.483 229.733 69.637 0 7. Provisions (ADP 147 to 152) 146 0 0 0 0 a) Provision for pensions, severance payments and other employment benefits 147
b) Provisions for tax liabilities 148 c) Provisions for litigations in progress 149 d) Provisions for renewal of natural resources 150 e) Provision for costs within warranty period 151 f) Other provisions 152 8. Other operating expenses 153 7.485.202 5.880.077 6.022.000 2.884.845
III. FINANCIAL INCOME (ADP 155 to 164) 154 78.723.787 9.448.512 55.622.830 10.438.960 1. Income from stakes (shares) in undertakings in a Group 155 2 Income from stakes (shares) in undertakings with participating interest 156 3. Income from other non-current financial investments and loans to undertakings in a Group 157
4. Other interest income from undertakings in a Group 158 5. Foreign exchange differences and other financial income from undertakings in a Group 159
6. Income from other non-current financial investments and loans 160 7. Other interest income 161 286.949 57.008 161.037 44.193 8. Foreign exchange differences and other financial income 162 32.975.611 6.378.531 45.717.290 9.530.602 9. Unrealized gains (income) from the financial assets 163 8.150.742 2.277.091 7.098.051 0 10. Other financial income 164 37.310.485 735.882 2.646.452 864.165
IV. FINANCIAL COSTS (ADP 166 to 172) 165 39.703.711 13.781.350 67.399.830 43.867.493 1. Interest expenses and similar expenses with undertakings in a Group 166 2. Foreign exchange differences and other expenses with undertakings in a Group 167
3. Interest expenses and similar 168 23.006.268 8.439.847 28.006.784 10.588.823 4. Foreign exchange differences and other expenses 169 6.905.672 1.105.832 27.044.408 23.142.794 5. Unrealized loss (expenses) from the financial assets 170 7.293.756 2.367.168 5.990.954 4.385.659 6. Value adjustment expense on financial assets (net) 171 5.629.924 5.629.924 7. Other financial expenses 172 2.498.015 1.868.503 727.760 120.293
V. SHARE OF PROFIT FROM UNDERTAKINGS WITH PARTICIPATING INTEREST 173VI. SHARE OF PROFIT FROM JOINT VENTURES 174VII. SHARE OF LOSS FROM UNDERTAKINGS WITH PARTICIPATING INTEREST 175VIII. SHARE OF LOSS FROM JOINT VENTURES 176IX. TOTAL INCOME (ADP 125+154+173+174) 177 1.467.125.201 968.895.587 1.597.922.336 1.061.506.962X. TOTAL EXPENSES (ADP 131+165+175+176) 178 976.868.553 480.229.515 1.147.772.682 571.031.769XI. PROFIT OR LOSS BEFORE TAX (ADP 177-178) 179 490.256.648 488.666.072 450.149.654 490.475.193
1. Profit before tax (ADP 177-178) 180 490.256.648 488.666.072 450.149.654 490.475.193 2. Loss before tax (ADP 178-177) 181 0 0 0 0
XII. INCOME TAX EXPENSE 182XIII. PROFIT OR LOSS FOR THE PERIOD (ADP 179-182) 183 490.256.648 488.666.072 450.149.654 490.475.193
1. Profit for the period (ADP 179-182) 184 490.256.648 488.666.072 450.149.654 490.475.193 2. Loss for the period (ADP 182-179) 185 0 0 0 0
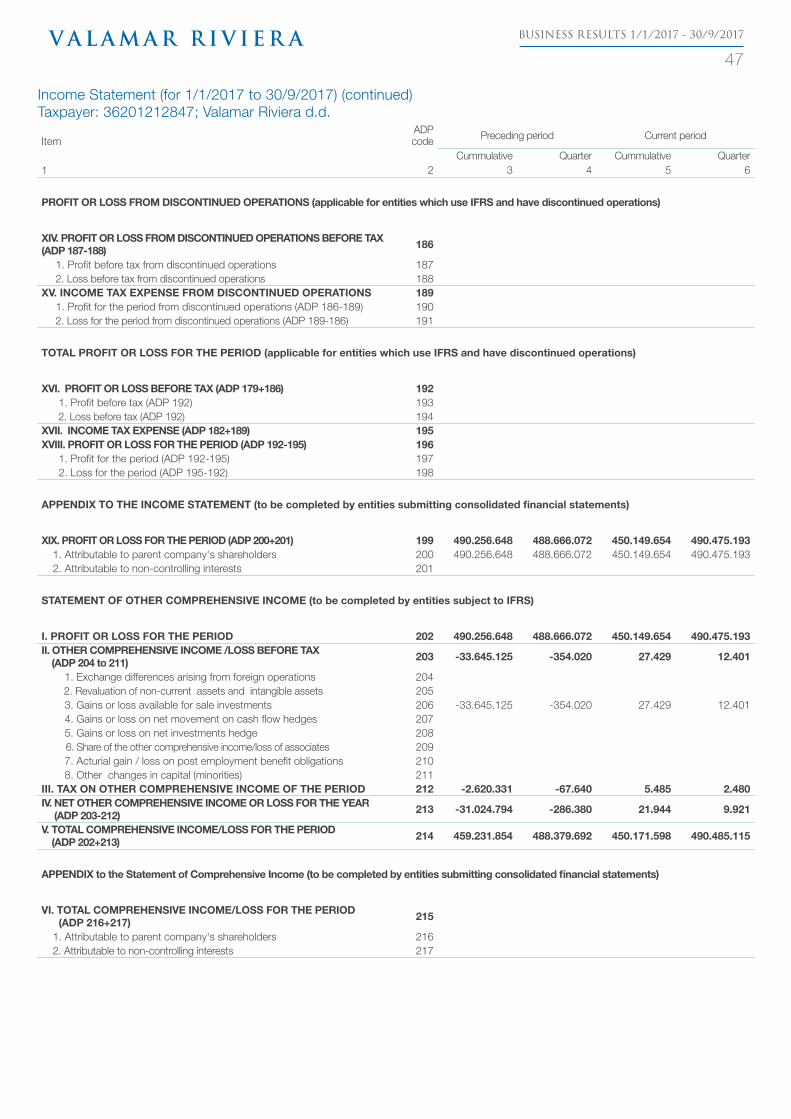
BUSINESS RESULTS 1/1/2017 - 30/9/2017
47
Income Statement (for 1/1/2017 to 30/9/2017) (continued)Taxpayer: 36201212847; Valamar Riviera d.d.
ItemADP
code Preceding period Current period
Cummulative Quarter Cummulative Quarter1 2 3 4 5 6
PROFIT OR LOSS FROM DISCONTINUED OPERATIONS (applicable for entities which use IFRS and have discontinued operations)
XIV. PROFIT OR LOSS FROM DISCONTINUED OPERATIONS BEFORE TAX (ADP 187-188) 186
1. Profit before tax from discontinued operations 187 2. Loss before tax from discontinued operations 188
XV. INCOME TAX EXPENSE FROM DISCONTINUED OPERATIONS 189 1. Profit for the period from discontinued operations (ADP 186-189) 190 2. Loss for the period from discontinued operations (ADP 189-186) 191
TOTAL PROFIT OR LOSS FOR THE PERIOD (applicable for entities which use IFRS and have discontinued operations)
XVI. PROFIT OR LOSS BEFORE TAX (ADP 179+186) 192 1. Profit before tax (ADP 192) 193 2. Loss before tax (ADP 192) 194
XVII. INCOME TAX EXPENSE (ADP 182+189) 195XVIII. PROFIT OR LOSS FOR THE PERIOD (ADP 192-195) 196
1. Profit for the period (ADP 192-195) 197 2. Loss for the period (ADP 195-192) 198
APPENDIX TO THE INCOME STATEMENT (to be completed by entities submitting consolidated financial statements)
XIX. PROFIT OR LOSS FOR THE PERIOD (ADP 200+201) 199 490.256.648 488.666.072 450.149.654 490.475.1931. Attributable to parent company's shareholders 200 490.256.648 488.666.072 450.149.654 490.475.1932. Attributable to non-controlling interests 201
STATEMENT OF OTHER COMPREHENSIVE INCOME (to be completed by entities subject to IFRS)
I. PROFIT OR LOSS FOR THE PERIOD 202 490.256.648 488.666.072 450.149.654 490.475.193II. OTHER COMPREHENSIVE INCOME /LOSS BEFORE TAX (ADP 204 to 211) 203 -33.645.125 -354.020 27.429 12.401
1. Exchange differences arising from foreign operations 204 2. Revaluation of non-current assets and intangible assets 205 3. Gains or loss available for sale investments 206 -33.645.125 -354.020 27.429 12.401 4. Gains or loss on net movement on cash flow hedges 207 5. Gains or loss on net investments hedge 208 6. Share of the other comprehensive income/loss of associates 209 7. Acturial gain / loss on post employment benefit obligations 210 8. Other changes in capital (minorities) 211
III. TAX ON OTHER COMPREHENSIVE INCOME OF THE PERIOD 212 -2.620.331 -67.640 5.485 2.480IV. NET OTHER COMPREHENSIVE INCOME OR LOSS FOR THE YEAR (ADP 203-212) 213 -31.024.794 -286.380 21.944 9.921
V. TOTAL COMPREHENSIVE INCOME/LOSS FOR THE PERIOD (ADP 202+213) 214 459.231.854 488.379.692 450.171.598 490.485.115
APPENDIX to the Statement of Comprehensive Income (to be completed by entities submitting consolidated financial statements)
VI. TOTAL COMPREHENSIVE INCOME/LOSS FOR THE PERIOD (ADP 216+217) 215
1. Attributable to parent company's shareholders 2162. Attributable to non-controlling interests 217
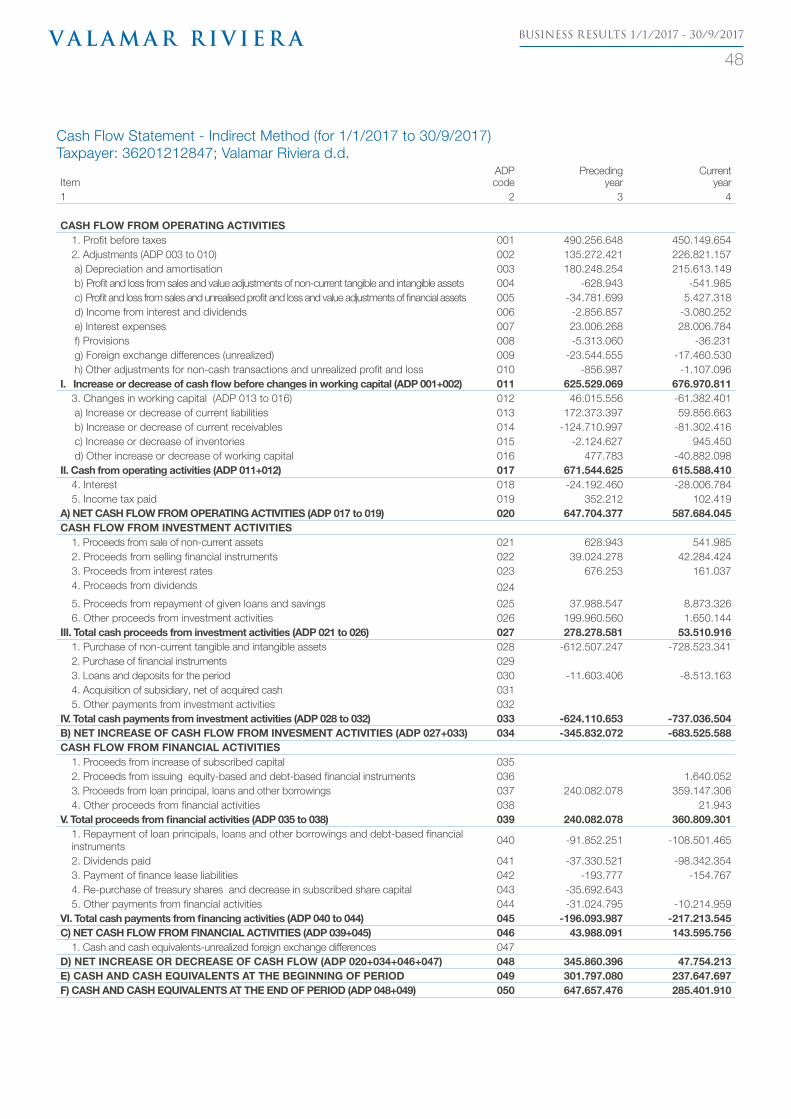
BUSINESS RESULTS 1/1/2017 - 30/9/2017
48
Cash Flow Statement - Indirect Method (for 1/1/2017 to 30/9/2017)Taxpayer: 36201212847; Valamar Riviera d.d.
ItemADP
codePreceding
yearCurrent
year1 2 3 4
CASH FLOW FROM OPERATING ACTIVITIES 1. Profit before taxes 001 490.256.648 450.149.6542. Adjustments (ADP 003 to 010) 002 135.272.421 226.821.157 a) Depreciation and amortisation 003 180.248.254 215.613.149 b) Profit and loss from sales and value adjustments of non-current tangible and intangible assets 004 -628.943 -541.985 c) Profit and loss from sales and unrealised profit and loss and value adjustments of financial assets 005 -34.781.699 5.427.318 d) Income from interest and dividends 006 -2.856.857 -3.080.252 e) Interest expenses 007 23.006.268 28.006.784 f) Provisions 008 -5.313.060 -36.231 g) Foreign exchange differences (unrealized) 009 -23.544.555 -17.460.530 h) Other adjustments for non-cash transactions and unrealized profit and loss 010 -856.987 -1.107.096
I. Increase or decrease of cash flow before changes in working capital (ADP 001+002) 011 625.529.069 676.970.8113. Changes in working capital (ADP 013 to 016) 012 46.015.556 -61.382.401 a) Increase or decrease of current liabilities 013 172.373.397 59.856.663 b) Increase or decrease of current receivables 014 -124.710.997 -81.302.416 c) Increase or decrease of inventories 015 -2.124.627 945.450 d) Other increase or decrease of working capital 016 477.783 -40.882.098
II. Cash from operating activities (ADP 011+012) 017 671.544.625 615.588.4104. Interest 018 -24.192.460 -28.006.7845. Income tax paid 019 352.212 102.419
A) NET CASH FLOW FROM OPERATING ACTIVITIES (ADP 017 to 019) 020 647.704.377 587.684.045CASH FLOW FROM INVESTMENT ACTIVITIES
1. Proceeds from sale of non-current assets 021 628.943 541.9852. Proceeds from selling financial instruments 022 39.024.278 42.284.4243. Proceeds from interest rates 023 676.253 161.0374. Proceeds from dividends 024
5. Proceeds from repayment of given loans and savings 025 37.988.547 8.873.3266. Other proceeds from investment activities 026 199.960.560 1.650.144
III. Total cash proceeds from investment activities (ADP 021 to 026) 027 278.278.581 53.510.9161. Purchase of non-current tangible and intangible assets 028 -612.507.247 -728.523.3412. Purchase of financial instruments 0293. Loans and deposits for the period 030 -11.603.406 -8.513.1634. Acquisition of subsidiary, net of acquired cash 0315. Other payments from investment activities 032
IV. Total cash payments from investment activities (ADP 028 to 032) 033 -624.110.653 -737.036.504B) NET INCREASE OF CASH FLOW FROM INVESMENT ACTIVITIES (ADP 027+033) 034 -345.832.072 -683.525.588CASH FLOW FROM FINANCIAL ACTIVITIES
1. Proceeds from increase of subscribed capital 0352. Proceeds from issuing equity-based and debt-based financial instruments 036 1.640.0523. Proceeds from loan principal, loans and other borrowings 037 240.082.078 359.147.3064. Other proceeds from financial activities 038 21.943
V. Total proceeds from financial activities (ADP 035 to 038) 039 240.082.078 360.809.3011. Repayment of loan principals, loans and other borrowings and debt-based financial instruments
040 -91.852.251 -108.501.465
2. Dividends paid 041 -37.330.521 -98.342.3543. Payment of finance lease liabilities 042 -193.777 -154.7674. Re-purchase of treasury shares and decrease in subscribed share capital 043 -35.692.6435. Other payments from financial activities 044 -31.024.795 -10.214.959
VI. Total cash payments from financing activities (ADP 040 to 044) 045 -196.093.987 -217.213.545C) NET CASH FLOW FROM FINANCIAL ACTIVITIES (ADP 039+045) 046 43.988.091 143.595.756
1. Cash and cash equivalents-unrealized foreign exchange differences 047D) NET INCREASE OR DECREASE OF CASH FLOW (ADP 020+034+046+047) 048 345.860.396 47.754.213E) CASH AND CASH EQUIVALENTS AT THE BEGINNING OF PERIOD 049 301.797.080 237.647.697F) CASH AND CASH EQUIVALENTS AT THE END OF PERIOD (ADP 048+049) 050 647.657.476 285.401.910

BUSINESS RESULTS 1/1/2017 - 30/9/2017
49Statement of Changes in Equity (for the period from 1/1/2017 to 30/9/2017)Taxpayer: 36201212847; Valamar Riviera d.d.
Description ADP
Minority (non-controlling) interestMinority
(non-con-trolling) interest
Total capital and reservesSubscribed
Share capitalCapital re-
serves Legal reserves Reserves for own shares
Treasury shares and shares (de-ductible item)
Statutory re-serves Other reserves Revaluation
reserves
Fair value of financial assets
available for sale
Efficient portion of cash flow
hedge
Efficient portion of foreign net investment
hedge
Retained earnings / loss carried forward
Net profit/ loss for the period
Total distribut-able to majority
owners
1 2 3 4 5 6 7 8 9 10 11 12 13 14 15 16 (3 to 6 - 7 + 8 to 15) 17 18 (16+17)
Previous period 1. Balance at 1 January of the previuos period 01 1.672.021.210 109.139 61.906.040 34.344.407 29.046.586 0 31.431.842 211.961.240 105.854.201 2.088.581.493 2.088.581.4932. Changes in accounting policies 02 0 03. Error correction 03 0 04. Balance at 1 January of the previous period (ADP 01 to 03) 04 1.672.021.210 109.139 61.906.040 34.344.407 29.046.586 0 0 0 31.431.842 0 0 211.961.240 105.854.201 2.088.581.493 0 2.088.581.4935. Profit/loss for the period 05 336.657.721 336.657.721 336.657.7216. Foreign currency translation differences- foreign operations 06 0 0 07. Changes in revaluation reserves of non-current tangible and intangible assets 07 0 08. Profit or loss from re-evaluation of finacial assets held for sale 08 -34.190.767 -34.190.767 -34.190.7679. Profit or loss from cash flow hedge 09 0 0 010. Profit or loss from foreign net investment hedge 10 0 011. Share in other comprehensive income/loss from undertakings with participat-
ing interest 11 0 0
12. Actuarial gains/losses from defined benefit plans 12 0 013. Other changes in capital (minorities) 13 -482.954 305.943 -177.011 -177.01114. Taxation of transactions recognized directly in equity 14 2.726.295 2.726.295 2.726.29515. Increase/decrease of subscribed share capital (except by reinvested profit and
in pre-bankruptcy settlement) 15 0 0
16. Increase of subscribed share capital by profit reinvestment 16 0 017. Increase of subscribed share capital in pre-bankruptcy settlement 17 0 018. Repurchase of own shares/ stakes 18 36.708.367 -36.708.367 -36.708.36719. Share in profit/ dividend payout 19 -32.655.373 -73.910.156 -41.254.783 -41.254.78320. Other distribution to majority owners 20 2.578.505 4.041.715 -1.463.210 -1.463.21021. Transfer to reserves according to annual plan 21 5.292.710 10.470.877 9.529.123 90.472.600 -105.854.201 9.911.109 9.911.10922. Increase in reserves in pre-bankruptcy settlement 22 0 023. Balance at 31 Decemeber of previous period (ADP 04 to 22) 23 1.672.021.210 2.204.690 67.198.750 44.815.284 37.141.295 0 9.529.123 0 273.313 0 0 228.523.684 336.657.721 2.324.082.480 0 2.324.082.480
ADDITION TO STATEMENT OF CHANGES IN EQUITY (only for IFRS adopters) I. OTHER COMPREHENSIVE INCOME OF PREVIOUS PERIOD NET OF TAX (ADP 06 to 14) 24 0 -482.954 0 0 0 0 0 0 -31.158.529 0 0 0 0 -31.641.483 0 -31.641.483
II. COMPREHENSIVE INCOME OR LOSS FOR THE PREVIOUS PERIOD (ADP 05+24) 25 0 -482.954 0 0 0 0 0 0 -31.158.529 0 0 0 336.657.721 305.016.238 0 305.016.238
III. TRANSACTIONS WITH OWNERS IN THE PREVIOUS PERIOD, RECOGNIZED DIRECTLY IN EQUITY (ADP 15 to 22) 26 0 2.578.505 5.292.710 10.470.877 8.094.709 0 9.529.123 0 0 0 0 16.562.444 -105.854.201 -69.515.251 0 -69.515.251
Current period
1. Balance at 1 January of current period 27 1.672.021.210 2.204.690 67.198.750 44.815.284 37.141.295 0 9.529.123 0 273.313 0 0 228.523.684 336.657.721 2.324.082.480 0 2.324.082.4802. Changes in accounting policies 28 0 03. Error correction 29 0 04. Balance at 1 January of current period (ADP 27 to 29) 30 1.672.021.210 2.204.690 67.198.750 44.815.284 37.141.295 0 9.529.123 0 273.313 0 0 228.523.684 336.657.721 2.324.082.480 0 2.324.082.4805. Profit/loss for the period 31 450.149.654 450.149.654 450.149.6546. Foreign currency translation differences- foreign operations 32 0 07. Changes in revaluation reserves of non-current tangible and intangible assets 33 0 08. Profit or loss from re-evaluation of finacial assets held for sale 34 27.429 27.429 27.4299. Profit or loss from cash flow hedge 35 0 010. Profit or loss from foreign net investment hedge 36 0 011. Share in other comprehensive income/loss from undertakings with participat-
ing interest 37 0 0
12. Actuarial gains/losses from defined benefit plans 38 0 013. Other changes in capital (minorities) 39 0 014. Taxation of transactions recognized directly in equity 40 -5.485 -5.485 -5.48515. Increase/decrease of subscribed share capital (except by reinvested profit and
in pre-bankruptcy settlement) 41 0 0
16. Increase of subscribed share capital by profit reinvestment 42 0 017. Increase of subscribed share capital in pre-bankruptcy settlement 43 0 018. Repurchase of own shares/ stakes 44 -1.251.674 1.251.674 1.251.67419. Share in profit/ dividend payout 45 0 020. Other distribution to majority owners 46 1.398.216 -99.352.193 -97.953.977 -97.953.97721. Transfer to reserves according to annual plan 47 16.402.311 310.168.654 -336.657.721 -10.086.756 -10.086.75622. Increase in reserves in pre-bankruptcy settlement 48 0 023. Balance as at 31 December of the current period (ADP 30 to 48) 49 1.672.021.210 3.602.906 83.601.061 44.815.284 35.889.621 0 9.529.123 0 295.257 0 0 439.340.145 450.149.654 2.667.465.019 0 2.667.465.019
ADDITION TO STATEMENT OF CHANGES IN EQUITY (only for IFRS adopters) I. OTHER COMPREHENSIVE INCOME OF CURRENT PERIOD, NET OF TAX (ADP 32 to 40) 50 0 0 0 0 0 0 0 0 21.944 0 0 0 0 21.944 0 21.944
II. COMPREHENSIVE INCOME OR LOSS FOR THE CURRENT PERIOD (ADP 31 + 50) 51 0 0 0 0 0 0 0 0 21.944 0 0 0 450.149.654 450.171.598 0 450.171.598
III. TRANSACTIONS WITH OWNERS IN THE CURRENT PERIOD, RECOGNIZED DIRECTLY IN EQUITY (ADP 41 to 48) 52 0 1.398.216 16.402.311 0 -1.251.674 0 0 0 0 0 0 210.816.461 -336.657.721 -106.789.059 0 -106.789.059
BUSINESS RESULTS 1/1/2017 - 30/9/2017
35
Valamar Riviera d.d.Stancija Kaligari 1
52440 Poreč, HrvatskaT +385 (52) 408 002 F +385 (52) 451 608E [email protected] www.valamar.com
Investor RelationsStancija Kaligari 1 52440 Poreč, HrvatskaT +385 (52) 408 159 F +385 (52) 451 608E [email protected] www.valamar-riviera.com