Embed Size (px)
Citation preview

business • revIew
december 1970
FEDERAL RESERVE BANK Of IllALLAS
This publication was digitized and made available by the Federal Reserve Bank of Dallas' Historical Library ([email protected])

contents SDR's - a new asset supplementing reserves for growth in free world trade . . . . . . . . . . . . . . . . . . . . . . . . .. 3
District agriculture: Crops rebound in 1970 9
District highlights .......... :,. .... ... .. . ... .. . 15

SDR's-a ,.ew asset supplementing ,-ese,-ves
10'- g,-owth in I,-ee wo,-ld trade
A new international reserve asset became available to the monetary authorities of the world on January 1, supplementing such other reserve assets as gold, convertible currencies, and automatic claims on the International Monetary Fund. Created after years of arduous discussion among member nations of the IMF, ~he new monetary unit - SDR's (special drawing rights) - provides the essential basis for freeing the growth of international reserves from dependence on such uncertain forces as gold markets and the balance-of-payments positions of reserve currency countries.
Altogether, $3.4 billion in SDR's was created at the start of 1970. Not only was this a considerable addition to the world's reserves, but the total is slated to grow another $3 billion a year for the next two years, reaching a cumulative total of $9.5 billion in 1972.
Of the amount created so far, the United States has been the largest recipient. This country received an initial allocation of nearly $867 million - roughly a fourth of the world's SDR's. In addition, during the first eight months ~f 1970, the United States made a net acquisihan of more than $94 million, pushing the ~ation's total SDR holdings to over $961 milhan - well above the combined holdings for all continental Europe.
Experience ill 1970 seems to indicate that SDR's may become a viable supplement for the eXpansion of international reserves in response to the needs of world trade and finance. A carefU l appraisal of the first year's experience is Planned for a future Review article.
The Cl./lrrent system
The free world's current international monetary system dates from the Bretton Woods Conference of 1944. Under this system, each member of the IMF fixes a par value for its currency and undertakes to maintain this value within 1 percent of parity. Rates are expressed in terms of either gold or the U.S. dollar. Consequently, where in principle the values of currencies are maintained in terms of gold, in practice they are stated in terms of the dollar. This is because of the now long-standing U.S. pledge to trade gold with foreign governments and central banks at the established rate of $35 an ounce. With such a pledge, a currency valued relative to the dollar actually reflects the fixed value of the currency in terms of the official price of gold.
The supply and demand for currencies arising from international transactions converge in foreign exchange markets. There, monetary authorities of countries belonging to the IMF buy or sell enough of their currencies to keep values within the official spread. To keep the value of their currencies from rising above the official selling price, monetary authorities supply the market with their currencies by buying up other currencies. Conversely, to keep the value of their currencies from falling below the official buying price, monetary authorities use foreign currencies in the exchange market to buy up their own currency.
This system of currency convertibility at stable exchange rates requires that the monetary authorities of every member country main-
business review/december 1970 3

tain a stock of foreign reserve assets that can be used to intervene in the foreign exchange market. The U.S. dollar is the principal intervention currency used in these transactions, the others being the pound and the franc, which are used in markets dominated by British and French currencies. With the dollar so important to the international monetary system, the United States must maintain a stock of gold and other reserve assets to ensure the convertibility of dollars presented by foreign monetary authorities for redemption.
The International Monetary Fund was established through initial subscriptions of gold and currency totaling the equivalent of $8 billion. Twice, quotas were increased across the board, in 1959 and again in 1966, bringing the fund's total resources to the equivalent of $21 billion. Another important step in the strengthening of the international monetary system was taken in 1962, when ten major countries agreed, if necessary, to lend the fund the equivalent of up to $6 billion. Then, early this year, the Board of Governors of the IMF adopted a resolution calling for a one-third increase in quotas.
Reserves before 1970
Despite efforts to strengthen the IMF and promote the smooth functioning of the international monetary system, total world reserves (gold, foreign exchange, and reserve positions of countries at the IMF) expanded slowly in the 1960's. Problems with changes in the composition of reserves and declining confidence in the convertibility of major reserve currencies also emerged. Recognition of the implication of these problems for the international monetary system led eventually to the adoption of SDR's.
World reserves at the end of 1969 totaled $76.9 billion, compared with $60.5 billion at the end of 1960. This represented an average annual increase of only 3 percent. Meanwhile, world trade (measured by total imports, including the cost of insurance and freight) expanded
from $119.4 billion in 1960 to $254 billion in 1969, or at an average annual growth rate of nearly 10 percent.
Not only did trade grow more than three times as fast as reserves - creating concern that reserves might not long be adequate for the demands of trade - but the composition of international reserves also changed. Where monetary gold stocks had accounted for almost two-thirds of international reserves in 1960, by the end of the decade they accounted for little over half.
The shift in the composition of reserves made foreign exchange (holdings of key currencies, primarily the dollar and the pound) an increasingly important component of total reserveS. In 1960, foreign exchange made up 31 percent of international reserves. By the close of 1969, it made up 40 percent. Reserve positions at the IMF almost doubled in the 1960's, largely as a result of the increased quotas members of the IMF agreed to in 1965.1
The growing importance of foreign exchange was due almost entirely to the increase in dollardenominated liabilities of the United States held as reserve assets by other countries. The acCUmulation of U.S. dollar foreign exchangewhich resulted mainly from balance-of-payments surpluses of other countries built up as the counterpart of the large, prolonged V.S. balance-of-payments deficit - accounted for most of the growth in reserves. Total foreign exchange reserves increased $12.2 billion over the decade. Of that, $4.9 billion was in dollar liabilities, which grew at an average ,annual rate of 4.9 percent, compared, for example, with all
. . nal 1 Reserve positions at the IMF are uncondltlo b
assets arising from a country's gold subscription to t t~ fund and the IMP's use of tbat country's currencY £ finance drawings of other countries and purchases ~t gold: Gold subscriptions fo~ original members wer~ Sot at either 25 percent of theil' quotas or 10 percen n their net official holdings of gold and U.S. dollars ~e September 12, 1946, whichever was less. The sa
ers.
formu la has usually been followed for new memb

average growth of 2.2 percent in sterlingdenominated assets.
Another problem for the international payments system was recurrent currency crises in the 1960's. Speculative fever hit the Gelman mark in 1961, 1968, and 1969, the French franc in 1968 and 1969, the Italian lira in 1963, the British pound in 1961, 1964, 1967, and 1968, and the U.S. dollar in 1968.
The international monetary system was able to withstand the strain of these speculative crises largely because of cooperative efforts of monetary authorities to counter them. The German mark had to be revalued in 1961 and 1969. And the British pound had to be devalued in 1967 and the French franc in 1969. But through broadly based international efforts, monetary authorities were able to maintain the gold exchange rate of the dollar.
The United States and other countries agreed in 1968 to no longer supply gold to the gold market but to let the market price fluctuate without official intervention. A two-price system was thereby established, with monetary gold held at its official price and the market price allowed to fluctuate in response to supply and demand.
This new type reserve
Since SDR's are merely book entries in a special drawing account established at the IMP, they do not represent liabilities of anyone COuntry, or of the IMF. When a country has difficulties with its balance of payments or reserve position, its monetary authority can justify Use of SDR's.
Special drawing rights can be used in transactions between countries either through bilateral agreement or through designation by the ltvlF. For transactions based on designation, a cOUlltry wanting to use SDR's can ask the IMP to designate countries to receive them and the amOunt eaoh is to receive.
Free world trade outpaced growth in reserves in 1960's
BILLIONS OF OOLLARS
300 r---------------_-.
250
200
150
100 RESERVES
50
1960 1963 1966 1969
1969 rese rve s es timat e d .
S OURCE : Internation a l Financial Statisti c s .
Special drawing rights cannot be used, however, for a counby to obtain foreign currency from the pool of currencies held by the IMF. The fund can issue SDR's without committing its resources by requiring that designated participants accept SDR's and provide currency convertible in fact to other members. The ability of members to obtain convertible currency in exchange for SDR's is basic to the concept of this new reserve asset.
Although the unit value of an SDR is equivalent to the "gold content" of the dollar (0.888671 gram of gold nine-tenths fine), SDR's cannot be converted directly into gold. However, since participating nations guarantee the new monetary unit at tlllS rate, the revaluation or devaluation of a currency cannot affect the value of SDR holdings. If a currency were devalued, SDR's would simply command more units of the devalued currency.
While no country is obligated to treat SDR's as reserve assets, most countries have chosen
business review/december 1970 5

Foreign exchange expanded .•.
BILLIONS OF DOLLARS I YEAR-END FIGURES )
1960 1962 1964 1966 1968
1969 estimated : 1970 estimated for first quarter .
SOURCE ; International Financial Statistics.
1970
to include them in their international monetalY reserves. This is because of their fixed value and, more fundamentally, their transferability into currencies that are convertible in fact. As a further inducement to the holding of SDR's, the IMP pays interest (currently 1.5 percent a year) on each countlY's holdings in excess of the amount allocated to it.
Future allocations will depend on global needs for l:eserves. New allocations are initiated by the managing director of the IMP. This official, who is chairman of the fund's executive board and head of its operating staff, consults with member nations to determine support for the creation of SDR's in an amount that would be acceptable to most IMF members. To become effective, the proposal must be agreed to by the executive directors of the fund (a group responsible for its general operations) and approved by participating countries with 85 percent of the weighted voting power of the fund.
6
Since SDR's are intended to ensure adequate long-run growth of total reserves, the amount created is not ordinarily expected to vary from year to year or in response to the payments position or reserve needs of individual countries. Rather, the amount created will normally apply for a specific period (initially, three years). The new drawing rights are allocated to participants in proportion to their IMF quotas. Every country in the fund received an allocation at the start of 1970 computed at just under 17 percent of its quota at the end of 1969. Thus, the United States, which accounted for nearly a fourth of the fund's quotas, received a sinli lar proportion of the SDR credits.
Safeguards and limitations
While the creation of SDR's consists of book entries in the IMF's special drawing account, transactions imply eventual transfers of real goods and services. But because a country surrendering its own currency for SDR's is placing claims on its real resources or international reserves directly in the hands of foreigners, several limitations have been imposed on the use of SDR's.
One of the most important is the basic rule of need. Under this rule, countries are able to
.•. as dollar reserves increased BILLIONS OF DOLLARS I YEAR - END FIGURES )
40 ,----------------'1
30
20
10
o
SOURCE : International Financial Stati stic s,
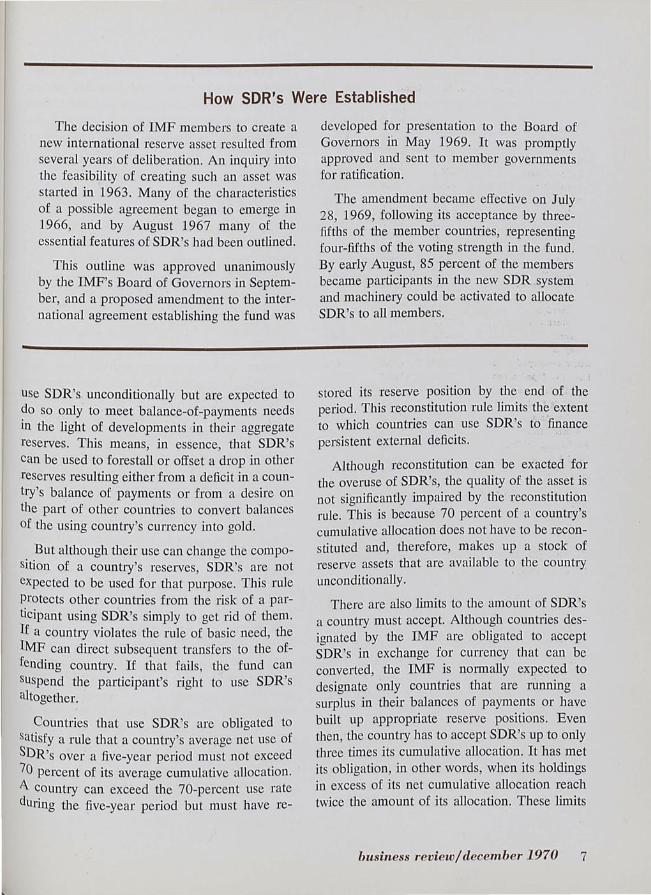
How SDR's Were Established
The decision of IMP members to create a new international reserve asset resulted from several years of deliberation. All inquiry into the feasibility of creating such an asset was started in 1963. Many of the characteristics of a possible agreement began to emerge in 1966, and by August 1967 many of the essential features of SDR's had been outlined.
This outline was approved unanimously by tlle IMP's Board of Governors in September, and a proposed amendment to the international agreement establishing the fund was
use SDR's unconditionally but are expected to do so only to meet balance-of-payments needs in the light of developments in their aggregate reserves. This means, in essence, that SDR's can be used to forestall or offset a drop in other reserves resulting either from a deficit in a country's balance of payments or from a desire on the part of other countries to convert balances of the using country's currency into gold.
But although their use can change the composition of a country's reserves, SDR's are not expected to be used for that purpose. This rule protects other countries from the risk of a participant using SDR's simply to get rid of them. If a country violates the rule of basic need, the IMP can direct subsequent transfers to the offending country. If that fails, the fund can sUspend the participant's right to use SDR's altogether.
Countries that use SDR's are obligated to satisfy a rule that a country's average net use of SDR's over a five-year period must not exceed 70 percent of its average cumulative allocation. A. country can exceed the 70-percent use rate during the five-year period but must have re-
developed for presentation to the Board of Governors in May 1969. It was promptly approved and sent to member governments for ratification.
The amendment became effective on July 28, 1969, following its acceptance by threefifths of the member countries, representing four-fifths of the voting strength in the fund. By early August, 85 percent of the members became participants in the new SDR system and machinery could be activated to allocate SDR's to all members.
stored its reserve position by the end of the period. This reconstitution rule limits the extent to which countries can use SDR's to finance persistent external deficits.
Although reconstitution can be exacted for the overuse of SDR's, the quality of the asset is not significantly impaired by tlle reconstitution rule. This is because 70 percent of a country's cumulative allocation does not have to be reconstituted and, therefore, makes up a stock of reserve assets tllat are available to the country unconditionally.
There are also limits to the amoLint of SDR's a country must accept. Although countries designated by the IMP are obligated to accept SDR's in exchange for currency that can be converted, the IMP is nOlmally expected to designate only countries tllat are running a surplus in their balances of payments or have built up appropriate reserve positions. Even then, the country has to accept SDR's up to only three times its cumulative allocation. It has met its obligation, in other words, when its holdings in excess of its net cumulative allocation reach twice the amount of its allocation. These limits
business review/ december 1970 7

ALLOCATION AND USE OF SDR'S
(In millions of U.S. dollars)
Pa rticipant
Industrial countries
United States ..
United Kingdom .. . . .
Industrial Europe ... . Austria . . Belgium .... . . Denma rk ...... . . . France ....... . Italy . . . Luxembourg . . . . . . Netherlands Norway Sweden . . . West Germany
Canada .. . .... . . .
Japan
Other developed areas . .
Less developed areas .. .
Latin America . .. .. .
Middle East .. .
Other Asia ... . . . . . . .
Other Africa
Participant holdings .
Fund holdings
Total ....
Allocations, Jan. I, 1970
$2,276.2
866.9
409.9
753.3 29.4 70.9 27.4
165.5 105.0
3.2 87.4 25.2 37.8
201.6
124.3
121.8
284.8
853.1
330.0
77.4
277.7
168.0
3,414.0
3,414.0
Net receipts
or use (-)
$ 84.6
94.3
- 120.8
69.9 8.8
23.0 -10.0
2.0 -29.4
25.1 2.0
48.5
20.4
20.7
-39.3
-298.4
-38.5
-66.1
-142.1
-51.6
-253.2
253.2
.0
Holdings, Aug. 31,
1970
$2,360.8
961.2
289.2
823.2 38.2 93.9 17.4
167.4 75.6
3.2 112.4
27.2 37.8
250.1
144.7
142.5
245.5
554.6
291.5
11.3
135.6
116.3
3,160.9
3,414.0
NOTE. - Details may not add to tota ls ·because of round· ing.
SOURCE: International Financial Statistics.
protect participants from obligations that may be too heavy.
Some tentative implications
Experience with the use of SDR's seems to indicate the emergence of an acceptable international reserve asset. Special drawing rights have been transferred freely and used in accordance with the rules of the agreement under which they were established.
There have been few SDR transactions by mutual agreement. And as expected, where there have been such transactions, they · have been mostly cases of a country obtaining balances of its own currency from another country.
8
The United Kingdom, for example, transferred SDR's to West Germany in exchange for an equivalent balance of sterling. And the United States transferred SDR's to Belgium and the Netherlands in exchange for dollar balances.
There have, however, been a number of transactions by designation. Most of the designations have been on the basis of strength in balance of payments and accumulation of reserves. Those designated to receive SDR's have usually been industrial countries, such as the United States, Canada, Japan, Germany, Belgium, and the Netherlands. But they have also included such less developed countries as Argentina, Brazil, Chile, Kenya, Korea, Malaysia, Mexico, and the Congo.
Several countries with balance-of-payments problems or low currency reserves have used their SDR allocations to restore their reserve positions with the IMF.2 They have included Italy, Greece, Turkey, Yugoslavia, Egypt, Israel, and the United Kingdom.
The smooth working of the designation process suggests that an orderly expansion of SDR's can help provide a means of reconciling the objectives of both surplus and deficit countries. Since most governments try to increase reserveS with the expansion of their international trade and growth of domestic income and production, the total stock of internationl reserves must also increase.
If appropriate growth of international monetary reserves can be ensured by the creation of SDR's, the international monetary system can Largely avoid situations in which one country gains reserves only at the expense of other countries. In the past, if total reserves did not increase fast enough to keep up with the increase in international transactions, the outlook
~ In the first eight months of J 970, the IMF acquired slightly more than $250 million in SDR's, mostly fronl countries paying charges on their IMF drawings or repaying the drawings.

was for a shortage in reserves. Surplus countries tended to adopt policies designed to conserve their reserve assets, and deficit countries tended to adopt policies designed to gain reserves. Together, these two types of policy tended to restrict trade and finance, leading to restrictive economic policies and frequently to direct controls over private international trade and payment flows.
Dist,.ict ag,.icultu,.e:
By providing for orderly and adequate growth of monetary reserves for all countries, SDR's may also serve as a mechanism for accommodating the goals of bOtll surplus and deficit countries. Continuation of the trends seen in 1970 should serve the International Monetary Fund's final purpose - the promotion of freer flows of world trade and payments.
LACY H . HUNT, II
C,-ops ,-ebound in 1970
Livestock has accounted for most of the growth in farm income in the Eleventh Federal Reserve District states in recent years. The increase in agricultural production in these states (Arizona, Louisiana, New Mexico, Oklahoma,. and Texas) has been due primarily to the rapid expansion of cattle feeding. Also, livestock prices have been generally more favorable than crop prices. The trend changed this year, however, with crop output rising as fast as livestock production. The most significant change Was the relative improvement in crop prices since midyear.
The change was due to a combination of factors. Crop production improved with generally favorable weather conditions throughout the Southwest, and crop prices increased with heavier than expected demand. By contrast, Cattle feeding, which was the main source of growth in livestock production, slowed as the high cost of feeders and capital checked the spread of feedlots . The increase in livestock prices also, slowed, primarily because of an
increase in supplies of poultry and red meat but also because of sluggish consumer demand and the slower pace of general economic activity.
These changes. are not expected to affect tota l farm income significantly, however. Higher prices for crops in the second half of the year will probably more than offset the lower prices for livestock, leaving farmers and ranchers in the five southwestern states with a total gross income exceeding the $6.6 billion they earned last year. But with costs of agricultural production increasing faster than gross income, their total net income will probably not improve.
Crop production
District crop production is expected to total 3 percent higher than in 1969. Although production of winter wheat declined, production of cotton, rice, and sorghum grain was up, as was the output of most minor crops.
Prospects for the cotton crop in these states have been placed at 4.7 million bales . That is
business review/ december 1970 .9

Texas livestock prices weaken but crop prices gain in 1970
(1910-14 = 1001
300
200
1969 1970
SOURCE : U. S . Department of Acriculture .
7 percent more than in 1969 although 10 percent less than in 1968. The expected increase is due to increases in both acreage and expected lint yield.
With an 8-percent increase in acreage, the Texas cotton crop will probably be 17 percent larger than a year before. Acreage for harvest was up 7 percent in Louisiana, but other District states have smaller cotton acreages this year. Acreage was off 12 percent in Arizona, 4 percent in New Mexico, and 3 percent in Oklahoma.
Unfavorable weather late in the crop season and a smaller acreage allotment combined to reduce wheat production in District states by 15 percent. By contrast, with an acreage increase of only 1 percent, the sorghum grain crop is expected to be 12 percent larger than in 1969. Total production of sorghum grain will probably approach 412 million bushels. This, along with the 112-million-bushel carryover of old-crop grain, should approach the supply on hand in these states a year ago.
10
Although rice acreage was reduced 15 percent in both Louisiana and Texas, prospects are for a slight increase over last year's production. Yields are expected to average 4,000 pounds per acre in Louisiana, compared with 3,400 pounds last year, and 4,750 pounds per acre in Texas, compared with 3,950 last year.
Gains can be expected in most minor crops, which together account for about a fifth of the total value of crop production in the five states. Harvests of corn, oats, barley, rye, hay, and peanuts are larger than in 1969, although harvests of flaxseed, potatoes, and pecans will probably be smaller.
Prospects are for citrus crops in Arizona and Texas to total 22.5 million boxes - 11 percent more than last year. Large increases in the orange crop are expected in both states, and the grapefruit crop will be larger in Texas. Prospects for citrus crops in Florida are also up sharply.
Livestock production
District livestock production is expected to show a 3-percent gain over 1969. As in other recent years, the prospects for gain result mainly from increases in beef production.
As more marginal cropland was converted into pastures, especially in the eastern part of the District, and more pastures were improved, the number of beef cattle in the Southwest continued to climb, reaching 20 million head at the start of 1970. The increase, spurred by continued demand for beef and rising prices for feeder calves, was in line with a 10ng-terJJl trend that has nearly doubled the number of head in District states since 1950.
Production of fed beef continued to increase, though not nearly as fast as in previous years. The number of cattle on feed in states of the Eleventh District soared in the second half of the 1960's. With the rapid growth in feedlots , especially in the High Plains, four of the states - Arizona, New Mexico, Oklahoma, and
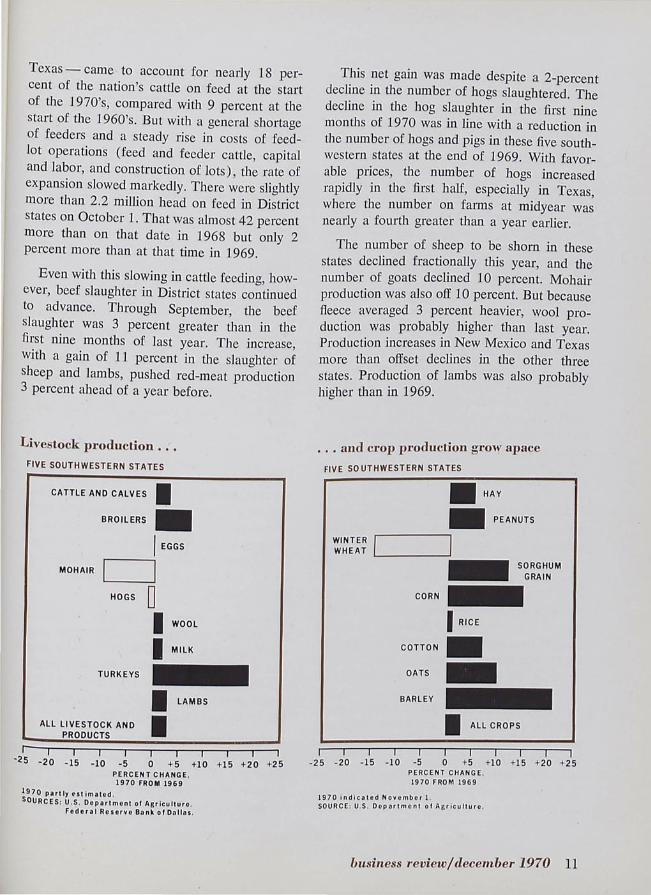
Texas - came to account for nearly 18 percent of the nation's cattle on feed at the start of the 1970's, compared with 9 percent at the start of the 1960's. But with a general shortage of feeders and a steady ri se in costs of feedlot operations (feed and feeder cattle, capital and labor, and construction of lots), the rate of expansion slowed markedly. There were slightly more than 2.2 million head on feed in District states on October 1. That was almost 42 percent more than on that date in 1968 but only 2 percent more than at that time in 1969.
Even with this slowing in cattle feeding, however, beef slaughter in District states continued to advance. Through September, tl1e beef slaughter was 3 percent greater than in the first nine months of last year. The increase, with a gain of 11 percent in the slaughter of sheep and lambs, pushed red-meat production 3 percent ahead of a year before.
Livestock production .. •
FIVE SOUTHWESTERN STATES
CATTLE ANO CALVES I BROILERS • I EGGS
MOHAIR I HOGS 0
I WOOL
I MILK
TURKEYS
I LAMBS
r--25
ALL LIVESTOCK ANO I PRODUCTS
I I I - 20 -15 -10
I I I - 5 0 + 5
PERCENT CHANGE. 1970 FROM 1969
1970 partly ~s t imatod . SOURCES : U.S. De p a rtm e nt of Agriculturo .
I +10
Fe d e ral Reser v o Bnnk of Da lla s.
I I I +15 +2 0 +25
This net gain was made despite a 2-percent decline in the number of hogs slaughtered. The decline in the hog slaughter in the first nine months of 1970 was in line with a reduction in the number of hogs and pigs in these five southwestern states at the end of 1969. With favorable prices, the number of hogs increased rapidly in the first half, especially in Texas, where the number on farms at midyear was nearly a fo urth greater than a year earlier.
The number of sheep to be shorn in these states declined fractionally this year, and the number of goats declined 10 percent. Mohair production was also off 10 percent. But because fleece averaged 3 percent heavier, wool production was probably higher than last year. Production increases in New Mexico and Texas more than offset declines in the other three states. Production of lambs was also probably higher than in 1969.
. .. and crop production grow apace
FIVE SOUTHWESTERN STATES
II HAY
• PEANUTS
WINTER ~-----'I WHEAT L-____ ~.
_SORGHUM
GRAIN
I I I I
CORN_
I RICE
COTTON.
OATS _
BARLEY
I ALL CROPS
I I I I I I I -25 -2 0 -15 - 10 -5 0 +5 +10 +1 5 +20 +25
PERCENT CHANGE . 19 70 FROM 196 9
1970 i nd icated N ovembe r l. SOURCE : U.S, Depar t mont 0' Agriculture .
business review/ december 1970 11

Egg production increased in Arizona, New Mexico, and Texas but declined in Louisiana and Oklahoma, leaving total production about the same as last year. Prices in the first quarter averaged higher than a year before but have since averaged lower.
Broiler production through October indicates a 7-percent increase for the year. As a result of this increase, which is the same as last year's gain, commercial broiler prices declined. Prices in Texas averaged 12 percent lower in the first ten months than in the same period a year before. With live-turkey prices in the first quarter averaging 40 percent higher than in the same period last year, this year's turkey production is expected to be 19 percent higher.
In sharp contrast to the downtrend since 1950, the total number of dairy cows in these states is almost the same as last year. But in line with trends toward greater efficiency in milk production, output in the first ten months of the year was 2 percent greater than in the same period last year.
Net farm income
Although farmers and ranchers of the Southwest can probably expect total annual gross farm income to have continued its increase of recent years, production costs apparently rose even faster, holding net income to roughly the same level as in 1969. In the first nine months of this year, cash receipts were 3 percent higher than in the same period last year. Livestock receipts increased faster than crop receipts during the first half of the year, but shifts began to occur in the second half as livestock prices weakened and crop prices improved. Meat supplies have been plentiful since midyear, causing livestock prices to drift downward. And crop prices, especially for cotton and grains, are higher tllan last year. Gains in crop production and prices, as well as more livestock production, indicate total cash receipts may have continued to exceed those of the year before.
12
Net f arm income advanced little in the Southwest in the 1960 ' s
FIVE SOUTHWESTERN STATES BILLIONS OF OOLLARS
-7
. ..... ..... ... ..... .. ................. .. ... ... .... .. .. .. . : ::::::: ::: ::::: ::
R EALlZ~ ~; ~~~;~~~ ~I~~~~~ ~ / ~ j 1! 11111111111111111111
111111111/ II I I I III I I II I I I I I II I I I I I I I I Ii I I I I I I I I I I I I I I I I I I I! 11 I I Ii ;;;; 'piiiio'uci' iiiN' 'fx PEN'S'ES;;;;;;; ;;;;; ;; ;;;; ;;;; ;;;;;; ........ ........... .. ... .. ...... ......... ... .. ... ..... .. ... ...... .. ......... ...................................................... ::::::::::::::::::::::::::::::::::::::::::::::::::::::::::::::::: ........ .... .. ... .... ............................................ .. .......................... ... .... ... .... .. ........ .. .. .. .......
,111~I'iii··llliiiillllllli-iiiliiillllllllll!m!1111111I111 riEl INCOME
1959 1961 1963 1965 1967
SOURCE : U.S. Department of Agricultur e.
~~~~~ 5
;;;;; 3
1969
Higher expenses probably offset these gains, however, leaving net income near the $2 billion realized last year. Inflationary pressures in the general economy pushed up fann expenses for production items, interest, taxes, and wages. Consequently, costs of production probably eXceeded last year's $4.7 billion outlays by at least 5 percent.
Nationally, gross farm income in the first half of the year has been estimated at a seasonally adjusted $56 billion, or $2 billion more than in the first half of 1969. But since produCtion expenses are expected to rise by at least a similar amount, net income for the year likely will be little changed from 1969.
Income in the District and the nation would have been lower had it not been for a substantial expansion of exports. Due primarily to gainS in dollar sales, farm exports totaled $6.6 billion for the fiscal year ended June 30. That was 16

percent more than in fiscal 1969 and only slightly less than the record set in fiscal 1967.
Other District developments
Elsewhere in District agriculture, trends established in previous years apparently continued. Preliminary estimates of the number of farms in District states indicate a continuation of the long-term movement toward fewer but larger farm units. Under pressure of laborsaving changes in agricultural technology and basic changes in the structure of markets in which farmers and ranchers buy and sell - especially the spreading gap between production costs and the prices received for agricultural products - the number of farms in these states apparently declined more than 2 percent this year.
The advance in market values of farm real estate slowed to 4 percent in the year ended March 1. Tllis slowing, too, apparently followed a trend. Values increased 5 percent in the year ended March 1, 1969, and 6 percent and 7 percent, respectively, in the two previous years
FARM LOANS HELD BY PRINCIPAL LENDERS, JANUARY 1, 1970
Five Southwestern States
(Dollar amounts in thousands)
Type of loan and lender
Non.real·estate loans
Banks . ............. .
Production credit associations ... . ... .
Farmers Home Administration
Total ..... . ... .
Real estate loans
Banks .... . . . . . ...... . . . . . .
Federal land banks ....
Life insurance companies
Individuals and others . ....
Farmers Home Administration
Total .. . ... . ..... . .
COMBINED TOTAL .
Amount held
$1,502,712
567,553
127,784
$2,198,049
$ 378,891
861,022
1,119,088
1,342,457
26,240
$3,727,698
$5,925,747
Percent of southwestern
total
68 %
26
6
100 %
10 %
23
30
36
1
100 %
--------------------------------SOURCE: American Bankers Association.
ended in March. Although market values advanced sharply in Oklahoma -- with tight financial markets and further slackening in demand for farmland -- values rose only slightly in Texas and New Mexico, held steady in Louisiana, and eased in Arizona.
With the continued increase in agricultural activity in District states, farmers and ranchers increased the amount of credit used in their businesses this year. The rate of increase is expected to be less than the 8-percent gain registered last year, however. With the slowing in the expansion of farm real estate markets, loans on fanTI real estate probably grew slightly less than the average 6-percent gain posted for the preceding two years. Also, with tighter money markets, non-real-estate farm loans in these five states probably did not increase as much as the unusually high 14 percent in 1969.
With the increase in agricultural credit in recent years, the mix of institutions supplying credit to farmers and ranchers in the Southwest has changed significantly. The amount of nonreal-estate loans has increased at bOtll banks and production credit associations, with peA's providing most of the increase. The amount of non-real-estate loans held by the Farmers Home Administration has declined. Among suppliers of farm real estate loans, life insurance companies have registered only a nominal increase in the last three years, while commercial banks and Federal land banks have shown considerable gains.
Outlook for 1971
The outlook is for little change in District agriculture in the coming year. Overall, both crop production and livestock production will almost certainly continue to increase, pushing gross income higher. But production expenses must also be expected to rise.
The farm program for next year includes the same general type of price-support system that has been in effect since 1965. Farmers comply-
business review/december 1970 13

ing with Government acreage controls for cotton and grains will be eligible for both crop support loans and supplemental direct income payments. A new acreage set-aside provision for wheat, feed grains, and cotton has been included that will allow producers more flexibility in operating their farms.
There is one major change of considerable importance to the Southwest, however. The new price-support bill sets a per-crop ceiling of
$55,000 on Government payments to producers of cotton, wheat, and feed grains. Some 600 growers in these five states received more than that amount in total Government payments last year. More than half of them were in Texas. Many of these growers received over $55,000 for growing one crop and will, therefore, have major adjustments to make in their farming operations.
14
new par
b"n'~s
CARL G. ANDERSON, JR.
The Colonial Bank of Greenville, Greenville, Texas, an insured nonmember bank located in the territory served by the Head Office of the Federal Reserve Bank of DaHas, was added to the Par List on its opening date, November 9, 1970. The officers are: J. W. Munson, President; Allen B. Stephenson, Jr., Vice President; and Jack Stiles, Vice President and Cashier.
The First State Bank of McKinney, McKinney, Texas, an insured nonmember bank located in the territory served by the Head Office of the Federal Reserve Bank of Dallas, was added to the Par List on its opening date, November 12, 1970. The officers are: Paul Harden, Chairman of the Board; J. H. Muckleroy, Jr., President; C. Audie Turrentine, Vice President (Inactive); and Clyde AGeer, Cashier.
The South Texas Bank, Houston, Texas, an insured nonmember bank located in the territory served by the Houston Branch of the Federal Reserve Bank of Dallas, was added to the Par List on its opening date, November 16, 1970. The officers are: Frank A. Liddell, Jr., Chairman of the Board; Joe F. Thomas, President; Travis L. Wilson, Vice President; and W. J. Moore, Cashier.
-
-

Petroleum activity in the top two producing states of the Eleventh District, Texas and Louisiana, has been booming for several months. In response to an impending energy shortage, regulatory agencies in these two states have authorized record highs in production rates. For December, the Louisiana agency kept the rate at 75 percent of maximum efficient production. The Texas agency reduced its allowable rate from 87.3 percent to 83.5 percent. Actual production in Texas, however, is expected to be down only slightly.
The energy shortage that precipitated these high alJowables was brought on by a combination of developments. Electric utilities have faced unexpectedly high demand for electrical power. Natural gas has been in short supply as the result of a gradual decline in known reserves relative to production. Residual fuel oil has been scarce and expensive on the importdependent East Coast because of a world shortage of tankers and increasing world demand for fuel. There has also been a shortage of coal, a traditional industrial fuel. This shortage has been due to limitations on mine capacity, strong export demand, and a shortage of hopper cars. All these developments have increased presSure on domestic petroleum production - especiaUy in the Eleventh District, where reserves are great eilOugh for most of the adjustments to be made.
The seasonally adjusted Texas industrial production index was essentially the same in October as in September. Weaknesses in the aerospace, automotive, and electronics industries were responsible for a further decline in the lUanufacture of durable goods. This decline Was offset, however, by a rise in the production of nondurables and a strong advance in mining
output. All categories of nondurable production except leather goods and chemicals registered significant gains. Utilities were unchanged.
Compared with a year earlier, the October production index was up only 2.3 percent. The index would have been down substantially had it not been for the high levels of oil activity. Crude oil output was nearly 15 percent higher than in October 1969. Petroleum refining was 20 percent higher, contributing strongly to a 6-percent rise in nond urable manufacturing. Together, these advances more than made up for a 12-percent decline in the output of durables.
Total loans and investments at weekly reporting banks in the Eleventh District increased moderately in October and the first two statement weeks in November. The advance largely reflected increased borrowings by finance companies. In the face of a decline in deposits, banks financed most of this credit expansion by reducing their balances with other domestic commercial banks.
In contrast to a moderate decline during the comparable period a year earlier, total loans increased $70 million. An advance of $89 million in loans to nonbank financial institutions resulted largely from the use of bank credit lines by finance companies. Real estate loans advanced about $17 million, but demands for most other types of loans remained sluggish. Business loans declined $7 million. Consumer instalment loans were off $5 million. And loans for purchasing or carrying securities fell $2 million.
With the decline in deposits and the increased loan demand of finance companies, banks made only modest additions to their investment portfolios during this period. Holdings of U.S. Gov-
business review/december 1970 15

ernment securities declined $32 million, but holdings of other securities increased $41 million. The increase resulted mainly from acquisitions of long-term municipal obligations.
Total deposits declined $104 miUion, despite a $264 million advance in time and savings deposits. The substantial $368 million contraction in demand deposits reflected reductions in all major types of demand deposits, particularly deposits of the U.S. Government and of individuals and businesses. Much of the decline, however, stemmed from a considerable decrease in cash items in the process of collection. The expansion in time and savings deposits resulted mainly from a sizable increase in large-denomination CD's held by individuals and businesses. With greater access to tbe CD market, weekly reporting banks further reduced their outstanding borrowings from nondeposit sources.
Department store sales in the Eleventh District were 4 percent higher in the four weeks ended November 21 tban in the corresponding period last year. Cumulative sales through that date were 3 percent higber than a year earlier.
Registrations of new passenger automobiles in Dallas, Fort Worth, Houston, and San Antonio were 6 percent higher in October than in September but 27 percent lower than in October 1969. This large decline from a year earlier can be attributed primarily to the Gen-
16
eral Motors strike. Cumulative registrations for the first ten months of 1970 were 10 percent lower tban in the same period last year.
Nonagricultural wage and salary employment in the five states of the Eleventh District totaled 6,359,000 in October, essentially unchanged from September. Manufacturing employment remained weak, declining 0.9 percent from September. Most categories of nonmanufacturing employment registered only small changes. There were exceptions, however. Employment in construction was down 2.7 percent, and employment in government was up 1.5 percent. Compared with October 1969, total payrolls rose slightly less than 1.0 percent. This poor showing resulted from a drop of nearly 6.0 percent in manufacturing and an increase of only 2.4 percent in nonmanufacturing.
Softness in demand for labor has raised unemployment levels throughout the District. Most of the state employment commissions reported increased claims for unemployment compensation. ,SeasonaUy adjusted unemployment rates for District states were higher in September than a year before. Except for twO states, however, the rates were still lower than the national average of 5.5 percent. September rates were 4.0 percent of the labor force in Texas, 4.7 percent in Oklahoma, 5.3 percent in Arizona, 6.8 percent in Louisiana, and 7.0 percent in New Mexico.

STAlilSTICAL SUPPLEMENT
to the
BUSINESS REVIEW
December 1970
FEDERAL RESERVE BANK OF DALLAS

CONDITION STATISTICS OF WEEKLY REPORTING COMMERCIAL BANKS
Eleventh Federal Reserve District
(In thousands of dollars)
Item
ASSETS
Federal funds sold and securities purchased under agreements to resell •.•.••••••••••••••
Other loons and discounts, gross •••••.•..•••..••
Commercial and industrial loans •••..•..••.•.. Agricultural loans, exc1lJd ing ecc
certiflcates of interest •••..••.•...•••...•. Loans to brokers and dealers for
purchasing or carrying: U.S. Government securities •••.•.....•• • •.. Other securities ••••..•..• ..••.•.••...•••
Other loans for purchasing or ca rrying~ . U.S. Government securities ••• •.••••••••••• Other securities ••• . •••.••••••..•••.••...
loons to nonbank financial institutions: Sales finance, personal Anance, factors,
and other business credit companies ••••.•. Other •••••••. . ••••..• • •.•.••...•.. • .••
Real es tate loans •••. • •..•. •. . •.•..•.• . ...• loans to domestic commercia l banks ••••.. . •••. loans to foreign banks •••••.•..•.•••.•.•.•• Consumer instalment loans •••••.••.••..•. . •.• loans to foreign governments, offlcial
institutions, central banks, and international institutions ••••• •.• ••• ••••••.•• •••••••.••
Other loans ............................ .. Total investments ••••.• •••••••••••••••••••.••
Total U.S. Government securities ••• •.•• •• ••. • • Treasury bills .. .... . ................... . Treasury certiflcates of ind ebte dness •••••••• Tre a sury notes and U.S. Government
bonds maturing: Within 1 year ••••.••••.•.•••••••••••• 1 year to 5 years •• •.•••••••••.••• •• •• Afte r 5 years •• •••••• ••••.••• . ••••••••
Obligations of states and political subdivisions: Tax warrants and short-term notes and bills •• All other .. ............. .............. ..
Other bonds, corporate stocks, and securities: Certiflcates re presenting participations in
Federal ag ency loans • ••• ..• • •.•••••.•. All other (including corporate stocks) ..•.••••
Ca sh items in process of collection •.•.•••••••.•• Reserves with Federal Reserve Bank .••••••.••••• Currency and coin ••••.••..•.••.••.••.••••.•• Balances with banks in the Unite d States •.••••••• Balances with banks in fore ign countries •...•.••. Other a ssets (includ ing investm ents in subsidiaries
not conso lidate d) ••••••••••••.••.••..•••.••
Nov. 25, 1970
714,950 6,320,092
3,003,940
104,910
507 44,937
971 440,303
243,840 384,423 646,656
4,719 9,136
736,482
° 699,268 2,804,791
967,903 107,665
° 189,804 573,294
97,140
42,069 1,609,298
83,950 101,57 1
1,152,191 957,386 85,111
470,361 9,323
459,533
Oct. 28, 1970
557,000 6,243,185
2,962,681
103,057
507 33,241
1,779 426,121
203,558 418,428 643,392
5,445 9,2 39
744,793
° 690,944 2,779,982
946,172 135,952
° 172,943 553,260
84,017
50,943 1,594,868
100,050 87,949
1,072 ,264 827,915
91,101 475,605
8,105
479,92 9
Nov. 26, 1969
389,972 5,977,082
2,960,231
109,223
555 42,751
740 393,447
125,828 336,024 664,009
11,265 8,390
713,395
° 611,224 2,480,174
930,424 35,878
° 134,359 623,996 136,191
30,299 1,396,799
53,559 69,Q93
1,140,255 719,035
79,494 507,765
6,686
448,031
TOTAL ASSETS.. ......... ...... .. .. . ... 12,973,738 12,535,086 11 ,748,494
LIABILITIES
Total deposits ••••••. ••.•• ... • •.••.••. •.•.•• 10,291,978 9,993,714 9,175,973 ----
Total demand d eposits ••••••••••.••.•.•.••• 5,894,058 5,812,742 5,818,010 Individuals, partnerships, and corporations •••• 4,007,3 64 4,040,053 4,044,914 States and political subdivisions • •••....•.•• 346,930 247,876 356,248 U.S. Government • ••••••.•.•••.••• . •••••. 101,329 132,587 131,920 Bonks in the United States ...... . . ......... 1,324,301 1,278,036 1,176,773 Foreign:
Governments, official institutions, central banks, and in ternat ional institutions . ••• • 2,677 2,853 3,570
Comm ercia l banks •. " •• . •••.•••••.•••• 24,317 23,709 25,410 Certifie d and offlcers' checks, e tc ...••••.• 87, 140 87,628 79,1 75
Total time and savings d eposits •••.••••..•.•• 4,397,920 4,180,972 3,357,963 Individuals, partnerships, and corporations:
Saving s d e posits • • • ••• . •••.•...••.••.. 935,726 931,595 943,182 Other time d eposits •••.•.•••• , ••.••• . •. 2,500,841 2,342,857 1,754,943
States and politica l sub divisions ••....••.••. 847,000 784,319 628,638 U.S. Government (including postal savings) ••• 39,023 36,243 5,067 Banks in the United States ................. 56,945 66,073 19,273 Foreign:
Governments, offlcial institutions, central banks, and in ternationa l insti tutions ••••• 17,285 18,785 5,500
Commercial banks •.•• • • .•. • ••• •• ...••. 1,100 1,100 1,360 Fed era l funds purchased and securities sold
under a greements to re purcha se •••••.•.••... 1,054,760 908,727 928,037 Other liabilities for borrowed money .•• .•• ... ... 95,159 84 ,819 170,322 Other liabilities •••. •••• • • ••.•.•••... . ••.•••. 359,941 376,064 369,412 Reserves on loans ....•.•••..••..•.•.•....••. 128,846 127,670 116,583 Reserves on securities ••••••••..•.••..•..•••.. 16,989 16,520 10,623 Total cap ito l accounts •.•.. •.••.• . • • • • , .•••.•. 1,026,065 1,027,572 977,544
----- ----- -----TOTAL LIABILITIES, RESERVES, AND
CAPITAL ACCOUNTS .................. 12,973,738 12,535,086 11,748,494
RESERVE POSITIONS OF MEMBER BANKS
Eleventh Federal Reserve District
(Averages of da ily figures. In thousands of dollars)
-4 wee ks ended 5 weeks end ed 5 weeks ended
Ite m Nov. 4, 1970 Oct. 7, 1970 Nov. 5, 1969
RESERVE CITY BANKS Total reserves he ld .•• •.• •...•. 765,711 783,743 732,869
With Federal Reserve Bonk •••• 710,627 728,425 681,317 Currency and coin ..• .. .. . •.. 55,084 55,318 51,552
Required reserves ••••.••••••.• 773,047 779,708 722,360 Excess reserves . •• . ..• .• .••..• -7,336 4,035 10,509 Borrowings •. • .•.........••..• 1,275 2,314 15,166 Free reserves • .••.• ... •• ..•. .. -8,611 1,721 -4,657
COUNTRY BANKS Total reserves held •••. .•.. .. • • 794,847 793,952 773,084
With Fe deral Reserve Sank •.•• 605,499 606,819 595,200 Currency and coin .•. .... .. . . 189,348 187, 133 177,884
Required reserves • • ••..• ••.. •. 772,111 772,B74 750,OB6 Excess reserves •.••....•...••. 22,736 21,078 22,998 Borrowings •..•...••••. . ••.•.. 2,315 4,270 13,287 Free reserves •.•... . • ... .• • ••• 20,421 16,808 9,711
ALL MEMBER BAN KS Total reserves he ld ••• .. ...•.•• 1,560,558 1,577,695 1,505,953
W ith Federal Reserve Bonk .•• • 1,316,126 1,335,244 1,276,517 Currency and coin •.• • .•••.• • 244,432 242,451 229,436
Required reserves . •••...•. • • .. 1,545,158 1,552,582 1,472,446 Excess reserves ••• ... ••.•••.•• 15,400 25,113 33,507 Borrowings • ..• .••••...••••.•• 3,590 6,584 28,453 Free reserves • •••.• .•...• •• • • . 11,810 18,529 5,054
CONDITION OF THE FEDERAL RESERVE BANK OF DALLAS
(In thousands of dolla rs )
= Nov. 25, Oct. 28, Nov. 26,
1970 1970 1969 Ite m ---------------------------------------------Total gold certiflcate reserves • •••••• .••••••. Discounts for member bonks ••.•...•••.••••. Other discounts and advances •• .• • •. ••••. .• U.S. Government securities ••• .. • . ••.• .. • ... Total earn ing assets .. . .•..............•... Member bonk reserve d eposits •• .••.• . •. •... Federal Reserve notes in actual circulation ••• •.
628,238 50
° 2,650,378 2,650,428 1,498,680 1,881,012
352,640 2,450
° 2,680,937 2,683,387 1,356,603 1,847,644
292,972 22,79~
2,493,6155 2 516,40
1 :245,705 1,699,971
-------------------------------------------------------------------
CONDITION STATISTICS OF ALL MEMBER BANKS
Eleventh Federal Reserve District
(In millions of dollars)
= Oct. 28, Sept. 30, Oct. 29,
Ite m 1970 1970 1969 .-ASSETS
loons and discounts, gross • •••••••••• • •. •. 12,191 11,982 11,297 U.S. Government obligations •••.•••••. " •. 2,116 2,110 2,138 Othe r securities •• •••.•.. .•. .. ••• •• .•. •• 3,612 3,533 3,180 Reserves with Federal Reserve Bank •••••.• • 1,357 1,405 1,236 Cash in vault •••.•• • • . .•...•.•••.•.•••• 273 269 262 Balances with bonks in the Unite d States •..• 1,323 1,454 1,17~ ealances with banks in fo reig n countriese .... 10 11 Cash items in process of coll ection . • .. ••.•. 1,243 1,426 1,213 Othe r a sse tse ••••.••••...•..••••.•.••.• 93 4 944 732 ---
TOTAL ASSETse ... •.•.•.•••.•... •.•. 23,059 23 ,134 ~ =-L1A81L1TIES AND CAPITAL ACCOUNTS
1,507 Demond d e posits of banks •..•. ...••.. . . . 1,676 1,800 Other d emand d e posits ••.• •••.••• .• .• . •• 8,994 9, 193 8,770 Time d e posits ••..•.••...• •.•.•.••• .•. . • 8,408 8,184 7,285 ---
Total d eposits • • • • ..•...••...• • . • •..• 19,078 19,177 17,562 1,035 Sorrowings . •. ... .•.••...•. . .• • •••••.•. 1,046 963
Othe r lia bilitiese ..•...•.••...•.•.•••.•• 1,102 1,181 927 1,721 Total capital acccuntse .•.•....•.•..••••. 1,833 1,813 -TOTAL LIABILITIES AND CAPITAL
11W ACCOUNTSe •.•...•.....•.•...•.•. 23,059 23,134 =:=:::--e - Estimated .

Standard metropolitan statistical orea
ARIZONA Tucson _ ••.. ........... . .... •.. . • . .....•. . LOUISIANA, Monroe ...•..••....•..•.. ••... .••......
Shreveport . . ............ . ..........•... .
NEW MEXICO, Roswell ' • . •.••••. ...•.••• . .. .• .. . •.. . TEXAS, Abilene .• •• . .....•........•.. " .•.••.•......
Amarillo ... . ................ .. . ..• . . .... . .. . Austin . .............. ....... .... ... ........ . Beoumont·Port Arthur. Orange . . . ......•.... . .. . Brownsville-Harling en-Sa n Benito . ..... . • .. • •. .•.
I~I~~:l:is:t j' { ; ; ; ; ; ; ; ; ; ; ; ; ; ; ; ; ; ; ; ; ; ; ; ; ; ; ; ; ; ; Galveston-Texa s City . ......•. . ........•.. . ...
~[i~~nk':': : : : : : : : : : : : : : : : : : : : : : : : : : : : : : : : : : : McAlien-Pha rr-Edinburg •.••... ••.•• • • • .• • •. •...
f~~!~~;o~;~': ~ : : : : : : : : : : : : : : : : : : : : : : : : : : : : : : : iherman.Denison ... ......................... .
exa rkano (Texa s-Arkansa s) .• . . ........ .. .• . ..
~:~~i~: ~~il;:: : : :::::: : :: : :: :::: : : ::::::: : :: Total-28 centers .... ....... ... ... . ............... ..
BANK DEBITS, EN D-Of-MONTH DEPOSITS,
AND DEPOSIT TURNOVER
(Dollar amounts in thousan d" seasona lly adiusted)
DE81TS TO DEMAND DEPOSIT ACCOUNTS'
Octob er 1970
(Annual-ra te ba sis)
$ 7,235,700 2,605,680 8,560,1 28
914,328 2, 146,2 12 5,986,140 9,0 13,956 6,050,712 1,972,344 6,58 1,3 16
420,024 124,755,840
7,52 3,688 22,612,872
2,862,372 100,880,904
916,464 4,568,832 1,603,656 2,018,688 1,668,288 1,183,572
18,823,260 993,084
1,384,764 2,385,3 12 2,909,772 2,470,944
$35 1,048,852
Percent chang e
October 1970 from
September October 1970 1969
-6 17 -4 -2 -6 -3
- 3 3 8
-3 6 7 5
-1 -4 16 15 11 31
4 -3 -3 3
1 8 -1 9 -4 12
0 3 0 3
- 11 1 5 - 1
-4 -4 3 -5
-4 -4 9 19
-8 _4 -8 - 6
8 4 2 -1 6 0
- 1
10 months, 1970 from
1969
19 8
16 5 5
10 - 1
0 13 9 7 9 9
10 11 10 11 2 5 1 5 7
12 8
-7 3 9
- 1
1 Deposits of individuals, partnerships, and corporations and of stotes and political subdivi sions. !! County basis.
DEMAND DEPOSITS'
Annual rate of turnover
October 31, 1970
October September October 1970 1970 1969
233,870 31.1 33.5 27.9 85,333 30.4 30.5 30.4
244,538 35.5 37.4 37.4 39,423 23 .8 22 .6 25.1
103,310 20.8 20.5 19.8 158,287 37.9 38.2 35.9 288,459 30.0 26.0 31.4 238,450 25.6 25.6 27.3 78,9 11 25.4 23.5 24.0
286,278 24 .0 2~. 1 24.5 29,010 14.0 12.7 14.6
2,138,366 57.7 58.1 57.7 242,690 31.2 31.0 30.4 634,262 35.5 35.6 33.3 111,216 25.1 26.0 24.3
2,501,521 40.8 40.7 40.3 40,868 22.8 23.6 22.9
171,742 26.3 28.7 27.7 100,507 16.2 16.0 17.6 131,219 15.3 15.8 15.7
82,500 18.9 17.3 24.1 65,495 17.8 18.3 17.9
626,832 29.6 26.5 26.8 62,775 15.4 16.5 16.2 70,286 19.4 20.7 21.7 94,33 1 24.8 22.6 24.5
115,048 25.1 23.9 25.2 115,070 21.3 19.9 21.1
$9,090,597 38.6 38.5 38.4
GROSS DEMA ND AND TIME DEPOSITS Of MEMBER BANKS
Eleventh federal Reserve District
BUI LDING PERMITS (Averages of daily flgures . In millions of dolla rs )
VALUATION (Dollar amounts in thousands) GROSS DEMAND DEPOSITS TIME DEPOSITS
Percent change Reserve Country Reserve Country Dale Total city banks banks Total city banks banks
Oct . 1970 NUMBER from 1968, October . •• 10,201 4,75 1 5,450 7,394 3,116 4,278
10 months, 1969, October ... 10,306 4,726 5,580 7,223 2,646 4,577 Oct. 10 mos . Oct. 10 mos . Sept. Oct . 1970 from
Area 1970 1970 1970 1970 1970 1969 1969 1970, May . • .•.. 10,233 4,671 5,562 7,394 2,659 4,735 June • ..••. 10,265 4,748 5,5 17 7,391 2,651 4,740
ARIZONA July ....... 10,41 2 4,782 5,630 7,511 2,722 4,789
Tucson . . •• . . •• 508 5,808 4,155 $ 49,525 -44 32 -4 August. ••• 10,530 4,816 5,7 14 7,783 2,926 4,857 September . 10,658 4,885 5,773 8,088 3,162 4,926
LOUISIANA October . . . 10,684 4,860 5,824 8,317 3,305 5,012 Monroe-West
Monroo .•.. . 90 708 956 12,70 1 _ 17 -36 15 Shreveport . . .. 508 4,6 48 2,218 26,702 16 -25 -22
TEXAS Abilene •• .• •.• 42 401 375 7,485 -26 -87 -33 Amarillo •• •... 120 3,5 11 1,0 13 27,164 -43 -64 - 22 VALU E Of CO NSTR UCTIO N CONTRACTS Austin ... .... . 416 4,081 12,4 15 107,428 55 -39 -21 Beaumont • • .• " 149 1,486 392 8,112 -43 -56 - 14 Brownsville ••• • 96 731 676 5,483 348 124 -25 (In millions of dolla rs )
Corpus Christi . . 926 3.651 3,957 23.047 381 31 6 Dallas •••..•• . 1,568 18,496 33,76 1 292,093 38 151 4 January- October Denison •••••. • 44 386 103 3,142 -4 24 21 EI Pa so • ..•... 438 4,584 5, 160 82,970 -74 -2 1 12 October September August
Fort Warth ••. . 382 3,9 13 6,181 74,362 -44 50 16 Area and type 1970 1970 1970 1970 1969r
Ga lveston .... . 42 669 297 6,207 -79 -69 -65 Houston • • •• . • 2,078 28,903 29,66 1 38 1,997 -48 -31 3 FIVE SOUTHWESTERN laredo . . . .. . . 46 474 321 6,089 14 -80 55 STATES' . ........ ·· · .. · . 597 558 753 6,620 5,816
Lubb ock ...... 146 2,076 2,966 45,215 71 48 83 Resid ent ial build ing • •• .. •• 270 269 331 2,568 2,398
Mid land ..... '. 39 519 185 3,86 1 -58 - 10 -27 Nonresidentia l building . ... 201 183 285 2,175 1,921
Od essa ..... . . 57 735 533 8,528 -65 26 17 Nonbuilding construction . .. 127 107 137 1,877 1,497
Port Arthur . . . . 79 766 211 7,105 23 - 16 - 10 UNITED STATES .... ... .. .. . 5,453 5,398 6,230 57,364 57,945 San Ang elo ..• 51 555 519 9,457 30 47 76 Residential building . ...... 2,302 2,176 2,349 20,611 21,853 San Antonio .. . 1,271 12,955 9,226 85,570 31 48 21 Nonresidential building . ... 1,863 1,944 2,331 20,949 22,020 Sherman .. . ... 63 688 1,613 12,625 275 351 -28 Nonbuild ing construction . .. 1,289 1,278 1,549 15,803 14,072 TOl(arkana . ... 35 297 174 5,824 -34 -35 -4 Waco . . ..... . 184 2,037 1,633 30,524 68 108 86 Oklahoma , and Texas . Wichita Falls . • 79 710 771 10,844 30 -84 -34 1 Arizona, Louisiana, N ew Mexico,
------- r - Revised.
10tal_26 cities .• 9,457 103,788 $11 9,472 $1,334,060 -20 - 3 NOTE . - Deta ils may not add to total s because of rounding . SOURCE, f. W. Dodge, McGraw-Hili, Inc .

CROP PRODUCTION
(In thousands of bushels)
TEXAS FIVE SOUTHWESTERN STATES'
1970, 1970, estimated estimated
Crop Noy.l 1969 1968 Noy.l 1969 1968
Cotton2 •••• •• ••• 3,353 2,862 3,525 4,723 4,415 5,244 Corn ........... 28,329 25,124 26,052 39,478 34,266 36,871 Winter wheat. ... 54,408 68,856 84,150 167,7 15 197,619 218,974 Oats ........... 28,140 25,460 19,822 36,332 33,058 25,450 8arley •••• ....• 4,394 3,290 3,348 35,340 29,096 26,856 Rye •• •• •. •. .. . . 736 684 528 1,762 1,664 1,208 Rice3 ••••••••••• 22,135 21,646 27,164 42,895 42,420 53,306 Sorghum gra in •.. 356,706 309,800 340,780 411,912 368,740 402,729 Flaxseed ..•.. .• 1,127 1,300 742 1,127 1,300 742 Hay 4 ••••••••••• 4,211 3,451 4,587 9,637 9,136 10,418 Peanuts5 •••••••• 420,000 389,070 426,300 650,360 610,549 671,476 Irish potatoes 6 ••• 4,306 4,437 4,382 7,893 8,084 7,624
~:c~e:s~~t.a.t~~~~.: 1,040 780 960 5,044 5,200 5,120 38,000 23,000 69,000 71,000 73,900 97,000
1 Arilono, loui siana, New Moxico, Oklahoma, and Texas . !! In thousands of bales. 3 In thousand s of bags containing 100 pounds each. " In thousands of tons. I) In thousands of pounds. o In thousonds of hundredweight. SOURCE, U.S. Department of Agriculture.
COTTON PRODUCTION
Texos Crop Reporting Districts
(In thousonds of boles - 500 pounds gross weight)
1970 1970, indicated
Noy. l as percent of
Area
l·N - Northern High Plains ......... . l -S - Southern High Pla ins • •••••• . •• 2-N - Red Bed Plains ••..•••• . .... • 2-S - Red Bed Plains ••.•.••.•..... 3 - Western Cross Timbers . ..... . . 4 - Black and Grand Prairies ..... . 5-N - East Texas Timbered Plains ... . 5-S - East Texas Timbe red Plains •.•• 6 - Trans· Pecos ........ . .... ... . 7 - Edwards Plateau ..•.• •. . •••• 8·N - Southern Texas Pra iri es .•. . .. . 8-S - Southern Texas Prairies ...... . 9 - Coa stal Prairies .•.•..........
10·N - South Texas Plains ••••.•..•.. 10·S - Lower Rio Grande Volley • • •. • .
State . • •• .•..••.• . •. . . • . •• . .•..
380 1,450
155 310
15 375
25 35
138 50 60 50
100 15
195
3,353
SOURCE, U.S. Deportment of Agriculture.
1969
248 1,134
179 213
15 258
15 34
144 49 50
106 93 17
307
2,862
1968
211 1,384
312 372
20 409
19 41
189 72 57 93 79 25
242
3,525
NONAGRICULTURAL EMPLOYMENT
Five Southwestern States'
Number of persons
October September October Type of employment 1970p 1970 1969r
Total nonagricultural wage and salary workers .. 6,359,000 6,358,200 6,302,900 Manufacturing .... . .. . . .• 1,130,000 1,140,700 1,196,700 Nonmanufacturing ........ 5,229,000 5,217,500 5,106,200
Mining ...... . ..... . .. 228,400 229,100 232,100 Construction .... .. . .... 397,400 408,300 415,500 Transportation and
public utilities ••.... .. 469,700 469,300 453,700 Trade ........ . ....... 1,491,000 1,485,300 1,441,100 Finance ..•. .......... . 325,300 325,700 313,000 Service •..... . ....... . 1,029,400 1,031,300 992,300 Government •. ......... 1,287,800 1,268,500 1,258,500
1 Arizona, louisiana, New Mexico, O klahoma, and Texas. p - Prelimi nary. r - Revised. SOURCE, State emp loymen t agencies.
1969
153 128
87 146 100 145 167 103
96 102 120 47
108 88 64
117
Percent chang e Oct . 1970 from
Sept. Oct. 1970 1969
0.0 0.9 -.9 -5.6
.2 2.4 -.3 -1.6
-2.7 -4.4
.1 3.5
.4 3.5 -.1 3.9 -.2 3.7
1.5 2.3
DAILY AVERAGE PRODUCTION OF CRUDE OIL
(In thousands of barrels )
Percent change from
October Septemb er October September October Area 1970 1970 1969r 1970 1969
FOUR SOUTHWESTERN STATES ••..• . •••..••..• • 7,242.3 7, 123.5 6,387.9 1.7 13.4 louisia na .. ..... . ...... . 2,714.2 2,639.4 2,254.4 2.8 20.4 New Mexico ..•.......... 345.9 359.2 360.7 -3.7 -4.1 Oklahoma •...• ... •..• .. 606.2 600.9 612 .0 .9 -1.0 Texas ..............•... 3,576.0 3,524.0 3,160.8 1.5 13.1
Gulf Coa st •.... •.•.•.. 711.4 701.8 631.2 1.4 12.7 W est Texa s ........... 1,730.9 1,701.5 1,516.2 1.7 14.2 East Texas (prop er) • • • .. 211.7 209.5 160.5 1.1 31.9 Panhandl e .. . .. .• .... • 86.9 85.3 79.9 1.9 8.8 Rest of state .... ...... . 835.1 825.9 773.0 1.1 8.0
UNITED STATES ••.•.. . ••... 10,025.5 9,878.6 9,188.5 1.5 9.1
SOURCES: American Petroleum Institute . U.S. Bureau of Mines. Federol Reserve Bonk of Dallas.
TOTAL OI L WE LL S DR ILLED
=-Percent change,
Arst quarter 1970 from -First Fourth Fourth first quarter quarter quarter quarter
Area 1970 1969 1969 1969
FOUR SOUTHWESTERN STATES . .• • 1,862 2,191 -15.0 7.3 louisia na .... ... ... ........... 273 365 -25.2 _2.5
Offshore ................... . 75 140 -46.4 -19.4 Onshore ...... . ...... ...... . 198 225 -12.0 5.9
New Mexico . • .... ............. 96 106 -9.4 95.9 Oklahoma •••••..•. ••• • •..•• .. 386 476 - 18.9 _11.3 Texas .... ....... ... .... ... . .. 1,107 1,244 -11.0 13.9
Offshore •••••..•••••.••..•.• 1 3 -66.7 -75.0 Onshore .................... 1,1 06 1,241 -10.9 14.3
UNITED STATES ••• •.... ••..••. ••• 3,298 4,367 -24.5 .5
SOURCE: Americon Petroleum Institute.
INDUSTRIAL PRODUCTION
(Seasonally adjusted indexes, 1957·59 = 100)
Area and type of index
TEXAS Total industrial production . ... . .
Manufacturing •.............. .. Durable ••• •.. ••..• •. ..••..•• Nondurable .... .... . ... ..•. ..
Mining ...................... . Utiliti es .. ...... .... ...• . ... . ..
UN ITED STATES Total industrial production ..•...
Manufacturing ................ . Durable • • ••• .•• •• •..• .. ••••• Nondurablo . . . .. ..... . ..... . .
Mining .. . ................... . Utilities . ..................... .
p - Preliminary. r- Revised.
October 1970p
181.4 197.2 200.4 195.1 142.1 274.3
162.3 160.2 153.9 168.2 135.4 240.0
September 1970
181.4 198.5 205.3 193.9 140.4 274 .3
166.1 164.2 160.5 168 .7 139.5 238.5
SOURCES, Boord of Goyernors of the Federal Reserye System. Fede ral Reserye 8ank of Dallas.
= August October 1970 1969
178.4r 177.2r 196.6r 201.0 208.4 226.9r 188.8r 183.8r 135.0r 127.3r 274.3r 261.9r
169.0r 173.1 I 67.9r 173.9r 166.5r 177.3 169.8r 169.5r 137.2r 130.2 235.8r 226.0r -