Embed Size (px)
Citation preview
BUSINESS STUDIES
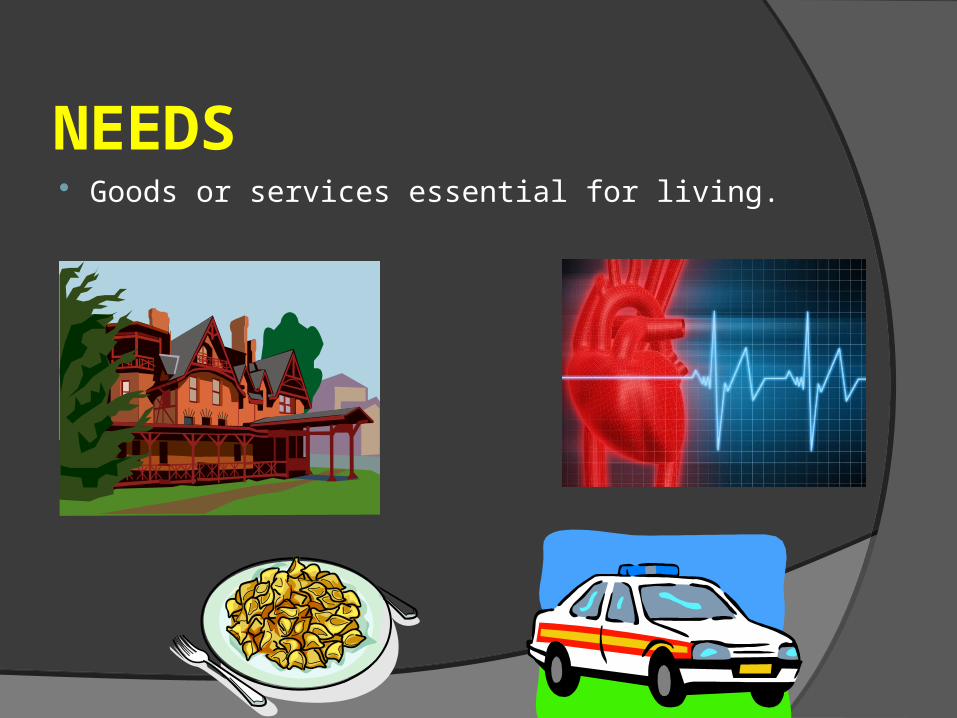
NEEDS
Goods or services essential for living.
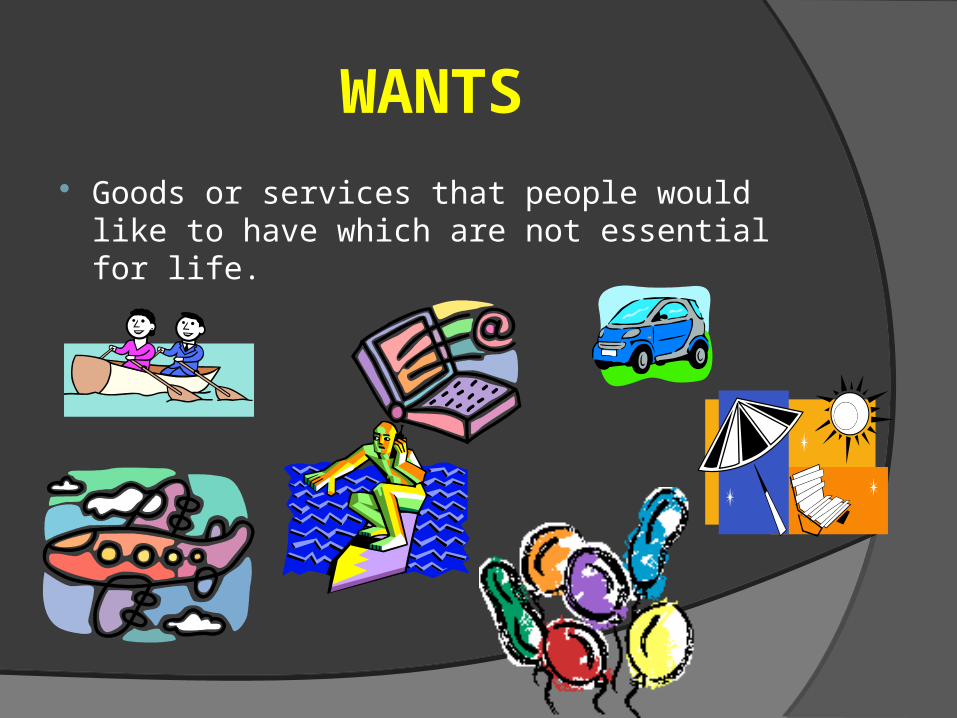
WANTS
Goods or services that people would like to have which are not essential for life.
RESOURCES
Factors of production○ Land- Natural resources
○ Labour- Efforts of people
○ Capital- Finance and equipment
○ Enterprise- skill to bring the resources together to produce a good or service. (Person: entrepreneur)
SCARCITY
The factors of production are limited in supply.
There are never enough to produce all the needs and wants of a whole population.
There is an economic problem.
THE NEED TO CHOOSE
As there are limited resources for unlimited wants, people have to decide which wants they will satisfy and which they will not.
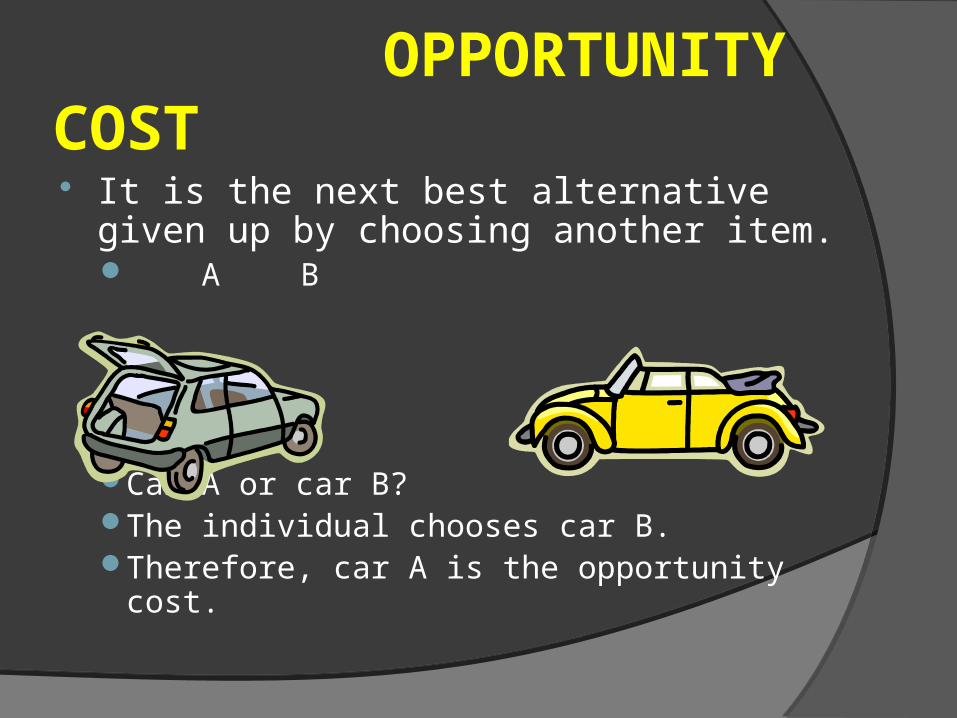
OPPORTUNITY COST It is the next best alternative given up by
choosing another item. A B
Car A or car B? The individual chooses car B.Therefore, car A is the opportunity cost.
COSTS – REVENUE - PROFIT. COSTS- Expenses incurred by a firm in
producing and selling its products. They include expenditure on wages and raw materials.
REVENUE- It is the amount of money a firm gets from selling a good or service.
PROFIT- It is the difference between what it costs to produce something and what it is sold for. (Price-Costs).
COSTS
FIXED- Are the same regardless the production.
VARIABLE- Increase with the amount produced.
TOTAL- Are fixed costs + variable costs.
AVERAGE- Are Total Costs devided by the output.
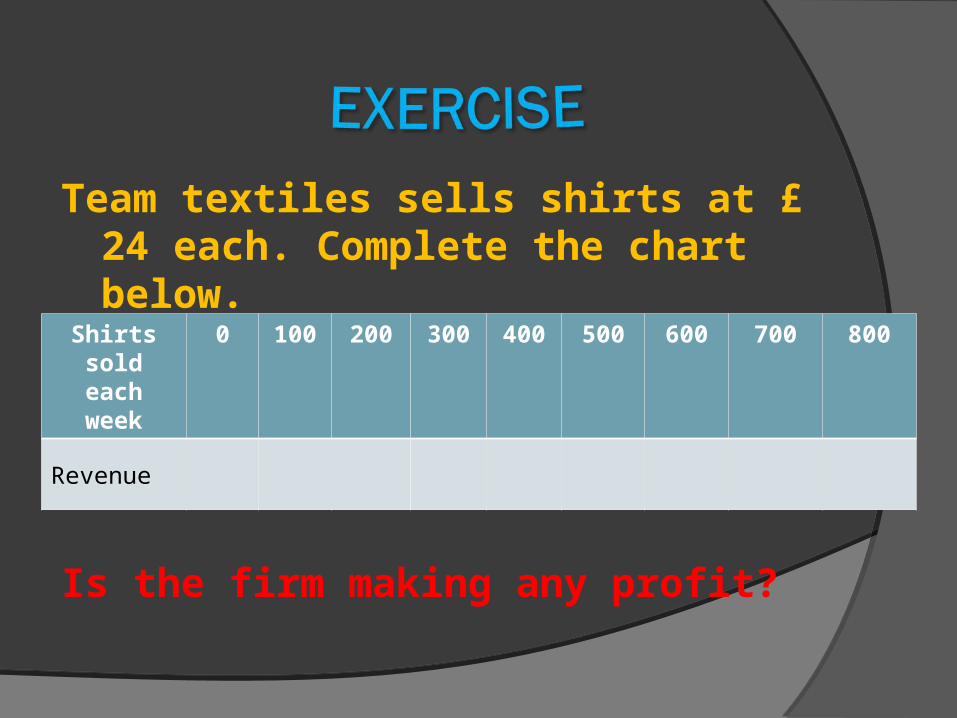
Team textiles sells shirts at £ 24 each. Complete the chart below.
Is the firm making any profit?
Shirts sold each week
0 100 200 300 400 500 600 700 800
Revenue
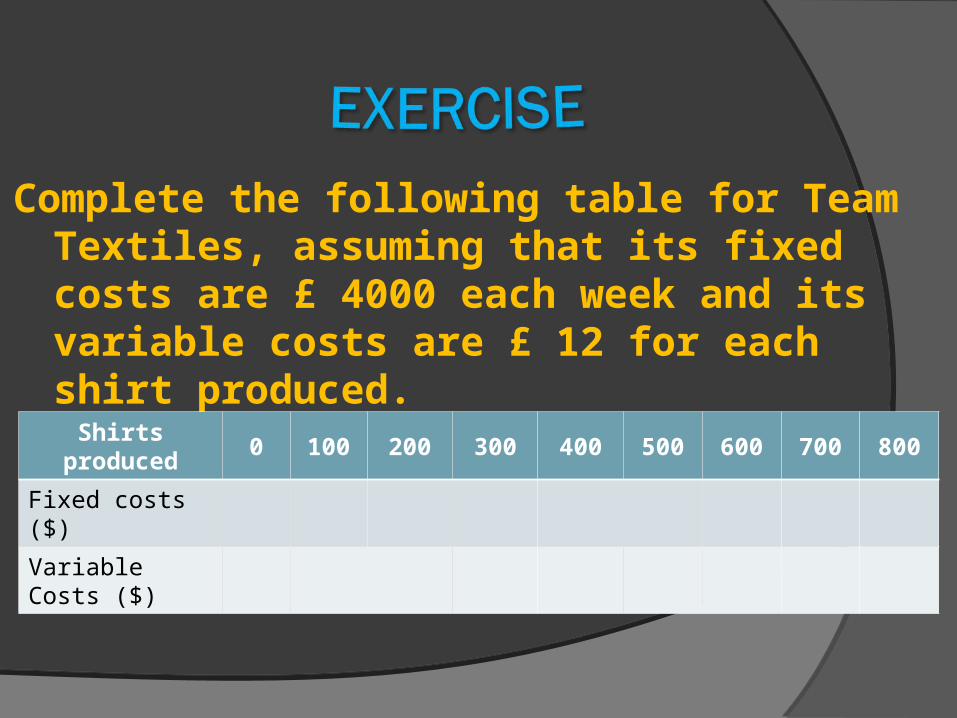
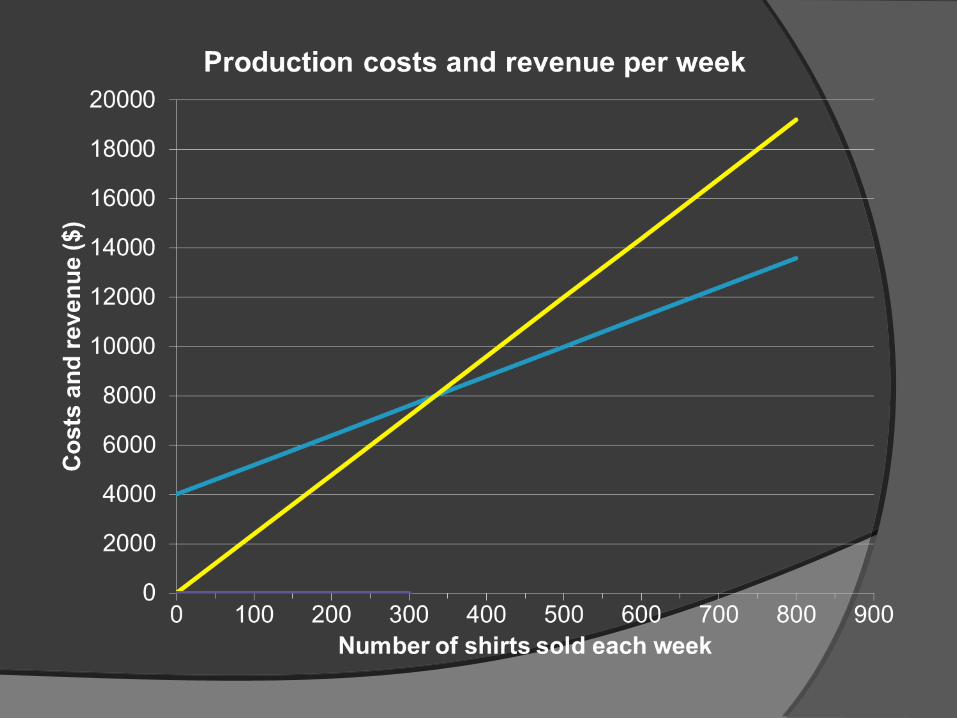
Complete the following table for Team Textiles, assuming that its fixed costs are £ 4000 each week and its variable costs are £ 12 for each shirt produced.
Shirts produced 0 100 200 300 400 500 600 700 800
Fixed costs ($)
Variable Costs ($)
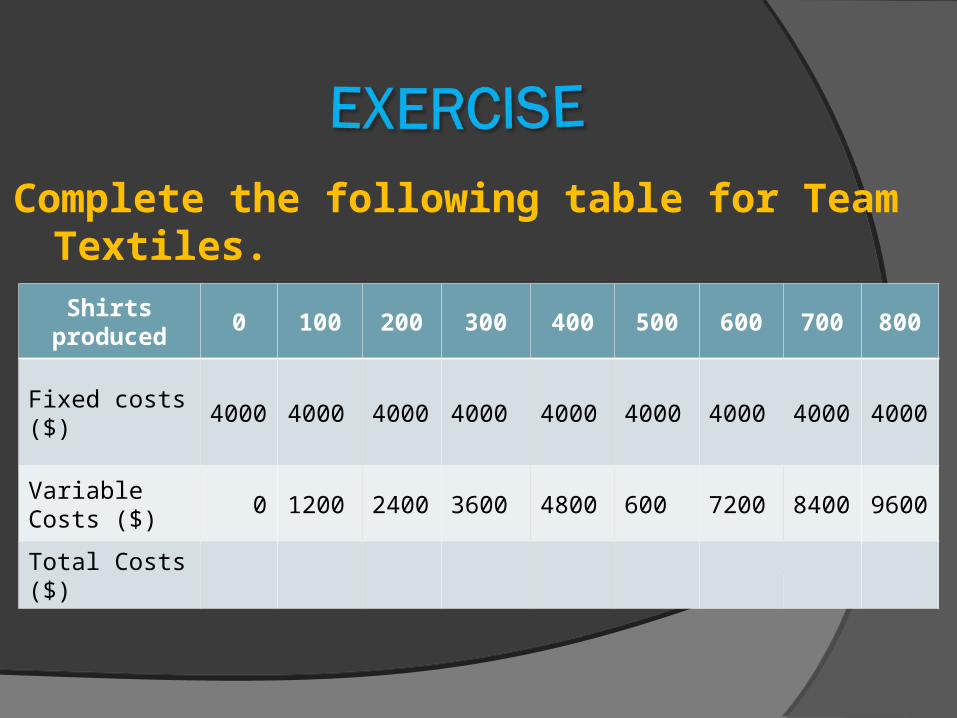
Complete the following table for Team Textiles.
Shirts produced
0 100 200 300 400 500 600 700 800
Fixed costs ($) 4000 4000 4000 4000 4000 4000 4000 4000 4000
Variable Costs ($)
0 1200 2400 3600 4800 600 7200 8400 9600
Total Costs ($)
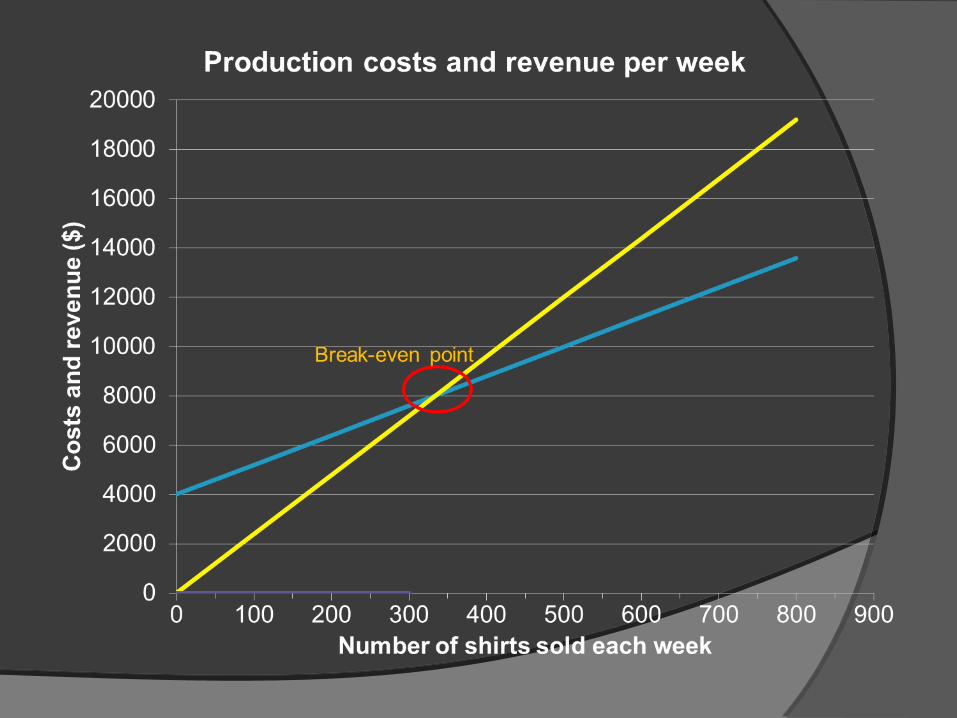
BREAK- EVEN POINT Break – even point is the point at which
an organisation covers its costs with the money it makes through sales.
A break-even chart is prepared in advance to see how much the business needs to sell at a particular price.
BREAK- EVEN POINT Break – even point is expressed in
terms of the quantity of items made or sold.
An alternative method for calculating break-even is to devide the total fixed cost by the contribution from selling each unit.
The contribution of a product is selling price less variable cost.
CASE STUDY