Embed Size (px)
Citation preview
An Integrated Approach to Business
Value Management
Quantifying and Achieving Strategic Goals
February 2011
Copyright 2011 by Point B. All rights reserved.
February 2011 Business Value Management Slide 2
Topics
• Defining Business Value Realization (BVR)
• Converting Business Goals into Results
• An Integrated Approach to Business Value
Management
• Valuation
• Putting It All Together (example)
February 2011 Business Value Management Slide 3
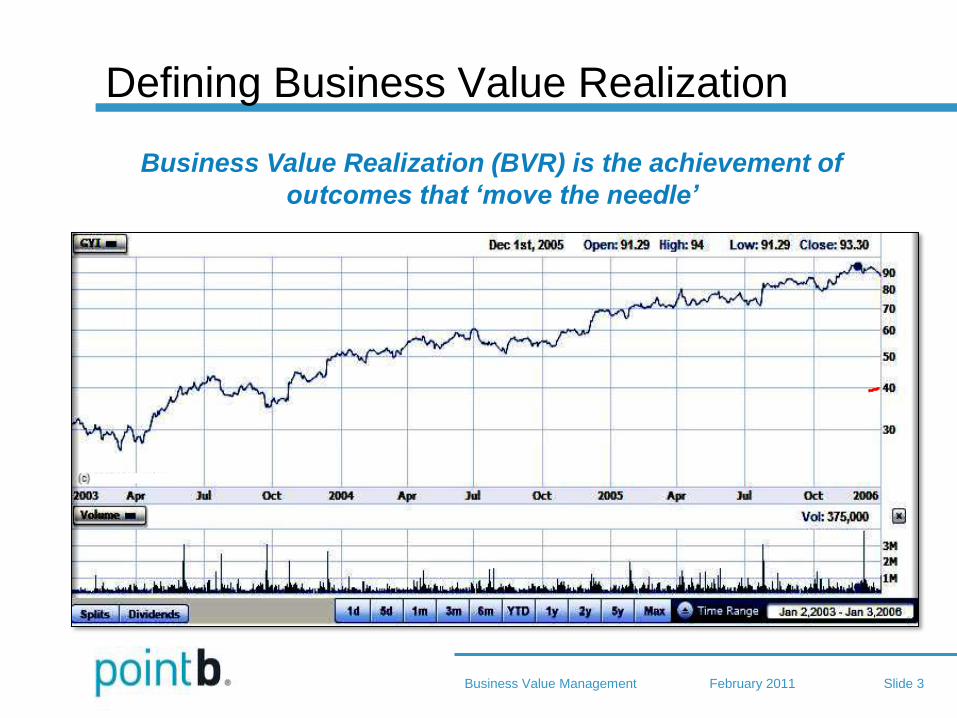
Defining Business Value Realization
Business Value Realization (BVR) is the achievement of
outcomes that ‘move the needle’
February 2011 Business Value Management Slide 4
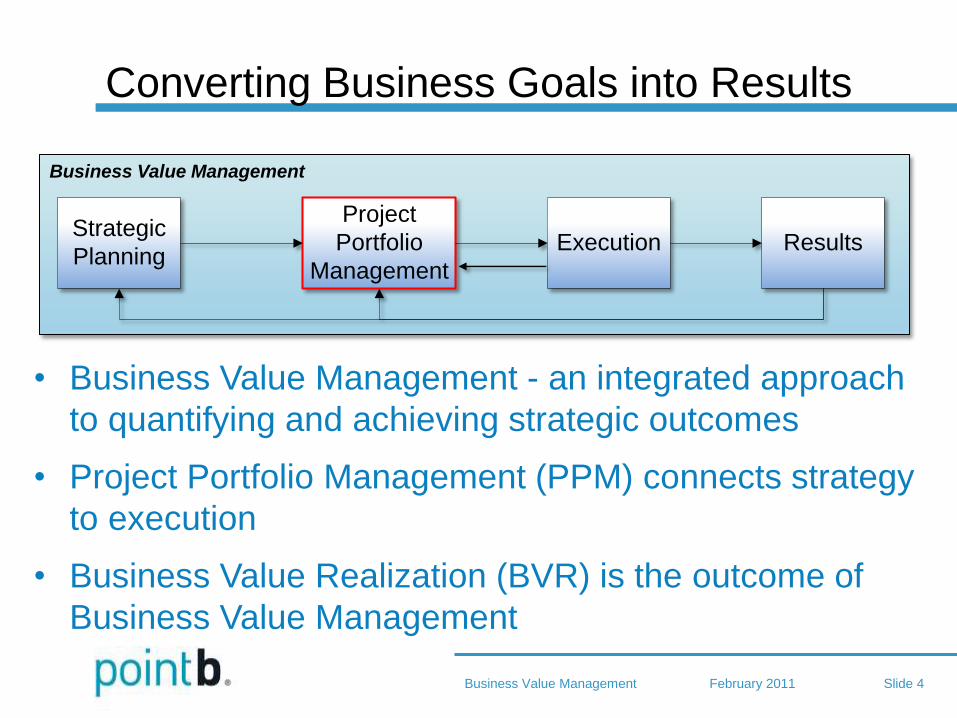
Converting Business Goals into Results
• Business Value Management - an integrated approach
to quantifying and achieving strategic outcomes
• Project Portfolio Management (PPM) connects strategy
to execution
• Business Value Realization (BVR) is the outcome of
Business Value Management
Business Value Management
ResultsStrategic
PlanningExecution
Project
Portfolio
Management
February 2011 Business Value Management Slide 5
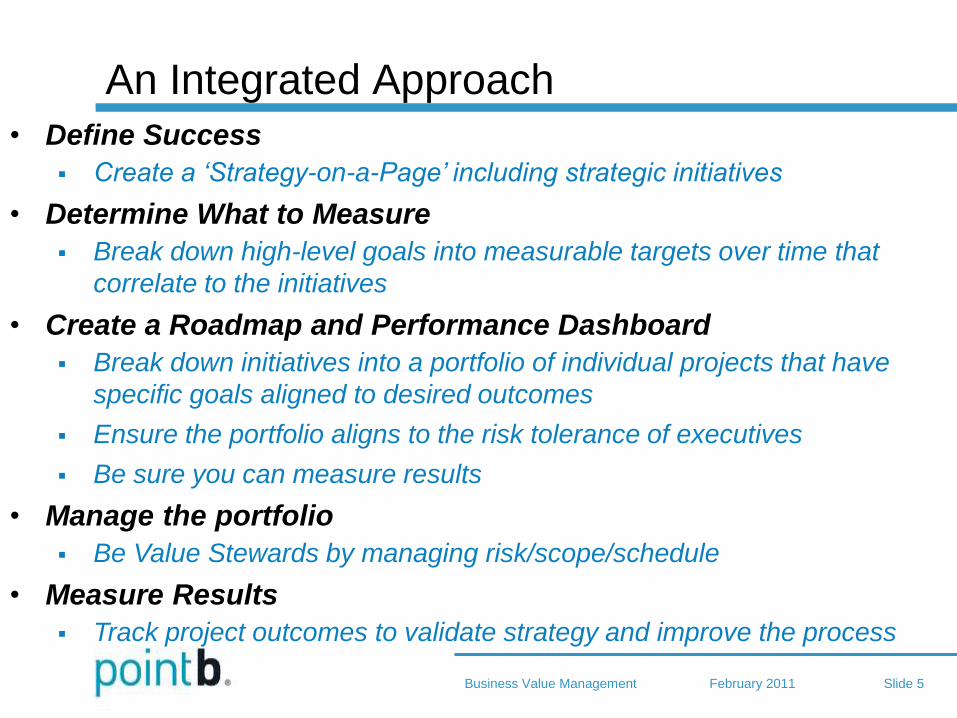
An Integrated Approach
• Define Success
Create a ‘Strategy-on-a-Page’ including strategic initiatives
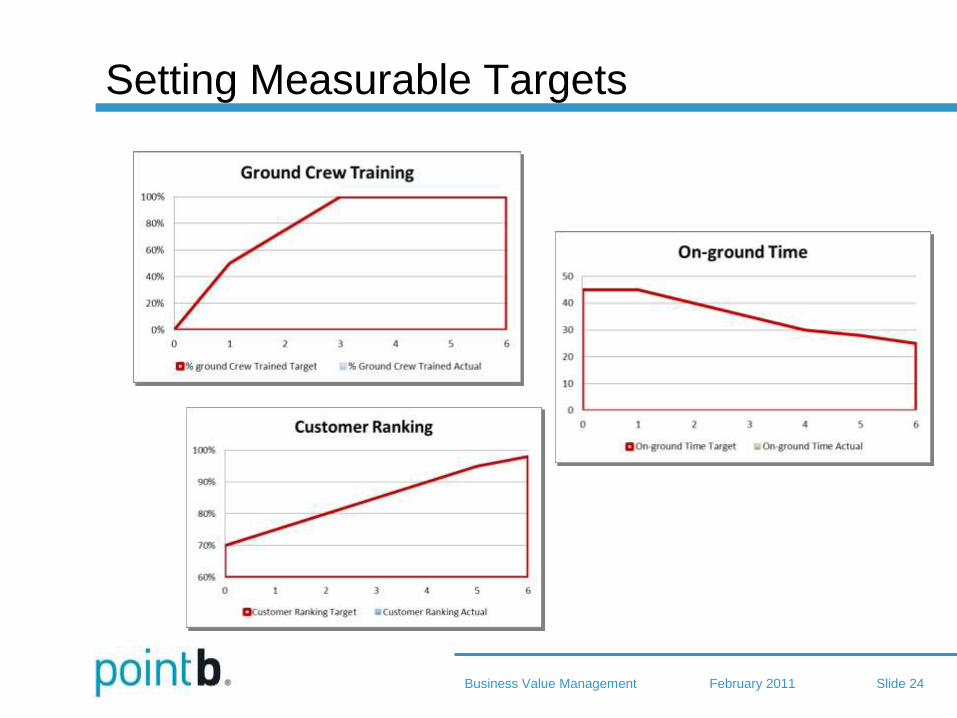
• Determine What to Measure
Break down high-level goals into measurable targets over time that
correlate to the initiatives
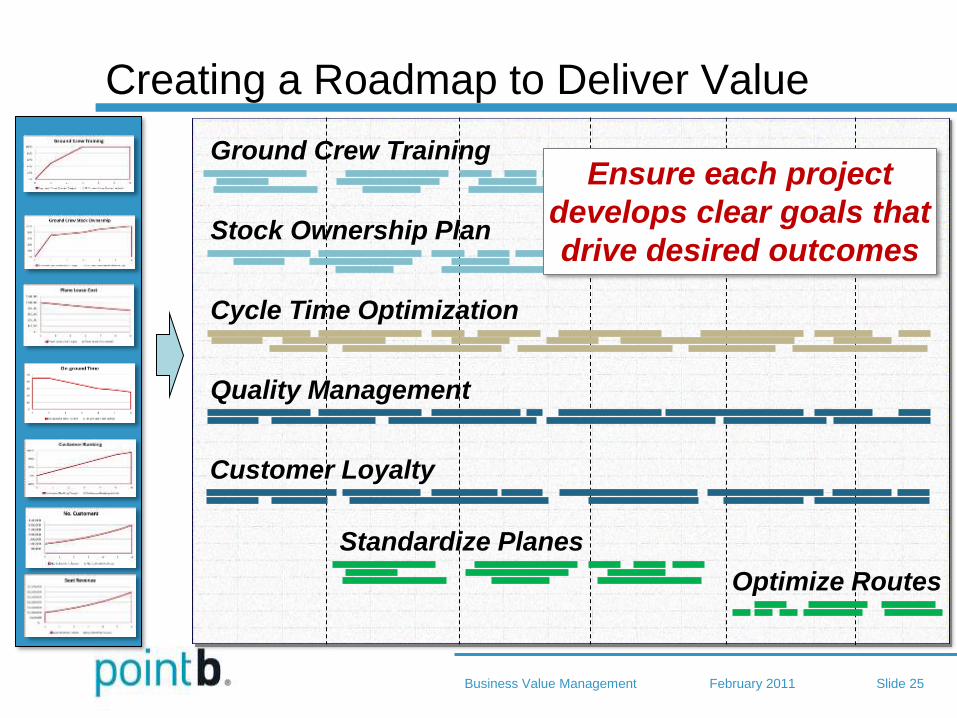
• Create a Roadmap and Performance Dashboard
Break down initiatives into a portfolio of individual projects that have
specific goals aligned to desired outcomes
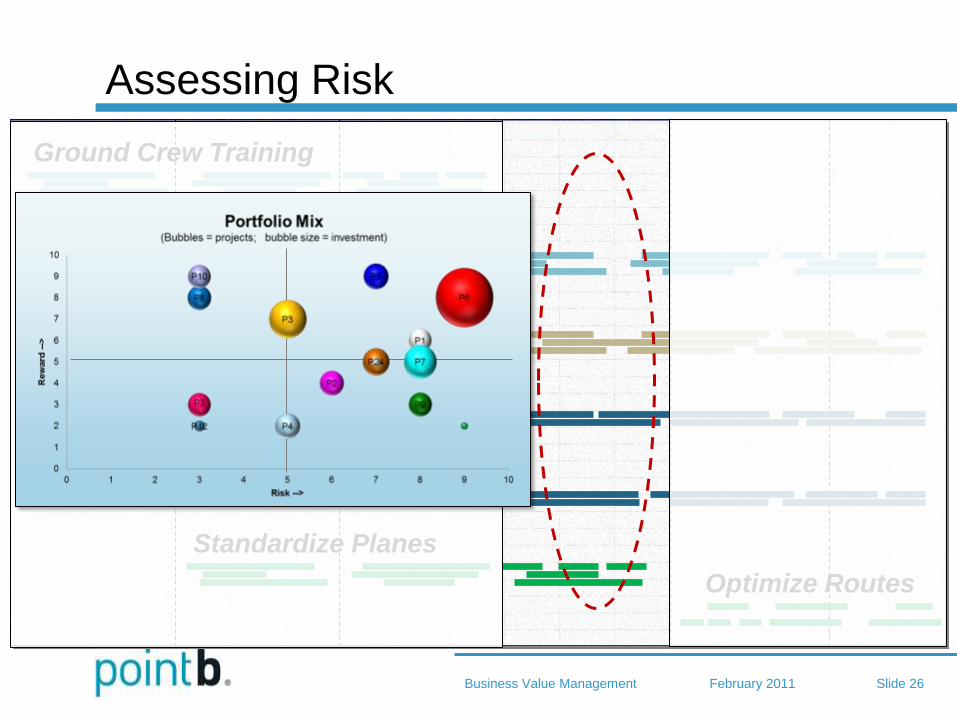
Ensure the portfolio aligns to the risk tolerance of executives
Be sure you can measure results
• Manage the portfolio
Be Value Stewards by managing risk/scope/schedule
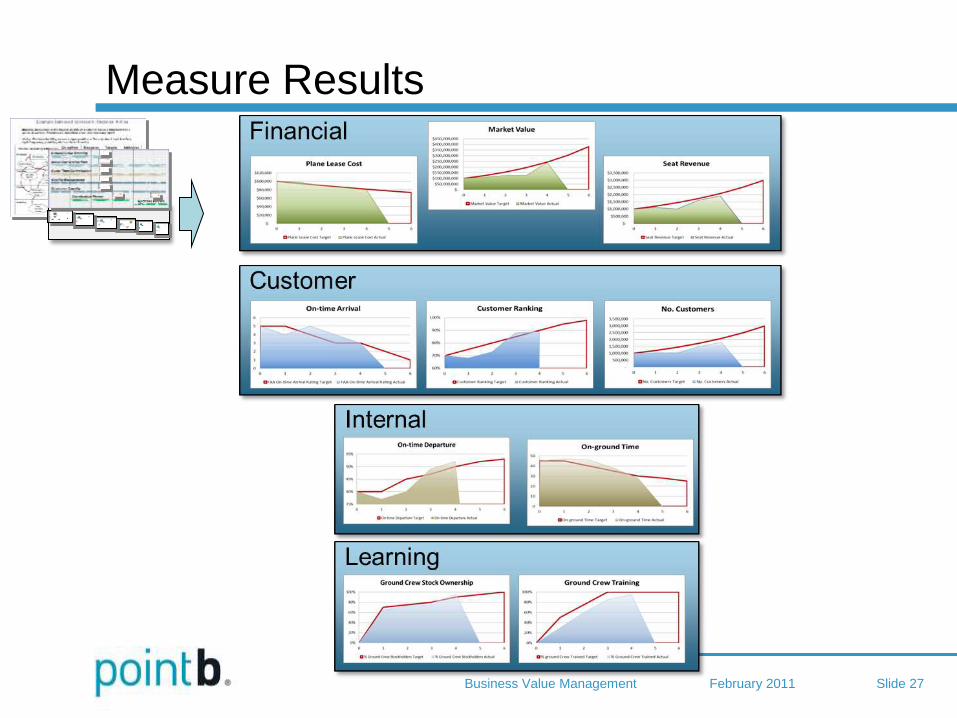
• Measure Results
Track project outcomes to validate strategy and improve the process
February 2011 Business Value Management Slide 6
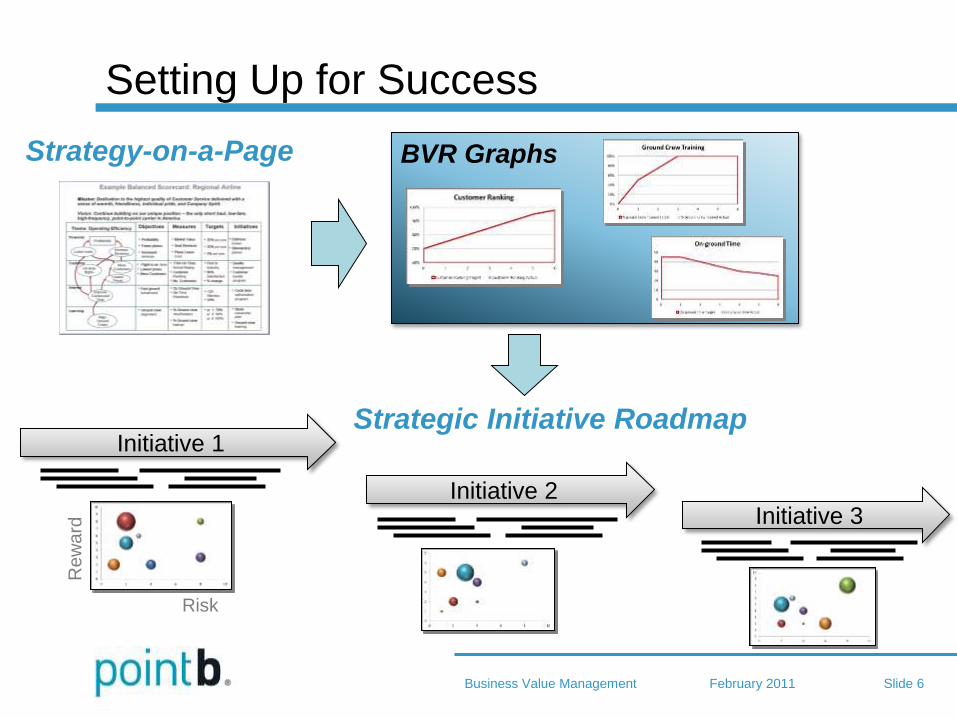
Setting Up for Success
Strategy-on-a-Page
Strategic Initiative Roadmap Initiative 1
Risk
Re
wa
rd
Initiative 2 Initiative 3
BVR Graphs
February 2011 Business Value Management Slide 7
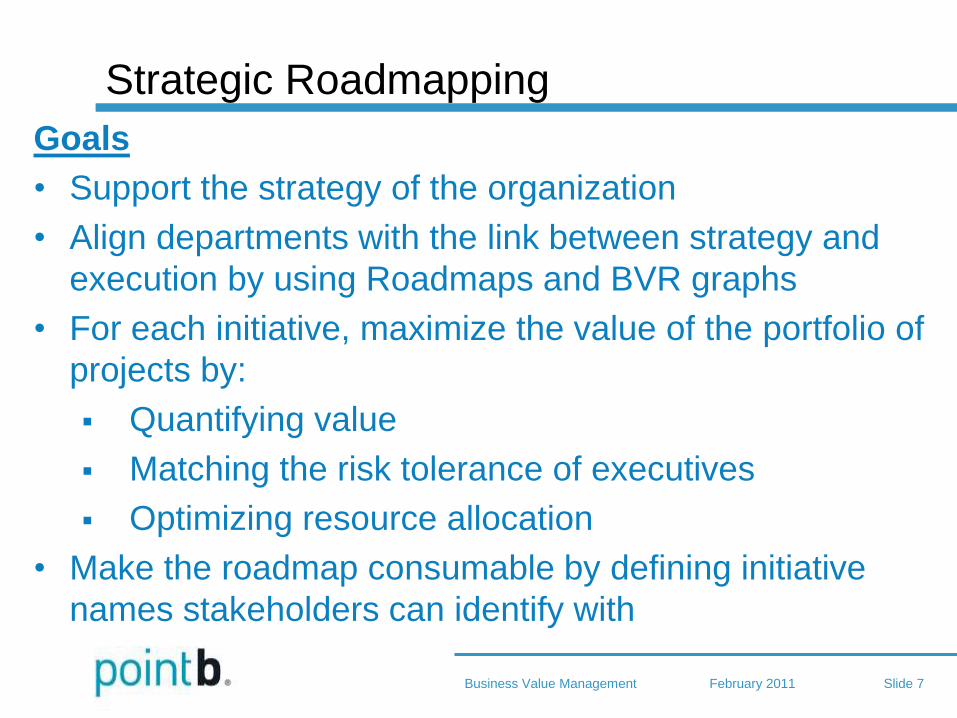
Strategic Roadmapping
Goals
• Support the strategy of the organization
• Align departments with the link between strategy and
execution by using Roadmaps and BVR graphs
• For each initiative, maximize the value of the portfolio of
projects by:
Quantifying value
Matching the risk tolerance of executives
Optimizing resource allocation
• Make the roadmap consumable by defining initiative
names stakeholders can identify with
February 2011 Business Value Management Slide 8
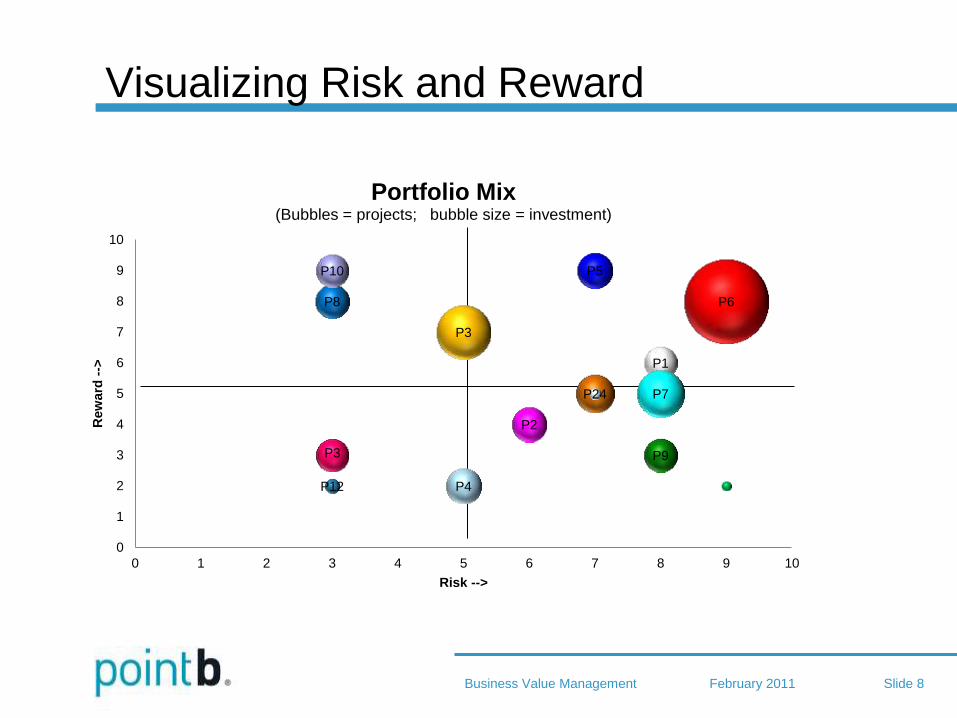
Visualizing Risk and Reward
P1
P2
P3
P4
P5
P6
P7
P8
P9
P10
P12
P3
P24
0
1
2
3
4
5
6
7
8
9
10
0 1 2 3 4 5 6 7 8 9 10
Rew
ard
-->
Risk -->
Portfolio Mix (Bubbles = projects; bubble size = investment)

February 2011 Business Value Management Slide 9
The Perils of Business Case Valuation
• Types of valuation
methods
• Hard / soft benefits
• Common issues
February 2011 Business Value Management Slide 10
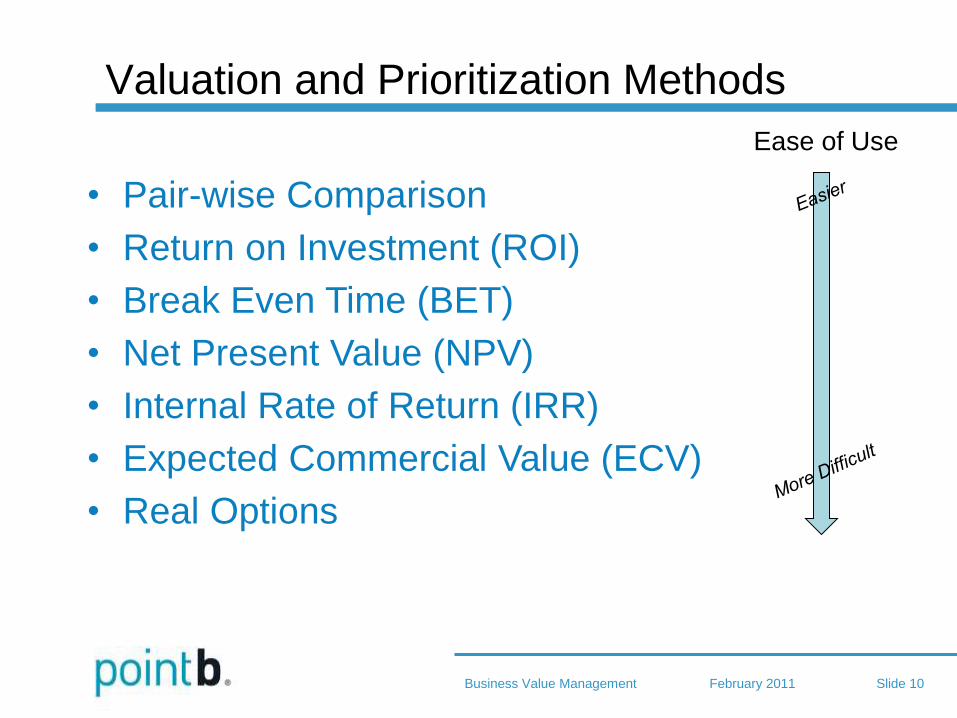
Valuation and Prioritization Methods
• Pair-wise Comparison
• Return on Investment (ROI)
• Break Even Time (BET)
• Net Present Value (NPV)
• Internal Rate of Return (IRR)
• Expected Commercial Value (ECV)
• Real Options
Ease of Use
February 2011 Business Value Management Slide 11
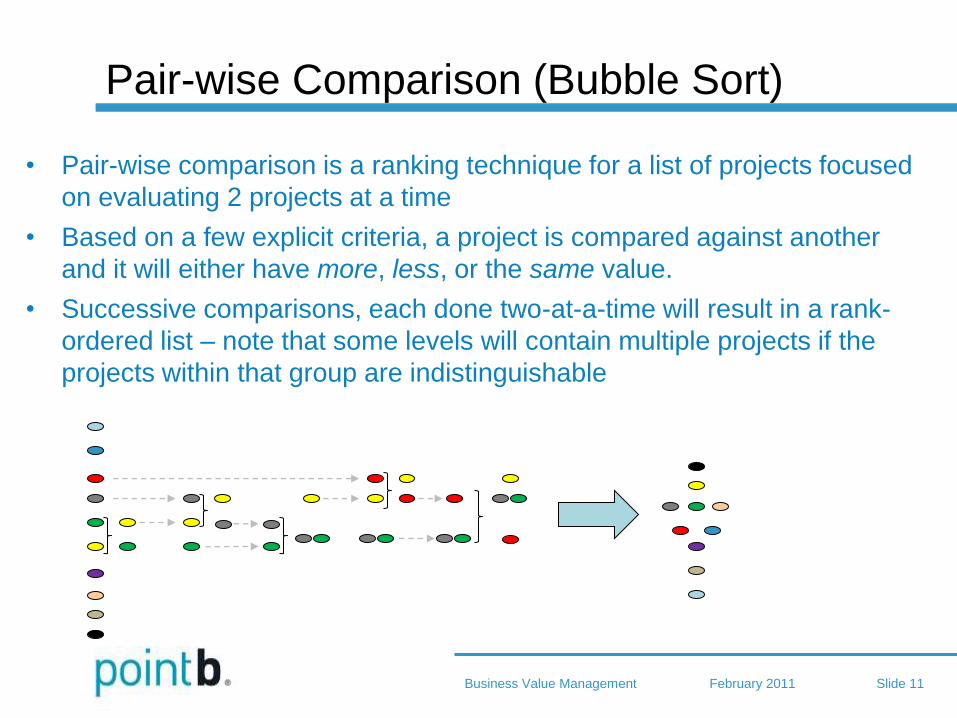
Pair-wise Comparison (Bubble Sort)
• Pair-wise comparison is a ranking technique for a list of projects focused
on evaluating 2 projects at a time
• Based on a few explicit criteria, a project is compared against another
and it will either have more, less, or the same value.
• Successive comparisons, each done two-at-a-time will result in a rank-
ordered list – note that some levels will contain multiple projects if the
projects within that group are indistinguishable

February 2011 Business Value Management Slide 12
Return on Investment and Break Even Time
ROI = Benefits – Cost
Cost
BET: Time at which profits pay for the investment
February 2011 Business Value Management Slide 13
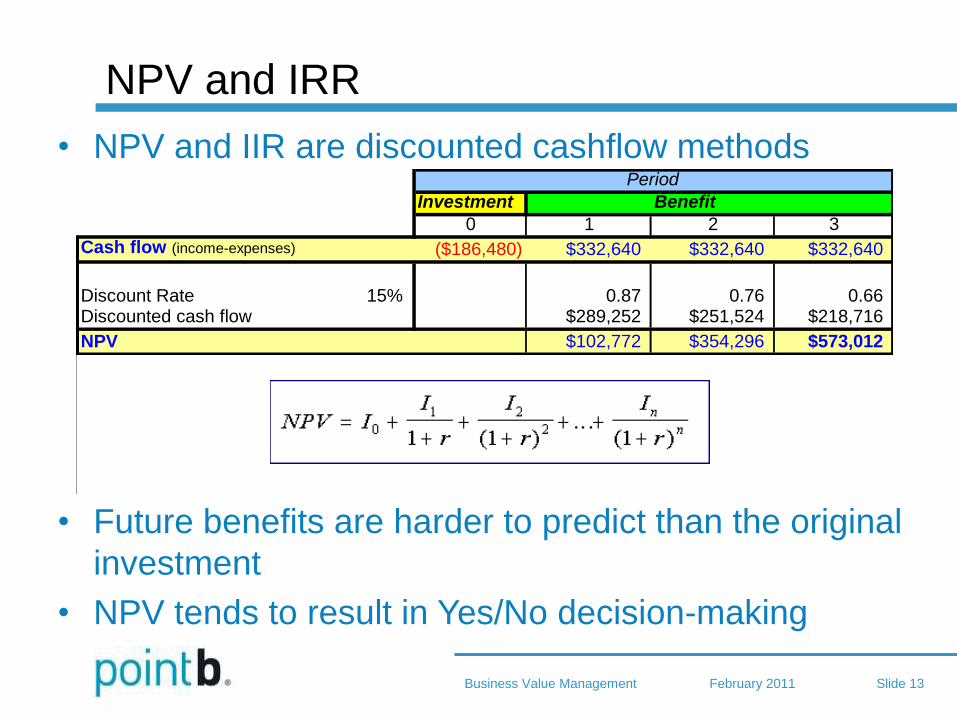
NPV and IRR
• NPV and IIR are discounted cashflow methods
• Future benefits are harder to predict than the original
investment
• NPV tends to result in Yes/No decision-making
Investment Benefit
0 1 2 3
Cash flow (income-expenses) ($186,480) $332,640 $332,640 $332,640
Discount Rate 15% 0.87 0.76 0.66Discounted cash flow $289,252 $251,524 $218,716
NPV $102,772 $354,296 $573,012
IRR - rate at which NPV = 0 in yr 3 169%
IRRDiscount 0.37 0.14 0.05
IRR Discounted cash flow $123,548 $45,888 $17,044
NPV for IRR calc. ($62,932) ($17,044) ($0)
Period
February 2011 Business Value Management Slide 14
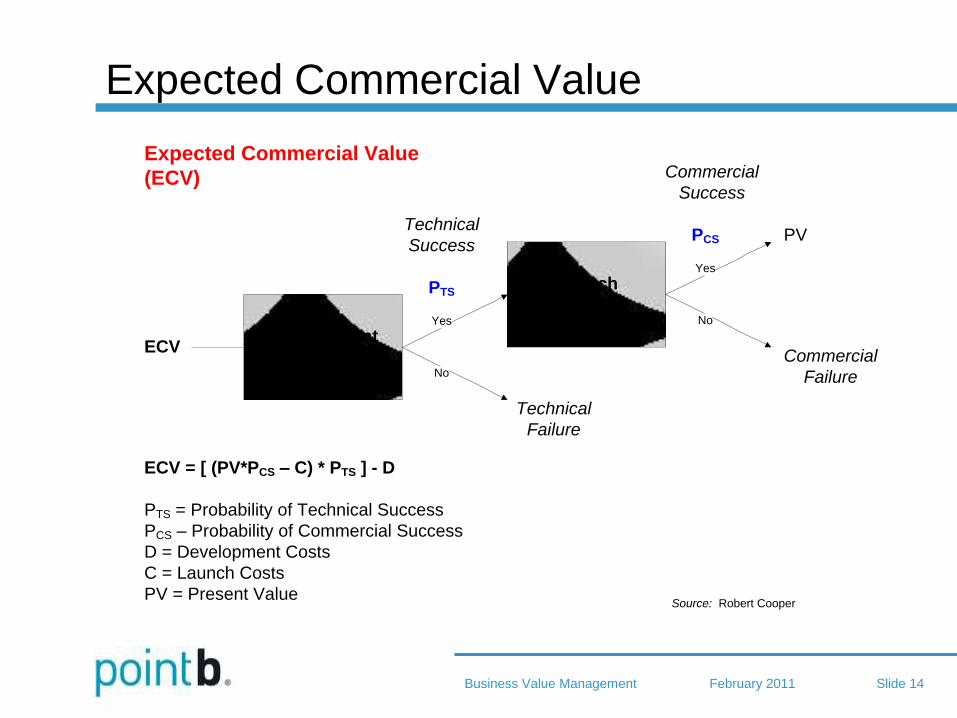
Expected Commercial Value
Development
(D)
Launch
(C)Yes
No
Technical
Failure
ECV
Source: Robert Cooper
Yes
No
Commercial
Failure
PV
Commercial
Success
Technical
Success
PTS
PCS
ECV = [ (PV*PCS – C) * PTS ] - D
PTS = Probability of Technical Success
PCS – Probability of Commercial Success
D = Development Costs
C = Launch Costs
PV = Present Value
Expected Commercial Value
(ECV)
February 2011 Business Value Management Slide 15
Real Options Theory
• Project investments are treated like stock options
• Decisions are made when to exercise (invest) and
how much, based on a business conditions (risk
assessment)
• Options theory avoids the yes/no approach of NPV
(or other ‘threshold’ measures), and has the benefit
of better real-time risk management
February 2011 Business Value Management Slide 16
Valuation Method Summary
• All methods require the estimation of benefits
• Costs are easier to estimate than benefits
• More advanced methods factor in risk
• The method of choice depends on the organization
• Without guidance, any method can be easily mis-
applied
February 2011 Business Value Management Slide 17
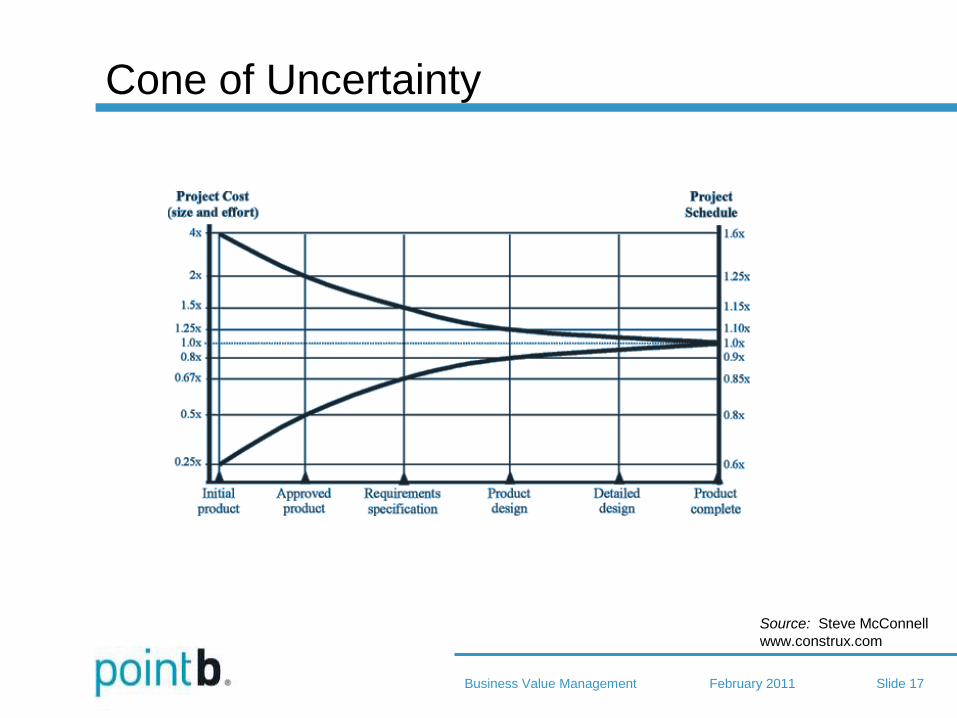
Cone of Uncertainty
Source: Steve McConnell
www.construx.com
February 2011 Business Value Management Slide 18
Common Pitfalls in Business Case
• Assuming the estimation of benefits and costs is
accurate
• The spreadsheet is the truth
• Every group has its own way of determining value
• Over-selling soft benefits
• No compelling reason for change
February 2011 Business Value Management Slide 19
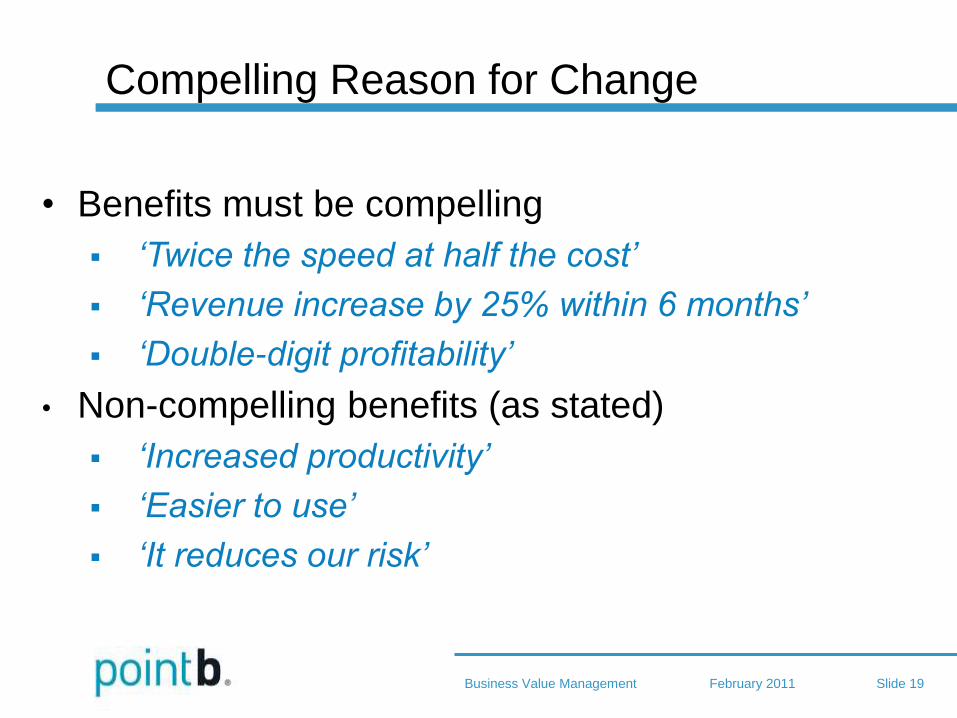
Compelling Reason for Change
• Benefits must be compelling
‘Twice the speed at half the cost’
‘Revenue increase by 25% within 6 months’
‘Double-digit profitability’
• Non-compelling benefits (as stated)
‘Increased productivity’
‘Easier to use’
‘It reduces our risk’
February 2011 Business Value Management Slide 20
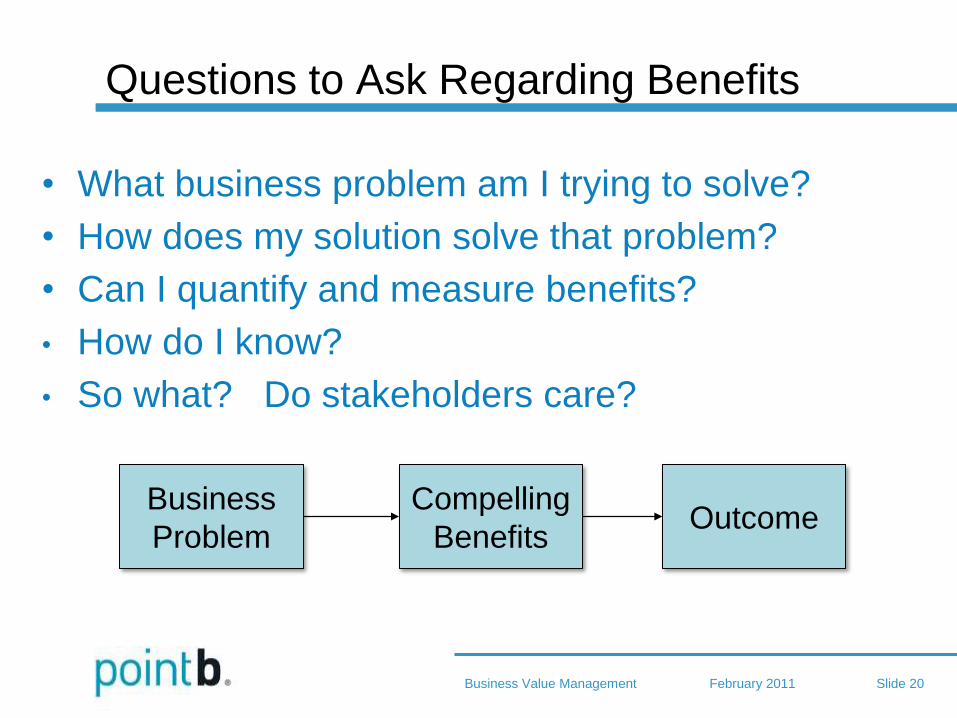
Questions to Ask Regarding Benefits
• What business problem am I trying to solve?
• How does my solution solve that problem?
• Can I quantify and measure benefits?
• How do I know?
• So what? Do stakeholders care?
Business
Problem
Compelling
Benefits Outcome
February 2011 Business Value Management Slide 21
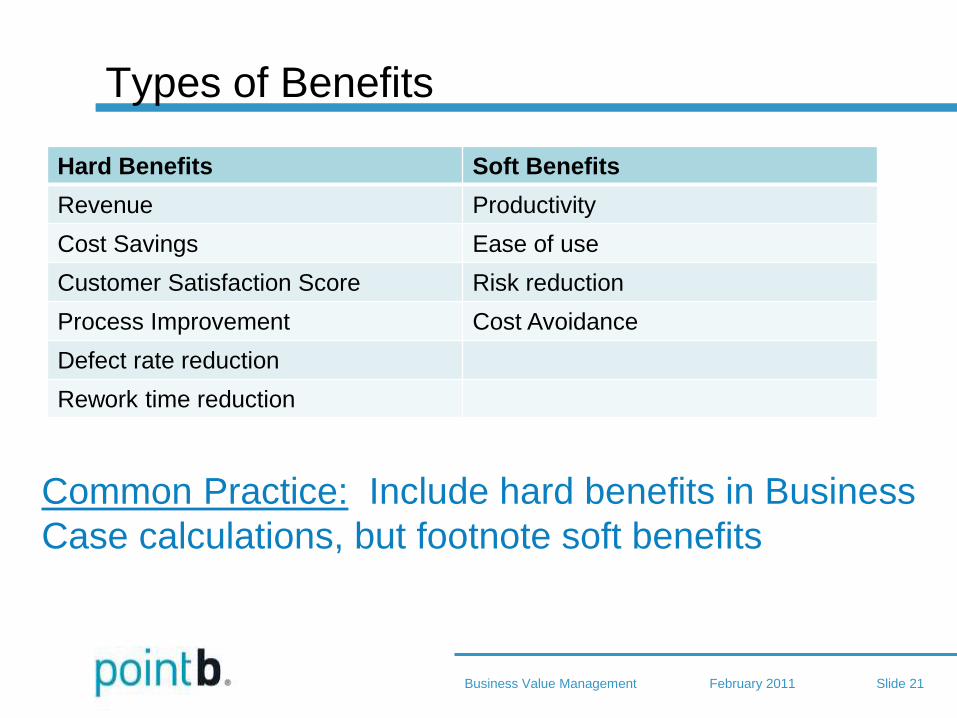
Types of Benefits
Hard Benefits Soft Benefits
Revenue Productivity
Cost Savings Ease of use
Customer Satisfaction Score Risk reduction
Process Improvement Cost Avoidance
Defect rate reduction
Rework time reduction
Common Practice: Include hard benefits in Business
Case calculations, but footnote soft benefits

February 2011 Business Value Management Slide 22
Putting It All Together - Example
• Define Success
Create a ‘Strategy-on-a-Page’
• Determine What to Measure
Break down high-level goals into measurable targets
Create a Roadmap and Performance Dashboard
Break down initiatives into projects that have specific
goals aligned to desired outcomes
Ensure the portfolio aligns to the risk tolerance of
executives
Be sure you can measure results
February 2011 Business Value Management Slide 23
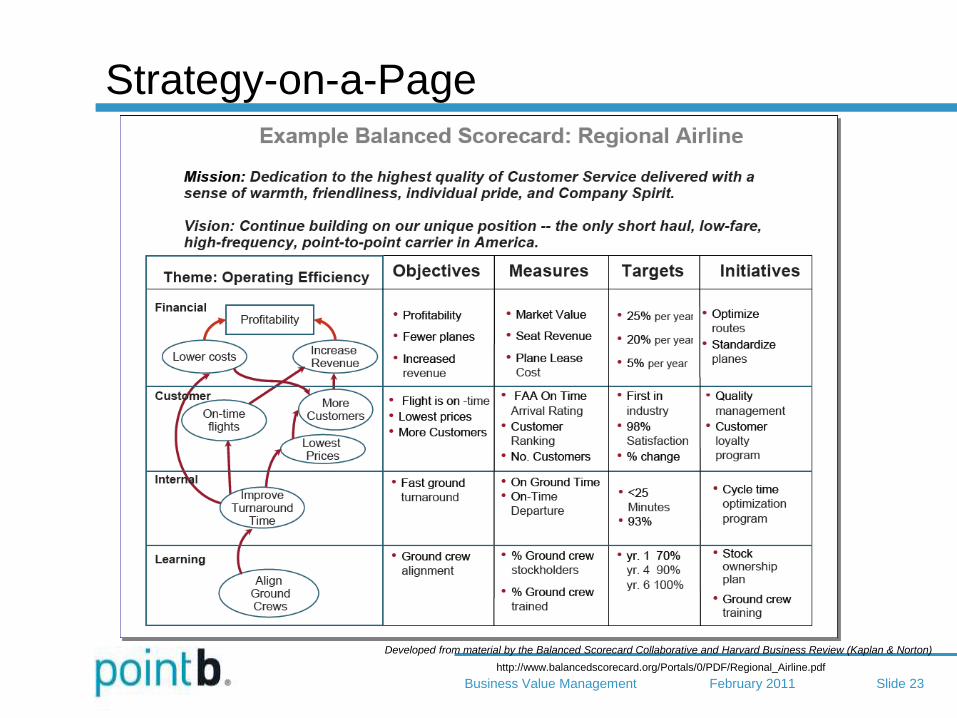
Strategy-on-a-Page
Developed from material by the Balanced Scorecard Collaborative and Harvard Business Review (Kaplan & Norton)
http://www.balancedscorecard.org/Portals/0/PDF/Regional_Airline.pdf
February 2011 Business Value Management Slide 24
Setting Measurable Targets
February 2011 Business Value Management Slide 25
Creating a Roadmap to Deliver Value
Ground Crew Training
Stock Ownership Plan
Cycle Time Optimization
Quality Management
Customer Loyalty
Standardize Planes
Optimize Routes
Ensure each project
develops clear goals that
drive desired outcomes
February 2011 Business Value Management Slide 26
Assessing Risk
Ground Crew Training
Stock Ownership Plan
Cycle Time Optimization
Quality Management
Customer Loyalty
Standardize Planes
Optimize Routes
February 2011 Business Value Management Slide 27
Measure Results

February 2011 Business Value Management Slide 28
Summary
• Business Value Management is an integrated
approach: Align strategic goals to quantifiable outcomes
Use business value targets to drive roadmaps
Measure outcomes to validate strategy and process
• Strategic roadmapping should include: Defining measurable initiative and project outcomes
traceable to business value goals
Quantifying risk / reward / investment
• Define compelling benefits Significant Business Value Realization is the outcome
of achieving compelling benefits
February 2011 Business Value Management Slide 29
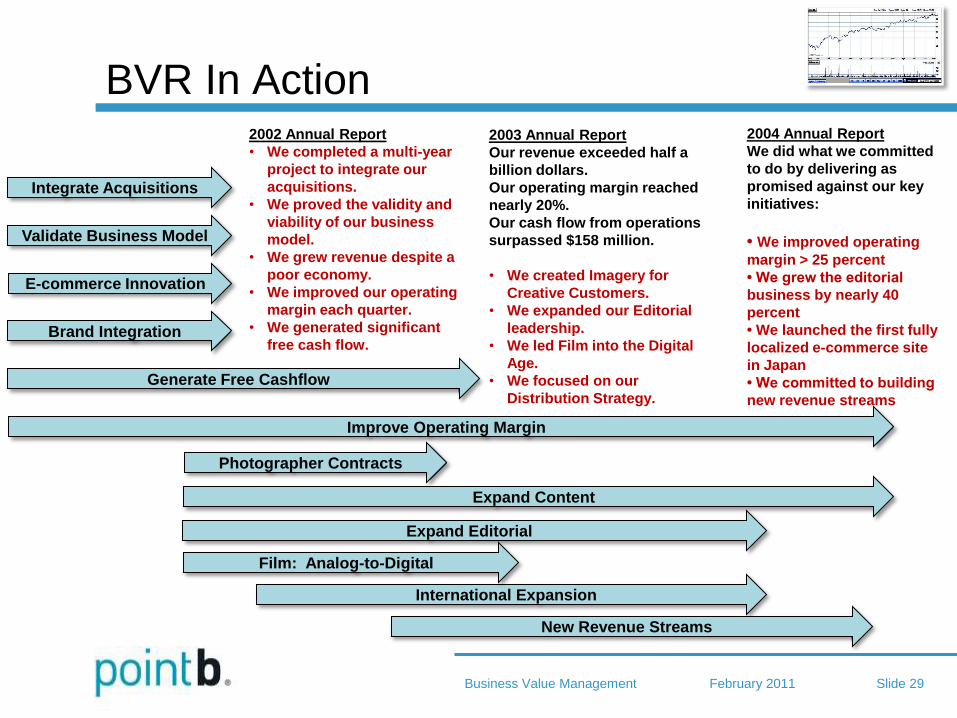
BVR In Action 2002 Annual Report
• We completed a multi-year
project to integrate our
acquisitions.
• We proved the validity and
viability of our business
model.
• We grew revenue despite a
poor economy.
• We improved our operating
margin each quarter.
• We generated significant
free cash flow.
2003 Annual Report
Our revenue exceeded half a
billion dollars.
Our operating margin reached
nearly 20%.
Our cash flow from operations
surpassed $158 million.
• We created Imagery for
Creative Customers.
• We expanded our Editorial
leadership.
• We led Film into the Digital
Age.
• We focused on our
Distribution Strategy.
2004 Annual Report
We did what we committed
to do by delivering as
promised against our key
initiatives:
• We improved operating
margin > 25 percent
• We grew the editorial
business by nearly 40
percent
• We launched the first fully
localized e-commerce site
in Japan
• We committed to building
new revenue streams
Integrate Acquisitions
Validate Business Model
Improve Operating Margin
Generate Free Cashflow
Brand Integration
E-commerce Innovation
International Expansion
Expand Editorial
Expand Content
Film: Analog-to-Digital
New Revenue Streams
Photographer Contracts
February 2011 Business Value Management Slide 30
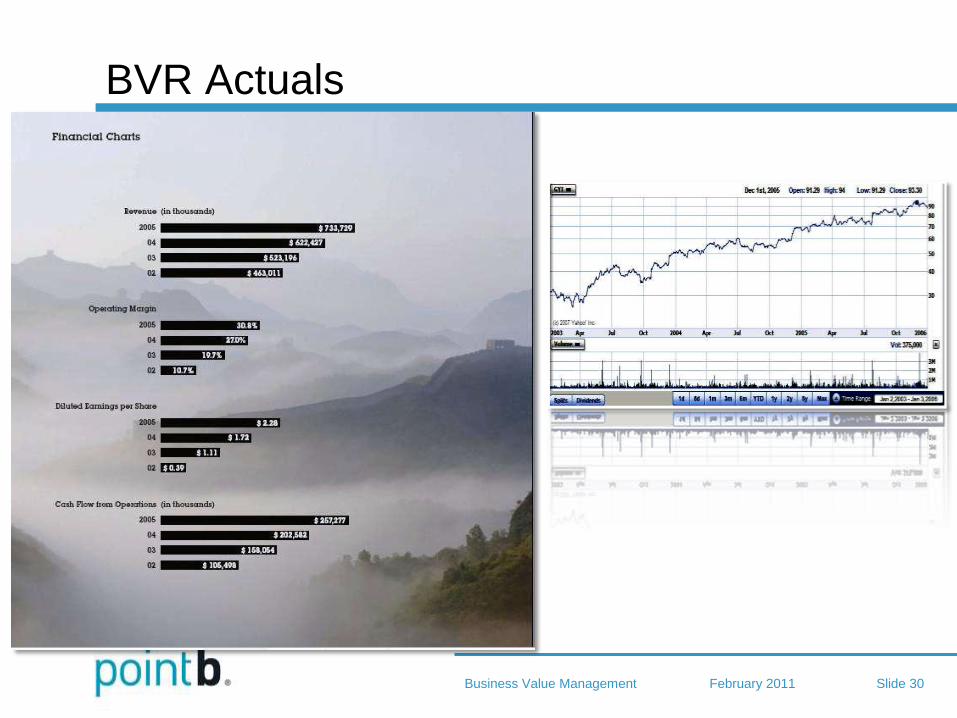
BVR Actuals
February 2011 Business Value Management Slide 31
Contact Information
• For a copy of these slides or other questions, contact:
Gaylord Wahl
206.517.2762
Kaycee Pomeroy
206.686.7797
Jeff Jager
206.985.9639
February 2011 Business Value Management Slide 32
About Point B
Point B is the first professional services firm focused on project leadership
and now, strategic execution. Founded in 1995, the firm provides a diverse
and experienced team of locally-based project leaders to companies in
Seattle, Denver, Portland, Phoenix, San Francisco, Los Angeles and Chicago.
Organizations ranging in size from startups to Fortune 100 corporations turn
to Point B for its ability to step into any segment or role of a mission-critical
project and help lead it to success. And, unlike many professional services
firms, Point B works exclusively for its clients and does not enter into
alliances, reseller agreements, or other relationships that might compromise
the firm's objectivity. Point B has attracted top project leaders from various
industries by offering a culture that promotes flexible work schedules and
well-rounded lifestyles for its more than 400 professionals. Additional
information on the firm and its offerings can be viewed online at
http://www.pointb.com.

February 2011 Business Value Management Slide 33
Appendix
February 2011 Business Value Management Slide 34
NPV and IRR
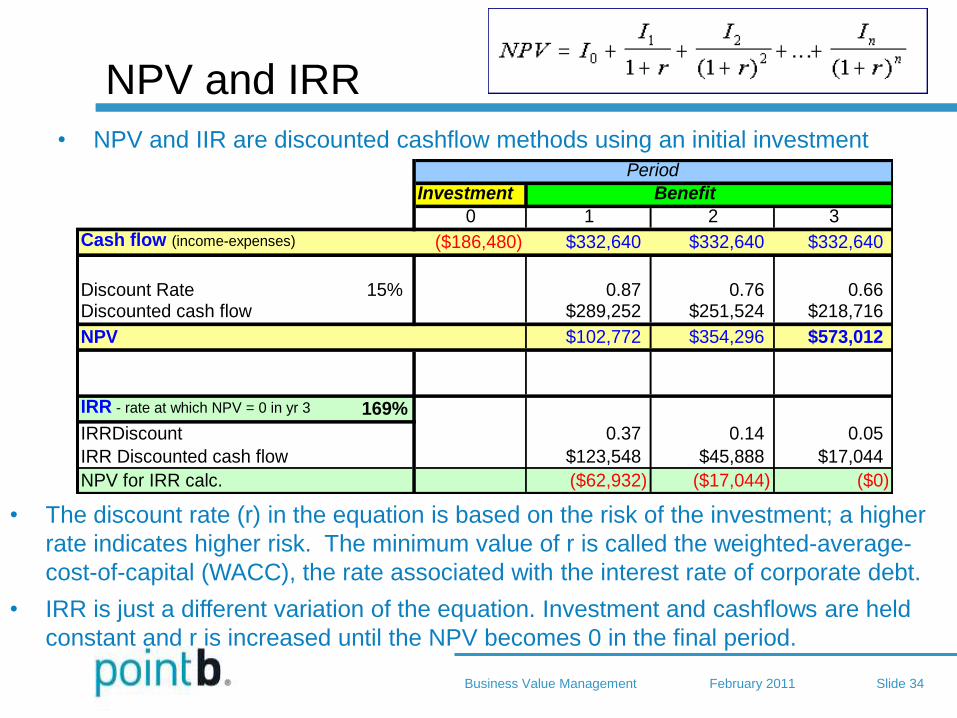
• NPV and IIR are discounted cashflow methods using an initial investment
• The discount rate (r) in the equation is based on the risk of the investment; a higher
rate indicates higher risk. The minimum value of r is called the weighted-average-
cost-of-capital (WACC), the rate associated with the interest rate of corporate debt.
• IRR is just a different variation of the equation. Investment and cashflows are held
constant and r is increased until the NPV becomes 0 in the final period.
Investment Benefit
0 1 2 3
Cash flow (income-expenses) ($186,480) $332,640 $332,640 $332,640
Discount Rate 15% 0.87 0.76 0.66Discounted cash flow $289,252 $251,524 $218,716
NPV $102,772 $354,296 $573,012
IRR - rate at which NPV = 0 in yr 3 169%
IRRDiscount 0.37 0.14 0.05
IRR Discounted cash flow $123,548 $45,888 $17,044
NPV for IRR calc. ($62,932) ($17,044) ($0)
Period