Embed Size (px)
Citation preview

(continued)
Lower Rates, Higher Markets, But Don’t Ignore the RisksThe US economy remains strong.
GDP is positive, with good consumer participation bringing business enthusiasm for further positive activ-ity. The employment market has higher participation rates, historic low unemployment and wage growth, which is trouncing underlying core inflation numbers.
That low inflation has been trending even lower over the past many months despite higher wages and the threat of higher costs forecast from trade tirades around the globe. And with these conditions, the FOMC has pulled back from its hawkish bent on interest rates and should work to influence lower rates for the months to follow, even if it keeps its target range for the federal funds rate near current levels.
This means the economy will continue to benefit from lower interest costs, which means lower credit costs for businesses and consumers. It also means lower yields and higher prices for bonds. The bottom line: Interest rate sensitive investments should continue to do well, including REITs, utilities and a new market segment for the portfolios—gold.
But there are still risks out there. Trade disruptions from technology restrictions to tariffs remain. And the 2020 elections are now fully underway and could introduce uncertainty into 2021. Yet, potential changes in Washington and around the nation’s state houses doesn’t mean the end of the good times, just different opportunities.
Simply put, with the exception of near-term earnings and reduced full-year outlooks, as well as potential over-exuberance, there are a lot of good things happening for income and growth investors.
August 2019
Vol. 30, No. 8
We’ve Been Here Before, And It’s All GoodDear Friend,
One of the benefits of being older is that you gain perspective. And when it comes to the current economic and market conditions, I recall the late 1970s when US inflation, as measured by the Core Personal Consumption Expenditure Index (PCE), was soaring. By November 1980, the PCE hit 9.77%.
It was a time of many political and economic crises, and the elections on November 4 of that year brought a major series of changes. Monetary and fiscal policies were altered, and the PCE began to fall precipitously, hitting a low of a mere 2.81% by March 1987. There were many beneficiaries during this time.
The bond market soared, particularly higher-yield corporate bonds, with the Bloomberg Barclays Corporate High Yield Index gaining 188.67% from September 1981 through October 1988. Spot gold prices in the US gained 71.36% from June 1982 through February 1983. And of course, the S&P 500 Index rose 228.81% from August 1982 through August 1987.
In this issue, I’ll explain how lower inflation and lower interest rates are driving specific segments of the markets today. I’ll also reveal which parts of the bond markets are providing high yields now and further gains in the future as well as how you can profit from this trend.
I’ll also talk about gold and how you can get paid to own it. And as always, I’ll review the model portfolio positions and do some necessary housecleaning.
Growth StrategiesWhy Yields Will Head Even Lower
While the US economy is in one of the longest periods of sustained growth in history, there is a conflict, which is that inflation is not only not there—it is falling. And there are plenty of reasons for this.
For example, changing consumer tastes for goods and services are bringing further competition for sales and helping to drive prices lower overall. Furthermore, with greater efficiencies from online sales and dramatically improving logistics, companies are able—if only out of necessity—to slice and dice costs to keep and gain sales.
This is showing up in many of the faster growth companies with a technology focus, which are gaining sales and market penetration but losing more money in the process. Just look at a company like Uber (UBER). It has a massive market, but it still has negative operating margins at -26.90%. Even Amazon (AMZN), with its massive command of online retail, would be at risk if it weren’t for its Amazon Web Services platform, which cushions the loss-leading retail sales.
Meanwhile, many of the input costs continue to fall, particularly in raw materials. The Bloomberg Commodities Index has been falling over the trailing five years by 38.34%. This means that, even with trade tariffs, raw goods are still down in price—reducing costs and inflation pressures.
And while wages are up, with the most recent data showing annualized gains of 3.10%, this is not showing up in pricing for goods and services.
This is also evident in wholesale prices in the US, as finished goods prices for businesses have fallen over the past 12 months. The US Producer Price Index (PPI)
2 Profitable Investing | August 2019 | profitableinvesting.investorplace.com
Neil George’s Profitable Investing® (ISSN 2577-9311) is published monthly by InvestorPlace Media, LLC, 9201 Corporate Blvd., Suite 200, Rockville, MD 20850-3334. Please write or call if you have any questions. Phone: 800/211-8566. Email: [email protected]. Web site: profitableinvesting.investorplace.com
Editor: Neil George Chief Executive Officer: Brian Hunt Senior Managing Editor: David Tony Marketing Director: Katy Anadale Managing Editor: Gregg Early Chief Marketing Officer: Brad Hoppmann Assistant Managing Editor: Wola Odeniran Marketing Director: Mary Southard Editorial Director: Luis Hernandez Senior Designer: Marc Gagarin
Subscriptions: $249 per year. © 2018 by InvestorPlace Media, LLC, Founding Member of the Newsletter Publishers Association of America. Photocopying, reproduction or quotation strictly prohibited without the written permission of the publisher. While the information provided is based upon sources believed to be reliable, its accuracy cannot be guaranteed, nor can the publication be considered liable for the investment performance of any securities or strategies mentioned. Subscribers should review the full disclaimer and securities holdings disclosure policy at https://profitableinvesting.investorplace.com/disclaimers-and-disclosures or call 800/219-8592 for a mailed copy. Periodicals postage rates paid at Rockville, MD, and at additional mailing offices. Postmaster: Send address changes to Neil George’s Profitable Investing®, InvestorPlace Media, LLC, 9201 Corporate Blvd., Suite 200, Rockville, MD 20850-3334.
dropped to a barely there rate of 0.40% for the most recent month’s data.
The key item to watch is the same one the Federal Reserve Bank’s Open Market Committee (FOMC) uses as its inflation barometer—the Core Personal Consumption Expenditure Index (PCE), which measures pricing across all consumer spending.
The PCE has fallen to a current 1.60%, which is well below the stated 2.00% target of the FOMC. The FOMC has been telling the markets that it will act in accordance with the PCE. But it apparently lied last year, as it raised its target range for the federal funds rate four times while inflation was nowhere to be found.
Last month, I wrote about how this is similar to 1995-1996 when the FOMC also bungled its target rate range, raising three times, only to reverse course quickly.
This led the federal funds rate down, and the bond market rallied. The Bloomberg Barclays US Corporate Bond Index gained 32.70% for 1995-1996. The S&P 500 Index returned 69.05%. And gold rallied from its lows in early 1995 to its highs in 1996 by 11.84%.
Now, I’m way ahead of what the FOMC may do this year. But I have
seen market actions from its rhetoric by individual Fed Board members, both current and inbound, as well as behind the scenes activity aiding liquidity in the bond and money markets.
I am writing all of this ahead of the FOMC’s two-day meeting on July 30-31. For now, I expect the committee to cut the target rate. But even without a cut next week, the FOMC is still pointing to easier monetary conditions. When it really comes down to interest rates and bond yields, it is the market that actually decides.
And this keeps showing up in lower yields. Year to date, US benchmark Treasury yields have fallen from 2.60% to 1.97% for the one-year, 2.51% to 1.81% for the five-year and 2.69% to 2.05% for the 10-year.
Meanwhile, with low to negative inflation in Europe and Japan, the European Central Bank (ECB) and Bank of Japan (BOJ) have driven yields into negative territory (see the Q&A section on page 10 for more on how this works). The result is that government bonds and corporate bonds increasingly have negative yields.
This is creating an even better market for US corporate bonds, which are strongly in demand from US and global investors. Just look at my
benchmark Bloomberg Barclays US Corporate High Yield Index, which is up 10.24% year to date.
For now, I see inflation remaining at bay and lower interest rates for months to follow. This sets up our model portfolios and new recommendations to continue generating strong income and gains to come. Read on for some specific recommendations and highlights from our portfolios.
Proven Growth & IncomeLook to Gold for Growth & Income
With lower inflation and falling interest rates, I like gold right now. On its own, it offers no yield. Worse, it costs money to hold it. Generally, investors that buy gold bake in a loss if the price of the metal goes nowhere. So, I’m not making this recommendation lightly.
Gold must be stored somewhere, and storage costs money. On top of that, there’s the opportunity cost of what you could be earning in a money market or from Treasury Bills.
For me to justify buying and owning a gold security, there have to be good reasons for prices to rise above storage and opportunity costs. And I think there are good reasons for that to be the case right now.
Mining Gold PricesTwo of the major drivers of gold
prices are interest rates and the value of the US dollar. Since gold for US investors is priced in dollars, if the dollar slides—all things being equal—gold will tend to rise. And because interest rates provide the opportunity cost to hold it, falling rates means gold is cheaper to own.
The US dollar has been stronger against most of the major currencies of the world. But the dollar is highly
1.90
2.00
1.80
1.70
1.50
1.60
2018 2019Jun Sep Dec Mar
Last Price 1.60High on 07/31/18 2.04Average 1.83Low on 03/31/19 1.54
1.60
14
12
8
-2
6
4
0
2
10
Vanguard High Dividend Yield ETFVanguard Real Estate ETFVanguard Utilities ETFVanguard Information Technology ETFEnergy Select Sector SPDR FundVanguard Health Care ETF
2019 Jul 15 Jul 8Jun 28Jun 21Jun 14Jun 7
2019Jul 15 Jul 8Jun 28Jun 21Jun 14Jun 7
2.50
2.00
1.50
0.00
0.50
1.00
SPDR Portfolio Intermediate Team Corporate Bond ETFiShares Preferred & Income Securities ETFVanguard Tax-Exempt Bond Index ETF
1200
1210
1190
1180
1170
20192018Sep Dec Mar Jun
1198.44
1400
1450
1350
1300
1250
1200
1423.91
Last PriceGOLDS Comdty (L1) 1423.91BBDXY Index (R1) 1198.44
2.70
2.80
2.60
2.50
2.40
2.30
20192018Sep Dec Mar Jun
2.28
1400
1450
1350
1300
1250
1200
1423.15
Last PriceGOLDS Comdty (L1) 1423.15US0003M Index (R1) 2.28
50
60
40
30
20
10
0
2018 2019Apr May JunMarFebDec JanOct NovSep Jul
Franco-Nevada Corp
SPDR Gold Shares
20192018
14.50
15.00
14.00
13.00
11.00
12.50
12.00
11.50
-16.00
-10.00
-12.00
-14.00
13.50
JunMarDecSep
Low: 13.07
Low: 11.06
Hi: 14.70
Hi: 13.21
Hi: -9.40
Low: -16.02
20
15
0
-5
5
10
Bloomberg Barclays US Corporate High Yield Total Return Index Value Unhedged USD
Bloomberg Barclays US Agg Total Return Value Unhedged USD
2016 2017 2018 2019
US Core Personal Consumption Expenditure Index
Source: Bloomberg Finance, L.P.

Profitable Investing | August 2019 | profitableinvesting.investorplace.com 3
impacted by changes in short-term interest rates, and falling rates will drive the dollar lower. If you look at the relationship between the dollar and gold, you can see that during the Federal Reserve’s tightening last year, the dollar was stronger and gold was lackluster for much of that year.
That was until the fourth quarter when stocks took a tumble and, with that, another of the opportunity costs to holding gold. As the dollar slipped into early 2019, gold continued to rise, and the same relationship has played out in recent weeks as well.
Furthermore, if you look at short-term US dollar interest rates, as measured by the three-month London Interbank Offered Rate (LIBOR), you can see that gold muddled along for much of 2018 as LIBOR rose. But in 2019, LIBOR has been slipping and sliding while gold has been on the rise.
Global Uncertainty Bolsters GoldUS interest rates and the dollar
are just two of the major factors in pricing gold. In addition, gold is getting buying attention as the rest of the globe remains in less desirable economic conditions.
Europe and parts of Asia are in economic trouble and show little progress in their core economies. They’re also facing many political headwinds. Specifically, in key European and Japanese markets, interest rates are actually negative, with depositors paying rather than receiving interest.
That has extended further into the bond markets, with government and an increasing number of corporate bonds having negative yields. That means bonds cost money to hold, and that is helping gold demand outside of the US.
Back in the US, politics and the 2020 elections are fully engaged and are presenting their own challenges, while investors and strategists are plotting alternatives as we get closer and closer to November of next year. Gold tends to perform well during periods of uncertainty.
A Better Way to Own GoldAs I noted earlier, holding gold
comes with costs. Along with storage costs, it costs commissions to buy and sell gold. Even the leading gold ETF,
the SPDR Gold Shares (GLD), has its underlying charges adding up to a 40 basis points (0.40%) per year, and it doesn’t pay a penny in dividends.
So I found a better way to get exposure to gold, and that is to own Franco-Nevada Corporation (FNV).
FNV isn’t a mining company. It long ago figured out that mining wasn’t the most profitable and predictable way to cash in on gold. Instead, the company acquires and holds royalty interests from gold producers and also owns proceeds from gold mining companies. This means that it doesn’t have to buy and run mines, so it avoids all of the costs of capital equipment and associated uncertainties to the business.
It just collects cash from gold produc-tion by its tenants. When gold prices rise, the company makes more revenue. When gold prices fall, the company makes less, but it still makes money.
And it pays its shareholders their cut
of the profits from its gold revenues. That equates to a dividend yield of 1.11%, which has been on the rise in actual distributions over the past five years by an average of 3.93% per year. That’s not a big yield, but it’s far better than GLD, which will cost you 40 basis points.
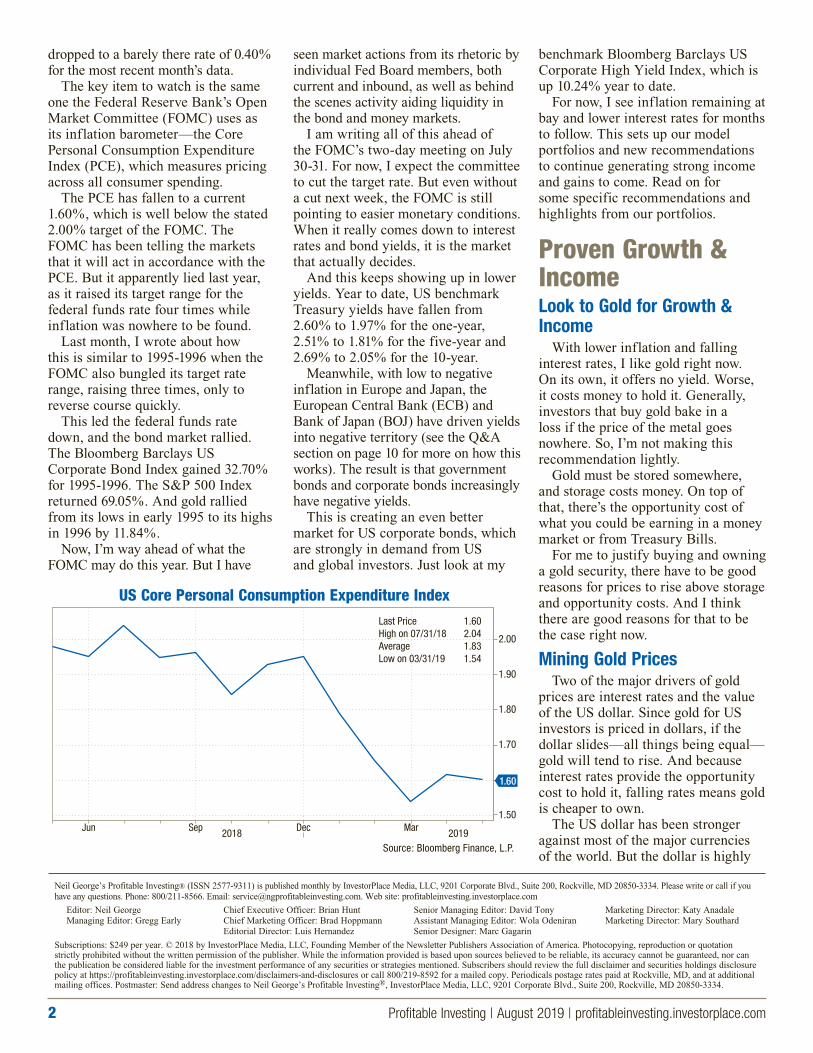
Franco-Nevada stock is proving to be a great way to own gold. Since September 11 of last year to late July, FNV has generated a total return of 54.66% against GLD’s return of 18.64%. That’s a 193.24% better return. And over the past five years, FNV has outperformed GLD by a total return margin of 791.64%.
FNV is a buy in the Niche Investments portfolio under $91.00, ideally in a taxable account.
One last word on FNV: Current Canadian and US tax treaties have Canada pledging not to withhold income taxes on US individual investors holding Canadian stocks in retirement accounts,
1.90
2.00
1.80
1.70
1.50
1.60
2018 2019Jun Sep Dec Mar
Last Price 1.60High on 07/31/18 2.04Average 1.83Low on 03/31/19 1.54
1.60
14
12
8
-2
6
4
0
2
10
Vanguard High Dividend Yield ETFVanguard Real Estate ETFVanguard Utilities ETFVanguard Information Technology ETFEnergy Select Sector SPDR FundVanguard Health Care ETF
2019 Jul 15 Jul 8Jun 28Jun 21Jun 14Jun 7
2019Jul 15 Jul 8Jun 28Jun 21Jun 14Jun 7
2.50
2.00
1.50
0.00
0.50
1.00
SPDR Portfolio Intermediate Team Corporate Bond ETFiShares Preferred & Income Securities ETFVanguard Tax-Exempt Bond Index ETF
1200
1210
1190
1180
1170
20192018Sep Dec Mar Jun
1198.44
1400
1450
1350
1300
1250
1200
1423.91
Last PriceGOLDS Comdty (L1) 1423.91BBDXY Index (R1) 1198.44
2.70
2.80
2.60
2.50
2.40
2.30
20192018Sep Dec Mar Jun
2.28
1400
1450
1350
1300
1250
1200
1423.15
Last PriceGOLDS Comdty (L1) 1423.15US0003M Index (R1) 2.28
50
60
40
30
20
10
0
2018 2019Apr May JunMarFebDec JanOct NovSep Jul
Franco-Nevada Corp
SPDR Gold Shares
20192018
14.50
15.00
14.00
13.00
11.00
12.50
12.00
11.50
-16.00
-10.00
-12.00
-14.00
13.50
JunMarDecSep
Low: 13.07
Low: 11.06
Hi: 14.70
Hi: 13.21
Hi: -9.40
Low: -16.02
20
15
0
-5
5
10
Bloomberg Barclays US Corporate High Yield Total Return Index Value Unhedged USD
Bloomberg Barclays US Agg Total Return Value Unhedged USD
2016 2017 2018 2019
Spot Gold (Blue) & Bloomberg US Dollar Index (Black)
Source: Bloomberg Finance, L.P.
1.90
2.00
1.80
1.70
1.50
1.60
2018 2019Jun Sep Dec Mar
Last Price 1.60High on 07/31/18 2.04Average 1.83Low on 03/31/19 1.54
1.60
14
12
8
-2
6
4
0
2
10
Vanguard High Dividend Yield ETFVanguard Real Estate ETFVanguard Utilities ETFVanguard Information Technology ETFEnergy Select Sector SPDR FundVanguard Health Care ETF
2019 Jul 15 Jul 8Jun 28Jun 21Jun 14Jun 7
2019Jul 15 Jul 8Jun 28Jun 21Jun 14Jun 7
2.50
2.00
1.50
0.00
0.50
1.00
SPDR Portfolio Intermediate Team Corporate Bond ETFiShares Preferred & Income Securities ETFVanguard Tax-Exempt Bond Index ETF
1200
1210
1190
1180
1170
20192018Sep Dec Mar Jun
1198.44
1400
1450
1350
1300
1250
1200
1423.91
Last PriceGOLDS Comdty (L1) 1423.91BBDXY Index (R1) 1198.44
2.70
2.80
2.60
2.50
2.40
2.30
20192018Sep Dec Mar Jun
2.28
1400
1450
1350
1300
1250
1200
1423.15
Last PriceGOLDS Comdty (L1) 1423.15US0003M Index (R1) 2.28
50
60
40
30
20
10
0
2018 2019Apr May JunMarFebDec JanOct NovSep Jul
Franco-Nevada Corp
SPDR Gold Shares
20192018
14.50
15.00
14.00
13.00
11.00
12.50
12.00
11.50
-16.00
-10.00
-12.00
-14.00
13.50
JunMarDecSep
Low: 13.07
Low: 11.06
Hi: 14.70
Hi: 13.21
Hi: -9.40
Low: -16.02
20
15
0
-5
5
10
Bloomberg Barclays US Corporate High Yield Total Return Index Value Unhedged USD
Bloomberg Barclays US Agg Total Return Value Unhedged USD
2016 2017 2018 2019
Spot Gold (Blue) & US Dollar Three-Month LIBOR Rates (Black)
Source: Bloomberg Finance, L.P.

4 Profitable Investing | August 2019 | profitableinvesting.investorplace.com
which makes FNV eligible for tax-free accounts. However, I am listing it as eligible for taxable accounts, because there is no guarantee that this tax policy won’t change.
More Growth & IncomeBuy High Yield Corporate Bonds at Big Discounts
US inflation is low and shows all indications of remaining so. Shorter-term rates have come down even though the FOMC has yet to make headline cuts in its target range for the federal funds rate. Meanwhile, the FOMC and the Fed have taken other steps to boost liquidity and to affect market interest rates.
Looking around the world, many major global economies are in worse shape. Inflation in Japan and much of the European Union (EU) is even lower. And the markets are driving interest rates into negative territory in an effort to encourage spending, meaning depositors pay banks to hold cash.
In the US bond markets, yields are still positive, but they’re falling. And falling yields mean bond prices are rising.
That’s why I want you to dive deeper into the US corporate bond market. This month, I have a new closed-end bond fund that’s paying a current yield of 6.11% and is priced at a steep discount to its bond holdings (net asset value). That means that you can buy corporate bonds paying multiples more than US Treasuries at a big discount and in one of the better bond markets we’ve had in some time.
Credit Where Credit is DueThe key to investing well in the
US bond market right now is to understand that lower rated bonds are like undervalued stocks. The market is mispricing the bonds much like it underprices stocks of improving companies. But it’s not as easy as just buying lower grade bonds, just like it never works to simply buy stocks of beaten-down companies.
It takes work to look at the underlying companies behind the bonds and examine their true capabilities to
service and pay off their debts. This is the same work that I do for the stocks I recommend in the model portfolios.
Bloomberg Barclays has a series of benchmark bond indexes that track segments as well as the overall aggregate market. The High Yield Corporate Index has outperformed the overall bond market of the US over the trailing three years, generating a return of 20.93% compared to the 6.90% return for the overall market.
This action is being driven by a thriving economy, with consumers buying and businesses generating more revenues and profits. Add in lower inflation and falling yields and the corporate bond market is on a run that should continue.
That’s why I’m recommending BlackRock Credit Allocation Income Trust (BTZ), which is a closed-end fund run by one of the
biggest and best asset managers, BlackRock (BLK). I also recommend BLK in the Niche Investments.
BTZ’s largest allocations are to BBB-rated bonds, which are at the bottom of the investment grade spectrum, bringing opportunity for appreciation while controlling risk. And it also has a series of bonds just above and just below that rating tier, again bringing opportunity and higher yields while limiting credit risk. Despite its impressive performance of 35.52% over the trailing five years, the fund still trades at a 9% discount to net asset value (NAV).
But the discount has been narrowing sharply since last December. This means a higher stock price for BTZ even if its portfolio remains flat, which is unlikely given my view of the bond markets.
And there is an added kicker. Boaz Weinstein and his Saba Capital have
1.90
2.00
1.80
1.70
1.50
1.60
2018 2019Jun Sep Dec Mar
Last Price 1.60High on 07/31/18 2.04Average 1.83Low on 03/31/19 1.54
1.60
14
12
8
-2
6
4
0
2
10
Vanguard High Dividend Yield ETFVanguard Real Estate ETFVanguard Utilities ETFVanguard Information Technology ETFEnergy Select Sector SPDR FundVanguard Health Care ETF
2019 Jul 15 Jul 8Jun 28Jun 21Jun 14Jun 7
2019Jul 15 Jul 8Jun 28Jun 21Jun 14Jun 7
2.50
2.00
1.50
0.00
0.50
1.00
SPDR Portfolio Intermediate Team Corporate Bond ETFiShares Preferred & Income Securities ETFVanguard Tax-Exempt Bond Index ETF
1200
1210
1190
1180
1170
20192018Sep Dec Mar Jun
1198.44
1400
1450
1350
1300
1250
1200
1423.91
Last PriceGOLDS Comdty (L1) 1423.91BBDXY Index (R1) 1198.44
2.70
2.80
2.60
2.50
2.40
2.30
20192018Sep Dec Mar Jun
2.28
1400
1450
1350
1300
1250
1200
1423.15
Last PriceGOLDS Comdty (L1) 1423.15US0003M Index (R1) 2.28
50
60
40
30
20
10
0
2018 2019Apr May JunMarFebDec JanOct NovSep Jul
Franco-Nevada Corp
SPDR Gold Shares
20192018
14.50
15.00
14.00
13.00
11.00
12.50
12.00
11.50
-16.00
-10.00
-12.00
-14.00
13.50
JunMarDecSep
Low: 13.07
Low: 11.06
Hi: 14.70
Hi: 13.21
Hi: -9.40
Low: -16.02
20
15
0
-5
5
10
Bloomberg Barclays US Corporate High Yield Total Return Index Value Unhedged USD
Bloomberg Barclays US Agg Total Return Value Unhedged USD
2016 2017 2018 2019
Franco-Nevada (FNV) and SPDR Gold Shares (GLD) Total Return
Source: Bloomberg Finance, L.P.
1.90
2.00
1.80
1.70
1.50
1.60
2018 2019Jun Sep Dec Mar
Last Price 1.60High on 07/31/18 2.04Average 1.83Low on 03/31/19 1.54
1.60
14
12
8
-2
6
4
0
2
10
Vanguard High Dividend Yield ETFVanguard Real Estate ETFVanguard Utilities ETFVanguard Information Technology ETFEnergy Select Sector SPDR FundVanguard Health Care ETF
2019 Jul 15 Jul 8Jun 28Jun 21Jun 14Jun 7
2019Jul 15 Jul 8Jun 28Jun 21Jun 14Jun 7
2.50
2.00
1.50
0.00
0.50
1.00
SPDR Portfolio Intermediate Team Corporate Bond ETFiShares Preferred & Income Securities ETFVanguard Tax-Exempt Bond Index ETF
1200
1210
1190
1180
1170
20192018Sep Dec Mar Jun
1198.44
1400
1450
1350
1300
1250
1200
1423.91
Last PriceGOLDS Comdty (L1) 1423.91BBDXY Index (R1) 1198.44
2.70
2.80
2.60
2.50
2.40
2.30
20192018Sep Dec Mar Jun
2.28
1400
1450
1350
1300
1250
1200
1423.15
Last PriceGOLDS Comdty (L1) 1423.15US0003M Index (R1) 2.28
50
60
40
30
20
10
0
2018 2019Apr May JunMarFebDec JanOct NovSep Jul
Franco-Nevada Corp
SPDR Gold Shares
20192018
14.50
15.00
14.00
13.00
11.00
12.50
12.00
11.50
-16.00
-10.00
-12.00
-14.00
13.50
JunMarDecSep
Low: 13.07
Low: 11.06
Hi: 14.70
Hi: 13.21
Hi: -9.40
Low: -16.02
20
15
0
-5
5
10
Bloomberg Barclays US Corporate High Yield Total Return Index Value Unhedged USD
Bloomberg Barclays US Agg Total Return Value Unhedged USD
2016 2017 2018 2019
Bloomberg Barclays US Corporate High Yield & US Aggregate Bond Indexes Total Return
Source: Bloomberg Finance, L.P.

Profitable Investing | August 2019 | profitableinvesting.investorplace.com 5
taken a large stake in BTZ and want board seats. If Saba gains seats, I see the potential for a rapid closing of the discount, which would drive prices higher. I think this is a great opportunity to add BTZ to the Total Return Portfolio for further growth and higher income.
Buy BlackRock Credit Allocation Income Trust (BTZ) under $14.00 in the Intermediate Credit Bonds section of the Total Return Portfolio, ideally in a tax-free account.
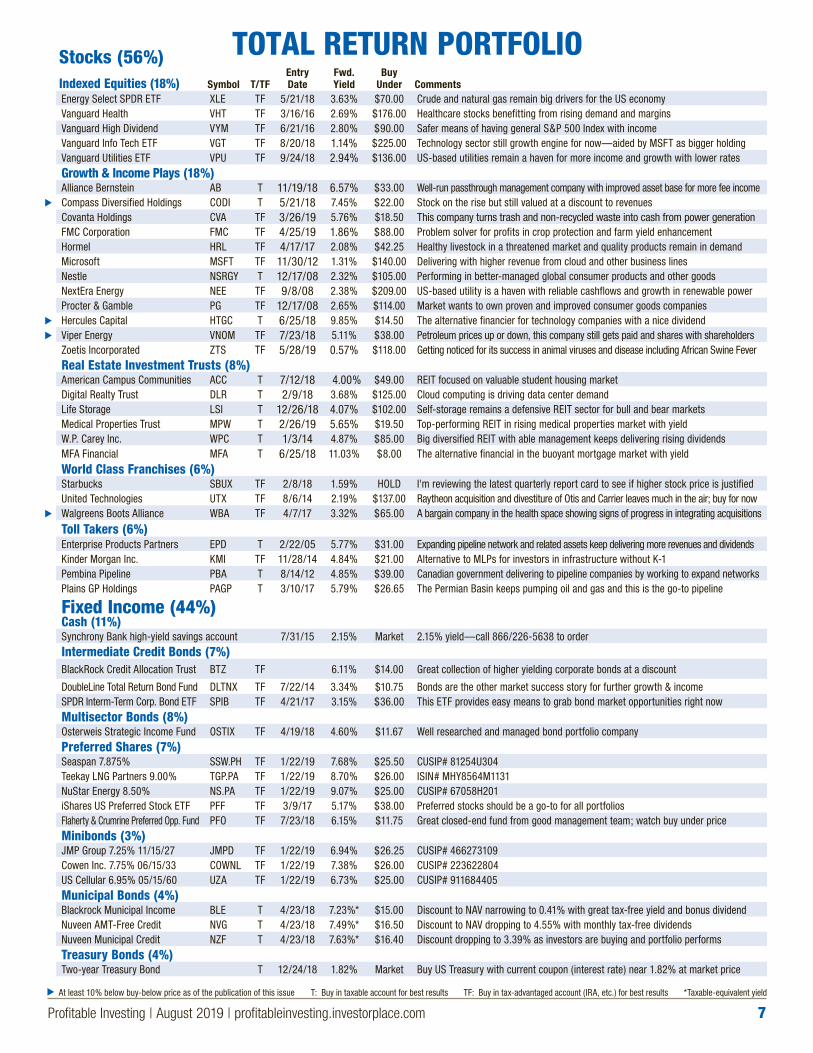
Total Return Portfolio
The Total Return Portfolio continues to fare well this year. Because it’s balanced for opportunities and risk control, I’m maintaining my allocation mix of 56% in stocks and 44% in fixed income, including 11% in cash.
And while it might seem like a good time to lighten up on the cash and move more into the markets, remember that we’re regularly piling up dividends and interest that can be used to buy into the opportunities that are presented to us.
Lower inflation looks like it will be with us for some time, and there’s strong demand to lock up yield when and where it presents itself. This is particularly the case with the bond markets.
Buy BondsBack in my bond trader days, my
Rabbi (the term for a mentor on bond trading desks) Bill Stern always said, “Buy bonds.” And this is exactly what I recommend you do as well. Bonds benefit from improved economic conditions, and if stocks pause, they’re defensive as well.
The underlying economy is driving generally better business revenues, and that is aiding the credit and credibility of corporate borrowers. That, in turn, drives down new borrowing costs, further aiding profitability, and drives down yields for existing issued bonds for higher prices.
In addition, the FOMC is being accommodative and may do more. The ECB, the BOJ and other central banks have driven their interest rates into negative yields. This makes US bonds
even better opportunities for global investors. We already have great bond investments among our holdings, such as the SPDR Intermediate-Term Corporate Bond ETF (SPIB). SPIB remains a buy under $36.00 in a tax-free account.
In addition, we have individual corporate minibonds, which represent good value with high yield. Buy JMP Group 7.25% Series D (JMPD) under a raised price of $26.25 in a tax-free account. The bond-like securities in the preferred stocks segment of the portfolio should also be bought. The Seaspan Corporation 7.875% Series H Preferred (SSW.PH) is a buy under a raised price of $25.50, and the Teekay LNG Partners 9.00% Series A Preferred (TGP.PA) is a buy under a raised price of $26.00, both in tax-free accounts.
The bull market for municipal bonds is also intact. Strong demand for bonds is being met with little new supply due to ample new tax revenues and controlled fiscal policies. Our three municipal bond closed-end funds are still great values, as each still trade at discounts to their underlying bond holdings. Each of them has generated huge double-digit total returns since being added in April 2018. Buy the BlackRock Municipal Income Trust II (BLE) under a raised price of $15.00, the Nuveen AMT-Free Municipal Credit Income Fund (NVG) under a raised price of $16.50 and the Nuveen Municipal Credit Income Fund (NZF) under a raised price of $16.40, all in taxable accounts.
But, as I mentioned previously, one
of the best buys right now is a closed-end fund that I am recommending for the portfolio today. The BlackRock Credit Allocation Income Trust (BTZ) is a $1.5 billion fund that owns a great collection of lower credit rated bonds. It trades at a discount of 9.67% to its NAV, and it’s also generating a yield of 6.11%, which is better than most of its peers.
Also, there’s an activist investor that is seeking board seats, potentially to try and close the discount, which may lead to a near-term windfall. Buy BTZ now under $14.00 in a tax-free account.
Rate-Sensitive StocksBeyond bonds, our interest-rate-
sensitive stocks continue to perform. These include the utilities found in the Vanguard Utilities ETF (VPU) as well as NextEra Energy (NEE), the individual utility with a great mix of regulated power and unregulated wind and solar operations. VPU remains a buy under $136.00, and NEE is a buy under a raised price of $209.00, both in tax-free accounts.
Regarding real estate investment trusts (REITs), lower rates make for lower interest costs, and the bigger tax-advantaged dividends are worth more with lower inflation and lower market yields. I continue to favor my long-term recommendation in W.P. Carey (WPC), as this large, diverse and well-run REIT continues to up its dividend distributions. WPC remains a buy under $85.00 in a taxable account.
Our newer portfolio member with a similar net lease operation, Medical Properties Trust (MPW), has a pure
1.90
2.00
1.80
1.70
1.50
1.60
2018 2019Jun Sep Dec Mar
Last Price 1.60High on 07/31/18 2.04Average 1.83Low on 03/31/19 1.54
1.60
14
12
8
-2
6
4
0
2
10
Vanguard High Dividend Yield ETFVanguard Real Estate ETFVanguard Utilities ETFVanguard Information Technology ETFEnergy Select Sector SPDR FundVanguard Health Care ETF
2019 Jul 15 Jul 8Jun 28Jun 21Jun 14Jun 7
2019Jul 15 Jul 8Jun 28Jun 21Jun 14Jun 7
2.50
2.00
1.50
0.00
0.50
1.00
SPDR Portfolio Intermediate Team Corporate Bond ETFiShares Preferred & Income Securities ETFVanguard Tax-Exempt Bond Index ETF
1200
1210
1190
1180
1170
20192018Sep Dec Mar Jun
1198.44
1400
1450
1350
1300
1250
1200
1423.91
Last PriceGOLDS Comdty (L1) 1423.91BBDXY Index (R1) 1198.44
2.70
2.80
2.60
2.50
2.40
2.30
20192018Sep Dec Mar Jun
2.28
1400
1450
1350
1300
1250
1200
1423.15
Last PriceGOLDS Comdty (L1) 1423.15US0003M Index (R1) 2.28
50
60
40
30
20
10
0
2018 2019Apr May JunMarFebDec JanOct NovSep Jul
Franco-Nevada Corp
SPDR Gold Shares
20192018
14.50
15.00
14.00
13.00
11.00
12.50
12.00
11.50
-16.00
-10.00
-12.00
-14.00
13.50
JunMarDecSep
Low: 13.07
Low: 11.06
Hi: 14.70
Hi: 13.21
Hi: -9.40
Low: -16.02
20
15
0
-5
5
10
Bloomberg Barclays US Corporate High Yield Total Return Index Value Unhedged USD
Bloomberg Barclays US Agg Total Return Value Unhedged USD
2016 2017 2018 2019
BlackRock Credit Allocation Income Trust (BTZ) Stock vs. NAV
Source: Bloomberg Finance, L.P.

6 Profitable Investing | August 2019 | profitableinvesting.investorplace.com
focus on healthcare properties. MPW remains a good buy under $19.50 in a taxable account. And our REIT in the student housing market, American Campus Communities (ACC), continues to deliver yield and gains as well. ACC is a buy under a raised price of $49.00 in a taxable account.
Consumer GoodsThe consumer goods companies
were in dire straits in 2017 and 2018 as consumer tastes caught many big names off guard. I winnowed those that couldn’t prove that they could adapt. And those that did and still do remain buys both for growth and some defense if the general market pauses. Nestlé (NSRGY) is a buy under a raised price of $105.00 in a taxable account, and Procter & Gamble (PG) is a buy under a raised price of $114.00 in a tax-free account.
Indexed & Growth GeneratorsI’m raising the buy under prices for
two of our index ETFs. The general market Vanguard High Dividend Yield ETF (VYM) is now a buy under a raised price of $90.00 in a tax-free account.
And because the driver for general market growth continues to be technology, the Vanguard Information Technology ETF (VGT) is a buy under a raised price of $225.00 in a tax-free account. One of the biggest components of this ETF is Microsoft (MSFT), also in the Total Return Portfolio, which turned in a pretty good quarterly report showing great revenue gains from its cloud and other operations. MSFT is a buy under a raised price of $140.00 for a tax-free account.
Problem Solving Pays OffI love cashing in on companies
that are solving big problems. FMC Corporation (FMC) is an agricultural technology company that is working around the globe to bolster crop yields for a hungry world. And while it faces some near-term setbacks from the last quarter, with a wet spring in the US and warmer weather in Europe, it has a global reach. FMC is a buy under a raised price of $88.00 in a tax-free account.
Also, with African Swine Fever now the world’s biggest agricultural crisis, Zoetis (ZTS) is set to solve it along with other livestock and pet health needs. ZTS is a buy under a raised price of $118.00 in a tax-free account.
Incredible Dividend Machine
The Incredible Dividend Machine continues its strong performance, with dividend payouts coming each and every month from three cycles of dividend-paying stocks.
Last month, I made two changes to the allocations. The first was selling the one US banking stock I had in Cycle A, Northern Trust (NTRS). I also recommended selling Marathon Petroleum (MPC) in Cycle C, as the disappointing refinery company looks good on paper but can’t seem to convince the market.
They were replaced with stocks that were brought up from the Niche Investments—the “farm team” of the Profitable Investing portfolios. In Cycle A, I added EPR Properties (EPR), a great REIT with generous and solid monthly dividend distributions generating a yield of 6.01%. Add that to its impressive 20.48% year-to-date return.
In Cycle C, I brought up Duke Energy (DUK), one of the largest utilities in the US with a dividend distribution yielding 4.31%. That is 34.69% higher than the yield for the general utility market, as measured by the S&P Utilities Index. And its distribution has risen by 3.52% each year on average for the past five years.
Performance, Not Just Dividends
In each of the three cycles, there are stocks that have raised buy-under prices reflecting the improving underlying business performance and recognition by the stock market.
In Cycle A, there’s Cisco Systems (CSCO), which has generated a 35.95% return year to date while paying a dividend of 2.43%. That dividend is up 9.68% over the past 12 months. The company continues
to advance in its switch hardware and software, including subscription recurring income streams. CSCO is a buy under a raised price of $59.00 in a tax-free account.
In Cycle B, pipeline company Magellan Midstream Partners (MMP) has generated a year-to-date return of 20.27%. Its dividend is currently yielding 6.06%, and it has increased 11.47% per year on average for the past five years.
Revenues keep climbing, with demand for its pipes and related assets rising 12.70% from this time last year. And with operating margins running at 42.30%, it has generated a whopping return on shareholder equity of 56.00%. MMP is a buy under a raised price of $68.00 in a taxable account, as it issues K-1 tax forms with much of its distributions shielded from current income tax liability.
And in Cycle C, there’s one of my favorite US bank beaters that I discussed in detail in the June issue, Main Street Capital (MAIN). The stock has generated a return year to date of 27.66%.
This is a business development company (BDC) that specializes in commercial loans to middle-market companies. There was huge opportunity here after the financial meltdown, and MAIN took full advantage as traditional lenders (like banks) weren’t lending.
With great cost controls, it generates an efficiency ratio of 8.20%, which is far better than traditional middle-market commercial banks. And with rising revenues up 13.40% and ample net interest margins, it has a return on assets of 7.00% and a return on equity of 12.00%. Again, that’s better than traditional commercial banks.
It pays its dividend monthly, which has been rising by 3.14% on average over the past five years. What’s more, it regularly pays annual bonus dividends for a composite yield of 6.99%. MAIN is a buy under a raised price of $43.00 in a taxable account, with the added tax benefits BDCs have.
(continued on p. 8)
Profitable Investing | August 2019 | profitableinvesting.investorplace.com 7
TOTAL RETURN PORTFOLIOStocks (56%)Indexed Equities (18%) Symbol T/TF
Entry Date
Fwd. Yield
Buy Under Comments
Energy Select SPDR ETF XLE TF 5/21/18 3.63% $70.00 Crude and natural gas remain big drivers for the US economyVanguard Health VHT TF 3/16/16 2.69% $176.00 Healthcare stocks benefitting from rising demand and marginsVanguard High Dividend VYM TF 6/21/16 2.80% $90.00 Safer means of having general S&P 500 Index with incomeVanguard Info Tech ETF VGT TF 8/20/18 1.14% $225.00 Technology sector still growth engine for now—aided by MSFT as bigger holdingVanguard Utilities ETF VPU TF 9/24/18 2.94% $136.00 US-based utilities remain a haven for more income and growth with lower ratesGrowth & Income Plays (18%)Alliance Bernstein AB T 11/19/18 6.57% $33.00 Well-run passthrough management company with improved asset base for more fee incomeCompass Diversified Holdings CODI T 5/21/18 7.45% $22.00 Stock on the rise but still valued at a discount to revenuesCovanta Holdings CVA TF 3/26/19 5.76% $18.50 This company turns trash and non-recycled waste into cash from power generationFMC Corporation FMC TF 4/25/19 1.86% $88.00 Problem solver for profits in crop protection and farm yield enhancementHormel HRL TF 4/17/17 2.08% $42.25 Healthy livestock in a threatened market and quality products remain in demandMicrosoft MSFT TF 11/30/12 1.31% $140.00 Delivering with higher revenue from cloud and other business linesNestle NSRGY T 12/17/08 2.32% $105.00 Performing in better-managed global consumer products and other goods NextEra Energy NEE TF 9/8/08 2.38% $209.00 US-based utility is a haven with reliable cashflows and growth in renewable power Procter & Gamble PG TF 12/17/08 2.65% $114.00 Market wants to own proven and improved consumer goods companiesHercules Capital HTGC T 6/25/18 9.85% $14.50 The alternative financier for technology companies with a nice dividendViper Energy VNOM TF 7/23/18 5.11% $38.00 Petroleum prices up or down, this company still gets paid and shares with shareholdersZoetis Incorporated ZTS TF 5/28/19 0.57% $118.00 Getting noticed for its success in animal viruses and disease including African Swine FeverReal Estate Investment Trusts (8%)American Campus Communities ACC T 7/12/18 4.00% $49.00 REIT focused on valuable student housing marketDigital Realty Trust DLR T 2/9/18 3.68% $125.00 Cloud computing is driving data center demandLife Storage LSI T 12/26/18 4.07% $102.00 Self-storage remains a defensive REIT sector for bull and bear marketsMedical Properties Trust MPW T 2/26/19 5.65% $19.50 Top-performing REIT in rising medical properties market with yieldW.P. Carey Inc. WPC T 1/3/14 4.87% $85.00 Big diversified REIT with able management keeps delivering rising dividendsMFA Financial MFA T 6/25/18 11.03% $8.00 The alternative financial in the buoyant mortgage market with yieldWorld Class Franchises (6%)Starbucks SBUX TF 2/8/18 1.59% HOLD I'm reviewing the latest quarterly report card to see if higher stock price is justifiedUnited Technologies UTX TF 8/6/14 2.19% $137.00 Raytheon acquisition and divestiture of Otis and Carrier leaves much in the air; buy for nowWalgreens Boots Alliance WBA TF 4/7/17 3.32% $65.00 A bargain company in the health space showing signs of progress in integrating acquisitions
Toll Takers (6%)Enterprise Products Partners EPD T 2/22/05 5.77% $31.00 Expanding pipeline network and related assets keep delivering more revenues and dividendsKinder Morgan Inc. KMI TF 11/28/14 4.84% $21.00 Alternative to MLPs for investors in infrastructure without K-1Pembina Pipeline PBA T 8/14/12 4.85% $39.00 Canadian government delivering to pipeline companies by working to expand networksPlains GP Holdings PAGP T 3/10/17 5.79% $26.65 The Permian Basin keeps pumping oil and gas and this is the go-to pipeline
Fixed Income (44%)Cash (11%)Synchrony Bank high-yield savings account 7/31/15 2.15% Market 2.15% yield—call 866/226-5638 to orderIntermediate Credit Bonds (7%)BlackRock Credit Allocation Trust BTZ TF 6.11% $14.00 Great collection of higher yielding corporate bonds at a discount
DoubleLine Total Return Bond Fund DLTNX TF 7/22/14 3.34% $10.75 Bonds are the other market success story for further growth & incomeSPDR Interm-Term Corp. Bond ETF SPIB TF 4/21/17 3.15% $36.00 This ETF provides easy means to grab bond market opportunities right nowMultisector Bonds (8%)Osterweis Strategic Income Fund OSTIX TF 4/19/18 4.60% $11.67 Well researched and managed bond portfolio companyPreferred Shares (7%)Seaspan 7.875% SSW.PH TF 1/22/19 7.68% $25.50 CUSIP# 81254U304Teekay LNG Partners 9.00% TGP.PA TF 1/22/19 8.70% $26.00 ISIN# MHY8564M1131NuStar Energy 8.50% NS.PA TF 1/22/19 9.07% $25.00 CUSIP# 67058H201iShares US Preferred Stock ETF PFF TF 3/9/17 5.17% $38.00 Preferred stocks should be a go-to for all portfoliosFlaherty & Crumrine Preferred Opp. Fund PFO TF 7/23/18 6.15% $11.75 Great closed-end fund from good management team; watch buy under priceMinibonds (3%)JMP Group 7.25% 11/15/27 JMPD TF 1/22/19 6.94% $26.25 CUSIP# 466273109 Cowen Inc. 7.75% 06/15/33 COWNL TF 1/22/19 7.38% $26.00 CUSIP# 223622804US Cellular 6.95% 05/15/60 UZA TF 1/22/19 6.73% $25.00 CUSIP# 911684405Municipal Bonds (4%)Blackrock Municipal Income BLE T 4/23/18 7.23%* $15.00 Discount to NAV narrowing to 0.41% with great tax-free yield and bonus dividendNuveen AMT-Free Credit NVG T 4/23/18 7.49%* $16.50 Discount to NAV dropping to 4.55% with monthly tax-free dividendsNuveen Municipal Credit NZF T 4/23/18 7.63%* $16.40 Discount dropping to 3.39% as investors are buying and portfolio performsTreasury Bonds (4%)Two-year Treasury Bond T 12/24/18 1.82% Market Buy US Treasury with current coupon (interest rate) near 1.82% at market price
At least 10% below buy-below price as of the publication of this issue T: Buy in taxable account for best results TF: Buy in tax-advantaged account (IRA, etc.) for best results *Taxable-equivalent yield

8 Profitable Investing | August 2019 | profitableinvesting.investorplace.com
Model Mutual Fund Portfolios
The Model Mutual Fund Portfolios are weighted to the best sectors of the US markets, with stocks in specific sectors that are geared to provide growth and income over time. And they’re structured to follow the general themes of the Total Return Portfolio. As such, the stock fund allocation is set at 56%.
This philosophy continues for the fixed income sectors, which are focused on corporate bonds, preferred stock and the buoyant municipal bond markets. The fixed income allocation is set at 44%, including an 11% allocation to cash. Like the stock allocation, the individual fixed income funds should be weighted evenly.
Also, note that the municipal bond funds can be bought in tax-free accounts. Some brokerages give warnings about this, but there are no restrictions to doing this. Even though you will give up some of the tax-free income advantage, the total return prospects for this market remain compelling.
Stock AllocationsMy stock allocations are largely
tracking my big themes. They include a dividend-focus on the S&P 500 Index, REITs, utilities, technology, energy and healthcare.
These sectors have had a great year so far and, as you can see in the charts to the right, the total returns year to date would be impressive for an entire year. As the US economy continues to perform, with low inflation and lower interest rates, the general stock allocation should do well for the months to follow.
Fixed Income AllocationsThe fixed income allocations have
specific sector funds for corporate bonds, preferred stocks and municipal bonds, with the exception of the T. Rowe Price Family Portfolio. And again, for the year to date, the market allocations to these market segments have done well. With low inflation and lower interest rates, fixed income is also positioned well for the months to follow.
All-in-the-Family Fund PortfoliosI’m reviewing all of the open-end
funds and comparing their performance
and prospects to competing indexed ETFs and closed-end funds. I’ve found advantages in some open-end funds, but they are not overwhelming. And given some of the costs of open-end funds, including higher commissions, and many subscriber comments about them, I’m reviewing the portfolios to determine the best approach for each of the model mutual fund portfolios.
For the Fidelity family of funds (as with others), it’s cheaper to buy its open-end funds directly. In the stock allocations, there are two underperforming funds since May compared to the indexed ETFs, including Select Software & IT Services (FSCSX) and Select Energy (FSENX).
Meanwhile, Fidelity scored with Real Estate Investment (FRESX) and Select Health Care (FSPHX).
In the fixed income allocation, Fidelity High Income Fund (SPHIX) was marginally better from the end
of May to date, while Principal Preferred (PRFCX) and Intermediate Municipal Income Fund (FLTMX) were on par with the ETFs.
No changes in allocations are needed at this time.
For T. Rowe Price, the allocations are limited due to the sector offerings by the fund company. The fund collection has been generally underperforming the S&P 500 Index since the end of May, and this continues through to its Real Estate Fund (TRREX). But the Science & Technology Fund (PRSCX) was a better performer than the indexed ETF by a small margin.
For the fixed income allocation, there is just one fund, Spectrum Income (RPSIX), which since the end of May to date has turned in a reasonable return of 2.61%.
For now, there are no changes in allocations.
1.90
2.00
1.80
1.70
1.50
1.60
2018 2019Jun Sep Dec Mar
Last Price 1.60High on 07/31/18 2.04Average 1.83Low on 03/31/19 1.54
1.60
14
12
8
-2
6
4
0
2
10
Vanguard High Dividend Yield ETFVanguard Real Estate ETFVanguard Utilities ETFVanguard Information Technology ETFEnergy Select Sector SPDR FundVanguard Health Care ETF
2019 Jul 15 Jul 8Jun 28Jun 21Jun 14Jun 7
2019Jul 15 Jul 8Jun 28Jun 21Jun 14Jun 7
2.50
2.00
1.50
0.00
0.50
1.00
SPDR Portfolio Intermediate Team Corporate Bond ETFiShares Preferred & Income Securities ETFVanguard Tax-Exempt Bond Index ETF
1200
1210
1190
1180
1170
20192018Sep Dec Mar Jun
1198.44
1400
1450
1350
1300
1250
1200
1423.91
Last PriceGOLDS Comdty (L1) 1423.91BBDXY Index (R1) 1198.44
2.70
2.80
2.60
2.50
2.40
2.30
20192018Sep Dec Mar Jun
2.28
1400
1450
1350
1300
1250
1200
1423.15
Last PriceGOLDS Comdty (L1) 1423.15US0003M Index (R1) 2.28
50
60
40
30
20
10
0
2018 2019Apr May JunMarFebDec JanOct NovSep Jul
Franco-Nevada Corp
SPDR Gold Shares
20192018
14.50
15.00
14.00
13.00
11.00
12.50
12.00
11.50
-16.00
-10.00
-12.00
-14.00
13.50
JunMarDecSep
Low: 13.07
Low: 11.06
Hi: 14.70
Hi: 13.21
Hi: -9.40
Low: -16.02
20
15
0
-5
5
10
Bloomberg Barclays US Corporate High Yield Total Return Index Value Unhedged USD
Bloomberg Barclays US Agg Total Return Value Unhedged USD
2016 2017 2018 2019
Stock Sector Performance June to Date Using Sector Index ETFs
Source: Bloomberg Finance, L.P.
1.90
2.00
1.80
1.70
1.50
1.60
2018 2019Jun Sep Dec Mar
Last Price 1.60High on 07/31/18 2.04Average 1.83Low on 03/31/19 1.54
1.60
14
12
8
-2
6
4
0
2
10
Vanguard High Dividend Yield ETFVanguard Real Estate ETFVanguard Utilities ETFVanguard Information Technology ETFEnergy Select Sector SPDR FundVanguard Health Care ETF
2019 Jul 15 Jul 8Jun 28Jun 21Jun 14Jun 7
2019Jul 15 Jul 8Jun 28Jun 21Jun 14Jun 7
2.50
2.00
1.50
0.00
0.50
1.00
SPDR Portfolio Intermediate Team Corporate Bond ETFiShares Preferred & Income Securities ETFVanguard Tax-Exempt Bond Index ETF
1200
1210
1190
1180
1170
20192018Sep Dec Mar Jun
1198.44
1400
1450
1350
1300
1250
1200
1423.91
Last PriceGOLDS Comdty (L1) 1423.91BBDXY Index (R1) 1198.44
2.70
2.80
2.60
2.50
2.40
2.30
20192018Sep Dec Mar Jun
2.28
1400
1450
1350
1300
1250
1200
1423.15
Last PriceGOLDS Comdty (L1) 1423.15US0003M Index (R1) 2.28
50
60
40
30
20
10
0
2018 2019Apr May JunMarFebDec JanOct NovSep Jul
Franco-Nevada Corp
SPDR Gold Shares
20192018
14.50
15.00
14.00
13.00
11.00
12.50
12.00
11.50
-16.00
-10.00
-12.00
-14.00
13.50
JunMarDecSep
Low: 13.07
Low: 11.06
Hi: 14.70
Hi: 13.21
Hi: -9.40
Low: -16.02
20
15
0
-5
5
10
Bloomberg Barclays US Corporate High Yield Total Return Index Value Unhedged USD
Bloomberg Barclays US Agg Total Return Value Unhedged USD
2016 2017 2018 2019
Fixed Income Sector Performance June to Date Using Sector Index ETFs
Source: Bloomberg Finance, L.P.

Profitable Investing | August 2019 | profitableinvesting.investorplace.com 9
In the Vanguard portfolio, the stock allocations are largely in the successful indexed ETFs, as showcased earlier. The open-end Energy Fund (VGENX) dramatically underperformed the indexed SPDR ETF for June and into July. The Health Care Fund (VGHCX) was in line with the Vanguard Health ETF for the period.
In the fixed income allocations, there are two indexed ETFs for preferreds and municipal bonds. And for the corporate bonds, the Intermediate-Term Investment Grade Fund (VFICX) was in line with the SPDR Intermediate-Term Corporate Bond ETF (SPIB) for the period.
There are no changes in allocations.
Fund Supermarket PortfolioThe Fund Supermarket Portfolio has
a mixed collection of indexed ETFs and open-end funds from Fidelity, Vanguard and Osterweis. The performances are largely in line with their indexed counterparts in the ETFs offered by Vanguard and BlackRock, for both the stock and fixed income allocations.
The one open-end fund in the fixed income allocation that has been a good performer from June through July and for the year to date has been the Osterweis Strategic Income Fund (OSTIX). But it is lagging some alternatives, including my new addition in the Total Return Portfolio—the BlackRock Credit Allocation Income Trust (BTZ) closed-end fund.BTZ offers more yield and a better performance track record, and you can buy it through any broker for a low commission. It’s also priced at a discount to its NAV.
Hassle-Free ETF PortfolioAs the name of the portfolio implies,
it’s a simple but great collection of indexed ETFs from BlackRock, State Street and Vanguard. I like this portfolio for fund investors because it’s easy to assemble, even for less-capitalized investors. And since it relies on ETFs, the commission costs are minimal, as are the ongoing expenses. This is the go-to portfolio for smaller portfolios and for younger investors just entering the markets.
There are no allocation changes at this time.
The Ten-Minute Retirement Portfolio
The Ten-Minute Retirement Portfolio is very similar to the Hassle-Free ETF Portfolio. It focuses primarily on indexed ETFs that follow the general themes of the Total Return Portfolio for the best in stocks and fixed income.
Like the Fund Supermarket, it has the open-end Osterweis bond fund, which—unless you deal directly with Osterweis—can mean an additional commission cost depending on your bank or broker. I’m reviewing the alternatives.
On the positive front, this portfolio has one additional allocation in the midstream energy sector—the pipeline toll-taker firms—with the Goldman Sachs MLP Income Opportunities Fund (GMZ). This closed-end fund is priced at a discount of 6.86% to its actual value and pays a generous dividend yield of around 10.69%. It also has an impressive year-to-date total return of 18.59% and tracks well with the Alerian MLP Index.
Niche InvestmentsThis month, I’m continuing to
address each of the holdings inside the Niche Investments portfolio. This portfolio is a collection of stocks, bonds and funds that are my “farm team” for the Total Return Portfolio and the Incredible Dividend Machine portfolio. The Niche portfolio allows us to test drive new investments to see if they can earn their way to the main portfolios.
Think of these holdings as nibblers. Don’t go all in, just get a taste. This will bring you into each of the holdings as they are appropriate for your own portfolio without as much risk, since they may not make the grade and get to the big leagues.
Two of the Niche holdings were called up to the Incredible Dividend Machine last month—EPR Properties (EPR), which is now in Cycle A, and Duke Energy (DUK), which is now in Cycle C. I also brought up the 2-Year US Treasury into the Total Return Portfolio late last year for a cash alternative, which has worked to lock
in shorter-term yields during the recent fall in interest rates.
To make this work, I also have to be brutal when it comes to making a buy or sell call, as I don’t want the Niche holdings to just gather dust. If they’re good, I’ll move them up. If they’re just biding their time, they’ll get the heave-ho. And with a more curated collection, I’m working to bring the portfolio into each issue for easier following.
What’s StayingIn the Niche Investments, I’m main-
taining my buy ratings on Alliant Energy (LNT), BlackRock (BLK), Corporate Office Trust (OFC), Energy Transfer LP (ET), Ericsson (ERIC), Eversource Energy (ES), Franco-Nevada (FNV), Healthcare Trust of America (HTA), Office Properties Income Trust (OPI), Samsung Electronics (SSNLF), Waste Management (WM), Xcel Energy (XEL) and the Alerian MLP ETF (AMLP).
These include good utility stocks, pipelines, REITs, communications equipment and technology and trash. And, of course, my one gold recommendation in FNV that I discussed earlier.
What’s GoingIn the stocks segment, UDR Inc.
(UDR) is a sell. It has an unacceptable value at 4.40 times book and, while its funds from operations (FFO) are good, the return on its assets is abysmal. With a dividend yielding only 3.30%, it’s not paying us enough. And its revenues, even in this good market, are only up a meager 5.10%.
In the mutual funds segment, I’m exiting three open-end funds, including Merger Fund (MERFX), Northern Income Equity (NOIEX) and PRIMECAP Odyssey Growth Fund (POGRX). All three are under-performing the general stock market. And with so many other opportunities, even their reputations from the past don’t justify buying them again right now. Sell and move on.
In the closed-end funds, sell the Cohen & Steers Limited Duration Preferred and Income Fund (LDP). This is a fine preferred fund, but it’s not as dependable as the Flaherty &
10 Profitable Investing | August 2019 | profitableinvesting.investorplace.com
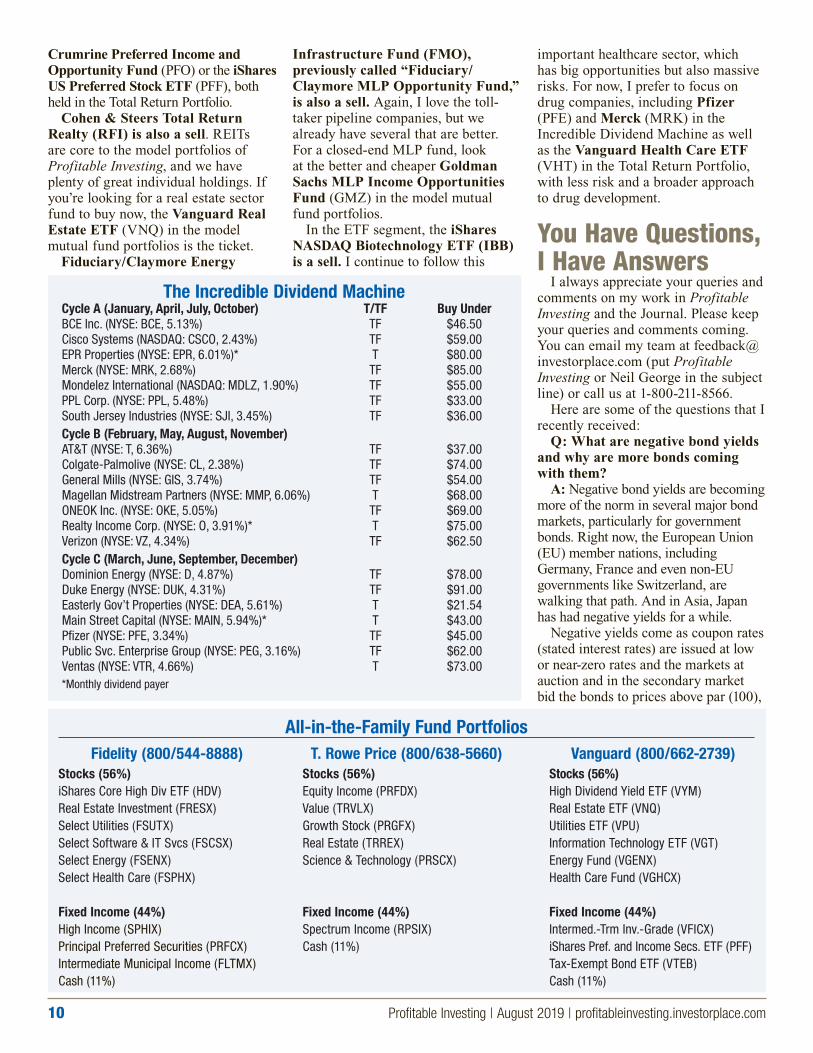
Crumrine Preferred Income and Opportunity Fund (PFO) or the iShares US Preferred Stock ETF (PFF), both held in the Total Return Portfolio.
Cohen & Steers Total Return Realty (RFI) is also a sell. REITs are core to the model portfolios of Profitable Investing, and we have plenty of great individual holdings. If you’re looking for a real estate sector fund to buy now, the Vanguard Real Estate ETF (VNQ) in the model mutual fund portfolios is the ticket.
Fiduciary/Claymore Energy
Infrastructure Fund (FMO), previously called “Fiduciary/Claymore MLP Opportunity Fund,” is also a sell. Again, I love the toll-taker pipeline companies, but we already have several that are better. For a closed-end MLP fund, look at the better and cheaper Goldman Sachs MLP Income Opportunities Fund (GMZ) in the model mutual fund portfolios.
In the ETF segment, the iShares NASDAQ Biotechnology ETF (IBB) is a sell. I continue to follow this
important healthcare sector, which has big opportunities but also massive risks. For now, I prefer to focus on drug companies, including Pfizer (PFE) and Merck (MRK) in the Incredible Dividend Machine as well as the Vanguard Health Care ETF (VHT) in the Total Return Portfolio, with less risk and a broader approach to drug development.
You Have Questions, I Have Answers
I always appreciate your queries and comments on my work in Profitable Investing and the Journal. Please keep your queries and comments coming. You can email my team at feedback@ investorplace.com (put Profitable Investing or Neil George in the subject line) or call us at 1-800-211-8566.
Here are some of the questions that I recently received:
Q: What are negative bond yields and why are more bonds coming with them?
A: Negative bond yields are becoming more of the norm in several major bond markets, particularly for government bonds. Right now, the European Union (EU) member nations, including Germany, France and even non-EU governments like Switzerland, are walking that path. And in Asia, Japan has had negative yields for a while.
Negative yields come as coupon rates (stated interest rates) are issued at low or near-zero rates and the markets at auction and in the secondary market bid the bonds to prices above par (100),
Fidelity (800/544-8888) T. Rowe Price (800/638-5660) Vanguard (800/662-2739)Stocks (56%) Stocks (56%) Stocks (56%)iShares Core High Div ETF (HDV) Equity Income (PRFDX) High Dividend Yield ETF (VYM)Real Estate Investment (FRESX) Value (TRVLX) Real Estate ETF (VNQ)Select Utilities (FSUTX) Growth Stock (PRGFX) Utilities ETF (VPU)Select Software & IT Svcs (FSCSX) Real Estate (TRREX) Information Technology ETF (VGT)Select Energy (FSENX) Science & Technology (PRSCX) Energy Fund (VGENX)Select Health Care (FSPHX) Health Care Fund (VGHCX)
Fixed Income (44%) Fixed Income (44%) Fixed Income (44%)High Income (SPHIX) Spectrum Income (RPSIX) Intermed.-Trm Inv.-Grade (VFICX)Principal Preferred Securities (PRFCX) Cash (11%) iShares Pref. and Income Secs. ETF (PFF)Intermediate Municipal Income (FLTMX) Tax-Exempt Bond ETF (VTEB)Cash (11%) Cash (11%)
All-in-the-Family Fund Portfolios
The Incredible Dividend MachineCycle A (January, April, July, October) T/TF Buy UnderBCE Inc. (NYSE: BCE, 5.13%) TF $46.50 Cisco Systems (NASDAQ: CSCO, 2.43%) TF $59.00 EPR Properties (NYSE: EPR, 6.01%)* T $80.00 Merck (NYSE: MRK, 2.68%) TF $85.00 Mondelez International (NASDAQ: MDLZ, 1.90%) TF $55.00 PPL Corp. (NYSE: PPL, 5.48%) TF $33.00 South Jersey Industries (NYSE: SJI, 3.45%) TF $36.00 Cycle B (February, May, August, November)AT&T (NYSE: T, 6.36%) TF $37.00 Colgate-Palmolive (NYSE: CL, 2.38%) TF $74.00 General Mills (NYSE: GIS, 3.74%) TF $54.00 Magellan Midstream Partners (NYSE: MMP, 6.06%) T $68.00 ONEOK Inc. (NYSE: OKE, 5.05%) TF $69.00 Realty Income Corp. (NYSE: O, 3.91%)* T $75.00 Verizon (NYSE: VZ, 4.34%) TF $62.50 Cycle C (March, June, September, December)Dominion Energy (NYSE: D, 4.87%) TF $78.00 Duke Energy (NYSE: DUK, 4.31%) TF $91.00 Easterly Gov’t Properties (NYSE: DEA, 5.61%) T $21.54 Main Street Capital (NYSE: MAIN, 5.94%)* T $43.00 Pfizer (NYSE: PFE, 3.34%) TF $45.00 Public Svc. Enterprise Group (NYSE: PEG, 3.16%) TF $62.00 Ventas (NYSE: VTR, 4.66%) T $73.00 *Monthly dividend payer

Profitable Investing | August 2019 | profitableinvesting.investorplace.com 11
which brings the yields below zero. Take, for example, a German Bund
(government bond) with a coupon of 0.50% and a maturity of 02/15/25. It is trading in the market for 106.75, which means that for each bund you’ll pay EUR 1,067.50 along with EUR 2.19 in accrued interest, for an effective yield to maturity of -0.69%. Because that bund will mature at 100 or EUR 1,000.00, it prices in a loss of EUR 67.50, which offsets the coupon and leads to the negative return.
The reason for negative yields is that inflation becomes low or non-existent. Even bank deposits can go negative, meaning that investors will pay to park cash. This is also driving corporate bonds and even low-credit-rated bonds into negative yields.
And with the ECB offering negative interest rate loans, it only exacerbates this market condition in the hope of stimulating the economy and inflation. That’s because negative rates motivate companies to put their money to work, rather than save it.
Q: Is the raising of the US federal debt ceiling and the rise in deficit spending a threat to the US economy?
A: This is an age-old threat, but it has not manifested itself in any meaningful way in the modern economy. While deficit spending and debt are generally not good, they can be necessary during times of economic strife, national emergencies or even major infrastructure projects.
The key is the credit markets and
the threat of government borrowing crowding out corporations and individuals from being able to borrow. But with the massive economy of the US and the ever-expanding market demand for bonds and credit securities, this has not even remotely been a threat.
In addition, global demand for US Treasuries and other US bonds remains robust, as the US dollar is still the primary financial and commercial currency of the globe. The world’s second-largest economy, China, doesn’t have a full-market currency in the renminbi (CNY), and the euro (EUR) doesn’t have enough supply of top-tier bonds, such as German Bunds, to make the euro a competitor to the US dollar.
There may come a time when the US dollar is challenged and the US Treasury and credit markets become constrained. And yields will rise in this scenario. But for the foreseeable future, none of this is a major concern.
Q: Open-end mutual funds can be more costly in their commissions. Are you looking at alternatives in
the model mutual fund portfolios and the Total Return Portfolio?
A: Yes. I continue to hear from subscribers about this issue. Stock, ETF and closed-end fund commissions run around $7.00, but open-end mutual fund commissions can get close to $50.00. This is another reason that I’m focusing more on closed-end funds and ETFs. Also, remember that open-end commissions can be cut by dealing with fund companies directly.
One Final ThoughtLow Inflation, Lower Interest Rates—Focus on What’s Working
The US economy is providing a great backdrop for many of our core investment holdings. Inflation is not only low, but it continues to fall. This takes out the threat of inflation eroding future profits, and it’s providing the potential for the easing of interest rates by the Fed.
Fund Supermarket Portfolio
Stocks (56%) Vanguard High Dividend Yield ETF (VYM)Vanguard Real Estate ETF (VNQ) Fidelity Select Utilities Portfolio (FSUTX) Vanguard Health Care Fund (VGHCX)Vanguard Energy Fund (VGENX)Fidelity Select Software & IT Services Portfolio Fund (FSCSX)
Fixed Income (44%)Osterweis Strategic Income Fund (OSTIX)iShares Preferred and Income Securities ETF (PFF)Fidelity Intermediate Municipal Income Fund (FLTMX)Cash (11%)
Hassle-Free ETF PortfolioStocks (56%) SPDR S&P 500 ETF Trust (NYSE: SPY) Vanguard Real Estate (NYSE: VNQ) Vanguard Utilities ETF (NYSE: VPU) Vanguard Information Technology ETF (NYSE: VGT) Energy Select Sector SPDR ETF (NYSE: XLE) Vanguard Health Care ETF (NYSE: VHT)
Fixed Income (44%)SPDR Bloomberg Barclays Intermediate-Term Corporate Bond ETF (NYSE: SPIB) iShares Preferred and Income Securities ETF (NASDAQ: PFF) SPDR Nuveen Bloomberg Barclays Municipal Bond ETF (NYSE: TFI) Cash (11%)
The Ten-Minute Retirement PortfolioStocks (56%) SPDR S&P 500 ETF Trust (NYSE: SPY) Vanguard Real Estate (NYSE: VNQ) Vanguard Utilities ETF (NYSE: VPU) Vanguard Information Technology ETF (NYSE: VGT) Energy Select Sector SPDR ETF (NYSE: XLE) Vanguard Health Care ETF (NYSE: VHT) Goldman Sachs MLP Income Opportunities Fund (NYSE: GMZ)
Fixed Income (44%) Osterweis Strategic Income Fund (OSTIX, $5,000) iShares Preferred and Income Securities ETF (NASDAQ: PFF)SPDR Nuveen Bloomberg Barclays Municipal Bond ETF (NYSE: TFI)Cash (11%)

But the market is already pricing all that in. Yields are down in US Treasuries and, more importantly for us, in municipal bonds and corporate bonds. Outside of the US, yields have actually gone negative again.
This means two things: First, inflation is non-existent in the primary global economies, and central banks are trying to drive interest costs down to stimulate their respective economies. Second, investors want bonds that pay them something, rather than having to pay to own them.
The US is experiencing growth in consumer and business activities. And yields are still positive—making the US market the best place to own income-generating stocks and, of course, bonds and related securities. This makes the US market a prime destination for global investors.
What to BuyFor us, that means owning income stocks that are benefitting from lower
yields, including utilities such as NextEra Energy (NEE) under $209.00. Continue to buy our REITs, including W.P. Carey (WPC) under $85.00 and Medical Properties Trust (MPW) under $19.50.
For our bonds, yields are going down and prices are going up. Start with our new corporate bond fund addition, the BlackRock Credit Allocation Income Trust (BTZ) under $14.00, with its great collection of credit-analyzed corporate bonds paying a great yield at a big discount.
SPDR Intermediate-Term Corporate Bond ETF (SPIB) is also a good buy under $36.00.
Some of our municipal bond funds are still trading at discounts, and they’re good choices for high taxable-equivalent yields and further gains. Buy the BlackRock Municipal Income Trust II (BLE) under $15.00, Nuveen AMT-Free Credit Income Fund (NVG) under $16.50 and Nuveen Municipal Credit Income Fund (NZF) under $16.40.
As for gold, Franco-Nevada Corporation (FNV) is benefitting as gold gains on lower interest rates around the globe. FNV is a buy in the Niche Investments portfolio under $91.00, ideally in a taxable account.
What to Sell or HoldRemember, this isn’t a market for all sectors. Therefore, I’m continuing to
whittle down the holdings in the Niche Investments portfolio. In the Mutual Funds segment, sell the following three generic US stock
funds, which aren’t keeping pace with the progress of the broad market—Merger Fund (MERFX), Northern Income Equity (NOIEX) and PRIMECAP Odyssey Growth Fund (POGRX).
In the Closed-End Funds segment, sell Cohen & Steers Limited Duration Preferred and Income Fund (LDP), Cohen & Steers Total Return Realty Fund (RFI) and Fiduciary/Claymore Energy Infrastructure Fund (FMO), previously called “Fiduciary/Claymore MLP Opportunity Fund.”
In the Exchange-Traded Index Funds segment, sell the iShares NASDAQ Biotechnology ETF (IBB).
In the Stocks segment, sell UDR Inc. (UDR). While REITs are great, UDR is way too expensive and not paying enough.
Last up, Starbucks (SBUX) will remain on hold for a while longer as I review the second-quarter report. The stock has delivered a 70.76% return for us, but the company doesn’t appear to be justifying it. Stay tuned for my final call on this position.
Given the current market conditions both here in the US and around the world, continue to focus on the beneficiaries of lower interest rate and those that are delivering genuine growth for safer income and growth going forward.
All My Best,
Neil George
NEIL GEORGE began his financial services career in 1987 with Merrill Lynch International Bank in Vienna, Austria and subsequently held senior positions at what are now US Bank and globally-based Investec PLC. Neil’s long
career has included stints as a bond trader and the manager of a fixed-income fund worth over $1 billion. An income hunter at heart, he’s also the former editor of several successful investment advisories dedicated to finding Wall Street’s best yields. Neil earned an MBA in international finance from Webster University in Europe and a bachelor’s degree in economics from King’s College. His market commentary and insights have been featured in the Wall Street Journal, Barron’s, Bloomberg, CNN and NBC.
Actions to Take This Month
1. In the Total Return Portfolio:• Buy BTZ under $14.00 (TF)• Buy SPIB under $36.00 (TF)• Buy JMPD under $26.25 (TF)• Buy SSW.PH under $25.50 (TF)• Buy TGP.PA under $26.00 (TF)• Buy BLE under $15.00 (T)• Buy NVG under $16.50 (T)• Buy NZF under $16.40 (T)• Buy VPU under $136.00 (TF)• Buy NEE under $209.00 (TF)• Buy WPC under $85.00 (T)• Buy MPW under $19.50 (T)• Buy ACC under $49.00 (T)• Buy NSRGY under $105.00 (T)• Buy PG under $114.00 (TF)• Buy VYM under $90.00 (TF)• Buy VGT under $225.00 (TF)• Buy MSFT under $140.00 (TF)• Buy FMC under $88.00 (TF)• Hold SBUX (TF)
2. In the Incredible Dividend Machine:• Buy CSCO under $59.00 (TF)• Buy MMP under $68.00 (T)• Buy MAIN under $43.00 (T)
3. In the Niche Investments:• Buy FNV under $91.00 (T)• Sell UDR• Sell MERFX• Sell NOIEX• Sell POGRX• Sell LDP• Sell RFI• Sell FMO• Sell IBB
4. Check the updated buy under prices for the Total Return Portfolio on p. 7, the Incredible Dividend Machine on p. 10 and the Niche Investments on p. 9.
SUMMARY